
Abstract
Ultrasound (US) enhanced with microbubble contrast agents may transiently disrupt the blood–brain barrier (BBB) with minimal damage, providing a technique for noninvasive, localized drug-delivery deep within the brain. The mechanism and temporal profile of disruption are not understood, owing to the limitations of imaging modalities used previously. In this study, we monitored US-induced BBB disruption with multiphoton microscopy, providing high-resolution temporal and spatial information about the permeabilization mechanism and immediate effects of US exposure. Anesthetized C57 mice were prepared with a craniotomy and injected intravenously with fluorescent dyes to permit visualization of the vasculature and BBB integrity. The animals were imaged through a cranial window while exposed to low-intensity US (f =1.029 MHz, power = 0.2 W) with a coincident intravenous injection of Optison (a microbubble contrast agent). We observed arteriolar vasoconstriction on US exposure that disrupted blood flow and lasted up to 5 mins; BBB disruption occurred via two characteristically distinct processes—perivascular fluorescence gradually increased (over minutes) along the length of the affected vessel without apparent rupture of the vessel wall or rapidly (seconds) increased in select, focal regions. These data corroborated previous studies suggesting increased endothelial transcytosis and breached tight junctions and demonstrated vasoconstriction, which might alter BBB permeability by modifying cerebral blood flow.
Introduction
Focused ultrasound (US) may be used for various therapeutic vascular effects owing to the development of microbubble contrast agents—gas-filled, protein, or lipid-coated bubbles, 1 to 10 μm in diameter. Microbubble contrast agents are introduced intravenously and become active when encountering an US beam. Depending on the parameters, acoustic energy causes microbubble oscillation, growth, aggregation, or collapse (Dayton et al, 1999; Allen et al, 2002; May et al, 2002), producing mechanical forces on vessel walls proximate to the bubbles (Krasovitski and Kimmel, 2004; Hwang et al, 2005). Lipid-coated microbubbles may be loaded with diagnostic or therapeutic agents that are released upon sonication (Unger et al, 1998). In this way, focused US with microbubbles can produce mechanical damage (Skyba et al, 1998; Miller and Quddus, 2000; Tran et al, 2003) or deliver drugs (Shortencarier et al, 2004) in a localized region, deep in tissue. Because the microbubbles are confined to the blood stream until clearance by the lungs and kidneys, most treatment effects are seen in the vasculature; researchers have used US/microbubble contrast agent treatment for gene delivery to the endothelium (Taniyama et al, 2002; Huber et al, 2003), thrombolysis (Tachibana and Tachibana, 1995), and platelet aggregation (Shigeta et al, 2004). These dramatic effects occur at relatively low-power amplitudes with little heating of peripheral tissues.
In the cerebral vasculature, low-power US/microbubble contrast agent treatment can cause a transient breakdown of the Blood–brain barrier (BBB) (Hynynen et al, 2001). US/microbubble BBB disruption can be reproduced at low frequencies favorable for transcranial transmission (Hynynen et al, 2005) and with few long-term histologic effects (McDannold et al, 2005). Ultrastructural studies have demonstrated breakdown of tight junctions and increased vesicles on both the luminal and abluminal surfaces of the endothelium, suggesting increased transcytosis (Sheikov et al, 2004). If carefully controlled, US-mediated BBB opening could serve as a method for noninvasive, targeted, focal drug delivery to inoperable regions of the brain (Treat et al, 2004).
Previous BBB disruption studies focused on effects that were observable histologically or by magnetic resonance imaging (Hynynen et al, 2001; McDannold et al, 2004). There is, however, a spatial and temporal gap in our understanding—little is known about transient processes that occur on short time scales (< 1 mins) at the microscopic level owing to the scan times necessary for high-resolution MRI.
The purpose of these experiments was to optically observe US/microbubble-mediated vascular effects in the murine brain in real time, with emphasis on understanding effects on a fast time scale (seconds). We wanted to observe the kinetics of dye leakage, namely, the delay between sonication and dye extravasation, the rate of dye leakage, and the microscopic distribution of dye leakage. We hypothesized that different leakage mechanisms (tight junction disruption versus increased transcytosis) would be kinetically distinct.
We used the microbubble contrast agent Optison (GE Healthcare, Chalfont, St Giles, UK), a suspension of albumin-coated, perflutren (C3F8) microbubbles in 10 mg/mL human serum albumin. Owing to its relatively low acoustic impedance, Optison scatters well and is clinically designed for use in adult echocardiography. For relatively fast, high-resolution imaging, we used multiphoton fluorescence microscopy through a cranial window, which provides penetration into the cortex down to 500 μm (Svoboda et al, 1997) as well as broad-band excitation of multiple fluorophores. In the past, light microscopy has been useful for understanding transient effects of US (Skyba et al, 1998; Maruvada and Hynynen, 2004) and has been used to study the in vivo passage of dyes across the BBB (Bacskai et al, 2003), making it a viable technique for our study.
Materials and Methods
Experimental Setup
We designed an experimental setup that allowed coupling of US energy through the ventral surface of the mouse while imaging through a cranial window. In brief, the US transducer was held below the microscope stage in a degassed water reservoir; mice were secured on the microscope stage in a stereotaxic frame, modified with an acoustically transparent water compartment immediately below the cranium of the animals. When the stereotaxic frame was placed on the microscope stage, the compartment was submerged in the transducer reservoir, allowing direct coupling from the transducer through the water compartment into the animal (see Figure 1). The transducer reservoir and frame compartment were filled with degassed water; a gel pad (Aquaflex, Parker Laboratories, Inc, Fairfield, NJ, USA) was placed over the hole leading to the reservoir, and a small amount of US gel (Scan, Parker Laboratories, Inc, Fairfield, NJ, USA) swabbed over the gel pad to ensure proper coupling. The animal was secured on top of the gel pad with ear-bars and a bite bar.
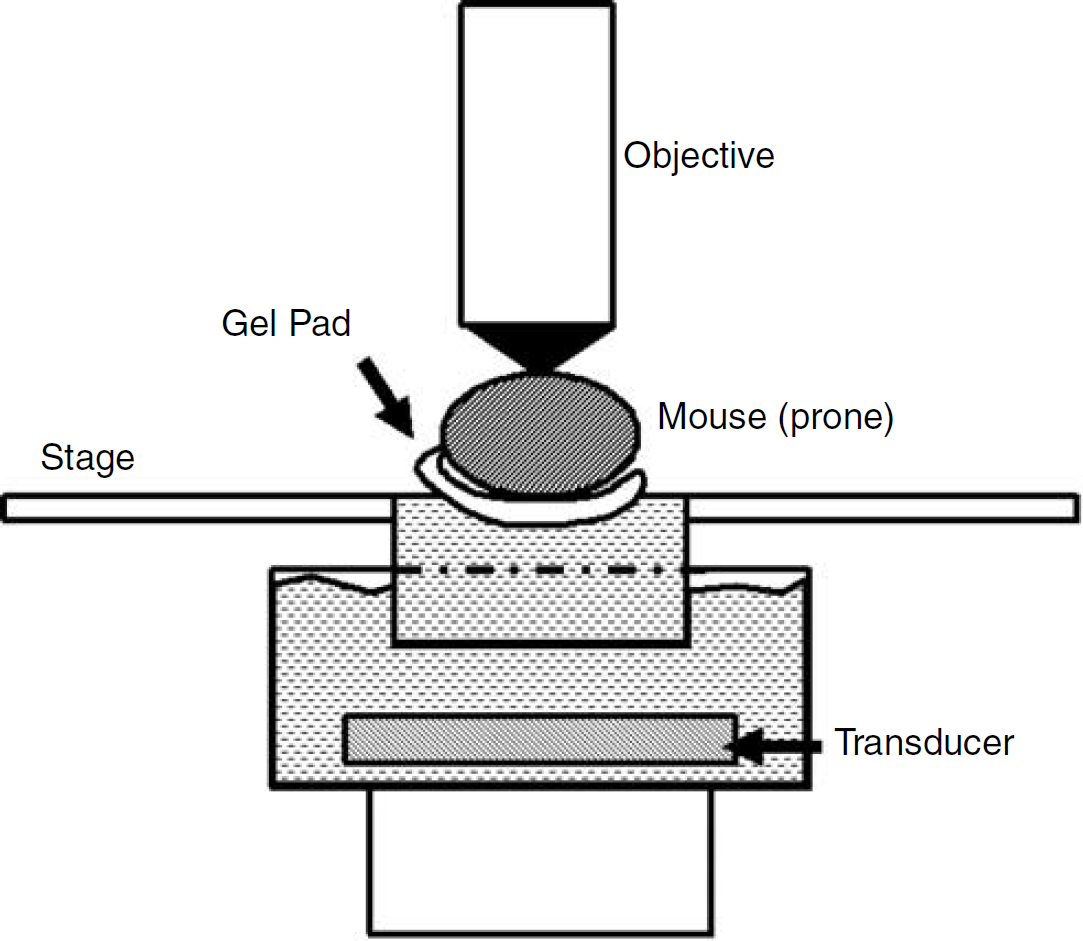
Experimental setup. Animals were held in place with a modified stereotaxic frame that fit into the microscope stage and allowed coupling of US energy from below. The mouse was placed prone on top of a gel pad that fit over a small water reservoir in the stereotaxic frame. This water reservoir then interfaced with a container holding the submerged transducer below, providing an uninterrupted acoustic path from the transducer to the ventral surface of the animal. The microscope objective was focused down through the cranial window to the surface of the brain.
Animal Preparation
C57 wild-type mice (19 animals, 2 to 10.5 months old, 20.2 to 28.5 g; 2 animals were excluded from analyses because of technical problems with the US treatment) were prepared with a cranial window as previously described (Skoch et al, 2005). Animals were allowed 2 to 7 days recovery from the craniotomy before imaging. Approximately 1 h before US exposure, mice were anesthetized with avertin (1.3% 2,2,2-tribromoethanol, 0.8% tertpentylalcohol; 250 mg/kg) and prepared by depilating the ventral surface of the head and throat with electrical clippers and tape. A small amount of US gel (Scan, Parker Laboratories, Inc, Fairfield, NJ, USA) was swabbed on the throat inferior to the mouth; the animal was secured in the stereotaxic frame as explained above. An intravenous catheter was inserted into the tail and glued in place to allow tail vein injections of dye and US contrast agent over the course of the experiment.
One hour after US treatment, the subset of animals receiving Evan's Blue were perfused with phosphate-buffered saline and 4% paraformaldehyde. Brains were harvested and cryosectioned at 50 mm. Standard hemotoxylin and eosin (H&E) staining was used for histologic examination in 6 animals.
Ultrasound Parameters
Ultrasound was produced by an air-backed, 4 cm spherical PZT crystal, manufactured in-house (focal length, 4.5 cm, fundamental frequency, 1.029 MHz). The transducer was driven with waveforms from an arbitrary function generator (HP 33120A, Hewlett-Packard, Loveland, CO, USA) and amplified with a 50 dB RF Power Amplifier (Electronic Navigation Industries, Rochester, NY, USA), producing an ellipsoidal focus of ~ 80 mm3 (axial full-width at half-maximum of 25 mm, radial full-width at half-maximum of 2.5 mm). Animals were exposed in up to 2 locations (one in each hemisphere) to 10 ms bursts (frequency, 1.029MHz; burst repetition frequency, 1 Hz) for 45 to 60 secs (acoustic power ~ 0.2 W and peak focal pressure 0.2 MPa) and received 0.01 mL Optison intravenously (dosage, 0.3 mL/kg).
Imaging
Cerebral vasculature was imaged through the cranial window with a multiphoton microscope (Bio-Rad Laboratories, Hercules, CA, USA), mounted on an Olympus BX50WI upright microscope (Olympus, Melville, NY, USA). We injected various dyes intravenously before, during, and after exposure, including dextran-conjugated Alexa Fluor 488 (10 kD MW; Molecular Probes, Eugene, OR, USA), dextran-conjugated Texas Red (70 kD MW; Molecular Probes, Eugene, OR, USA), and Evan's Blue (960 D MW; Sigma-Aldrich, St Louis, MO, USA). These fluorophores provided an angiogram and served to assess BBB integrity. Fluorophores were excited at 800 nm with a mode-locked Ti: Saphire laser (Mai-Tai, Spectra-Physics, Mountain View, CA, USA) and emitted light was split into three channels with a series of dichroic mirrors and interference filters (Chroma Technology Corporation, Rockingham, VT, USA) and collected with photomultiplier tubes (Hamamatsu, Ichinocho, Japan). Images were taken every 3 to 30 secs using a x 20 water immersion objective (0.95 NA, Olympus, Melville, NY, USA).
Images were processed with ImageJ (Rasband, 1997) and Matlab (The Mathworks, MA, USA) software. In cases imaged during dye injection, we distinguished blood vessels as arterial or venal by watching the dye fill the vasculature over the space of two frames (3 secs apart). To quantify the extent of vasospasm, the vessel diameter was measured for the largest constricting vessel in a given field of view (FOV) for the full course of the experiment. Diameter was estimated by taking the full-width at half-maximum (FWHM) of the signal intensity across the vessel width. Recovery time, tR, was defined as the time from the first constriction until the vessel returned to 75% of the original diameter. Additionally, the FWHM was measured for all constricting blood vessels in the FOV before US exposure to determine the size of vessels affected.
Results
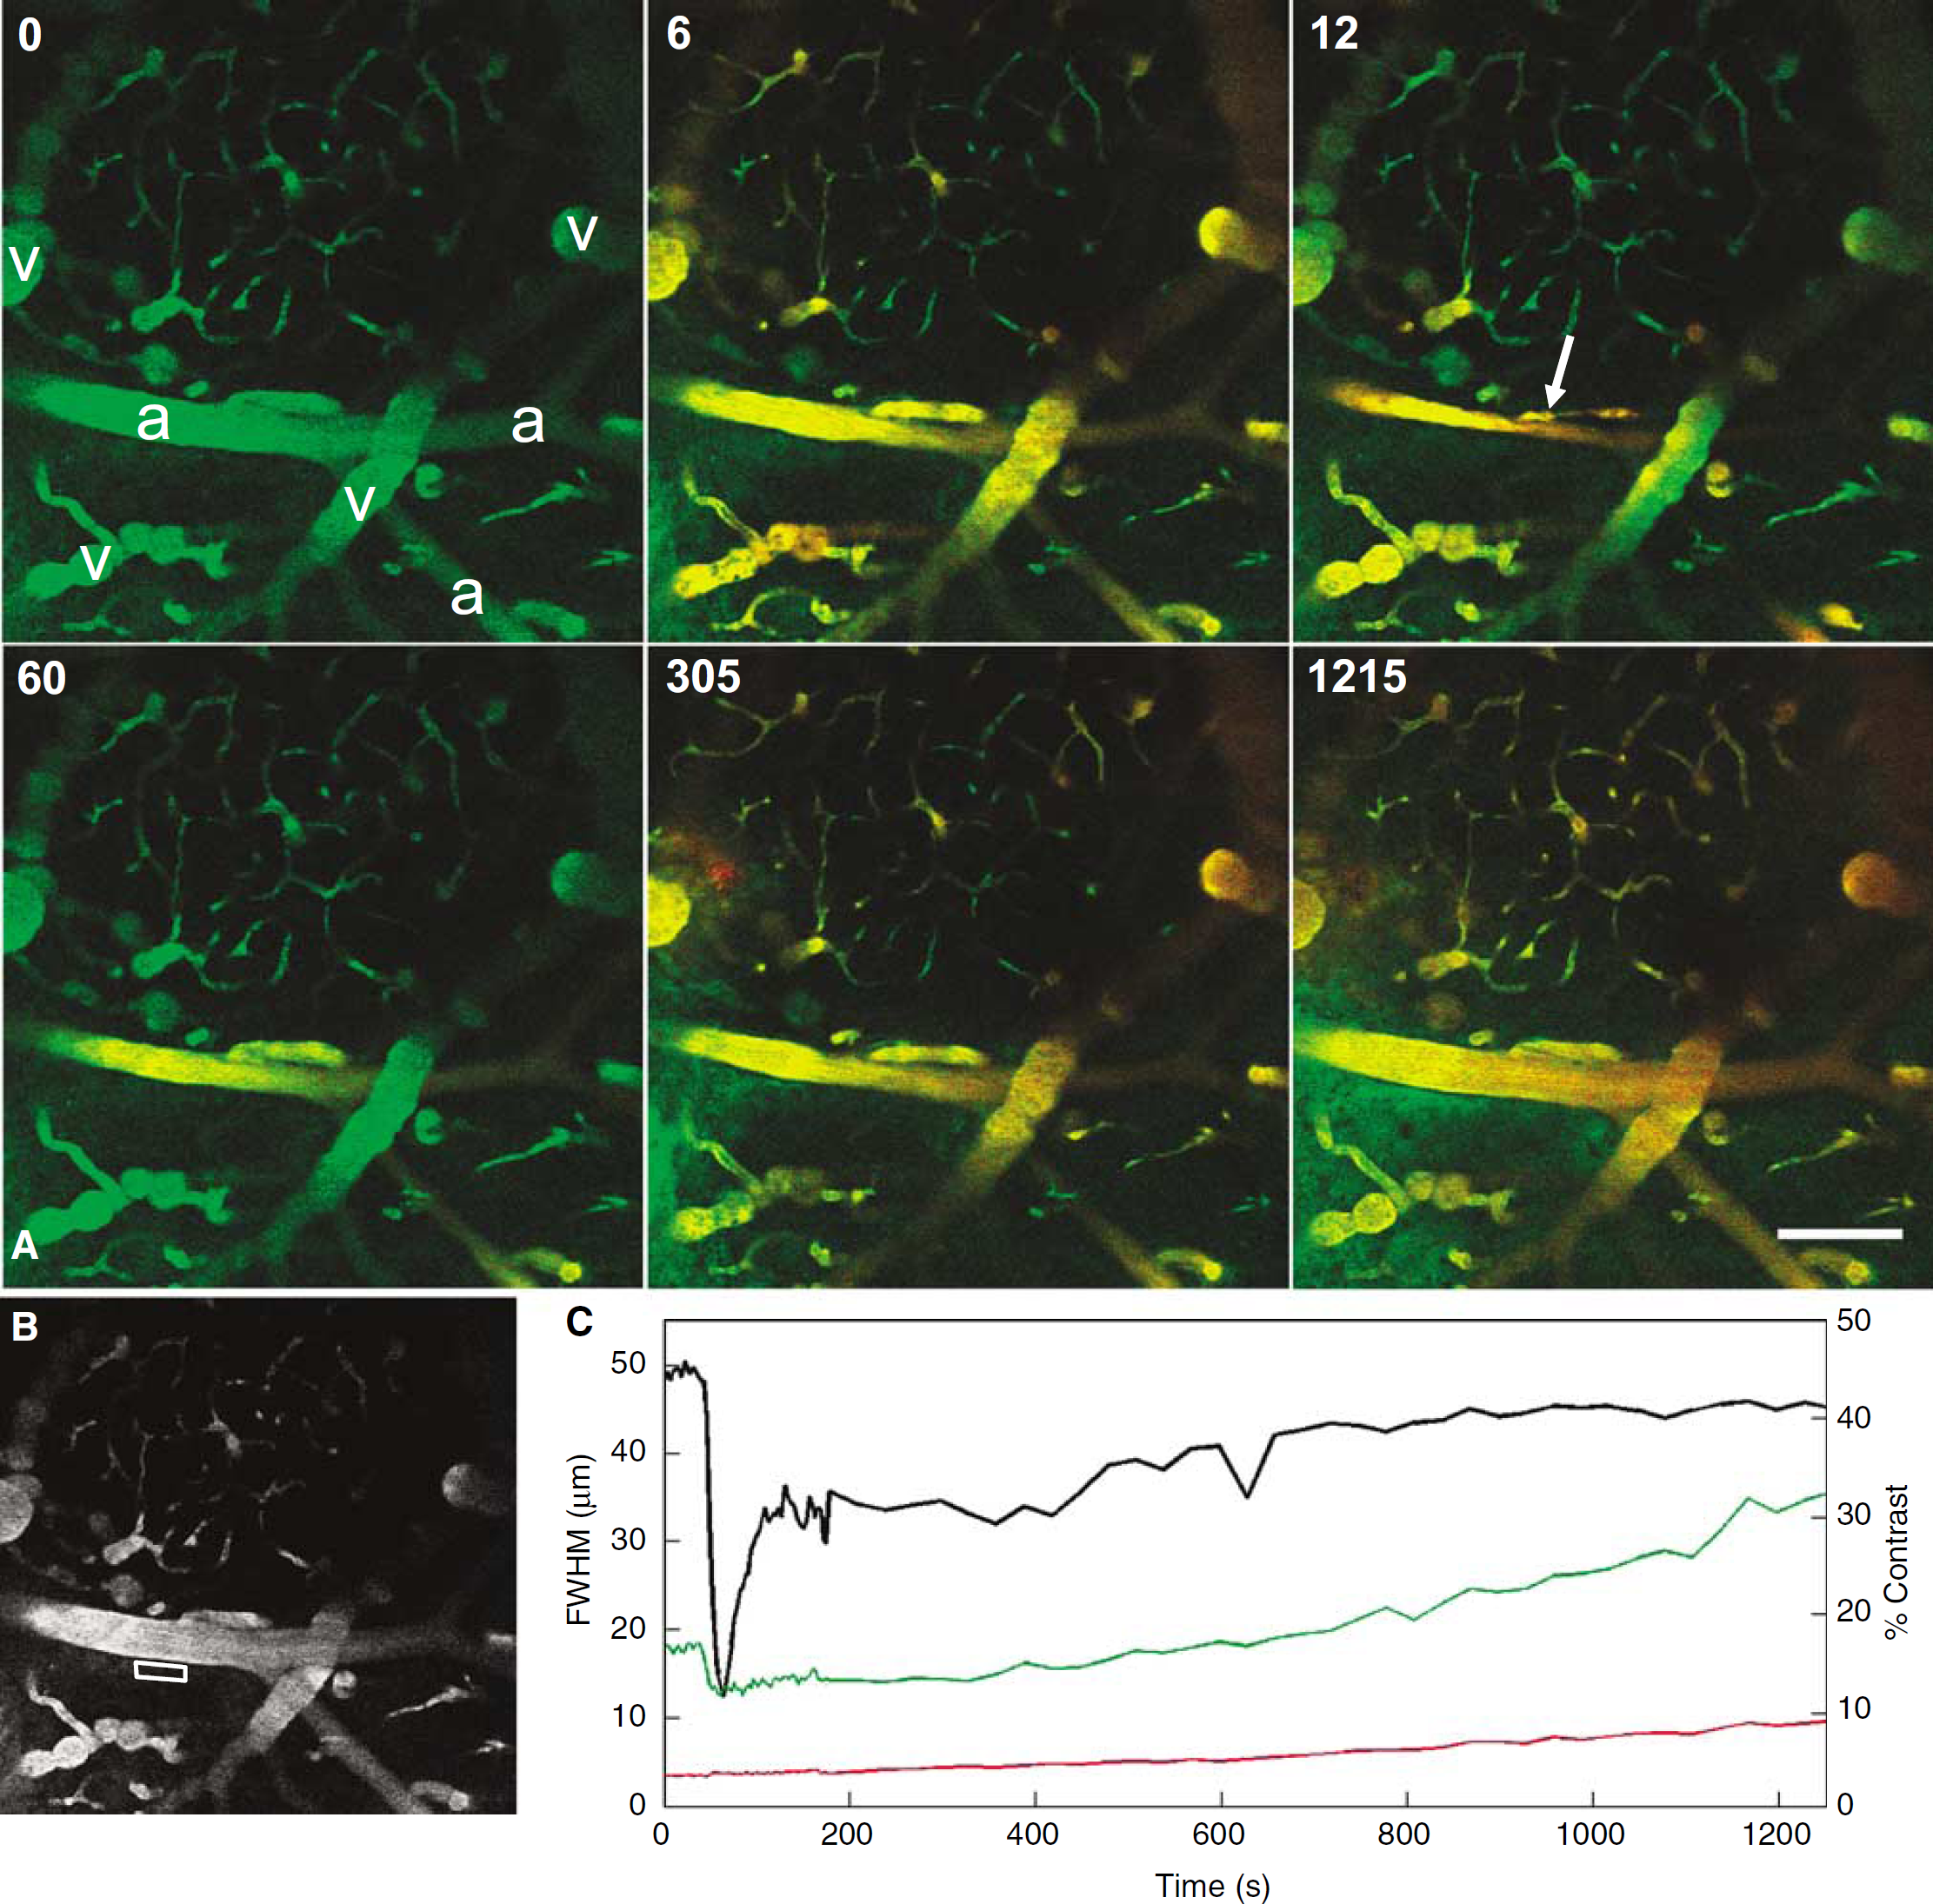
We observed many different vascular effects as a result of US and Optison. In general, a strong vasomotor response occurred at the onset of sonication/Optison accompanied by leakage from the vessels (Figure 2; see also movie in Supplementary Materials). Leakage occurred via distinct processes including hemorrhage, focal compromise of the vessel wall, termed micro-disruption (see Discussion below), and slow-leakage from patent vessels (Figure 2).
Vascular effects observed in real time. (
When enhanced with Optison, US has vascular effects different from US or Optison alone. Because US or Optison might affect the vasculature independently, we performed controls that demonstrated effects only when US exposure was accompanied with Optison (Figure 3). In some animals (n = 9), US exposure was started 10 to 25 secs before Optison injection; vasoconstriction only occurred after Optison injection (Figure 3A). Conversely, when Optison injection preceded US exposure (n = 5), vasoconstriction occurred on US exposure (Figure 3B), evident in the frame immediately after US pulse initiation (latency < 3 secs). In all cases, vascular effects were observed only after US exposure with Optison.
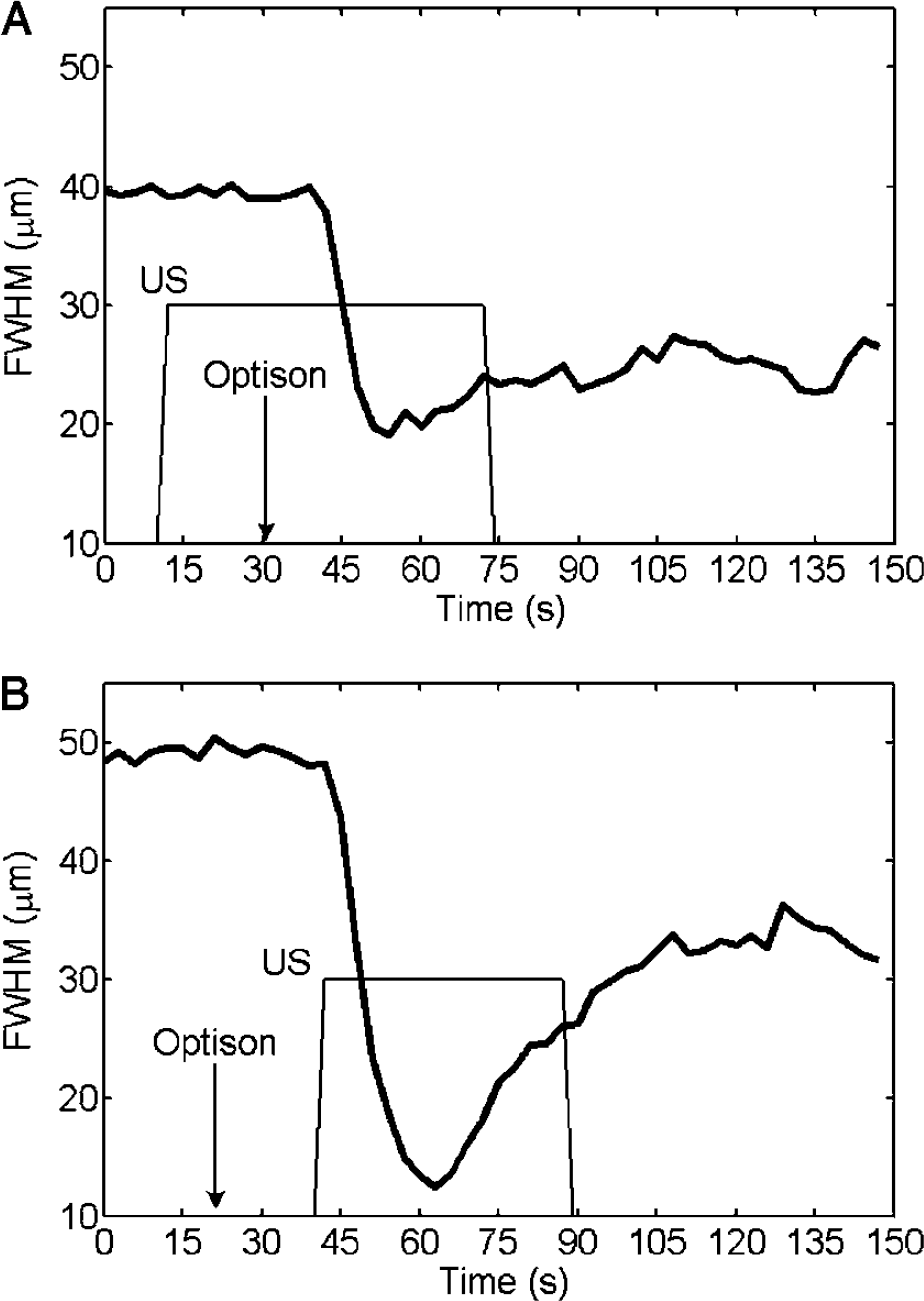
Vasoconstriction results from US with Optison. These plots show the dynamics of vessel diameter, as measured by the FWHM of the signal intensity across the vessel, in two different animals that received different treatment sequences. In animal (
Additionally, three animals were imaged during intravenous delivery of Optison without US exposure. In one of these, mild vasospasm was observed after the injection of dyes and Optison; the extent of the spasm (vessel diameter reduced by 21%) and the lack of leakage and other bioeffects suggests that this event was characteristically different from US/Optison-induced bioeffects.
Vasospasm
The most ubiquitous effect from our treatment parameters was vasospasm, observed in 14 of 16 locations (see Table 1). Typically, the vasomotor response included an initial constriction, reducing the vessel diameter on average by 59.5% ± 11.1%, followed by a recovery phase (tR), lasting 21 to 615 secs (Supplementary Materials, Table 2). The wide range of recovery times is probably due to variable delivery of the contrast agent, as the two animals with longest vasospasm received Optison before US exposure allowing more complete dispersal of the microbubbles through the vasculature (animal #1, 2; tR = 300, 615 in Supplementary Materials, Tables 1 and 2). Variability may also be explained by the uncertainty in Optison dosage owing to the extremely small delivery volume (0.01 mL).
Summary of vascular effects
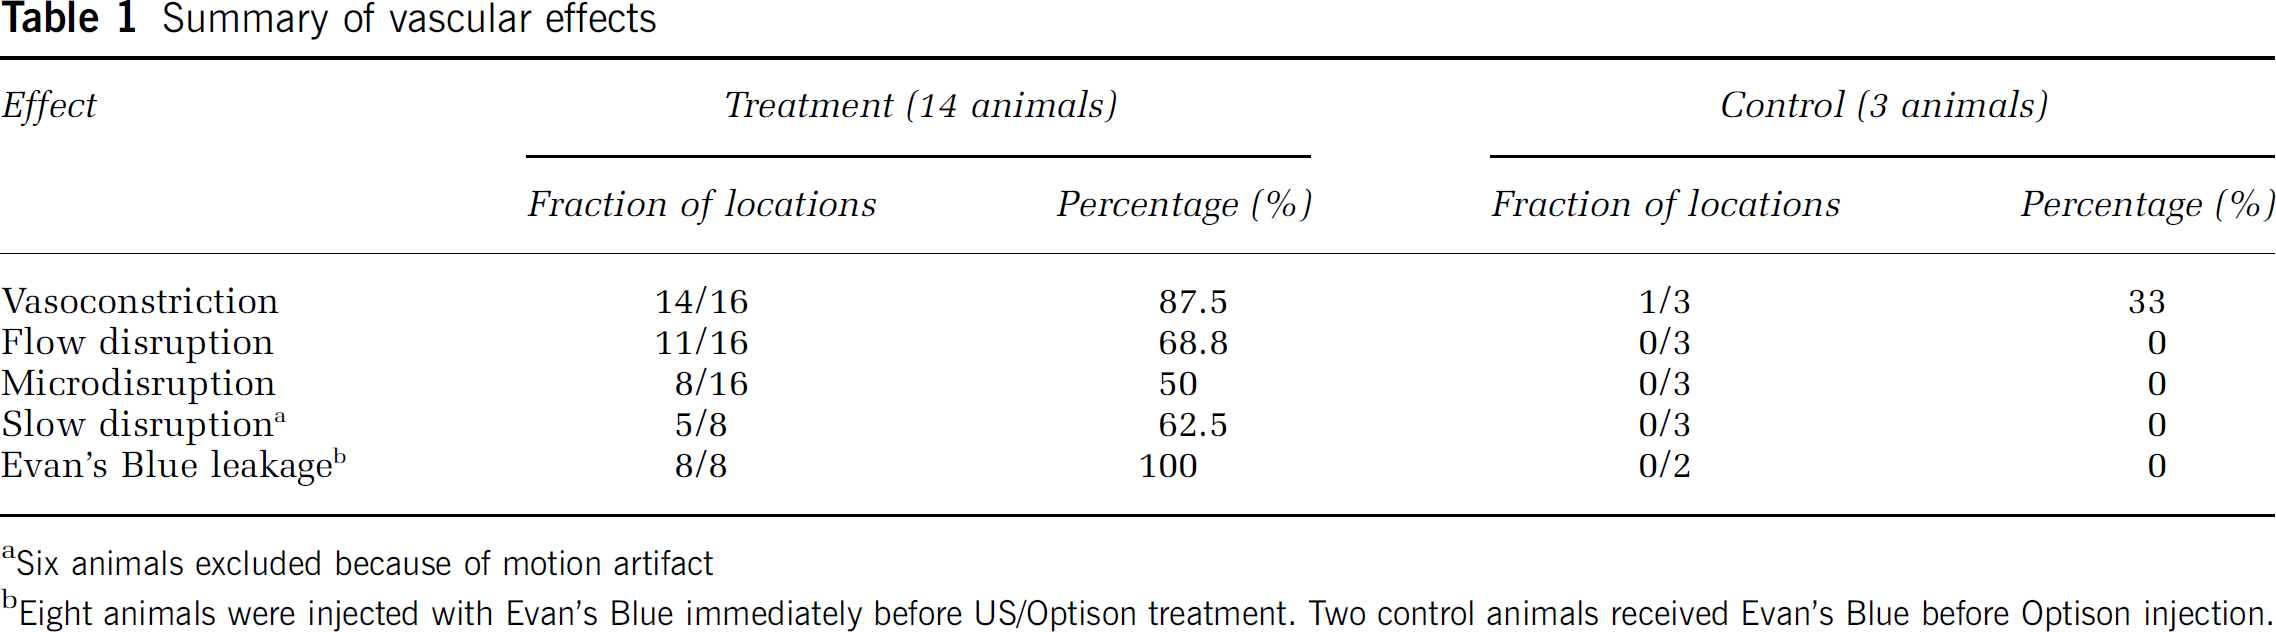
Six animals excluded because of motion artifact
Eight animals were injected with Evan's Blue immediately before US/Optison treatment. Two control animals received Evan's Blue before Optison injection.
Whole arterial networks were affected by the US/Optison treatment, with vasoconstriction occurring in both the primary vessels and branching efferents. The vasomotor response generally occurred along the entire length of the vessel, but was markedly greater at focal regions, giving the vessel a lumpy or beaded appearance (Figure 4). Vessels of varying diameters were affected, from arteries (> 50 μm) to late arterioles (10 to 20 μm) (Figure 5). Many vessels in the FOV, including capillaries, did not constrict, presumably because they lacked the smooth muscle necessary for vasomotor capability. Venoconstriction was not observed.
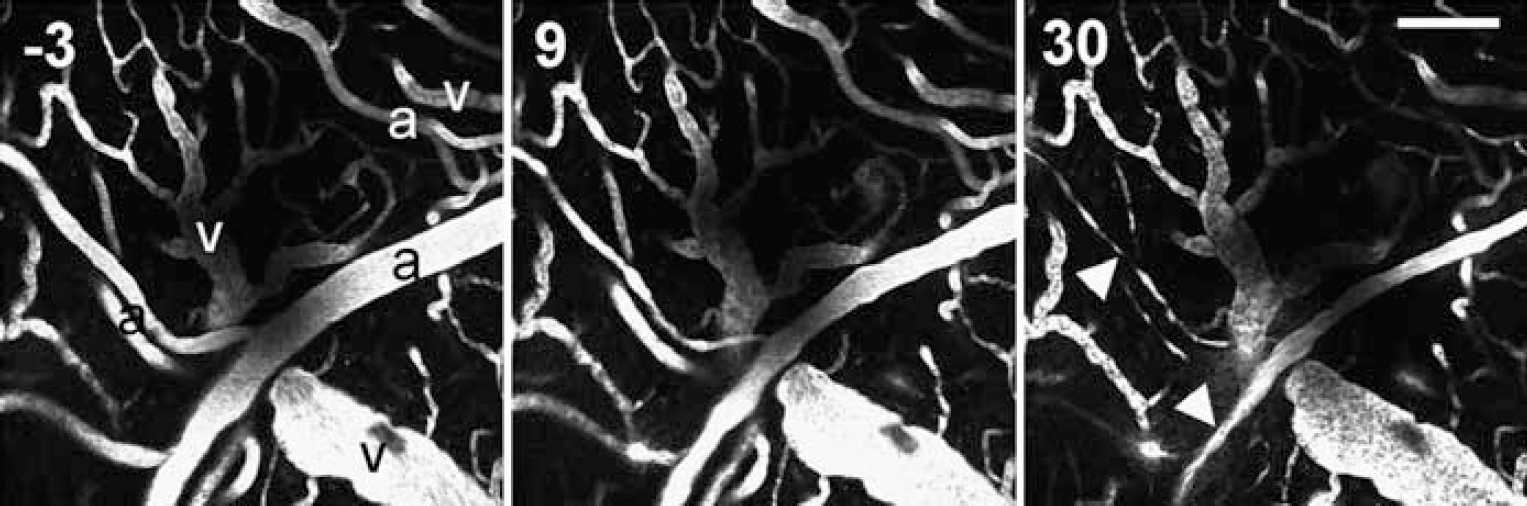
Vasculature before and during US/Optison exposure (time from exposure shown in top left corner in seconds). Arteries are labeled ‘a’, veins ‘v’. By 30 secs, the constricting vessels have a lumpy or beaded appearance (arrowheads). Scale bar is 100 μm.
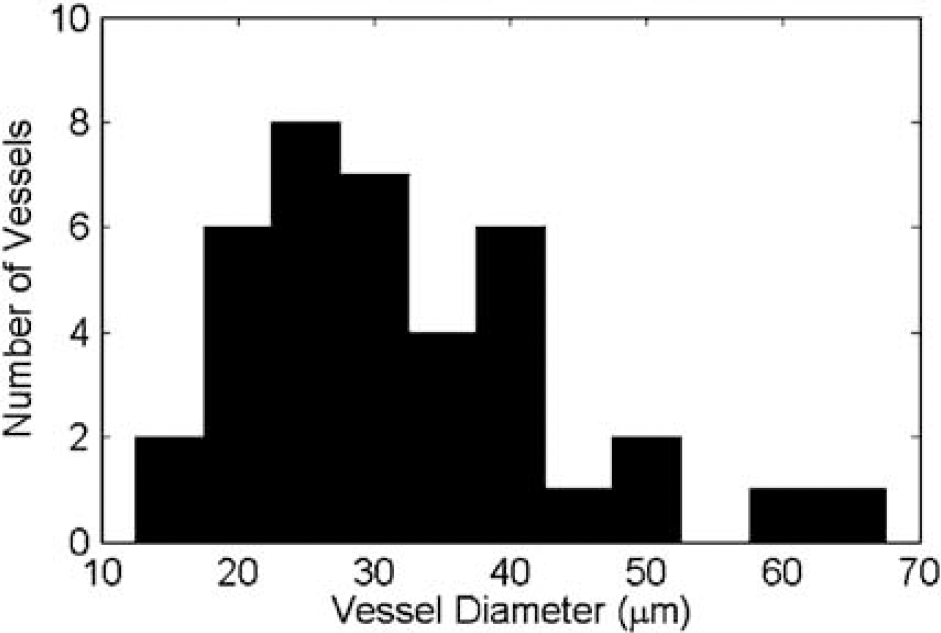
Diameter of vessels that exhibited vasospasm. Vessel diameter was estimated by the FWHM of the image signal intensity across the vessel before vasoconstriction. The total number of vessels and branches observed was 38.
In most cases, the vasculature visibly moved during the initial vasoconstrictive event, probably from distortion of the neuropil by contracting smooth muscles. Likewise, during vessel relaxation, the vasculature appeared to return to the original orientation within the FOV. This movement was sometimes large enough to preclude careful measurement of perivascular dye (see discussion under Blood–Brain Barrier Disruption below).
Vasospasm significantly altered the blood flow in most animals (11 of 16 locations). Before US/Optison exposure, vessels appeared as solid blocks of signal with few cellular voids or streaks (Figure 6). On vasoconstriction, streaks appeared, followed by cell-like signal voids, indicating nearly stagnant hemodynamics. In some instances, large signal voids appeared in veins at the peak vasoconstriction, possibly a sign of thrombosis or other cellular aggregation in the vessel lumen.
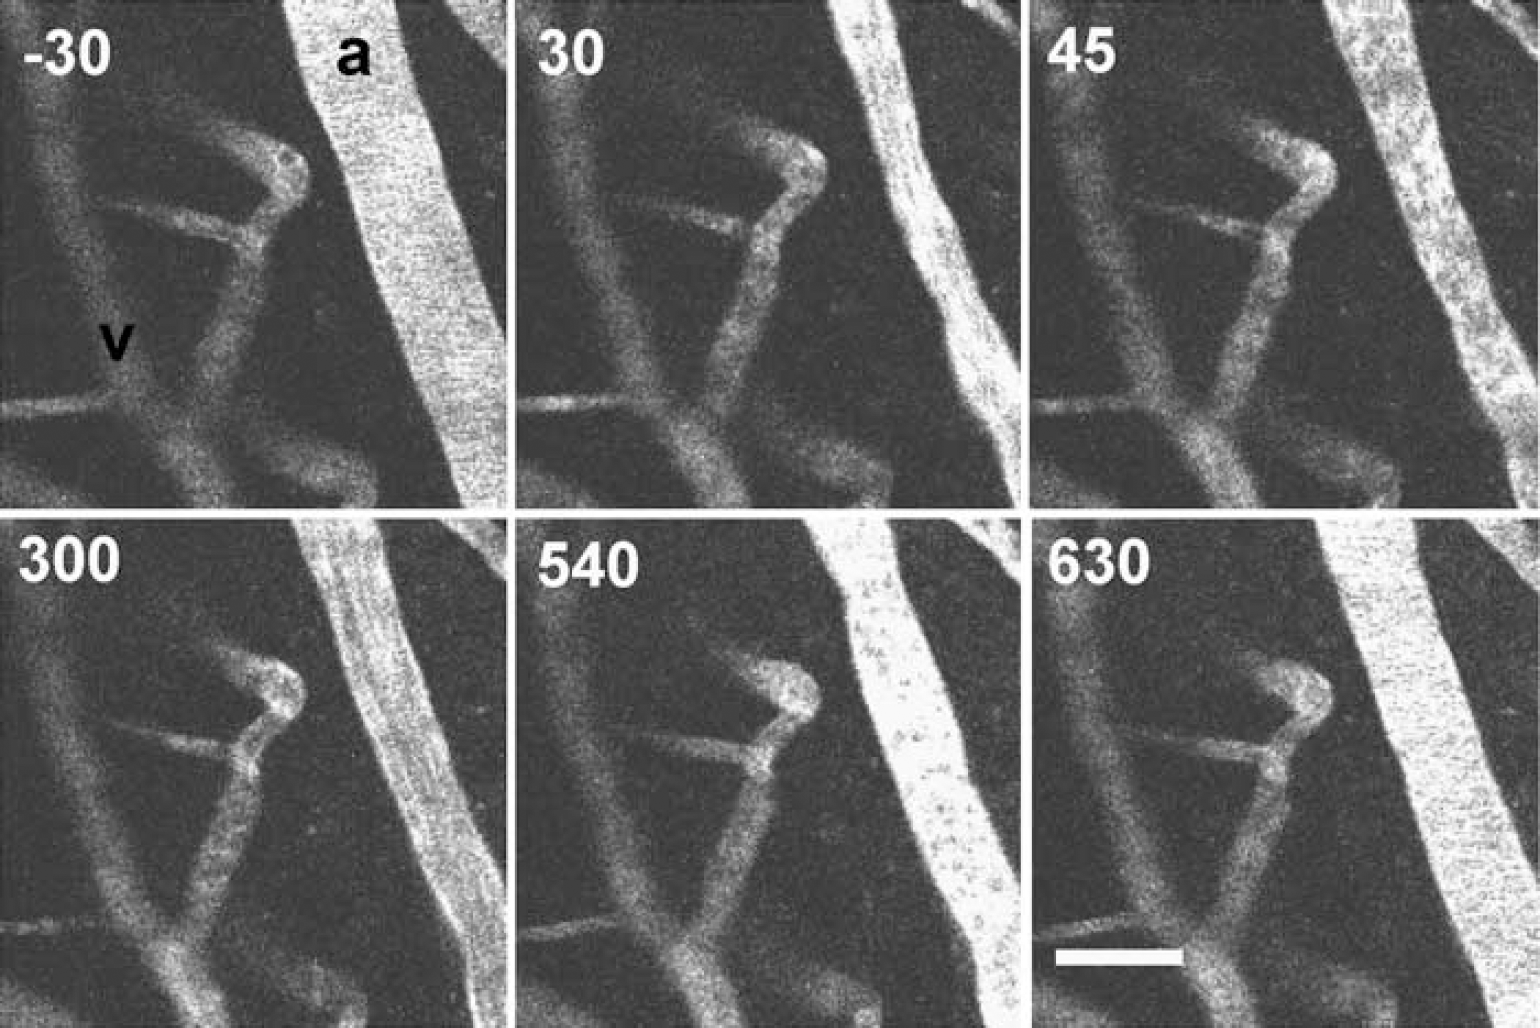
Hemodynamics in constricting vessels. Animal was exposed to US for 45 secs after Optison injection at t =0. Time (relative to Optison injection) is shown in top left corner of each frame. Altered hemodynamics are visible: before the US/Optison exposure, the vessel has relatively homogenous signal indicating smooth flow. Following vasoconstriction dark, cellular voids appear, suggesting stagnation (t = 45 secs); these turn to streaks (t = 300 secs) and then to homogenous signal (t = 630 secs) as the flow returns to normal. Scale bar is 50 μm.
To estimate how vasospasm affected blood flow in vessels downstream, we injected one animal with Evan's Blue intravenously during the primary vasomotor response (30 secs after Optison injection, during 45 secs US exposure). The vascular arbor was visualized with 10 kDa dextran-conjugated, Alexa Fluor 488 injected intravenously before the treatment. It took over 4 mins for the Evan's Blue injection to completely perfuse the FOV, compared with typical FOV perfusion times of less than 9 secs for Evan's Blue seen with other injections. Some vessel segments were noticeably free of Evan's Blue until relaxation of upstream vessels, suggesting that US-induced vasoconstriction can at least transiently stop blood flow.
Blood–Brain Barrier Disruption
Blood–brain barrier disruption was observed as dye leakage out of vessels after US/Optison exposure; leakage occurred with and without the extravasation of erythrocytes (hemorrhage). The dyes we used exhibited minimal detectable leakage as measured in control animals that received Optison (0.01 mL) without US treatment. As a secondary control, we examined post-mortem brains harvested from animals injected with Evan's Blue to see whether blue markings were visible grossly.
Hemorrhage was observed during multiphoton imaging at 1 location (out of 16 locations, 14 animals) and appeared as rapid blurring of vessel edges (3 secs), dispersal of dye away from the vessel, and signal loss because of erythrocyte extravasation into the FOV (erythrocytes absorb at 800 nm and heavily absorb at emission wavelengths, resulting in decreased fluorophore excitation and emission detection).
Dye leakage occurred without extravasation of erythrocytes via two processes observed during imaging: focal leakage (microdisruption) from a point on the vessel wall or slow leakage across apparently intact endothelium (slow disruption). During microdisruption, dye spread rapidly (3 to 9 secs) from a single point on the vessel wall and diffused radially outward from the source; microdisruption usually occurred seconds after US/Optison injection and quickly saturated proximal neuropil (Figure 7). Microdisruption was observed at 8 of 16 locations and occurred more frequently from arteries than veins. Points of bifurcation were especially susceptible.
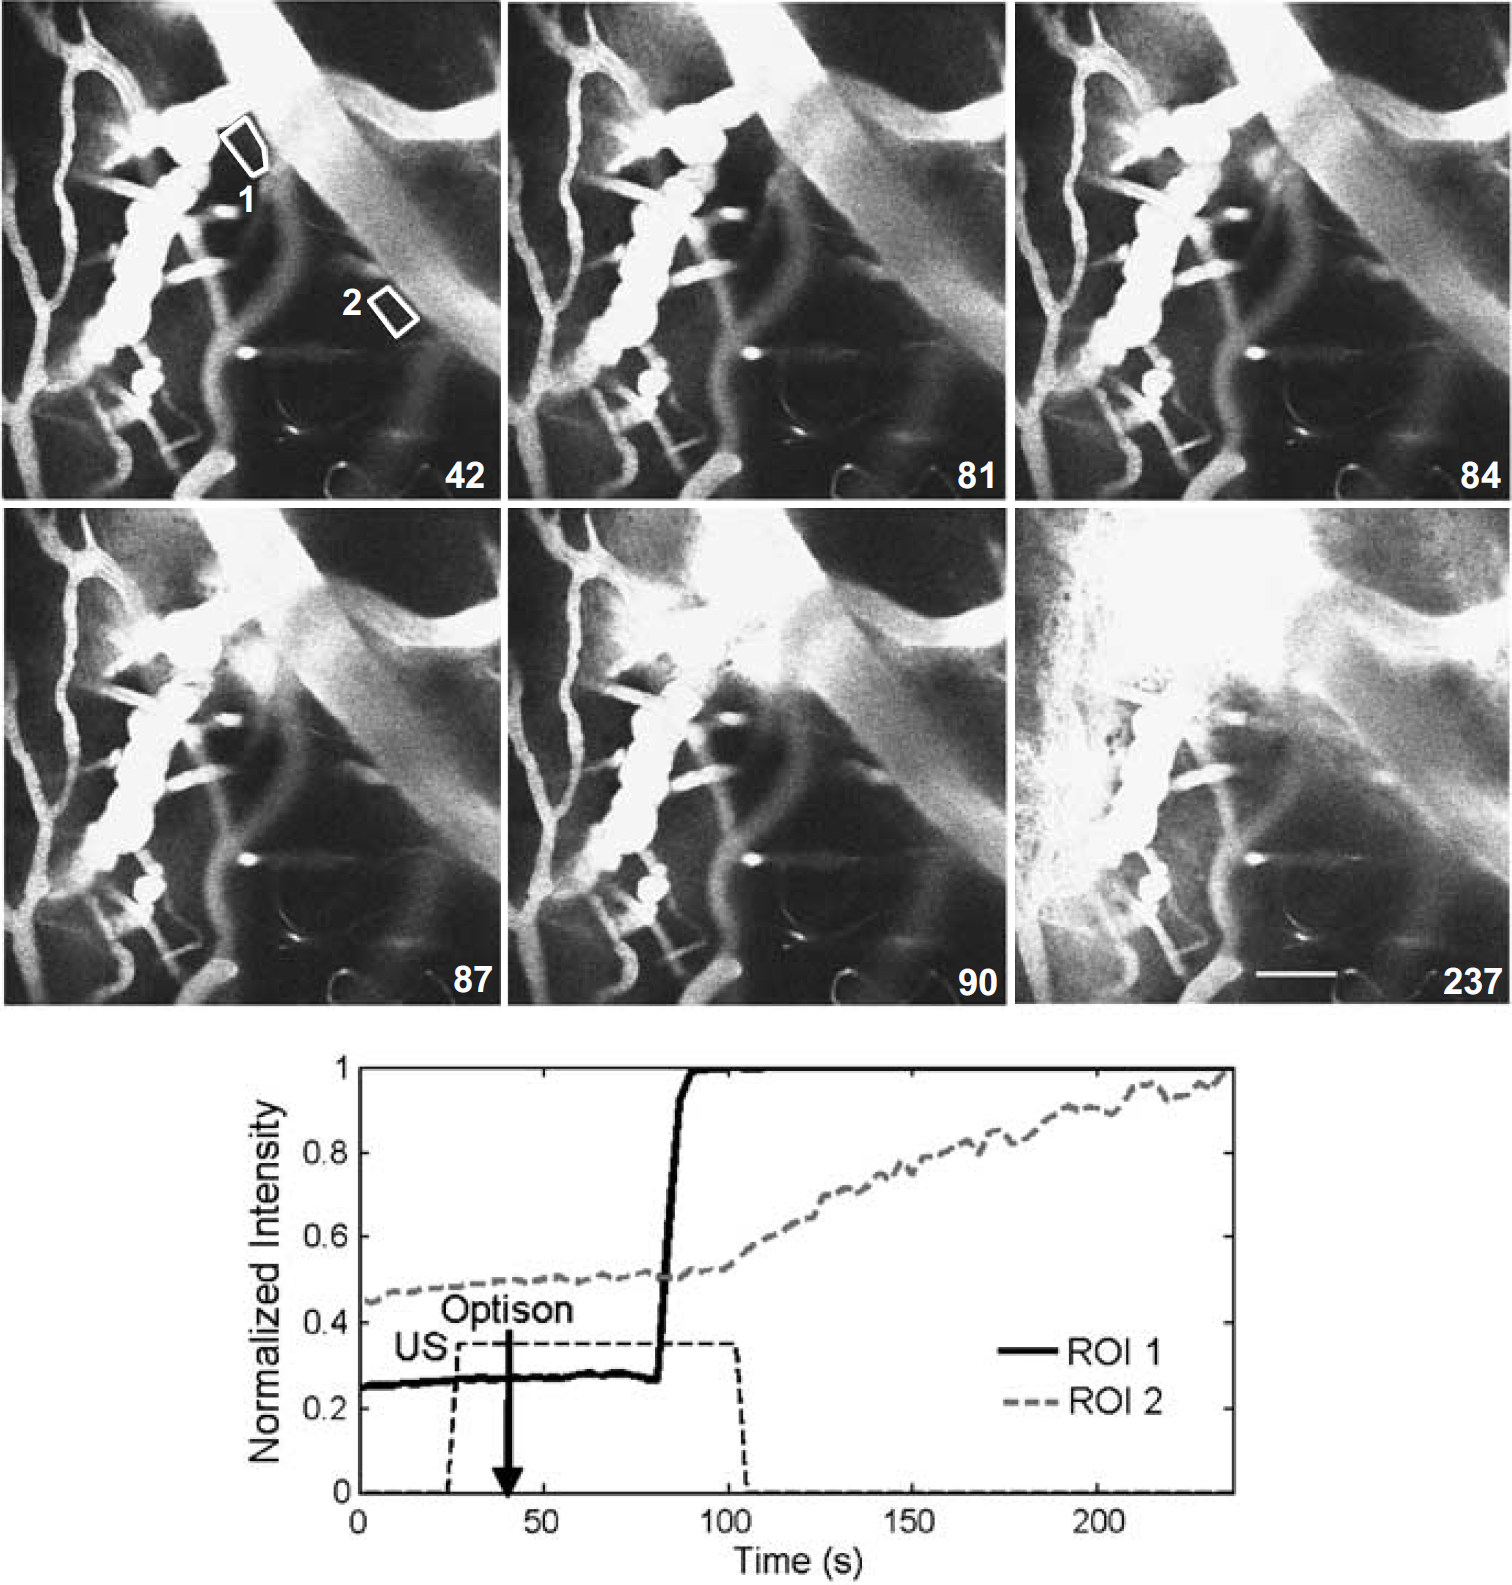
Multiple disruption mechanisms. Animal received Optison at t =42 secs, US exposure from t = 27 to 102 secs (time from start of experiment is shown in the bottom right corner). Average signal from the ROIs, shown in the first frame (t = 42 secs), was followed over the course of the experiment. ROI1 shows rapid rise in signal indicative of microdisruption; ROI2 shows the gradual signal increase of slow disruption.
Slow disruption was seen as a gradual rise in extravascular signal that started on US/Optison treatment without visible disruption of the endothelium (see Figure 2). This effect was characterized by measuring the change in average signal in a region-of-interest (ROI) proximate to the affected vessel. It was difficult to quantify slow disruption because of other factors that affected signal in the ROI, particularly motion in the z-axis.
Deviation in the z-axis can result in a signal artifact owing to depth-dependent attenuation of the excitation beam and signal (auto-fluorescence, etc.) from the dura and other surface tissues. We observed motion artifacts from slow settling of the animal in the z-axis over long times (15 to 30 mins) and US/Optison-induced bulk motion of the neuropil concurrent with vasospasm; respiratory and cardiac motion was insignificant because of the closed cranial window and stereotaxic frame.
After excluding experiments with obvious motion artifacts, we recorded slow disruption in four animals at five different locations. Slow disruption was seen with Evan's Blue (4 locations, 3 animals), 10 kDa, dextran-conjugated Alexa Fluor 488 (1 animal), and to a lesser extent, 70 kDa, dextran-conjugated Texas Red (see Figure 2C). In animals with concomitant microdisruption, it is unclear whether slow disruption was an artifact created by diffusion from the microdisruption focus.
After imaging, we examined post-mortem tissue grossly during sectioning and with H&E staining to look for hemorrhage and Evan's Blue, indicative of BBB disruption. Small hemorrhages (< 1 mm diameter) were grossly observed in most animals on post-mortem, sectioned tissue, just deep to the surface, although such superficial hemorrhages are a potential complication of the craniotomy, as similar hemorrhages were seen in the hemisphere contralateral to US/Optison treatment and in control animals not exposed to US (see Figure 8). Likewise, petechial hemorrhages were seen on H&E-stained sections in the superficial layer of cortex in both control and treatment animals.
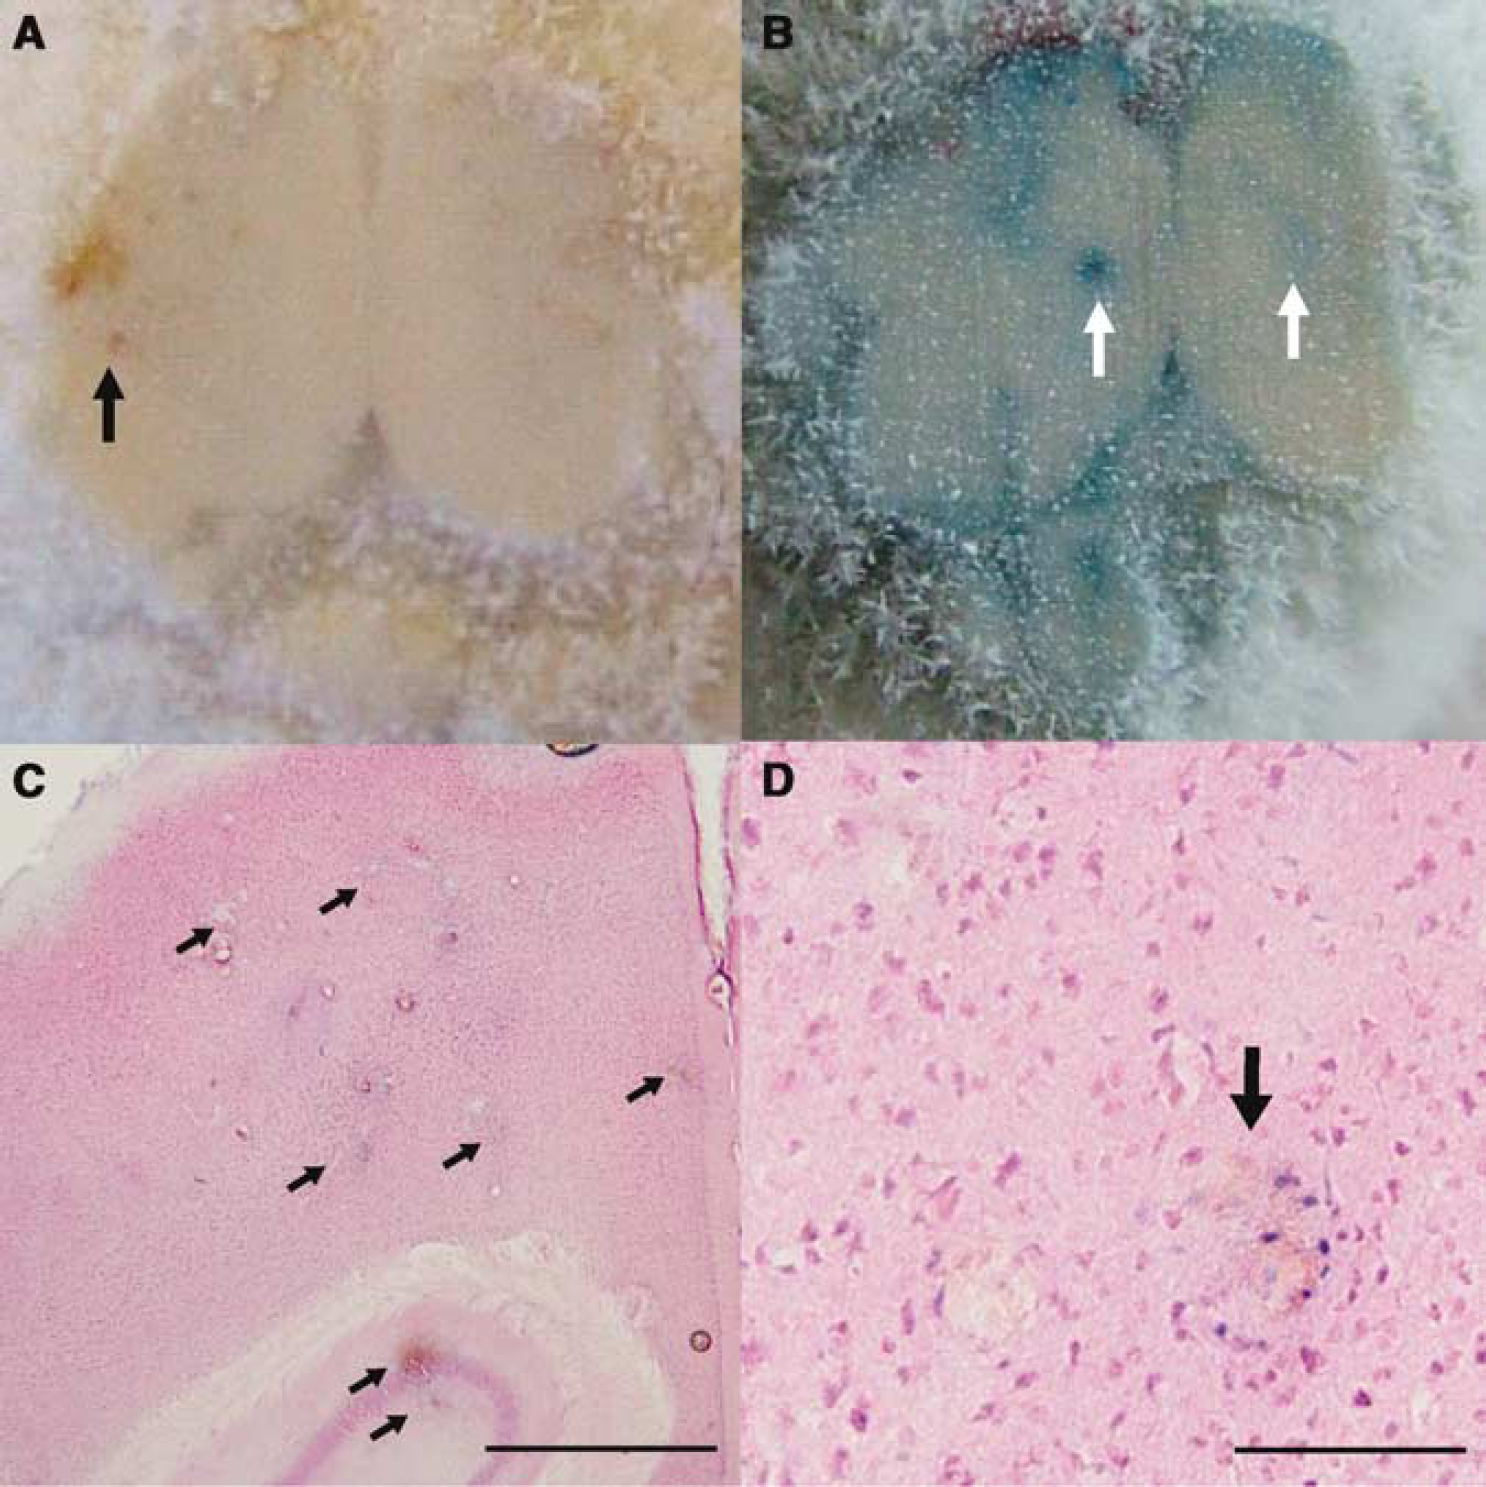
Evan's Blue test for BBB disruption. Postmortem cryo-sectioned brains photographed during the sectioning and then stained with H&E. (
Treatment animals, however, also exhibited from 1 to 12 petechial hemorrhages on H&E sections deeper in the brain (Figure 8). Scattered petechiae were observed along the US beam path, from the dorsal to the ventral surface in coronally sectioned brains.
BBB disruption from US/Optison treatment was confirmed by post-mortem Evan's Blue staining. Animals received Evan's Blue at different time points including 30 mins after treatment (two animals), immediately after treatment (two animals), and immediately before treatment (eight locations, six animals). Only animals that received Evan's Blue before US/Optison treatment displayed distinct, focal staining (Figure 8); other time points exhibited only diffuse, faint staining. Some treatment animals exhibited wide areas of staining, including the contralateral (nontreated) hemisphere and ventral surface of the brain, attributable to tissue lensing and reflections from tissue boundaries and bony cranial surfaces.
Discussion
In this study, low-intensity US with Optison produced vasoconstriction and two distinct forms of BBB disruption. Although not all of the effects were seen in every animal (Table 1; see also Supplementary Materials, Table 1), the observed variability was appropriate considering the difficulties of the ventral surface approach—scattering of the acoustic field by ventral structures of the head, including the trachea and skull, resulted in large animal-to-animal differences in attenuation and focusing (Raymond et al, 2005). Other sources of experimental error such as improper z-axis alignment, imprecise delivery of small Optison volume, and poor coupling contributed to sonication variability. For example, in one animal stained with Evan's Blue, we observed focal staining on the ventral (rather than dorsal) surface of the brain, indicating under-focusing from tissue lensing effects or z-axis misalignment.
For the first time, we demonstrated US/Optison-induced vasospasm at low-power amplitudes in the brain. Previously, Hynynen et al (1996) described US-induced vasoconstriction in the femoral artery from high-intensity (> 5800 W/cm2) focused US without microbubble contrast agent (Hynynen et al 1996). We produced vasoconstriction in most animals (14/16 animals) at power amplitudes (< 1.6 W/cm2) far below the peak intensity used in previous studies and comparable to the amplitudes currently used in some forms of diagnostic imaging (Bushberg et al, 2001). With the reduced power requirement, this technique could be used to non-invasively impair blood supply to inoperable brain tumors. More work is necessary to understand the pertinent parameters for controlling constriction duration and repeatability.
Clinically, vasoconstriction results from excessive physical contact to arteries by guide wires or catheters (Takahashi et al, 1996; Mauser et al, 1990; Kitazawa et al, 2005). We posit that our US/Optison exposure resulted in mechanical stimulation of the endothelium. Others have shown that US can displace microbubbles away from the transducer via radiation force (Dayton et al, 2002) and cause contrast agent aggregation (Dayton et al, 1999) or endothelial damage (Hwang et al, 2005) on the distal (relative to transducer) surface of a blood vessel. Under our sonication parameters (peak pressure = 0.2 MPa), it is likely that microbubbles experienced radiation force and were ‘pushed’ to the vessel wall. It is also possible that endothelium stimulation resulted from bubble oscillation or collapse or from secondary fluid effects, such as microstreaming and shock waves (Dayton et al, 1999; Allen et al, 2002; May et al, 2002). Finally, vasoconstriction might have been a secondary effect of US-induced cortical spreading depression (Vykhodtseva and Koroleva, 1986; Koroleva et al, 1986; Ayata et al, 2004).
Importantly, vasoconstriction was severe (average 59.5% decrease in vessel diameter) and persisted as long as 5 mins, resulting in decreased flow. Brief vessel occlusion, as short as 3 mins, can result in ischemic injury ranging from pathologic changes in second messengers cAMP and IP3, delayed neuronal death, or conspicuous cell death (Araki et al, 1990a, b, 1993). Others have shown that transient ischemia results in increased endothelial pinocytosis and have proposed that the increased permeability seen during stroke is at least partly due to increased transcellular transport (Petito, 1979; Cipolla et al, 2004). In light of these facts, vasoconstriction constitutes a potential cause for the increased transcytosis seen previously (Sheikov et al, 2004).
In our experiments, three types of leakage were evident—hemorrhage, microdisruption, and slow disruption. Although hemorrhage was only observed in 1 animal during multiphoton imaging, there was histologic evidence of scattered petechiae deep in the brain along the beam path, consistent with previous studies (McDannold et al, 2005). The presence of hemorrhage complicates other findings twofold: first, the observed vasoconstriction could be a physiologic response to hemorrhage at a distant sight and second, hemorrhage releases large quantities of dye into the neuropil which could diffuse into the imaged FOV. We feel that vasoconstriction was not elicited by hemorrhage in most cases, owing to the small and variable quantity of petechiae and the overwhelming repeatability of vasoconstriction. Furthermore, local leakage from vessels during imaging rules out the possibility that all perivascular dye diffused from a distant hemorrhage. Most importantly, leakage occurred in the brain, both during multiphoton imaging and in some regions of Evan's Blue staining, unaccompanied by petechial hemorrhage.
Microdisruption presented as a rapid, localized increase in signal intensity, and often appeared as if dye was coming from a specific point on the vessel wall. The spatial restriction of dye, rapid dispersal, and the apparently intact endothelium on flanking sections of the vessel suggest a microscopic breach of the vessel wall. Microdisruption occurred often at bifurcations in the flow (five of eight events) and was frequently observed around constricting arteries (three of eight events). From these data, it appears that microdisruption might have preference for regions of hemodynamic stasis or recirculation (bifurcation) where microbubbles would be trapped and build up.
In contrast, slow disruption presented as a gradual increase of perivascular dye along the length of vessels (five of eight locations). The endothelium appeared completely preserved, without focal areas of leakage. We did not observe a preference for arteries or veins in animals that had arterial and venal circulations determined pre-treatment (see Materials and methods), but due to the spatial proximity of vessels and the limited size of our data set, this observation needs further corroboration.
It is tempting to speculate that slow disruption is indicative of increased transcytosis caused by vaso-mediated cerebral blood flow reduction and that microdisruption refers to focal paracellular leakage through broken tight junctions. Although vasoconstriction was evident here in C57 mice, it is not known if the same effect was present in previous experiments with rabbits and rats (Hynynen et al, 2001; Treat et al, 2004); long-term histologic studies using VAF-toluidine staining for ischemic neurons in rabbits showed no obvious ischemic injury after similar US/Optison exposures (McDannold et al, 2005). It is possible that vasoconstriction at these US parameters is limited to mice, as mice exhibit enhanced vasomotor excitability over other rodents, such as rats (Ayata et al, 2004); BBB permeability in previous experiments, then, would be a result of other effects. Future work is needed to confirm vasoconstriction in other animal models.
These data yield valuable insights into improving US-induced BBB permeability and other bioeffects. First, the effects were most often observed following the first of 45 to 60 US pulses, suggesting that exposure windows might be decreased without compromising effects. This would reduce the treatment times and the total energy exposure to the brain. Second, the existence of multiple BBB -disruption processes might allow selective enhancement of one or the other (transcytosis versus tight junctions) with the proper pulse parameters. In our experiments, we observed microdisruption in one animal without vasoconstriction, suggesting that effect selection is possible. Finally, the presence of vasoconstriction and resulting reduction in perfusion could significantly affect the continuous transport of microbubbles through the acoustic field. In principle, each US pulse destroys microbubbles in the focal region through cavitation; the microbubbles, however, are replenished by the circulation, stocking the focal region for the next US pulse. With vasoconstriction, the damaged or destroyed micro-bubbles would not be replaced and subsequent US pulses would be ineffective.
In summary, low-intensity US in the presence of a microbubble contrast agent can have multiple cerebrovascular effects, including vasoconstriction and BBB permeabilization. BBB disruption occurs via multiple pathways, including slow, nondestructive leakage and focal compromise of the endoethelium. The duration of vasoconstriction and reduction in cerebral blood flow suggest that vasoconstriction is at least one cause of increased trans-endothelial transport. Finally, US-induced BBB disruption may be improved by reducing pulse repetition and altering Optison injection protocols to maximize tissue perfusion.
Footnotes
References
Supplementary Material
Please find the following supplemental material available below.
For Open Access articles published under a Creative Commons License, all supplemental material carries the same license as the article it is associated with.
For non-Open Access articles published, all supplemental material carries a non-exclusive license, and permission requests for re-use of supplemental material or any part of supplemental material shall be sent directly to the copyright owner as specified in the copyright notice associated with the article.