
Abstract
The brain metabolic pattern of vascular dementia (VaD) remains poorly characterized. Univariate voxel-based analysis ignores the functional correlations among structures and may lack sensitivity and specificity. Here, we applied a novel voxel-based multivariate technique to a large (18F)2-fluoro-2-deoxy-D-glucose positron emission tomography data set. The sample consisted of 153 subjects, one-third each being probable subcortical VaD, probable Alzheimer disease (AD) (matched for Mini-Mental-State examination (MMSE) and age), and normal controls (NCs). We first applied principal component (PC) analysis and removed PCs significantly correlated to age. The remainders were used as feature vectors in a canonical variate analysis to generate canonical variates (CVs), that is, linear combinations of PC-scores. The first two CVs efficiently separated the groups. CV1 separated VaD from AD with 100% accuracy, whereas CV2 separated NC from demented subjects with 72% sensitivity and 96% specificity. Images depicting CV1 and CV2 showed that lower metabolism differentiating VaD from AD mainly concerned the deep gray nuclei, cerebellum, primary cortices, middle temporal gyrus, and anterior cingulate gyrus, whereas lower metabolism in AD versus VaD concerned mainly the hippocampal region and orbitofrontal, posterior cingulate, and posterior parietal cortices. The hypometabolic pattern common to VaD and AD mainly concerned the posterior parietal, precuneus, posterior cingulate, prefrontal, and anterior hippocampal regions, and linearly correlated with the MMSE. This study shows the potential of voxel-based multivariate methods to highlight independent functional networks in dementing diseases. By maximizing the separation between groups, this method extracted a metabolic pattern that efficiently differentiated VaD and AD.
Keywords
Introduction
Vascular dementia (VaD) is the second most common cause of dementia, only outnumbered by Alzheimer's disease (AD) (Fratiglioni et al, 1991; Ratnavalli et al, 2002). With recent advances in the prevention of embolic stroke, subcortical ischemic vascular dementia (SIVaD) has become the most prevalent of all subtypes of VaD (Roman et al, 2002). The terms ‘VaD’ imply the presence of a clinical syndrome (‘dementia’), assumed to be caused by a specific disorder (‘cerebrovascular disease’). However, recent studies have highlighted difficulties in making a firm diagnosis of VaD using current clinical diagnostic criteria (reviewed in Erkinjuntti et al, 2004; O'Brien et al, 2003). Regarding the diagnosis of dementia, global scales such as the Mini-Mental-State examination (MMSE) are heavily weighted towards cortical signs, whereas to reach Diagnostic and Statistical Manual of Mental Disorders 4th edition (DSM-IV) criteria for dementia, memory impairment is mandatory. This is likely to bias cohorts of patients diagnosed as VaD towards concomitant AD pathology while excluding ‘pure’ VaD (Bowler and Hachinski, 2003). Regarding cerebrovascular disease, although structural imaging can identify white matter ischemic changes, these are also commonplace with normal aging and can be present in subjects with vascular risk factors, but no cognitive impairment (de Leeuw et al, 2001), making their significance in dementia uncertain. Conversely, leukoaraiosis and white matter hyperintensities are widely prevalent in patients diagnosed with clinically probable AD (cpAD) (Gootjes et al, 2004) as they do not constitute an exclusion criterion for this diagnosis (McKhann et al, 1984). Neuropathologic studies have shown that AD and vascular lesions frequently coexist, and probably have a synergetic effect on the cognitive impairment of each (Snowdon et al, 1997; Zekry et al, 2002b). With the possibility that cognitive impairment can be partly alleviated in VaD (Erkinjuntti et al, 2004), it has become important to diagnose VaD with sufficient accuracy.
Functional imaging of resting-state synaptic activity using (18F)2-fluoro-2-deoxy-D-glucose positron emission tomography (FDG-PET) (or perfusion single photon emission computed tomography as a surrogate) has documented a hypometabolic pattern typical of early cpAD, involving the posterior cingulate and temporoparietal association cortices (particularly the posterior parietal area including the precuneus), followed at a later stage by dorsolateral prefrontal cortex; conversely, the primary cortices, basal ganglia and cerebellum are relatively preserved (reviewed in Baron, 1998; Herholz, 1995). Regarding subcortical VaD, studies have shown a more diffuse pattern of hypometabolism than in cpAD, that is, involving not just the association cortex but also the primary cortices, basal ganglia, thalamus, and cerebellum (Baron, 1998; Herholz, 1995), whereas the frontal lobe (Shyu et al, 1996; Starkstein et al, 1996; Sultzer et al, 1995; Yao et al, 1990), and more particularly the anterior cingulate and superior prefrontal gyri (Nagata et al, 2000; Yang et al, 2002), has been highlighted as predominantly hypometabolic. A relationship between frontal-type cognitive deficits and frontal lobe hypometabolism has been reported in SIVaD (Starkstein et al, 1996), and it has been speculated that the prefrontal cortex is particularly sensitive to leukoaraiosis as a result of disruption of the frontostriatal circuits. Despite these apparent differences, there is a clear overlap of hypometabolic patterns between VaD and AD (Mielke et al, 1992; Salmon et al, 1994). Accordingly, the severity of association cortex hypometabolism has been shown to be a major determinant of the severity of the dementia across both VaD and AD (Herholz, 1995; Mielke et al, 1992). However, this may in part reflect the problem that current diagnostic criteria for VaD will tend to bias towards mixed AD vascular mechanisms.
Even though based on the above considerations SIVaD and AD cohorts constructed on current clinical criteria are anticipated to have some degree of neuropathologic overlap, that is, Alzheimer-type and subcortical vascular lesions will be present in both cohorts, obviously some differential intensity is also to be expected. This differential should therefore be identifiable in their FDG-PET patterns. One retrospective study using the region-of-interest (ROI) type of analysis claimed good discrimination between VaD and degenerative dementia using the AD profile as reference (Mielke et al, 1992), but specificity and sensitivity were not reported. However, no study so far has addressed this issue using appropriate image analysis, that is, one that objectively searches the entire brain volume voxelwise for association patterns.
We have recently developed a novel method for multivariate analysis of large FDG-PET data sets that works at the voxel level and extracts principal components (PCs) that describe topographic profiles of intercorrelated voxels (Zuendorf et al, 2003). We validated this method in a cohort of healthy subjects, and showed that as expected the first PCs were highly correlated with age and displayed metabolic patterns consistent with known effects of age (Zuendorf et al, 2003).
To identify metabolic covariance patterns that would separate SIVaD from cpAD with adequate sensitivity and specificity, we applied here this method to a large FDG-PET data set of age- and dementia severity-matched patients with mild-to-moderate SIVaD and cpAD clinically diagnosed using current criteria, and contrasted them to a large sample of healthy subjects (the data were gathered in the framework of the EC-funded multicenter study ‘Network for Efficiency and Standardisation of Dementia Diagnosis’, or NEST-DD). After the multivariate principal component analysis (PCA), canonical variates analysis (CVA) was applied across the PCs and the three samples so as to extract independent ensembles of voxels best describing each subject categories. Based on the literature, we made the specific hypotheses that the AD metabolic profile (i.e., involving mainly the posterior association cortex and posterior cingulate) would better characterize cpAD, and that a profile of hypometabolism involving the superior frontal regions, anterior cingulate, primary cortices, basal ganglia, and cerebellum would characterize SIVaD.
Materials and methods
Subjects (Table 1)
Three groups of subjects, namely SIVaD, cpAD, and healthy controls, were studied. A requirement in multivariate analysis is that the samples are both large and of the same size to ensure adequate power and avoid sample imbalance, respectively. Only mild-to-moderate dementia patients were included (se below). In addition, to facilitate the analysis, the SIVaD and cpAD groups were constructed so as to be of similar age and MMSE scores. To this end, all suitable SIVaD subjects in the NEST-DD database were first extracted; we then constructed a sample of cpAD of the same size, age, and MMSE score same as the SIVaD sample; and finally, we made up a sample of healthy controls of the same size as, and with age as close as possible to, that of the SIVaD and cpAD samples. The SIVaD sample included 51 subjects (32 males, 19 females), all diagnosed with probable VaD according to the NINCDS-AIREN criteria (see below), but with only subcortical lesions (excluding ‘strategic dementia’, that is, bilateral thalamic stroke). The cpAD sample also included 51 subjects (17 males and 34 females), diagnosed with probable AD according to the NINDS-ADRDA criteria (see below). Neither age nor MMSE differed between the SIVaD and the cpAD samples (67.7 ± 9.4 and 69.8 ± 8.1 years, and 23.9 ± 3.6 and 23.1 ± 3.2, respectively). The 51 normal controls (NCs) included 27 males and 24 females, with a mean age of 59.5 (± 7.1) years, significantly less than the SIVaD and cpAD groups (see Table 1).
Demographics, gender, MMSE, and Hachinski scores for the three groups of subjects
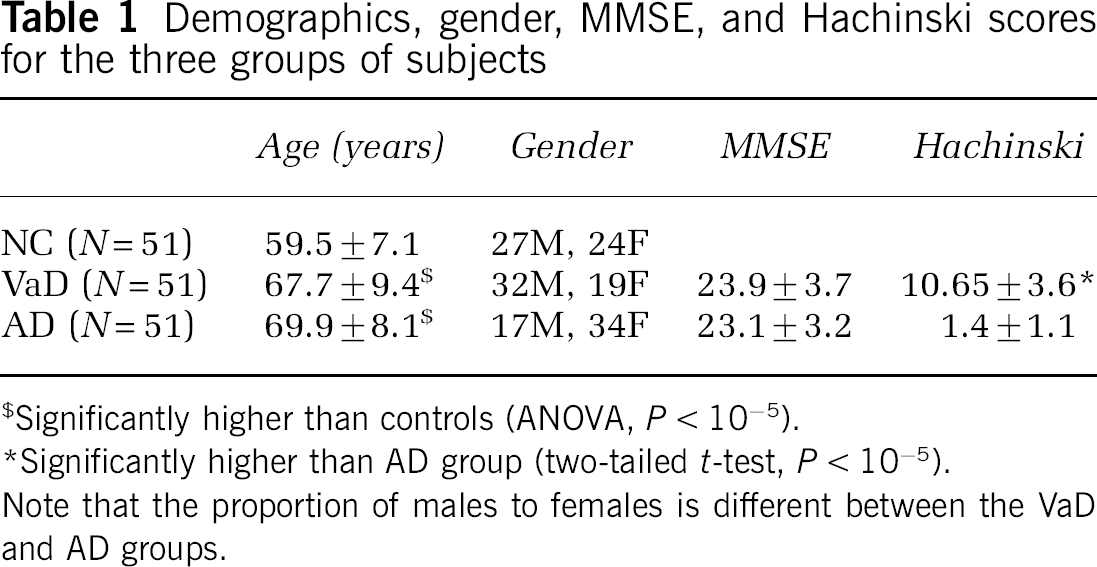
Significantly higher than controls (ANOVA, P < 10−5).
Significantly higher than AD group (two-tailed t-test, P < 10−5).
Note that the proportion of males to females is different between the VaD and AD groups.
The data used in this study originated from several European PET centers collaborating in NEST-DD (Herholz et al, 2002). The NCs and patients were prospectively recruited in NEST-DD according to the standard criteria for healthy status, SIVaD and cpAD; however, for logistical reasons, collection of ancillary data became prospective only halfway into NEST-DD. All patients were in a mild-to-moderate stage of dementia (MMSE range: 16 to 28; although one patient in the SIVaD group had an MMSE of 9, he was able to complete the neuropsychological testing, documenting less severe dementia than suggested by the MMSE, so was not excluded).
The diagnosis of probable SIVaD was based on the National Institute of Neurological Disorders and Stroke-Association Internationale pour la Recherche et l' Enseignement en Neurosciences (NINDS-AIREN) criteria (Roman et al, 1993). These criteria were obtained from clinical interview with the patient and caregiver; neurologic examination; neuropsychological examination; and structural imaging. The NINCDS-AIREN criteria include all of the following: (1) dementia; (2) cerebrovascular disease as evidenced by focal neurology and positive computed tomography or magnetic resonance imaging (MRI); and (3) a relationship between the two inferred from the onset of dementia within 3 months of a recognized stroke, or abrupt deterioration, fluctuations, or stepwise progression of the cognitive deficit (Roman et al, 1993). Exclusion criteria included major depression, education lower than 4 years of schooling, epilepsy, head trauma with permanent brain lesion, and major systemic disease with disturbance of brain function. The NINDS-AIREN criteria for probable VaD have been validated against neuropathologic gold standard in two studies, both of which documented a very high specificity for these criteria, that is, they efficiently exclude patients with neuropathologic criteria for AD, either pure or mixed with vascular lesions (Gold et al, 2002; Zekry et al, 2002a). Only patients with subcortical ischemic vascular lesions were included in this study, that is, the presence of cortical infarcts was a cause of exclusion.
The cpAD patients were recruited based on the NINDS-ADRDA criteria (McKhann et al, 1984).
The healthy subjects were recruited based on the following strict inclusion and exclusion criteria: normal general and neurologic examination; absence of cerebrovascular risk factors, mental disorder, substance abuse, head trauma; absence of significant MRI or biologic abnormality at standard blood tests; and no incipient dementia according to a memory test battery.
To avoid head motion during scanning, all the patients studied here were fully cooperative.
Ethics approval was obtained and informed consent was obtained from all subjects.
Positron Emission Tomography
General information about the PET data acquisition is detailed elsewhere (Herholz et al, 2002). All PET data were acquired with scanners that have a full field of view. All scanners used were of high spatial resolution (range: 3.6 to 6.7mm in the x, y plane and 2.46 to 5.30 mm in the z direction) (see Herholz et al, 2002 for details), and any differences were cancelled in the image-processing steps (see below). Studies were performed during quiet wakefulness with eyes closed and ears unplugged after intravenous injection of 110 to 370 MBq of 18F-2-fluoro-2-deoxy-D-glucose. Images of 18F-FDG distribution in the brain were used for analysis; the required minimum scan starting time was 30 mins after tracer injection. Scan duration was generally 20 mins. Images were reconstructed using filtered back-projection including correction for measured attenuation and scatter using standard software as supplied by the various scanner manufacturers.
Data Analysis
General strategy: The analytic strategy used in this investigation consisted firstly of applying PCA to the whole sample made of the NC, SIVaD, and cpAD groups, so as to obtain the new coordinates of the subjects or PC-scores. With the aim to extract the PET pattern related to ‘dementia’ (i.e., common to both SIVaD and cpAD) and the PET pattern specific to each patient group relative to other groups, the PC-scores were then used as feature matrix for the CVA. To interpret the neurobiologic meaning of the CVA, images representing the canonical variates were created for visual inspection.
Image processing: The 18F-FDG uptake images were spatially normalized by affine 12-parameter transformation using the SPM99 standard MNI brain template (Wellcome Department of Cognitive Neurology, London, UK). All normalized images were first formatted to a 79 × 95 × 68 matrix with 2 × 2 × 2 mm voxel size, then smoothed using a 12 mm full-width half-maximum isotropic kernel, and finally scaled to the same mean value. We used the brain mask designed and used in our previous studies (Zuendorf et al, 2003), which is derived from an average FDG-PET image of normalized brains using a fixed threshold with additional manual editing to remove extracerebral voxels. To reduce the matrix size, the multivariate analysis was constrained to grzy matter voxels including cerebellum. To this end, all voxels labelled as white matter or ventricles in the Talaraich Daemon atlas (University of Texas Research Imaging Center, http://ric.uthscsa.edu/projects/talairachdaemon.html/) were removed from this mask, using M Brett's MNI-to-Talairach transforms (www.mrc-cbu.cam.ac.uk/Imaging/mnispace.html).
Statistical analysis: The principles and validation of the PCA used here have been described in detail in Zuendorf et al (2003). The PCA was applied to the mean-removed (n × P) matrix, where n is the number of images and P the number of voxels (i.e., variables). The output data of the PCA were the following:
PC i : PC, which are new axes, with i running from 1 to N, where N is the number of observations (i.e., subjects). In the present case, the PCs were three-dimensional images, and numbered N–1, that is, 51 × 3–1, or 152.
Li: Eigenvalues of the covariance matrix, giving the variance explained by the PC i .
PC i -score: Projections of the observations on PC i , being the coordinates of the observations in the new space.
To assess the robustness of the PCA, two measures were obtained: (i) the T2 Hotelling test, to detect outliers (Hotelling, 1931; Jackson, 1991); and (ii) a calculation of the individual contribution of one observation to each PC, which was performed using the formula: [1/N–1] × (PC i _score(j))2/L i , where PC i _score(j) is the coordinate of the jth individual on PC i . A large value, especially for the first PCs, is a reliable indication that removing the corresponding observation might dramatically change the results, that is, that the PCA is not stable (Saporta and Tambrea, 1993).
To maximize the separation between the three groups according to the plan detailed above, the PC-scores were then used as features vector in a multivariate analysis of variance (CVA) to obtain the canonical variables (CVs) that maximize the ratio W−1B, where W is the within-group sum-of-squares and crossproducts matrix, and B the between-group sum-of-squares and crossproducts matrix. The eigenvectors of W−1B form the coefficients for the CVs, and they are scaled so that the within-group variance of the CVs is 1. The CVs are linear combinations of the original variables (in our case, the PC-scores). Specifically, the first CV is the linear combination of the columns of the PC-scores that affords the best separation between groups. This means that among all possible linear combinations, it is the one with the most significant F-statistic in a one-way analysis of variance (ANOVA). The second CV has the maximum separation subject to it being orthogonal to the first CV, and so on. By using the coefficients used in the calculation of the CVs, a linear combination of the images (PCs) is worked out to determine the metabolic pattern best separating the groups.
Results
Results of the PCA
The PCA analysis was stable and robust according to Hotelling's T2, which showed no outlier (Figure 1).
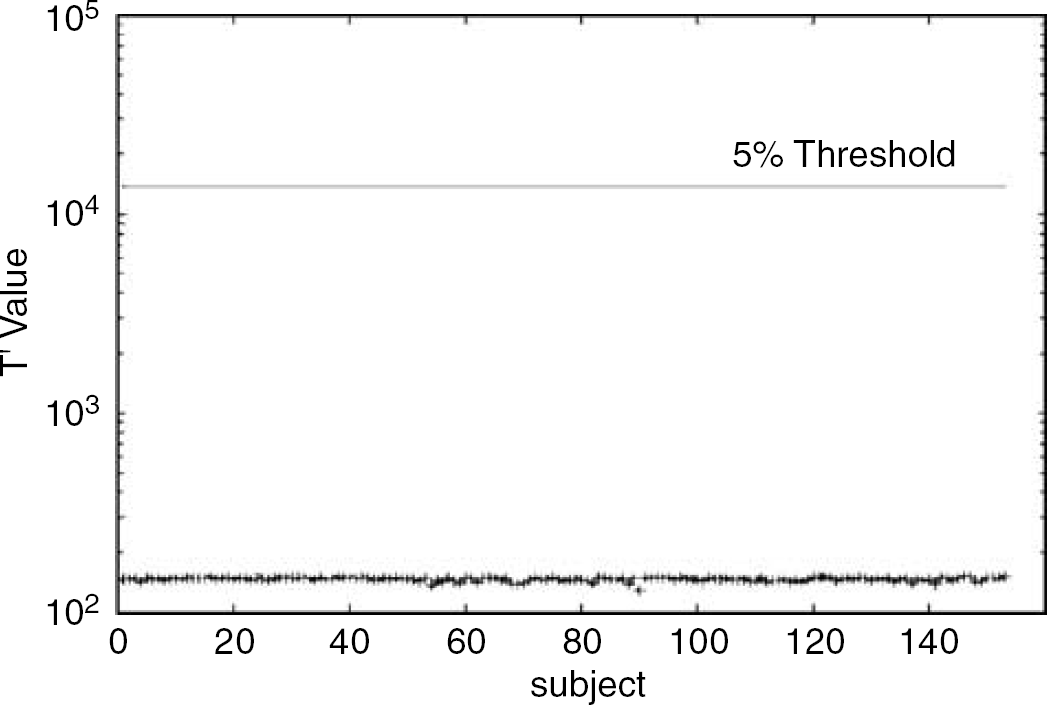
Hotelling's T2 values of the subjects using a base 10 logarithmic scale for the y-axis and a linear scale for the x-axis (subjects) showing the 1% threshold. Principal components (PCs) related to age are removed. There was no outlier.
The individual contribution for the first 12 PCs is shown in Figure 2, which highlights that no individual subject contributed abnormally to any of the 12 PCs. These results reflect the overall satisfactory quality of the subjects in all three samples.
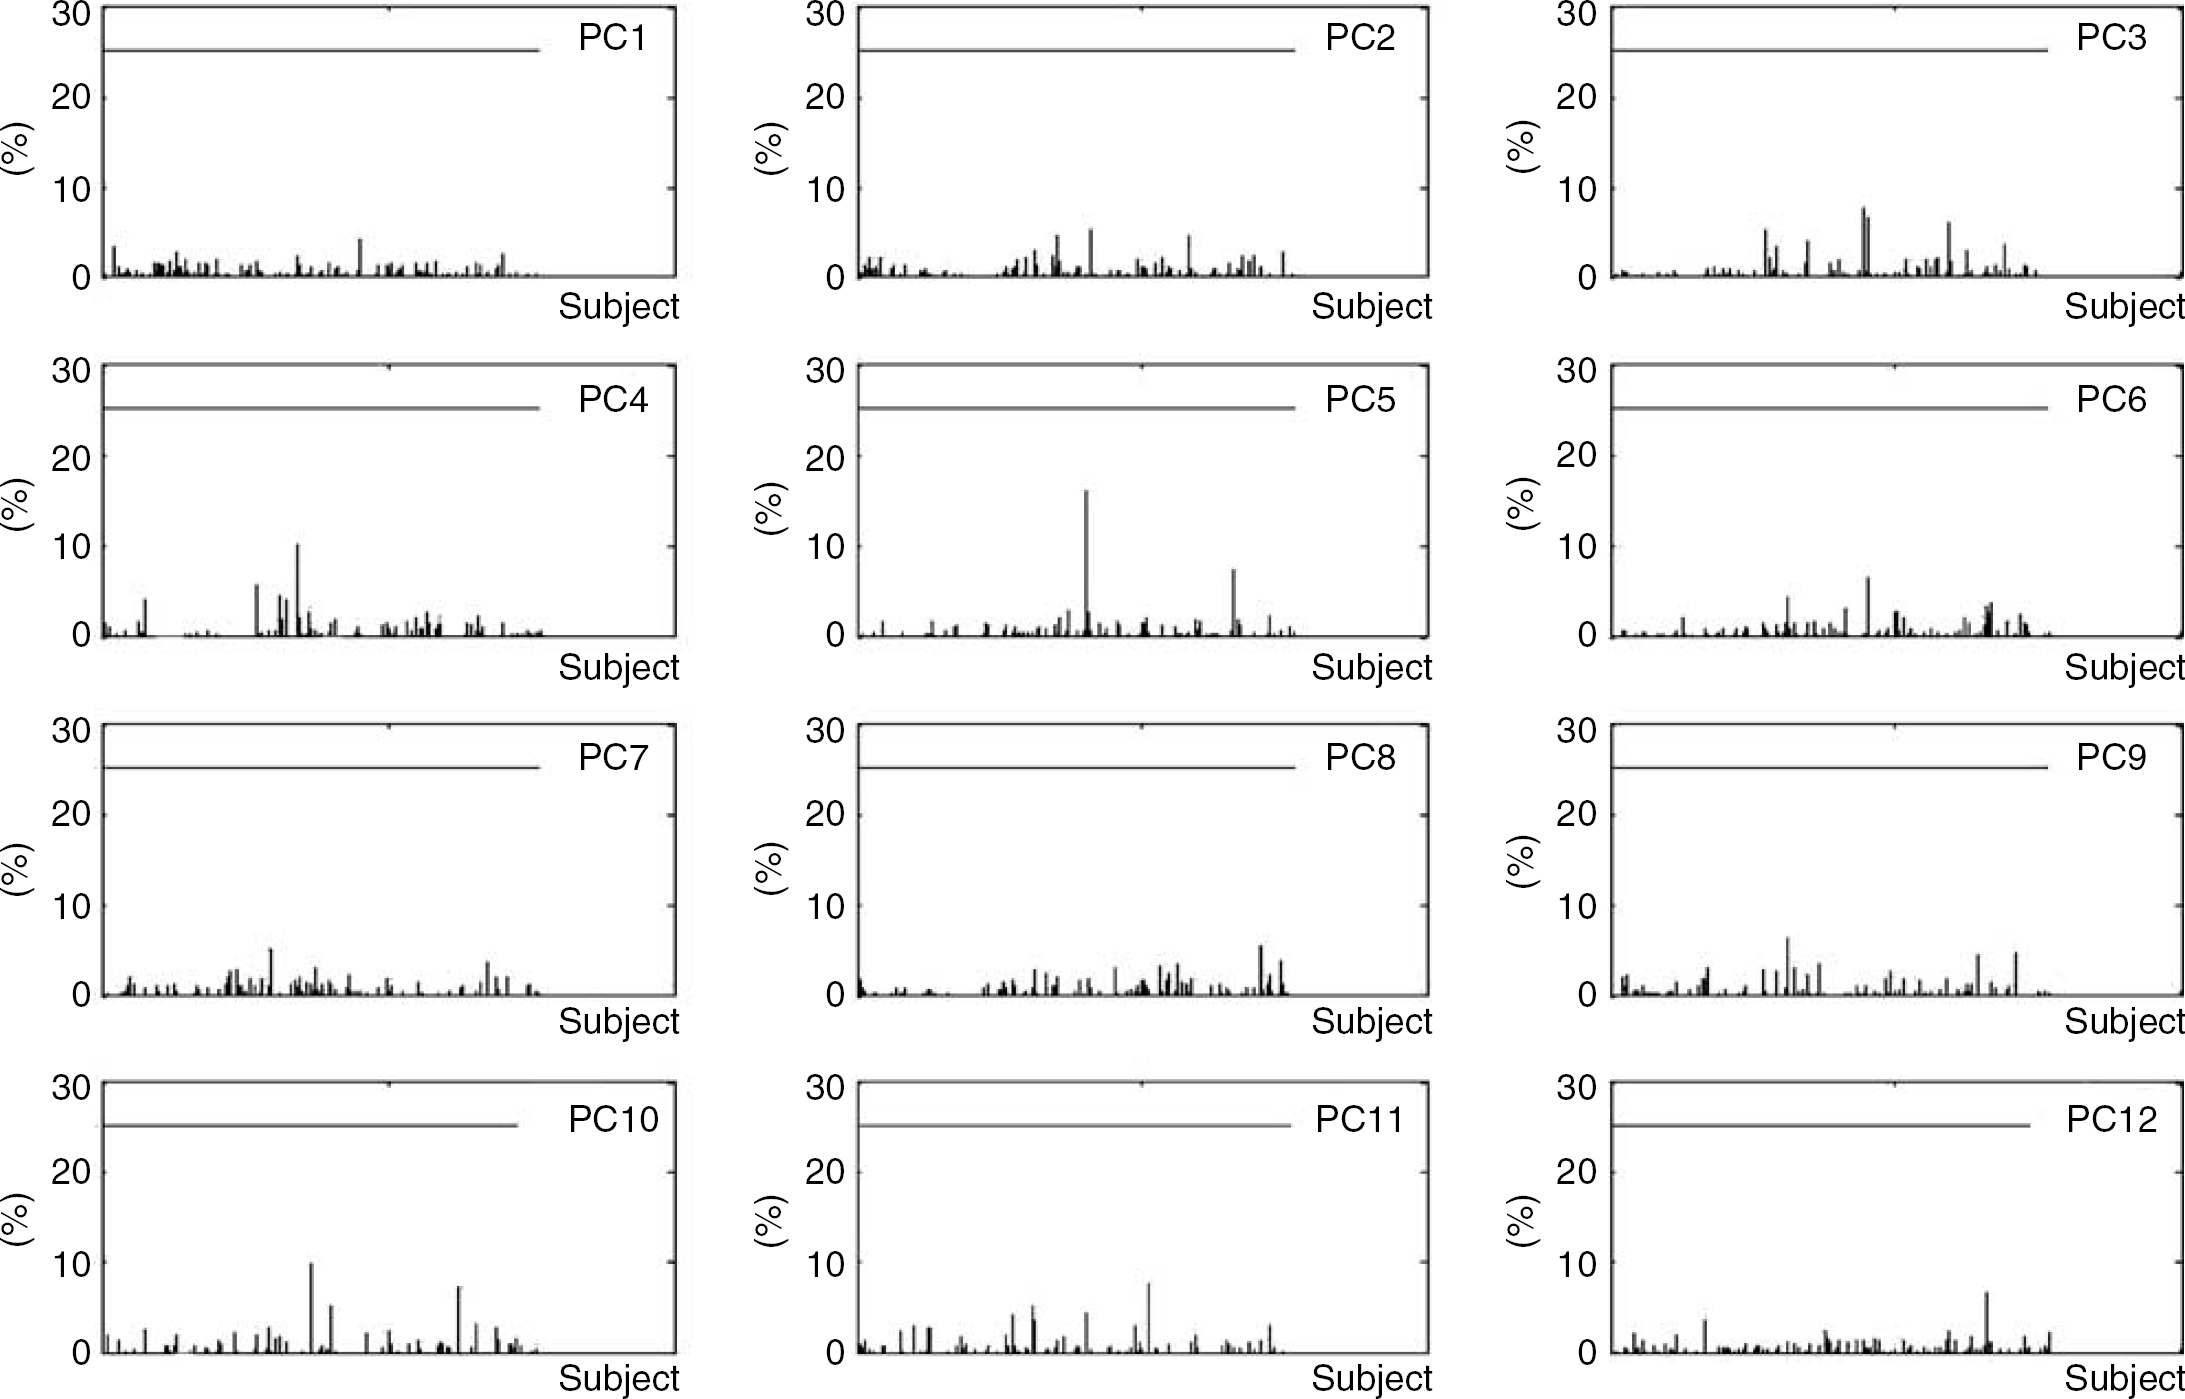
The individual contribution in percentage for the first 12 principal components (PCs). The 25% level of contribution is plotted. No subject contributed more than 25% for any PC (see Materials and methods).
Out of the 152 PCs, five (PC1,2,3,7,8) were related to age at the P < 0.05 uncorrected level. As per standard practice, these PCs were dismissed from the data set before the CVA procedure so as to remove any confounding effect of age on the PET patterns related to dementia and specific diagnosis.
Results of the Canonical Variates Analysis
The CV scores of the subjects along the first two CVs, named CV1 and CV2 is shown in Figure 3. The CV1 axis, which explained the largest portion of the total variance (48.9%), completely separated the SIVaD and cpAD groups (i.e., both sensitivity and specificity equalled 100%), whereas the NCs were distributed almost equally across its origin, that is, they are neutral about CV1. This axis can therefore be interpreted as the differentiation axis between VaD and AD. In contrast, almost all the NCs scored positively on CV2 (which explained 9% of the total variance), whereas almost all SIVaD and cpAD subjects scored negatively. This axis therefore can be interpreted as reflecting the presence of dementia, that is, the common feature of the SIVaD and cpAD groups. The sensitivity and specificity of the CV2 for differentiating NCs from demented subjects were 72% and 96%, respectively.
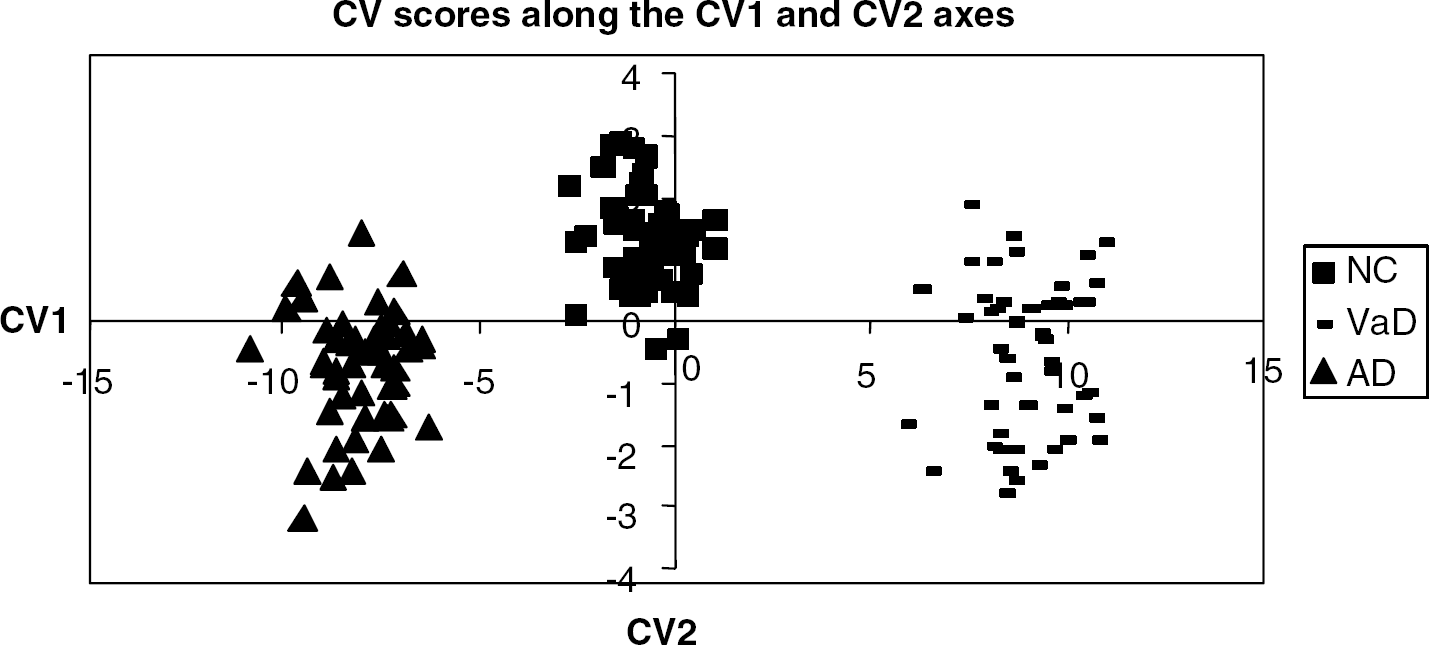
The canonical variate (CV) scores of the subjects in the two-dimensional space spanned by CV1 and CV2, showing complete separation of vascular dementia (VaD) and Alzheimer disease (AD) along the CV1 axis, and excellent though not perfect separation of normal controls and demented subjects (both VaD and AD) along the CV2 axis.
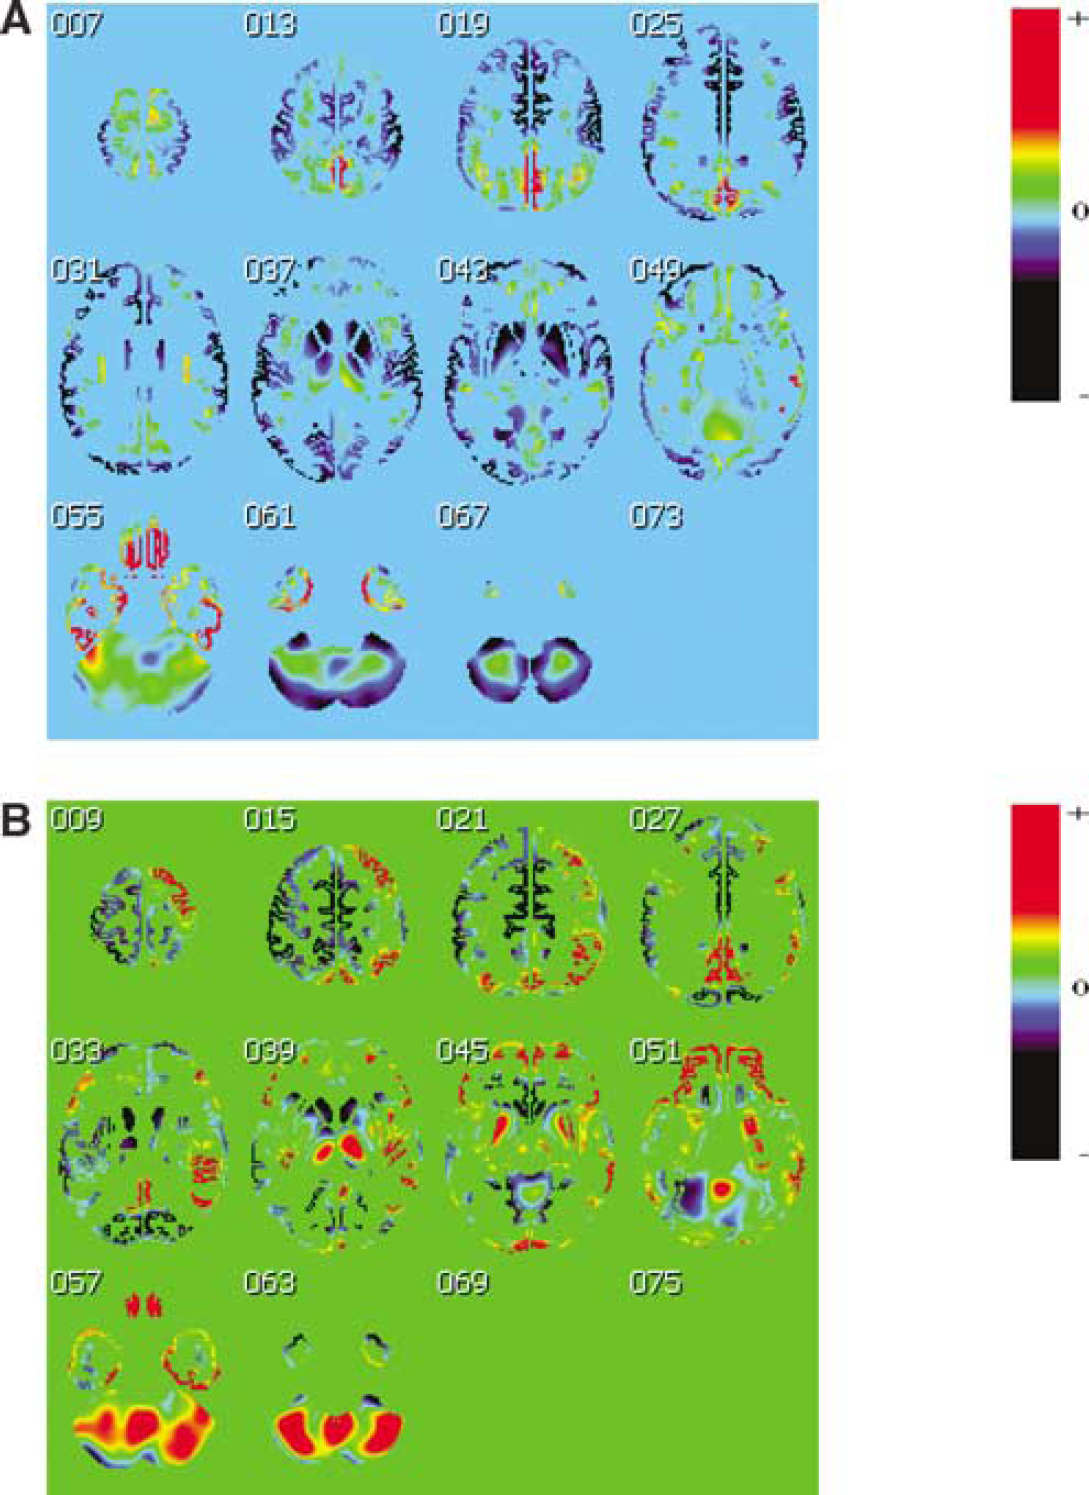
Illustrative cuts depicting CV1 are shown in Figure 4A. As the SIVaD subjects score positively on this axis and the cpAD score negatively, the corresponding relative hypometabolism in SIVaD shows as blue, whereas the relative hypometabolism in cpAD shows as yellow-red. Relative hypometabolism in SIVaD was particularly marked (i.e., shown in deep blue) in: the caudate and lenticular nuclei; anterior thalamus; cerebellar cortex; sensorimotor/premotor, auditory and visual (striate and extrastriate) cortices; insula; dorsal part of the middle temporal gyrus; frontal poles; and anterior cingulate gyrus. Conversely, the most severely hypometabolic areas in cpAD (shown in red-yellow-light green) included the anterior hippocampal, entorhinal, perirhinal, and temporo-polar cortices; inferior temporal and fusiform (anterior part) gyri; orbitofrontal cortex; precuneus, posterior cingulate (superior part), and posterior parietal (BA 7) cortices.
Topographic patterns of canonical variate (CV)1 (
Illustrative cuts depicting CV2 are shown in Figure 4B. Red (positive) depicts hypometabolic areas common to cpAD and SIVaD subjects relative to the NCs. They mainly concern the posterior parietal cortex (more extensively on the right), precuneus, and posterior cingulate/retrosplenial cortex; prefrontal cortex (more extensively on the right) including orbitofrontal cortex; posterior part of the lenticular nuclei; posterior thalamus; insula (more clearly on the right); temporal neocortex (more on the right); and the anterior hippocampus and parahippocampal gyrus; parts of the cerebellum also contributed to CV2. There was a significant (P < 0.01) correlation between CV2 scores and the MMSE scores across the entire sample of demented subjects (i.e., both SIVaD and cpAD) as well as within each sample (P < 0.05 for both) (see Figure 5 for illustration).
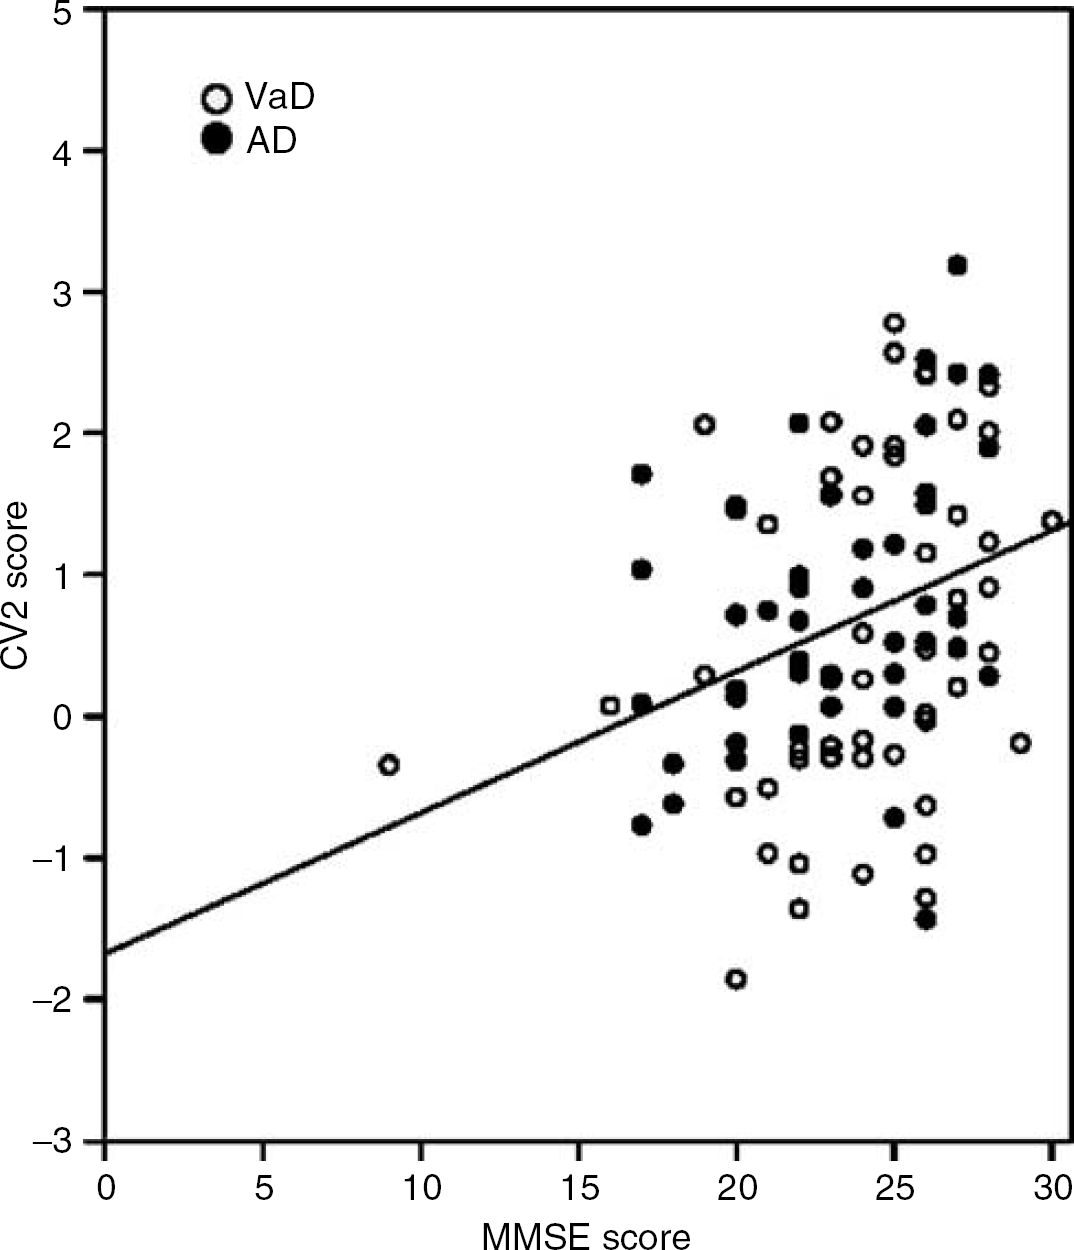
Relationship between canonical variate (CV)2 scores and Mini-Mental-State examination (MMSE) scores in the demented subjects. There was a significant positive correlation (P < 0.01) across the two samples such that the more negative the CV2 pattern the worse the MMSE. The correlation remained significant (P < 0.05) in each group separately (filled dots: Alzheimer disease (AD); open circles: vascular dementia (VaD)).
Discussion
This study is the first to apply voxel-based multivariate analysis to investigate whether it is possible to distinguish VaD from AD on FDG-PET. Using our novel method (Zuendorf et al, 2003), we were able to identify a canonical variate, that is, a linear combination of PCs, that differentiated the samples of SIVaD and cpAD patients with 100% accuracy. The topographical patterns that characterized these two clinical groups were largely consistent with our a priori hypothesis, that is, the SIVaD versus cpAD hypometabolic pattern involved mainly the superior frontal regions, anterior cingulate, primary cortices, basal ganglia, and cerebellum, whereas the cpAD versus SIVaD hypometabolic pattern involved the posterior association cortex and posterior cingulated area. Interestingly, the latter pattern also involved the mesial temporal cortex and adjacent temporal neocortex.
The number of subjects used in this work (N =153) was large enough to allow the PCA to be stable and independent of a particular subset of data. The stability of the PCA was assessed by means of both Hotelling's T2 test and the individual contribution. As shown in Figure 1, the former showed no single outlier, whereas Figure 2 shows that the individual contribution to the first PCs does not exceed the 25% threshold for any subject. This documents that no subject influenced abnormally the calculation of the axes, a good indication of the stability of the decomposition of the data set. To support the stability of the CVA, we performed several hundreds of additional PCAs, removing randomly 5, 10, or 15 subjects from the data set each time, and the results were compared with the full-sample PCA; neither CV1 nor CV2 were substantially affected (data not shown). This further confirmed that no outlier contributed abnormally to the axes, suggesting that despite its data-driven nature, the analysis was reproducible within the sample, that is, its results are meaningful.
As expected in this sort of data set, the effect of age was predominant. The first two PCs, explaining 28% of the total variance, were significantly correlated with age (P < 0.01, Bonferroni corrected). Removing these two PCs as well as other less but still significantly age-related PCs ensured that the analysis would not be confounded by this effect. Correlations between CV scores and other potentially confounding variables such as gender and scanner resolution (either in-plane or axial) were not significant at the P < 0.01 uncorrected level (data not shown). Thus, the information expressed in CV1 and CV2 can be safely considered as being virtually exclusively linked to the two clinical categories of SIVaD and cpAD. To further test this strategy without the SIVaD sample, the PCA was applied on the NCs and cpAD samples only, followed by the CVA (again removing the age-correlated PCs). The first CV separated both groups successfully and its pattern was very similar to the typical AD hypometabolic pattern (data not shown).
When taking the whole sample in the analysis (i.e., including the NC, SIVaD, and cpAD subjects), the PCA followed by CVA was able to completely separate the SIVaD and pcAD subjects along the first canonical variate. The corresponding image, plotted in Figure 4A, reveals that lower metabolism in SIVaD as compared with cpAD mainly concerned the basal ganglia, thalamus, cerebellum, sensorimotor, dorsal premotor and auditory cortices, middle temporal gyrus, striate and extrastriate cortices, and anterior cingulate gyrus. As detailed in the Introduction, this pattern is consistent with the available literature comparing VaD to age-matched controls (Shyu et al, 1996; Sultzer et al, 1995; Yang et al, 2002; Yao et al, 1990), as well as with the few studies that have directly compared VaD with AD (Mielke et al, 1992; Nagata et al, 2000; Starkstein et al, 1996).
In leukoaraiosis, either without, or with only mild, cognitive changes (i.e., not fulfilling the VaD criteria), cortical metabolism is not significantly affected unless substantial cognitive impairment is present (De Reuck et al, 1992; DeCarli et al, 1995; Meguro et al, 1990; Sabri et al, 1999). Sultzer et al (1995) found a significant correlation between the degree of cortical hypometabolism and the extent of subcortical lesions. Studying a large group with a wide range of cognitive impairment, a recent study found that subcortical white matter ischemic lesions were associated with reductions in frontal, but not temporoparietal, cerebral metabolic rate of glucose (CMRglc) (Reed et al, 2004; Tullberg et al, 2004). This result would be consistent with our findings.
Conversely, the most hypometabolic areas in cpAD relative to SIVaD were the anterior hippocampal, entorhinal, perirhinal, and temporopolar cortices; inferior temporal and fusiform gyri; orbitofrontal cortex; and precuneus, posterior cingulate (superior part), and posterior parietal (BA 7) cortices. Again, this pattern is consistent with the well-known hypometabolic pattern of AD (Baron, 1998; Herholz, 1995), and also with the studies that directly compared AD with VaD (Mielke et al, 1992). The involvement of the hippocampal area in this pattern is of particular interest because of the prominent neuropsychological deficit in episodic memory that characterizes cpAD versus SIVaD (Graham et al, 2004); conversely, our finding of prefrontal cortex and anterior cingulate involvement in SIVaD versus cpAD fits well with the fact that executive dysfunction characterizes the latter group.
These differences in metabolic pattern between SIVaD and cpAD likely reflect the distribution of specific pathologies. The hypometabolic pattern in cpAD is consistent with the fact that Alzheimer-type pathology mainly involves the mesial temporal and association cortices (Delacourte et al, 1999), whereas the cortical hypometabolic pattern of SIVaD is thought to reflect disconnection from the basal ganglia/thalamus as well as among cortical regions, according to the concept of diaschisis (Baron, 1998; Herholz, 1995; Pappata et al, 1990). However, animal studies have shown that disconnection can also be a factor in explaining part of the observed hypometabolism in AD, for example, in the posterior cingulate cortex (Meguro et al, 1999).
The CV2 canonical variate separated the NCs from the demented subjects, with some overlap however. This hypometabolic pattern, common to the SIVaD and cpAD, mainly concerned the posterior parietal cortex, precuneus, and posterior cingulate/retrosplenial cortex; prefrontal and orbitofrontal cortex; and insula, temporal neocortex, and anterior hippocampal region, with predominance on the right hemisphere for several of these regions. The existence of a metabolic pattern common to AD and VaD and underlying the clinical diagnosis of dementia across both groups was reported previously (Mielke et al, 1992), and several of the above regions overlap with the pattern reported by Mielke et al, notably the frontal association and temporoparietal association cortices. Our finding that the hippocampal region also participated in this common pattern would fit with the idea that there is an overlap in pathology between AD and VaD, that is, the latter includes AD pathology affecting the mesial temporal region so as to fulfill the diagnosis of dementia (see Introduction). This pattern comprising the association cortices, posterior cingulate and mesial temporal areas, would therefore represent the metabolic counterpart of the clinical diagnosis of dementia, which is heavily weighted by episodic memory and cortical signs. Accordingly, neuropsychological studies report that visuospatial ability, language, and semantics are equally impaired in VaD and AD (Graham et al, 2004). Hypometabolism in these regions underlies deficit in these cognitive functions not only in cpAD but also in mild cognitive impairment and amnesic syndromes (Aupee et al, 2001; Chetelat et al, 2003; Desgranges et al, 1998). This pattern is also generally consistent with that previously determined using an ROI approach to correlate with the severity of the dementia across VaD and cpAD (Herholz et al, 1990). Accordingly, the individual scores for CV2 significantly correlated with MMSE scores across the two cohorts of demented subjects, such that the more marked the CV2 metabolic profile, the worse the MMSE (Figure 5). Interestingly, there was a predominance of this hypometabolic pattern on the right hemisphere for several regions. We have no straightforward explanation for this.
Conclusion
Our study shows that multivariate methods such as PCA and CVA are powerful to highlight independent functional networks in neurodegenerative diseases, defined by high covariance of metabolism across different sets of brain areas. The decomposition of the data variance along orthogonal and uncorrelated axes allows the extraction of features otherwise concealed within the data set. By maximizing the separation between the groups, the CVA allowed us to extract the differential metabolic pattern between VaD and AD, and to contrast it with the common pattern underlying dementia.
Footnotes
Acknowledgements
We thank P Simon Jones for help with illustrations.