
Abstract
The metabolic response to brain activation in exercise might be expressed as the cerebral metabolic ratio (MR; uptake O2/glucose + 1/2 lactate). At rest, brain energy is provided by a balanced oxidation of glucose as MR is close to 6, but activation provokes a ‘surplus’ uptake of glucose relative to that of O2. Whereas MR remains stable during light exercise, it is reduced by 30% to 40% when exercise becomes demanding. The MR integrates metabolism in brain areas stimulated by sensory input from skeletal muscle, the mental effort to exercise and control of exercising limbs. The MR decreases during prolonged exhaustive exercise where blood lactate remains low, but when vigorous exercise raises blood lactate, the brain takes up lactate in an amount similar to that of glucose. This lactate taken up by the brain is oxidised as it does not accumulate within the brain and such pronounced brain uptake of substrate occurs independently of plasma hormones. The ‘surplus’ of glucose equivalents taken up by the activated brain may reach ~ 10 mmol, that is, an amount compatible with the global glycogen level. It is suggested that a low MR predicts shortage of energy that ultimately limits motor activation and reflects a biologic background for ‘central fatigue’.
Introduction
Daily activities such as walking and cycling become automated to an extent where they are executed without mental awareness. In contrast, a mentally demanding activity would be expected to require comparatively more brain activity and already Lavoisier (1789) reasoned that such enhanced mental effort should be measurable. In this context, physical exercise is not only a ubiquitous part of daily living, but might be considered as an intensive and composite stimulus to the brain. Thus, exercise involves a diversity of cerebral functions, including cognitive and sensorimotor aspects, and the magnitude of the stimulus might be modulated by the intensity of the task. Furthermore, exercise is often accompanied by shifts in the supply of fuel to the brain, for example, high arterial lactate, and in elevated levels of systemic hormones. As a paradigm of cerebral activation, uniquely, exercise marks motor neuron output and thereby neuronal function. Notably, a decline in motor neuron output contributes to the involuntary decrease in force of contraction and divides fatigue into factors within the muscle and those within the central nervous system, termed ‘central fatigue’ (Nybo and Secher, 2004).
Assessment of brain activity hinge on the currently recognised relationships between its physiologic basis, that is, propagation of action potentials and release of neurotransmitters with perturbation and restoration of membrane potentials and of the extracellular milieu, and the need for enhanced cerebral blood flow (CBF) and consumption of oxygen. However, the brain-imaging techniques applied to gauge these variables are employed with difficulty during exercise and, accordingly, the cerebral metabolic response is assessed as that of the whole brain by arterial-internal jugular venous differences (A-JV). This paper reviews brain metabolism in exercise, expressed by the reduction in the cerebral metabolic ratio (MR) of O2 versus substrate. Such disproportional cerebral uptake of substrate relative to that of O2 is provoked during demanding exercise as it characterizes cerebral activation in general. Focus centres on the aspects of exercise that decrease MR and on the energy sources besides glucose that fuel metabolism, particularly lactate. Also discussed is the influence from blood hormones and metabolites. It is suggested that the reduction in MR is supported by the neurotransmitter noradrenaline and replenishment of glycogen deposits. In perspective, a link is proposed between brain energy metabolism and neuronal function.
The Cerebral Metabolic Ratio
Cerebral Activation is not Reflected in Global Cerebral Blood Flow and CMRO2
During whole-body exercise, measurement of regional cerebral blood flow (rCBF) and metabolism is hindered by body movement and is feasible only as post- versus pre-exercise comparison, for example, with position emission tomography (PET) (Kemppainen et al, 2005; Tashiro et al, 2001) and single-photon emission computer tomography (SPECT) (Williamson et al, 1996). Alternatively, an increase in blood flow of ~ 25% is observed on the ‘arterial side’ of the activated brain region, as visualized with Doppler ultrasound in the internal carotid artery (Hellstrom et al, 1996) and as noted for the mean blood flow velocity (Vmean) in major cerebral arteries (Figure 1) (Ide and Secher, 2000; Jorgensen, 1995). These increases are not disturbed by exercise-induced fluctuations in the arterial blood pressure (Jorgensen et al, 1992) or sympathetic activity (Pott et al, 1997), and they remain sensitive to changes in arterial carbon dioxide (Linkis et al, 1995), that is, mirroring changes in brain perfusion rather than in the diameter of the insonated vessel (Serrador et al, 2000).
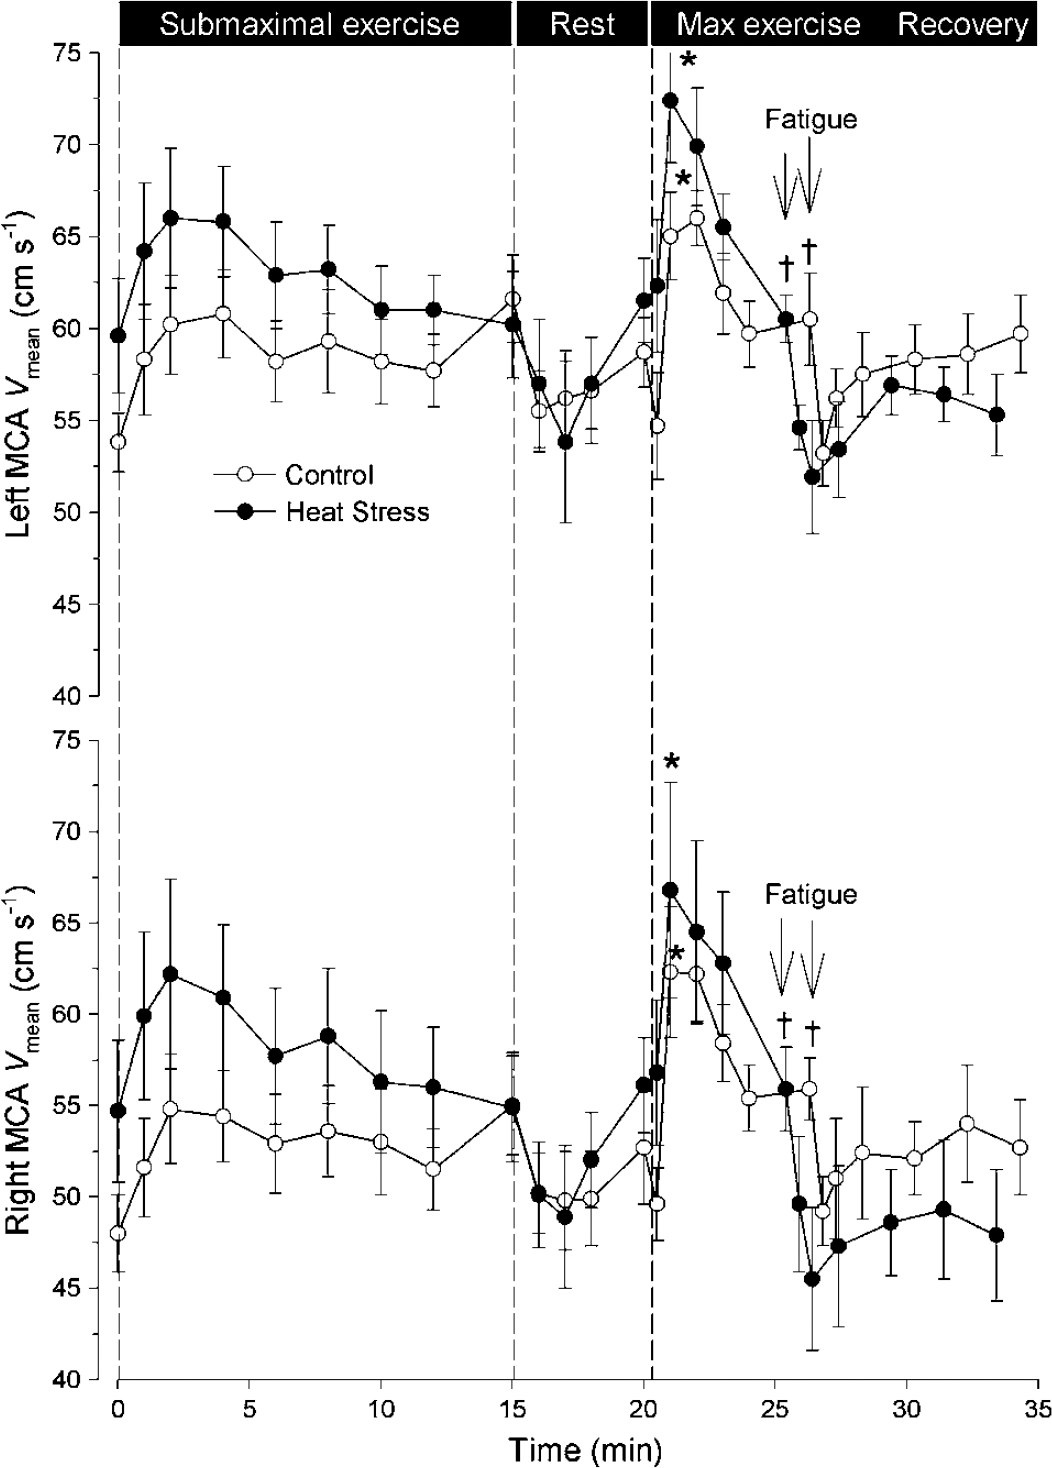
Mean blood flow velocity (Vmean) in the middle cerebral arteries (MCA) during and after submaximal and maximal exercise. In the left and right MCA, Vmean increases with exercise intensity, as shown during submaximal exercise and the initial phase of maximal exercise (–○–). At exhaustion, Vmean decreases are aggravated by heat stress (–•–). Data are mean ± s.e.m. from six subjects. For maximal exercise: different from the start, *P < 0.05; and peak value, †P < 0.05. Modified from Gonzalez-Alonso et al (2004).
However, when gauged on the ‘venous side’ by the golden standard of Kety and Schmidt (1945), global CBF and the cerebral metabolic rate of oxygen (CMRO2) remain remarkably stable. This is the case not only during vigorous exercise (Nybo et al, 2003a, b; Scheinberg et al, 1954) but overall in response to cerebral activation (Sokoloff et al, 1955) with rare exceptions (Madsen et al, 1995). Only when cerebral activity is enhanced grossly during seizures (Siesjo, 1978) or depressed during deep sleep (Madsen and Vorstrup, 1991) and anaesthesia do global CBF and CMRO2 change.
The stable CBF and CMRO2 impinge on the responsiveness of activated brain areas. Although some paradigms of brain activity lead to widespread increases in rCBF (Roland et al, 1987), the global CBF does not change, suggesting that, concomitantly, rCBF in other areas of the brain is depressed (Sokoloff et al, 1955), as also illustrated by transcranial Doppler ultrasound (Jorgensen et al, 1993). Such downregulation of activity in local brain areas concurrently with increases in other areas might be imagined to correspond to the difficulty of carrying out more than one complex task at a time, whether intellectual or physical. However, the depression of rCBF seems to be too modest to account for a stable global CBF. During exercise, the increase in Vmean in major cerebral arteries has been considered to represent vasoconstriction (Madsen et al, 1993), but also the stability of CBF, as determined by the Kety-Schmidt method, might be criticised: the assumption of a steady state is not met during several paradigms of cerebral activation including exercise, the blood transit time through the brain is unknown and the partition coefficient of the tracer between blood and brain is ascertained with inaccuracy (Kety and Schmidt, 1945). In contrast, mixing with venous blood from extra-cerebral tissue is considered negligible when the tip of the catheter is positioned in the superior venous bulb (Kety and Schmidt, 1948). However, the venous drainage of the brain may exhibit asymmetry. The cortical areas drain via the superior sagittal sinus, which in ~ 50% of subjects channel blood predominantly through to the right transverse sinus, in turn, forming the right internal jugular vein. In that case deeper cerebral structures drain via the inferior sagittal sinus to the left side, although some mixing does occur (Ferrier et al, 1993; Kety and Schmidt, 1948). Consequently, ~ 75% of subjects present with a larger right internal jugular vein (Cormio and Robertson, 2001; Dawson et al, 2004; Ide and Secher, 2000) of potential importance when ascertaining CBF and CMRO2. Furthermore, in the upright position, the internal jugular veins collapse (Dawson et al, 2004) so that venous outflow is shifted to alternative routes and most likely to the venous plexus surrounding the spinal cord (Schreiber et al, 2003), arguing that jugular venous sampling underestimates CBF and CMRO2.
To summarise, regional increases in CBF and CMRO2 are not reflected in the global values, perhaps due to downregulation of activity in nonactivated brain regions, to uncertainties of the Kety-Schmidt method or to the variation in anatomy of the cerebral venous drainage with respect to both the cerebral regions of interest and whether the exercising subjects is supine or upright.
Rest versus Brain Activation
Given the uncertainty associated with a CBF and CMRO2 determined by the Kety-Schmidt method, conveniently, during exercise acute changes in brain metabolism can be expressed as the MR between its uptake of O2 and that of glucose plus lactate.
For a state of resting wakefulness the MR is close to 6:1 (Figure 2), which implies that energy is provided almost entirely by oxidation of glucose, yielding carbon dioxide and water: 6 O2 + C6 H12Os (glucose) 6 H2O + 6 CO2. In fact, the resting MR is often ~5.7, as 5% to 10% of the glucose taken up undergoes glycolysis, evidenced by a slight lactate efflux, despite sufficient oxygen supply, and some might be used for biosynthesis (Siesjo, 1978).
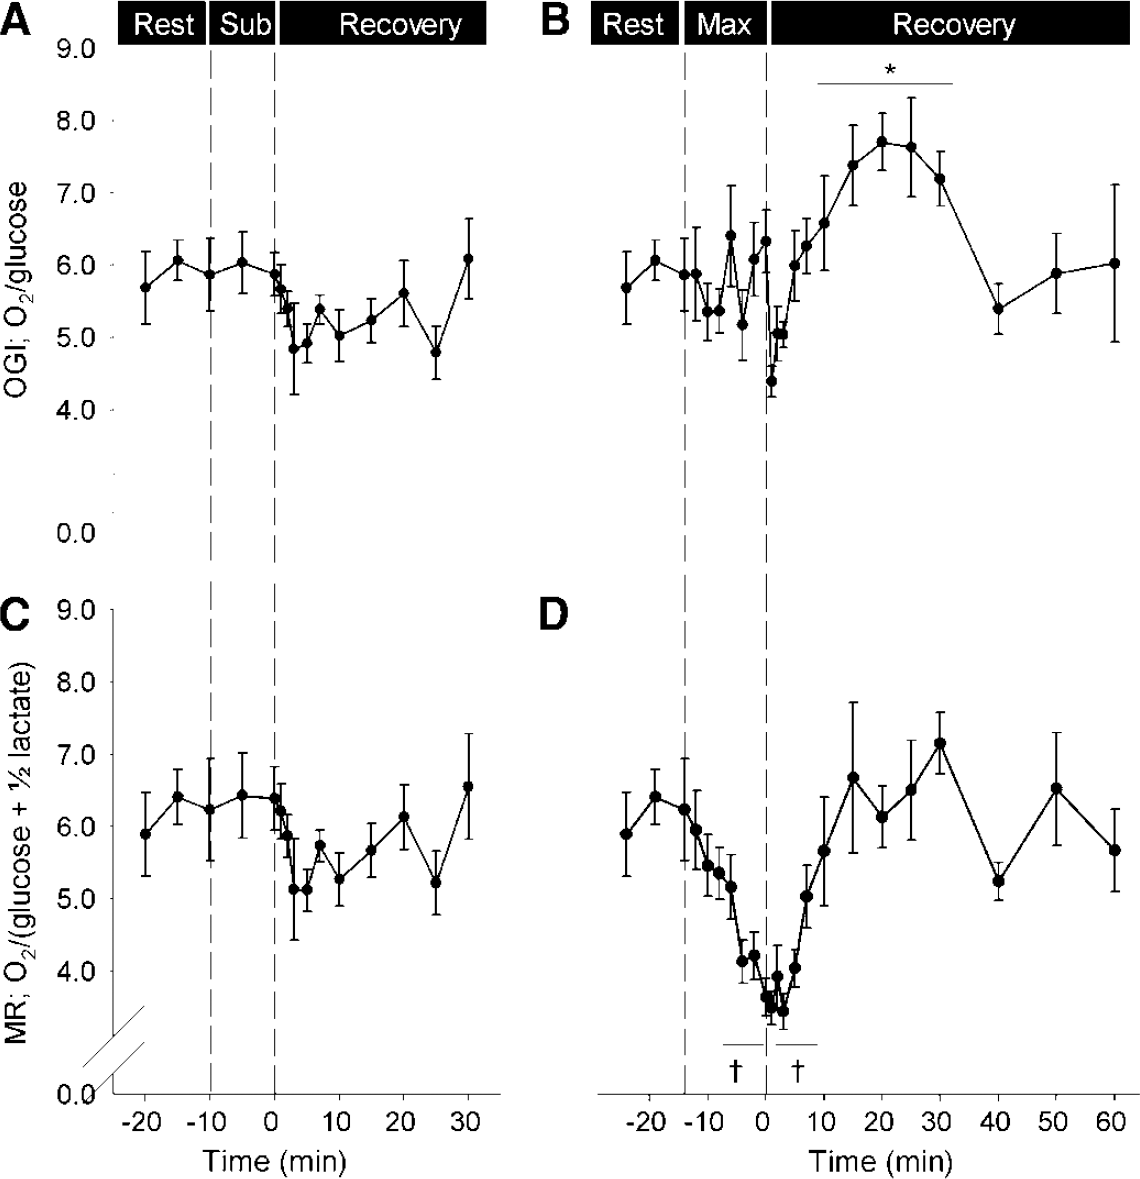
The cerebral uptake of O2/glucose (OGI) and of O2/(glucose + 1/2 lactate) (MR) in response to submaximal and maximal exercise. (
With activation of the brain, however, the cerebral metabolic rate of glucose (CMRglucose) increases (30% to 50%, as does CBF) out of proportion to CMRO2 (5% to 10%; Table 2), thereby reducing MR. Since first established (Fox et al, 1988), the enigma of a decreasing MR, and thereby how enhanced neuronal activity is fuelled, has received considerable attention (reviewed in Dienel and Cruz, 2003, 2004; Gjedde et al, 2002; Rothman et al, 2003; Shulman et al, 2001) and a brief summary can be provided.
Cerebral activation and the reduction in MR
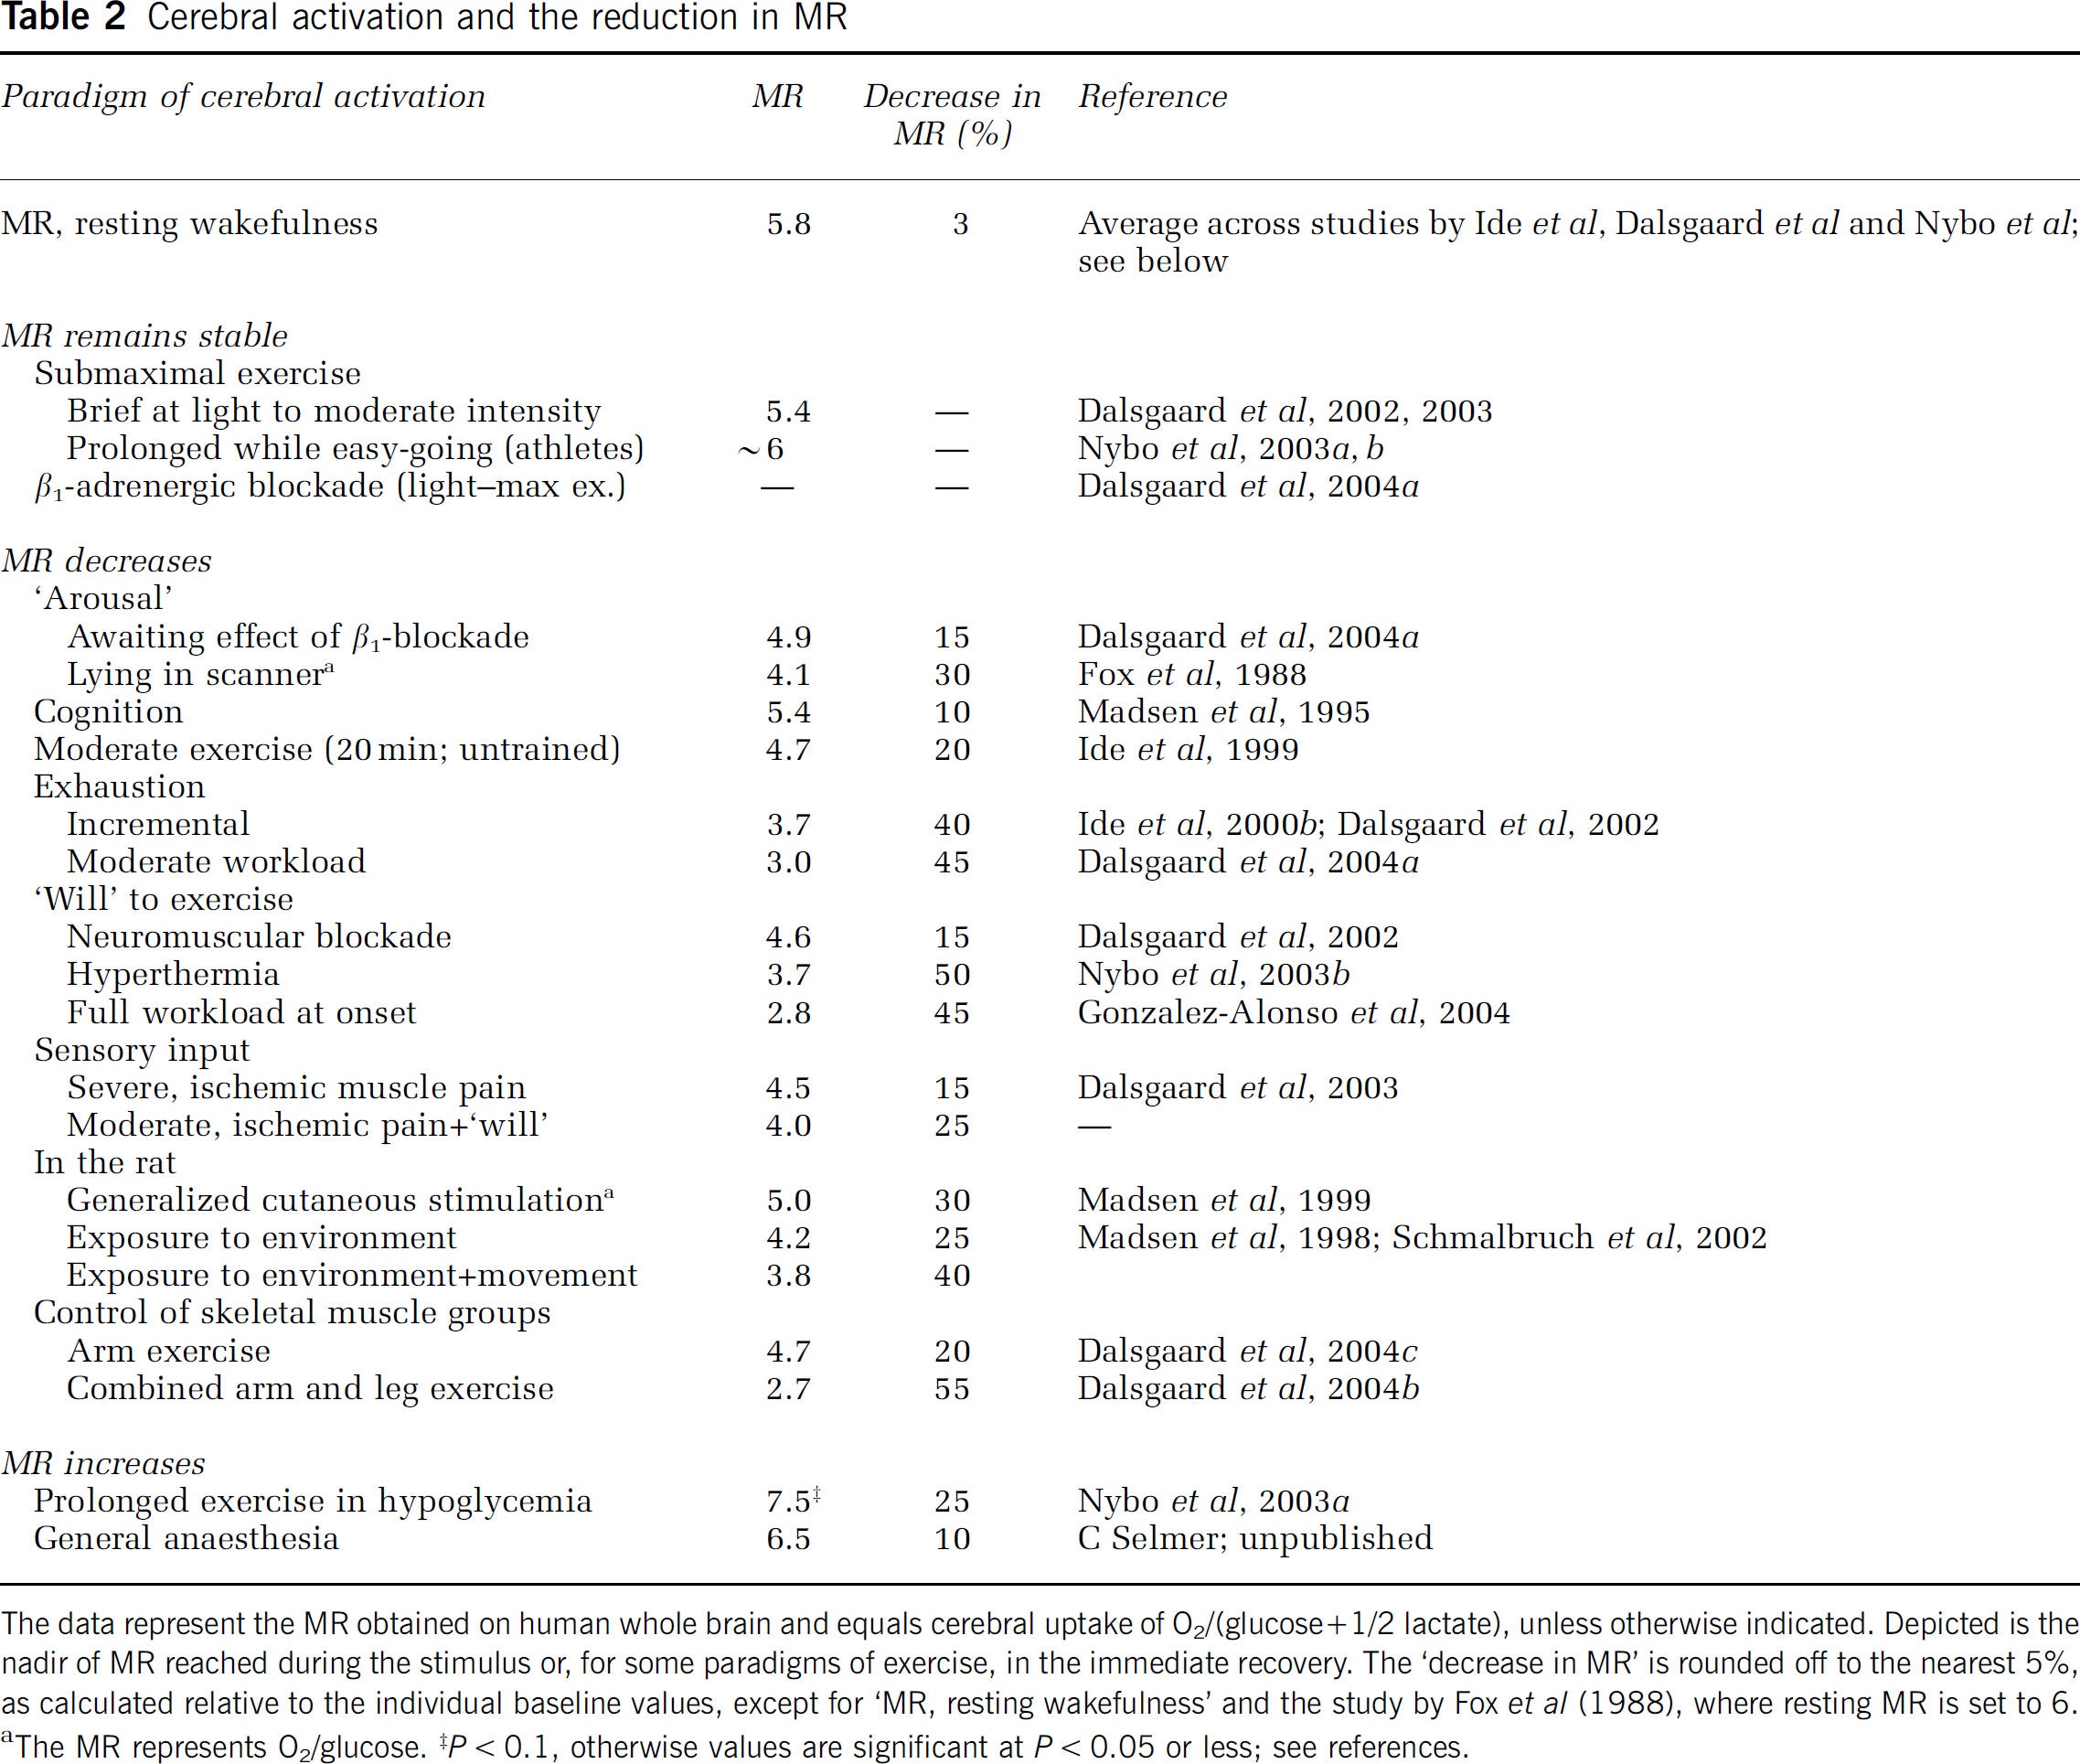
The data represent the MR obtained on human whole brain and equals cerebral uptake of O2/(glucose + 1/2 lactate), unless otherwise indicated. Depicted is the nadir of MR reached during the stimulus or, for some paradigms of exercise, in the immediate recovery. The ‘decrease in MR’ is rounded off to the nearest 5%, as calculated relative to the individual baseline values, except for ‘MR, resting wakefulness’ and the study by Fox et al (1988), where resting MR is set to 6. aThe MR represents O2/glucose. ‡P < 0.1, otherwise values are significant at P < 0.05 or less; see references.
The incommensurate increase in CMRO2 relative to CMRglucose suggests that glycolysis and lactate production fuels enhanced neuronal activity. However, on activation, lactate accumulates only transiently within the brain (Sappey-Marinier et al, 1992) and explains at most 50% of the extra glucose consumed (Madsen et al, 1999), and despite continued stimulation the accumulated lactate clears (Aubert and Costalat, 2005; Sappey-Marinier et al, 1992). The ‘lactate shuttle’ predicts that glycolysis and lactate release occur mainly in the astrocyte, with subsequent lactate oxidation in neurons (Pellerin and Magistretti, 1994) and it is neither inferred nor likely that neurons solely should be nourished this way (Chih and Roberts Jr, 2003). Yet, neuronal metabolism seems mainly oxidative, whereas that of astrocytes primarily is glycolytic (Rothman et al, 2003), although the astrocytes possess the same oxidative capacity as neurons. On activation, on the cellular level, astrocytic glycolysis lacks behind, but overshadows an instantly increased oxidative metabolism in neurons (Kasischke et al, 2004). Of note, neuronal oxidation of lactate would restore the stoichiometry between O2 and glucose and can therefore not explain the low MR. Alternatively, dispersal of lactate within the astrocytic network for oxidation in regions remote from those evaluated (Dienel and Cruz, 2003) could disturb the regional stoichiometry and delay normalisation of global metabolism.
During activation, presumably, glutamate taken up by astrocytes for inactivation via glutamine synthesis stimulates glycolysis and, glutamate–glutamine cycling increases with oxidative consumption of glucose (Rothman et al, 2003). Thus, glycolysis in astrocytes relates to reuptake of neurotransmitters and of extracellular ions to maintain synaptic activity, perhaps since this task necessitates instant and intermittent ATR In contrast, though more energy efficient, oxidative metabolism is slower and less suitable for this type of demand (Shulman et al, 2001). Furthermore, the astrocytic processes that engulf the synaptic cleft and govern these tasks are devoid of mitochondria (Dienel and Cruz, 2004) and therefore crucially dependent on glycolysis and, presumably, also glycogenolysis to provide energy fast enough (Brown, 2004). Thus, glycogen is degraded during cerebral activation, and resynthesis may provide for a long-term balance of MR, but it cannot account for the early reduction (discussed in ‘Glycogen metabolism’).
Part of the glucose carbon may accumulate, for example, in the cerebral pools of amino acids as glutamate/glutamine, GABA and alanine, and as intermediates of the metabolic pathways; labelling of these pools increases during cerebral activation in the rat, but mainly due to isotope exchange (Dienel et al, 2002). Yet, a small increase in the size of such large pools would correspond to a noteworthy amount of glucose.
Alternatively, the reduction in MR might be regarded from a functional perspective, as it is seemingly affected by the complexity of the stimulus (Gjedde et al, 2002). A stimulus with limited information perturbs mainly the field potential and does not dispatch neuronal spike activity so that energy is required primarily for astrocytic tasks as met by enhanced glycolysis, in turn reducing MR. In contrast, complex stimuli lead to efferent activity and necessitate neuronal oxidative metabolism; hence, MR does not decrease (as much). Another position is that a high baseline activity, balancing abundant excitatory and inhibitory potentials, conceals the little extra energy required for the shift in excitatory-inhibitory tone that succeeds enhanced activity (Gusnard et al, 2001).
To summarise, the declining MR during cerebral activation remains an enigma, but it characterizes brain activation despite the traditional global markers (CBF and CMRO2 failing. Calculation of global MR avoids assumptions as to whether jugular venous blood is representative for the brain as a whole inasmuch as the calculated MR is independent of CBF (MR = CMRO2/CMRsubstrate = A-JVO2/A-JVsubstrate). However, it remains important that blood is sampled from the jugular vein that drains the activated brain regions, since even metabolic increases otherwise would stay unnoticed. It should be clarified that although a reduction in MR commonly is associated with a net increase in metabolism as reflected by a marked increase in CMRglucose and a slight increase in or stable CMRO2, this cannot be inferred when only the A-JV is measured. Notwithstanding, since during strenuous exercise CBF, if anything, remains stable, the consistently increased A-JVglucose must reflect increased metabolism.
Energy Sources Other than Glucose
For the resting brain a global respiratory quotient (RQ; CO2-production/O2-consumption) of ~1.0 supports that carbohydrate is the dominant energy source (Dalsgaard et al, 2004a; Nybo et al, 2003a). Also, during exercise, deviations in RQ for the brain are insignificant and, consequently, carbohydrate remains the fuel of choice (Dalsgaard et al, 2004a).
The unity of RQ for the brain does not imply that glucose is the sole energy source. When cerebral glucose utilisation becomes restricted and/or when other substrates become available, as during exercise, they appear to be used and shifts in energy sources for the brain could challenge MR, for example, β-oxidation of fatty acids that also reduces RQ. However, neither during brief (Dalsgaard et al, 2002) nor prolonged (Nybo et al, 2003a) maximal exercise is there a quantitatively important brain uptake of free fatty acids or of glycerol. Moreover, at rest the brain takes up few of the glucose-derived amino acids from blood and only in minute amounts (Lying-Tunell et al, 1980) and, similarly, during maximal exercise there is no significant uptake of glutamate, glutamine or alanine (Dalsgaard et al, 2002).
In contrast, monocarboxylic acids such as lactate, pyruvate and ketone bodies are taken up by the brain when the blood level increases. Such transport across the blood-brain barrier is facilitated by the monocarboxylate transporter (MCT), with the subtype MCT1 expressed on the endothelium (Hertz and Dienel, 2005; Pierre and Pellerin, 2005). The MCT is expressed widely throughout the rodent brain, with the highest concentrations in the cortex, the hippocampus and the cerebellum representing areas of high neuronal activity and metabolism (Pellerin et al, 1998; Pierre and Pellerin, 2005). Likewise, ketone bodies contribute to brain metabolism when the arterial level increases, for instance, after an overnight fast (Ahlborg and Wahren, 1972; Lying-Tunell et al, 1980).
Pyruvate, another monocarboxylic acid and the end product of glycolysis, is converted to acetyl-coenzyme A, a substrate for the tricarboxylic acid (TCA) cycle and subsequent respiration, albeit only indirectly through nicotinamide adenine dinucleotide (NADH) and flavin adenine dinucleotide (FADH) formation. Alternatively, pyruvate is reduced to lactate while re-oxidising cytosolic NADH to NAD+ as a prerequisite for substrate flow in anaerobic glycolysis. The near-equilibrium state of the responsible enzyme, lactate dehydrogenase, implies that the ratio of lactate to pyruvate in cytoplasm reflects that of NAD+ to NADH. Thus, a high ratio of lactate/pyruvate in cerebral arterial-venous differences or in cerebrospinal fluid (CSF) is taken to indicate insufficient oxygen supply. Nevertheless, pyruvate seems to be less effective than lactate as substrate, at least during reperfusion/ischemia (Phillis et al, 2001). Often in awake resting brain, pyruvate, as lactate, is released in small quantities (Ahlborg and Wahren, 1972; Juhlin-Dannfelt, 1977), but it is taken up when available, for example, after prolonged exercise (Ahlborg and Wahren, 1972) and extraction, and consumption relates somewhat to the arterial concentration. Yet, at the normally low blood concentration, pyruvate uptake is probably negligible as it is competing with lactate for MCT.
Accordingly, the resting brain can utilise most substrates, but from a quantitative point of view only ketone bodies are known to replace glucose. In the case of exercise, however, lactate and to some extent pyruvate are the monocarboxylates offered to the brain in increasing arterial concentration. Ketone bodies are becoming of importance only during prolonged exercise at a time when the blood lactate stays low (Nybo et al, 2003a).
Lactate
Lactate transport across the blood-brain barrier is facilitated by the MCT1 with a Km of around ~ 3.5 mmol/L. (reviewed in Gladden, 2004; Hertz and Dienel, 2005; Pierre and Pellerin, 2005). As transport is down the concentration gradient, a significant lactate uptake requires that the arterial level exceeds that within the brain of ~ 1.5 mmol/L (Abi-Saab et al, 2002; Dalsgaard et al, 2004c) (Table 1). Thus, from an arterial lactate concentration < 1 mmol/L in a physically inactive subject, a several fold increase in the arterial concentration, as during strenuous exercise, is required to accelerate transport. Additionally, facilitated transport implies that it also depends on continuous removal from the extracellular fluid of the brain, that is, lactate uptake is ‘metabolism driven’, as signified by a pronounced lactate uptake in pharmacologically activated structures (Lear and Kasliwal, 1991). Lactate is cotransported with one H+ (Becker et al, 2004; Juel, 2001) and, at any given lactate concentration, the H+ (or pH) gradient between blood and brain influences lactate transport, as illustrated by an increased lactate uptake when pH becomes low (Oldendorf et al, 1979). Often even maximal exercise elicits, but a small decrease in pH (Dalsgaard et al, 2002, 2004c). Yet, in a competitive setting such as elite rowing blood pH may decrease to as low as ~6.8, with blood lactate increasing up to ~ 30 mmol/L (Nielsen, 1999). Under such circumstances, the brain is exposed to a huge lactate load plus a favourable H+ gradient acting in conjunction to enhance lactate uptake by the brain. Moreover, lowering of pH increases the fraction of the freely diffusible lactic acid relative to its corresponding base, lactate, and supports uptake as long as it is in accord with the concentration gradient (Hertz and Dienel, 2005).
Arterial lactate concentration and the accompanying arterial–venous difference across the brain during cerebral activation
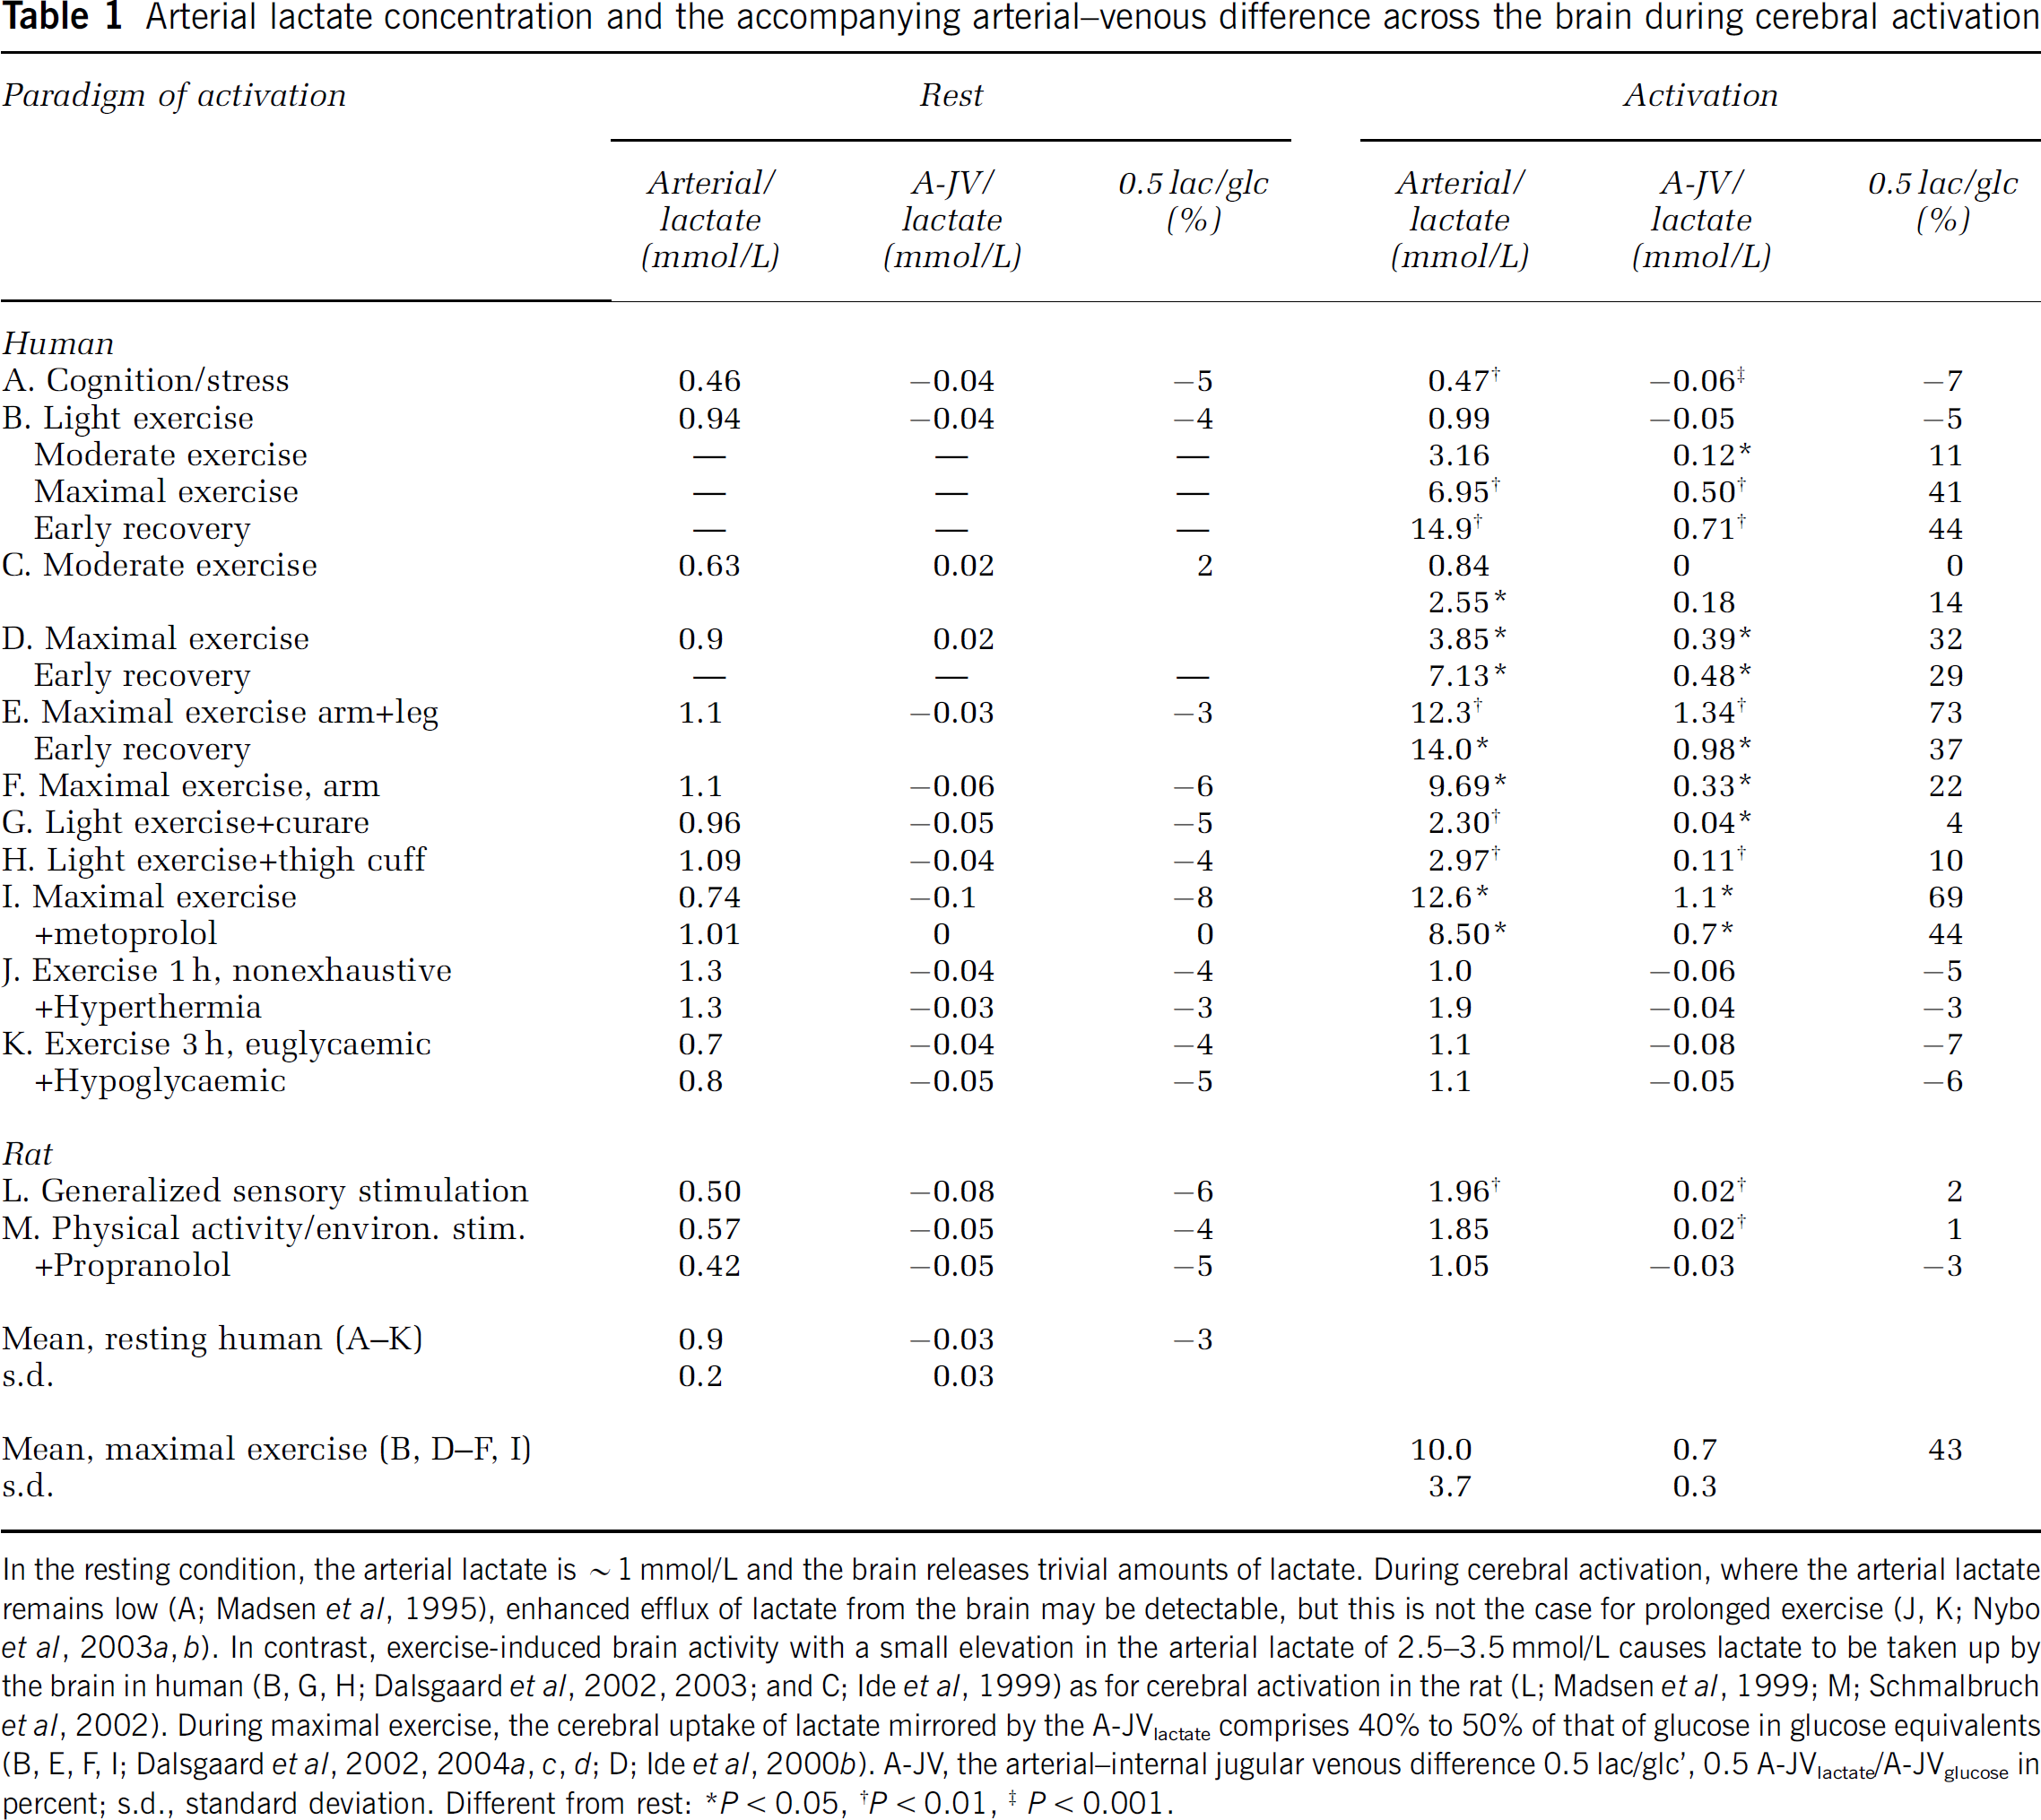
In the resting condition, the arterial lactate is ~ 1 mmol/L and the brain releases trivial amounts of lactate. During cerebral activation, where the arterial lactate remains low (A; Madsen et al, 1995), enhanced efflux of lactate from the brain may be detectable, but this is not the case for prolonged exercise (J, K; Nybo et al, 2003a, b). In contrast, exercise-induced brain activity with a small elevation in the arterial lactate of 2.5–3.5 mmol/L causes lactate to be taken up by the brain in human (B,G, H; Dalsgaard et al, 2002, 2003; and C; Ide et al, 1999) as for cerebral activation in the rat (L; Madsen et al, 1999; M; Schmalbruch et al, 2002). During maximal exercise, the cerebral uptake of lactate mirrored by the A-JVlactate comprises 40% to 50% of that of glucose in glucose equivalents (B, E, F, I; Dalsgaard et al, 2002, 2004a, c, d; D; Ide et al, 2000b). A-JV, the arterial-internal jugular venous difference 0.5 lac/glc’, 0.5 A-JVlactate/A-JVglucose in percent; s.d., standard deviation. Different from rest: *P < 0.05, †P < 0.01, ‡P < 0.001.
In keeping with the kinetic considerations, a lactate efflux from the brain is reversed to an uptake by a slight elevation in arterial lactate (Table 1) and augmented if combined with brain activation (Dienel et al, 2002; Madsen et al, 1998; Schmalbruch et al, 2002). For example, moderate exercise at an arterial lactate concentration greater than 3 mmol/L is associated with slight lactate uptake by the brain (Ahlborg and Wahren, 1972; Dalsgaard et al, 2002). Indeed, when maximal exercise raises the arterial lactate concentrations to ~ 15 mmol/L or higher, the cerebral lactate uptake (in molar amounts) may exceed that of glucose (Figure 3) (Dalsgaard et al, 2002, 2004b; Gonzalez-Alonso et al, 2004; Ide et al, 2000b). With such marked concentration gradient from blood to brain, lactate would be expected to reach high concentrations locally in the extracellular fluid of importance for the cellular uptake. Lactate uptake by neurons is mainly via the high-affinity isoform MCT2 (low Vmax), while astrocytes express the low-affinity carriers MCT1 and MCT4 (high Vmax) (Pierre and Pellerin, 2005). It is suggested that, for a lactate concentration as in the resting brain, neuronal uptake would be 60% saturated and slower than that of the astrocytes (Hertz and Dienel, 2005). Although such a calculation does not take into account the intracellular lactate concentration, it might be that the increasing lactate levels would increase astrocyte transport the most.
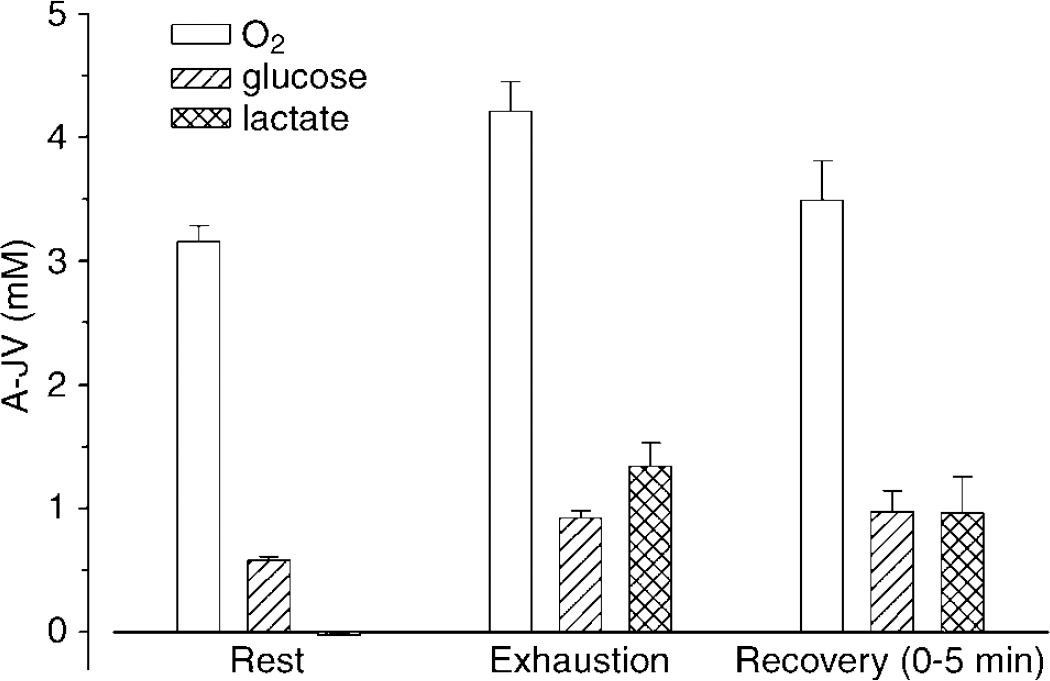
Arterial–internal jugular venous differences of lactate versus glucose and of O2 during maximal exercise. From a slight lactate efflux at rest the A-JVlactate increases to exceed that of glucose at exhaustion. The increase in A − JVO2 is less than that of glucose and even more so relative to glucose plus lactate, that is, the MR of O2/(glucose + 1/2 lactate) decreases from 6 at rest to ~3. Data from Dalsgaard et al (2004c).
Incremental exercise increases the lactate uptake by the brain in somewhat parallel with the arterial concentration (Dalsgaard et al, 2002, 2004c; Ide et al, 2000b). Since incremental exercise would be expected to also progressively increase cerebral activity (see the section ‘The mental effort to exercise’), the effect of increasing lactate availability on cerebral lactate uptake cannot be distinguished easily from that of cerebral activation. However, these factors may become segregated when during leg exercise, a higher level of cerebral activity, as reflected by the rating of perceived exertion (RPE; Borg, 1970), seems to provoke a larger cerebral lactate uptake than does arm cranking, which is not explained by the arterial lactate concentration (Dalsgaard et al, 2004d). Moreover, regardless of the muscle group involved, in these experiments at comparable arterial lactate concentrations, the A-JVlactate is greater during exercise than in recovery, where brain activity is considered to be attenuated. Collectively, these findings support that cerebral lactate uptake becomes manifest when the blood level increases and that it is enhanced by activation. Further supporting a metabolism-driven lactate uptake is that lactate offered at high concentration (10 mmol/L) to a brain that is deprived of sensory input, that is, isolated and denervated (Ide et al, 2000b) or anaesthetised (Leegsma-Vogt et al, 2003), is not taken up or is released from the brain when the infusion ceases and the arterial level declines.
Training improves the skeletal muscle capacity for lactate transport through enhanced expression of MCT (Juel, 2001). Together with the finding that exercise upregulates several neuronal genes (Tong et al, 2001), including the oxidative capacity in the motorcortex (McCloskey et al, 2001), the experience from skeletal muscles provokes speculation as to whether also neurons and astrocytes could develop their capacity for lactate transport, as shown with exposure to noradrenaline (Pierre and Pellerin, 2005). Furthermore, at different exercise intensities, cortical lactate metabolism seems elevated in well-trained compared with untrained subjects (Kemppainen et al, 2005) and that could be of importance for exercise capacity.
During exercise, the lactate taken up by the brain is not released to blood within a 1-h recovery period (Dalsgaard et al, 2002; Ide et al, 2000b) and it does not accumulate in CSF or within the brain as determined by MRS (Figure 4) (Dalsgaard et al, 2004b). Of note, the extracellular lactate pool would be expected also to receive lactate from glycolysis and glycogenolysis. Consequently, the lactate is metabolised, distributed to brain regions separate from the region of interest or might be used for synthesis. As for lactate serving as a precursor for biosynthesis, gluconeogenesis in astrocytes and neurons is negligible (Swanson et al, 1990) and glycogen synthesis from lactate does not appear to be significant (Brown et al, 2003; Ide et al, 1969). In regard to metabolism, infusion of lactate spares glucose in resting subjects (Smith et al, 2003), and after exercise (Kemppainen et al, 2005) and on the cellular level lactate is metabolised by both neurons (Schurr et al, 1997) and astrocytes (Dringen et al, 1995). Conversion of lactate to pyruvate and subsequent oxidation yields energy metabolites that may inhibit glycolysis (Ide et al, 1969; Tabernero et al, 1996), which could explain the glucose-sparing effect of lactate (Bouzier-Sore et al, 2003; Kemppainen et al, 2005; Smith et al, 2003). Thus, it remains unresolved whether lactate is, in fact, ‘preferred’ over glucose. Possibly, oxidation of lactate to pyruvate is favourable when energy status is low, inasmuch as it does not require ATP for ‘activation’. At least, that could explain why lactate seems to be preferred in hippocampus slices subjected to hypoxia (Schurr et al, 1997), as in head-injured rats where oxygen utilisation and energy metabolites decrease (Rice et al, 2002). In addition, lactate may serve purposes other than provision of energy, for example, regulation of pH within cells (Juel, 2001).
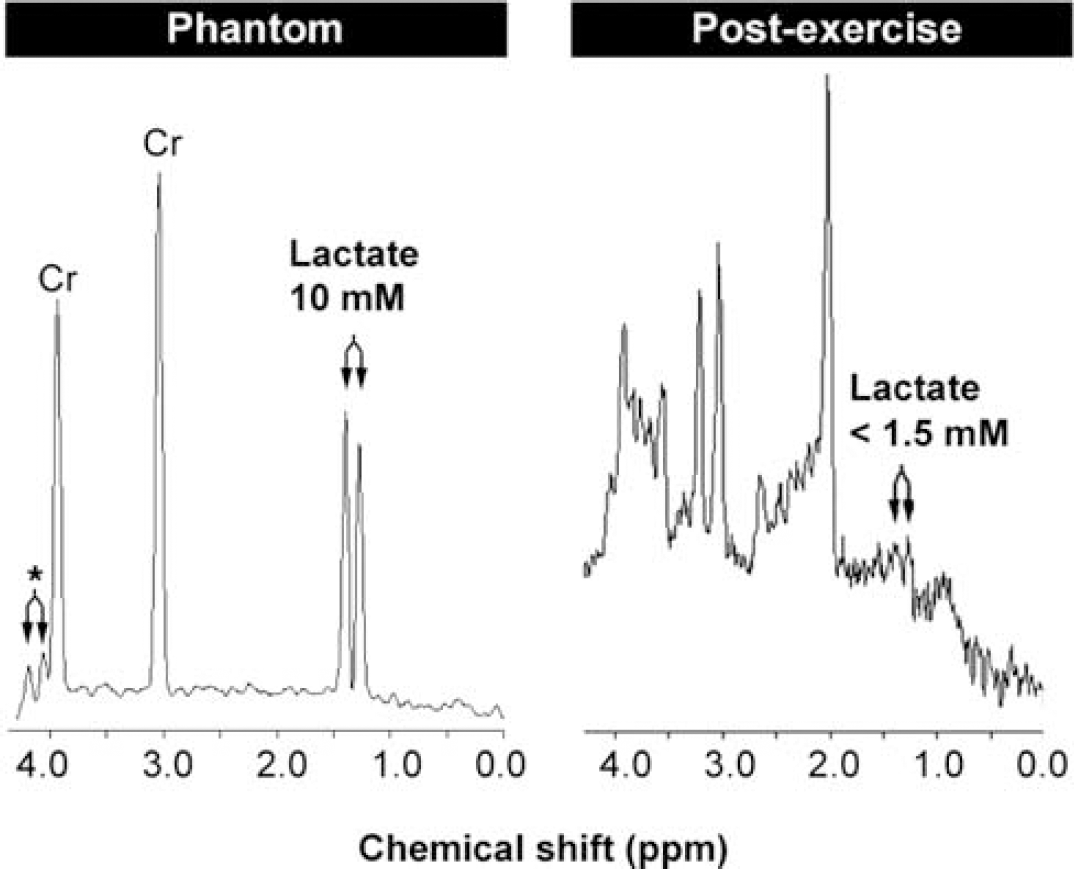
Cerebral lactate remains low after exercise. Left, magnetic resonance spectroscopy of a phantom containing creatine (Cr) in a concentration similar to that in humans plus 10 mmol/L sodium lactate. Right, spectrum obtained after exercise from one subject that shows a low lactate concentration in spite of a cerebral lactate uptake estimated to increase brain lactate to ~8mmol/L Modified from Dalsgaard et al (2004c).
To sum up, during hard exercise the arterial lactate increases, the pH decreases and the brain becomes increasingly activated, which all act in conjunction to enhance lactate uptake by the brain even while MR is low. Under such circumstances, cerebral lactate metabolism may approach 50% of that of glucose, together fuelling brain work in exercise. Thus, lactate efflux and accumulation cannot explain the lowering of MR. The lactate taken up by the brain is neither released from nor accumulating within the brain, and is hence presumably metabolised. Consequently, lactate is included in the equation of MR as O2/(glucose +1/2 lactate), since 2 mol of lactate corresponds to 1 mol of glucose in terms of oxidation. The type of cell and metabolic processes that benefit from a pronounced lactate uptake remains unknown. Yet, if cerebral metabolism was fuelled solely by oxidative metabolism, MR would remain close to 6.
The Cerebral Metabolic Response to Exercise
Metabolic Ratio Integrates Metabolism in Distinct Brain Regions
Exercise reduces MR as a consequence of every aspect of the task that involves the brain. In this context, simple muscular contractions require little cerebral involvement and may even operate on the basis of reflex mechanisms why the global cerebral metabolism would be expected to remain stable. In contrast, the cerebral processes needed to sustain and coordinate complex patterns of movement at a high intensity should be reflected in the cerebral metabolic response. The facets of exercise that contribute to reduce the MR are reviewed in this section (Table 2).
Whereas during exercise rCBF increases in areas of, for example, motor planning, sensorimotor function, and control of balance and cardiorespiratory function (references in Dalsgaard et al, 2004d), and apparently in somewhat proportion with exercise intensity, but few studies have measured the local brain metabolism. Running and cycling elicit widespread increases in local CMRglucose compared with the rest, as determined by PET (Kemppainen et al, 2005; Tashiro et al, 2001), but at higher cycling intensities CMRglucose decreases with the increasing arterial lactate, possibly because of substitution for glucose (Kemppainen et al, 2005).
Exhaustive exercise requires a ‘will’ to continue and integrates vast information. The impact of the mental effort on MR is evaluated during exercise with drug-induced partial neuromuscular blockade, which attenuates handgrip strength by ~ 70% (Figure 5) (Dalsgaard et al, 2002). In that situation, exercise at a workload perceived as fairly easy before curarisation requires a maximal effort to excite unblocked leg muscle fibres, and is thereby a model for fatigue (Dettmers et al, 1996). Yet, the decrease in MR during exercise with neuromuscular blockade is slightly less (~4.6) than that developed during control maximal exercise (~3.7) in spite of a maximal effort in both trials, suggesting that other factors such as sensory input contribute to the reduction in MR.
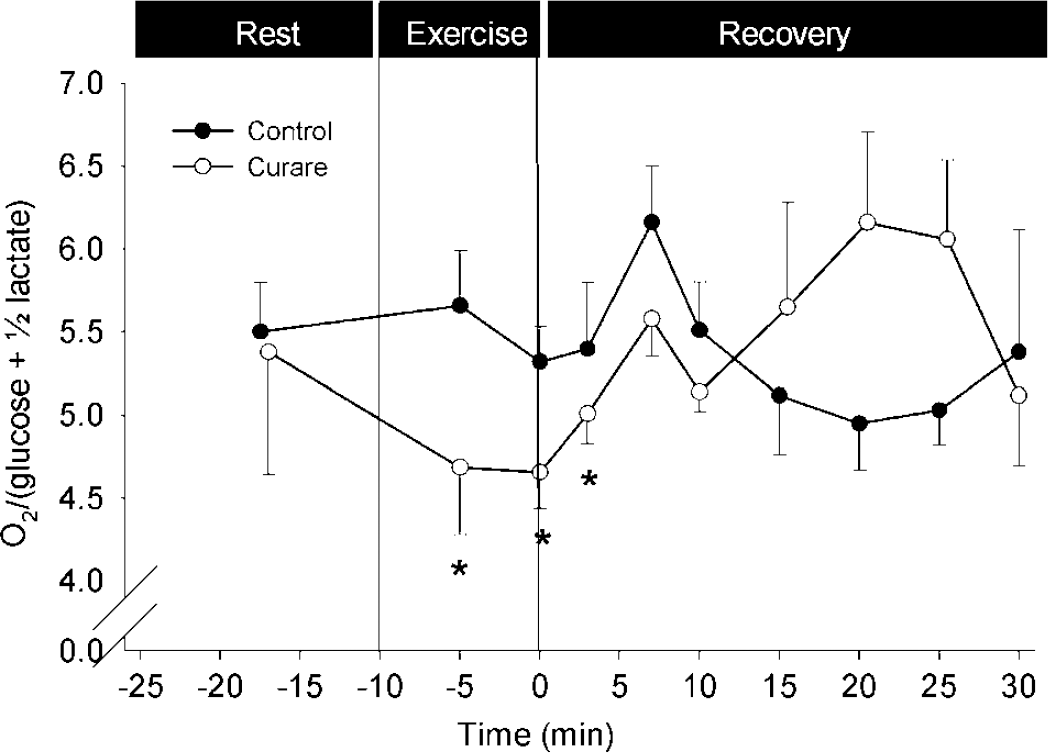
The MR is influenced by the mental effort to exercise. The MR remains stable during light exercise (–•–), but decreases when exercise at a similar workload requires a maximal effort due to partial neuromuscular blockade (–○–). Data are mean ± s.e.m. from 10 subjects. Different from rest: *P < 0.05. Modified from Dalsgaard et al (2002).
During exercise, afferent stimulation is conveyed from mechanoreceptors in skeletal muscles, tendons and joints and from metaboreceptors within the muscles. The metaboreceptors are stimulated by obstructing blood flow with thigh cuffs, causing ischemic pain and deoxygenation and pooling of blood in the exercising muscle, as determined by near-infrared spectroscopy (Dalsgaard et al, 2003). When applied at supra-arterial pressure (200 mm Hg) during the recovery from a light bout of exercise (no reduction in MR) instigating 5 mins of post-exercise muscle ischemia, MR becomes reduced to 4.5, showing that the ratio integrates the sensory input (Figure 6). However, despite severe pain, this reduction in MR is less than for maximal exercise, underscoring the stimulatory effect on brain by the ‘will’ to exercise and the putative afferent stimuli from mechanoreceptors (Jorgensen et al, 1992). This notion gains support when exercise at the same light workload is aggravated by application of a 100 mm Hg thigh cuff to produce a lower degree of ischemic pain, while enhancing the effort as well as the afferent stimulation from mechanoreceptors, and yields an MR of 4.0, that is, a larger reduction than during postexercise muscle ischemia, but still less than during control maximal exercise.
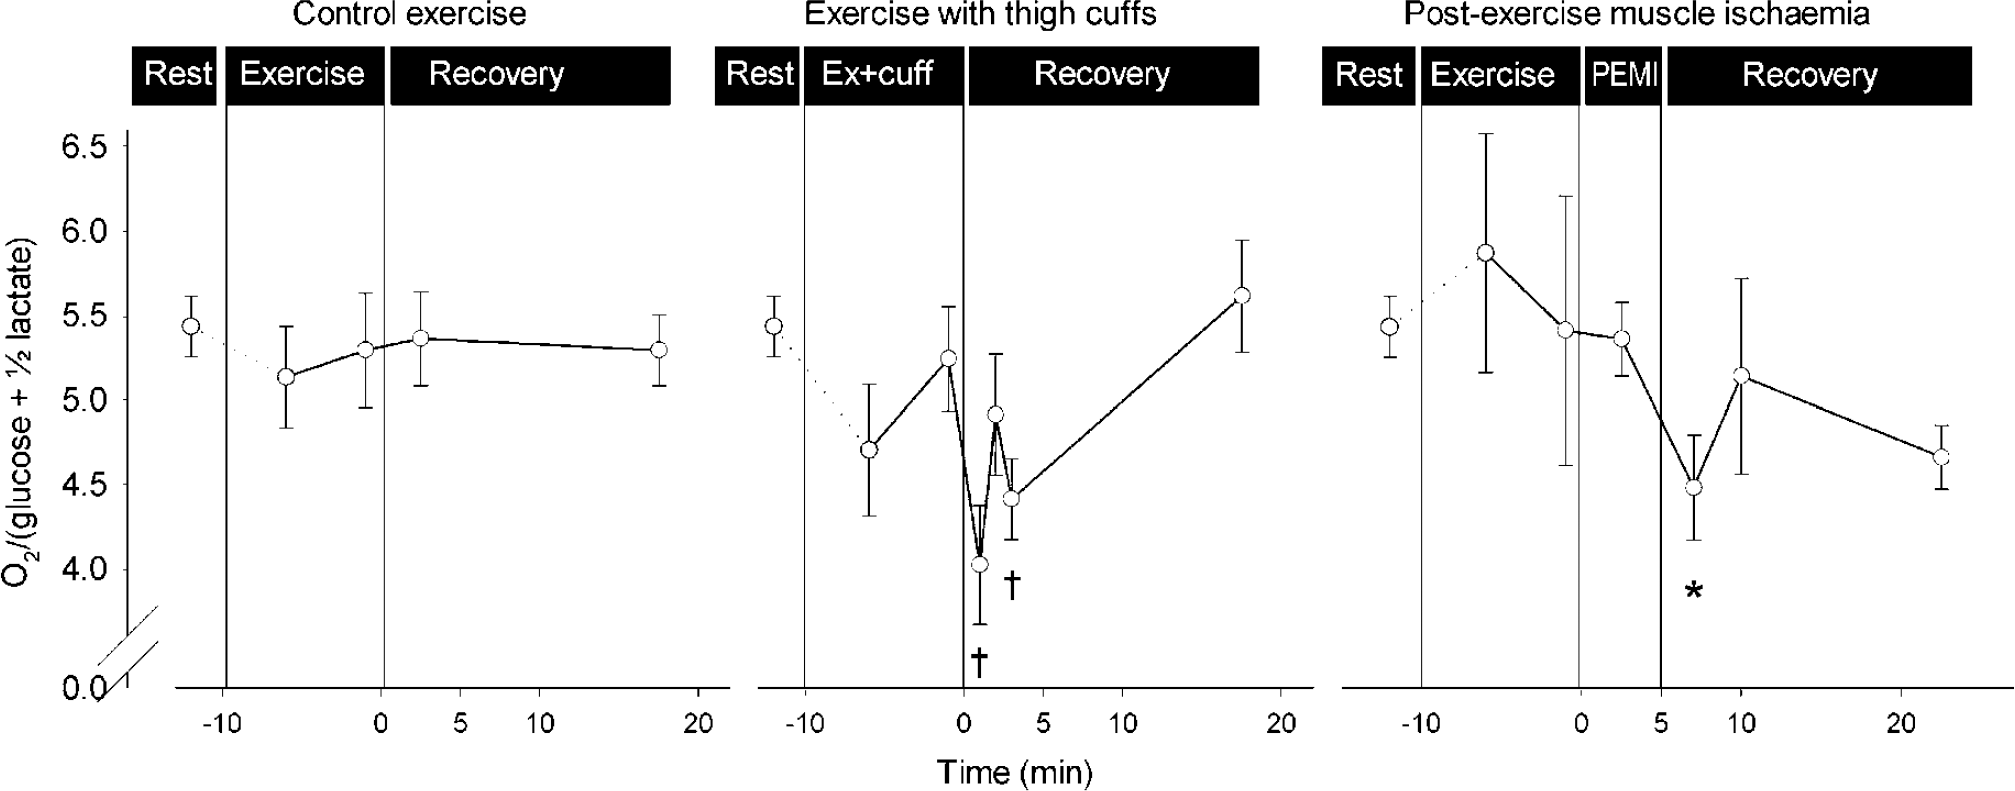
The MR integrates sensory input from skeletal muscle. Left, during light exercise MR remains stable. Middle, MR decreases when both sensory input to the brain and the ‘will’ to exercise are enhanced by ischemic muscle pain. Right, also complete obstruction of blood flow to the legs of a subject recovering from light exercise (post-exercise muscle ischemia; PEMI) reduces MR. Arterial lactate and arterial-internal jugular venous difference for lactate (A-JVlac) remained stable, except during exercise with thigh cuffs, where arterial lactate reached 3 mmol/L and a slight lactate efflux from the brain was reversed to a minimal uptake. Values are mean ± s.e.m. from 10 subjects. Different from rest: *P < 0.05; †P < 0.01. Modified from Dalsgaard et al (2003).
Moreover, control of individual muscle groups seems to contribute to lowering of MR. Arm cranking alone reduces the MR (Dalsgaard et al, 2004d) and when arm exercise is superimposed on leg exercise, the reduction in MR becomes most pronounced (Dalsgaard et al, 2004c) and a value of 3 is lower than developed when exercising with only the legs (Dalsgaard et al, 2002; Ide et al, 2000b).
In addition to a direct activation of the cerebral regions engaged by a physical task, a feed-forward effect (central command) may excite not only the cardiovascular system but also brain regions that are likely to become involved, such as the basal ganglia (Vafaee and Gjedde, 2004). Moreover, mental activity could elevate neuronal activity at baseline, that is, increase ‘arousal’. Likely, such global excitation explains why the apparent resting MR sometimes may approach ~ 5, for example, when anticipating a demanding physical task or the administration of a drug (Dalsgaard et al, 2004a), or perhaps even the investigation in itself, for example, lying in a scanner where resting local MR drops to ~4 (Fox et al, 1988). Conversely, carefully sheltering the rat from environmental stimuli yields a resting MR of ~6 (Schmalbruch et al, 2002) and anaesthesia raises MR to ~6.5 (C Selmer, unpublished).
In other words, MR reflects the sum of neuronal metabolism required to perform the task as superimposed on the baseline level of neuronal activation. During exercise, such activation integrates signals to and from the involved muscle groups and the ‘will’ to exercise with its inherent drive to motor and motor-related regions.
The Mental Effort to Exercise
Beyond a certain exercise intensity, MR appears to decrease with increased mental effort (Figure 7). Thus, MR remains stable during light to moderate exercise corresponding to 30% to 60% of the maximal whole body oxygen consumption, a heart rate less than ~130 beats/min and an RPE less than or equal to 15 (‘moderately hard’) (Ahlborg and Wahren, 1972; Dalsgaard et al, 2002, 2003, 2004a; Ide et al, 1999).
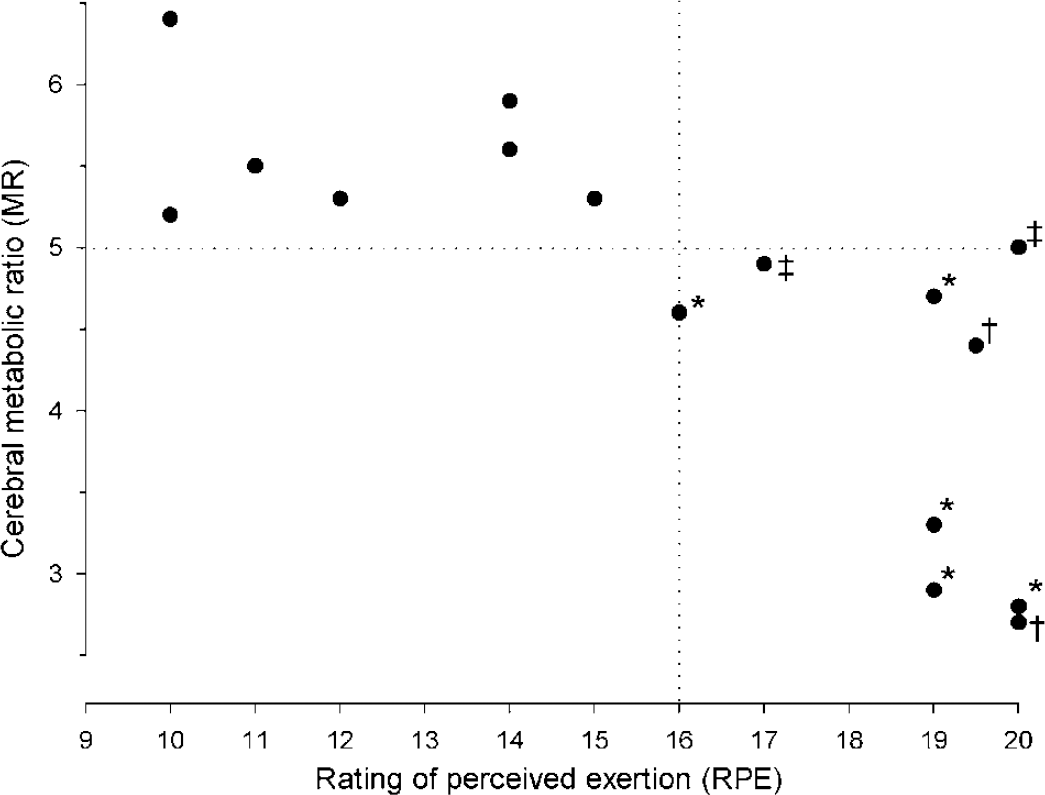
The MR is reduced significantly only when the mental effort to exercise (y-axis: RPE; Borg, 1970) exceeds an apparent threshold of ‘15’, as indicated by the vertical dotted line. Also, the MR decreases in somewhat parallel with the intensity of exercise. However, the same magnitude of RPE may result in different nadirs of MR (e.g. see RPE ‘20’), suggesting that it depends on the exercise paradigm. Also, in the case of exercise, reductions in MR for the brain as a whole may become significant only when MR decreases below a certain value, as indicated by the horizontal dotted line. Different from rest: *P < 0.05; †P < 0.01. ‡The MR is not significantly reduced during exercise, but it becomes so in the immediate recovery period (P < 0.05) (Dalsgaard et al, 2002, 2003, 2004a, c, d; Gonzalez-Alonso et al, 2004; Nybo et al, 2003b).
However, when exercise becomes demanding (RPE >15) and heart rate increases to > 135 beats/min, MR declines (Dalsgaard et al, 2002, 2004a; Ide et al, 1999). Equally, MR remains stable during the initial 45 to 50 mins of prolonged cycling, but, when the subject struggles to continue, MR decreases and more so with heat stress (Nybo et al, 2003b). Conversely, if the workload requires full attention from the very onset of exercise, MR already reaches its nadir after 90 secs (Gonzalez-Alonso et al, 2004). Together, these observations support that MR decreases when exercise cannot be performed ‘automatically’ and requires a determined effort (Dalsgaard et al, 2002). Moreover, when this apparent threshold of mental effort is exceeded, MR seems to decrease more or less in proportion with exercise intensity (Dalsgaard et al, 2004d), although the modality of exercise influences the declining MR, as shown for different levels of RPE (Figure 7). In support of a stimulatory effect of the ‘will’ to exercise, MR declines not only during incremental exercise (Dalsgaard et al, 2002, 2004c; Ide et al, 2000b) but also during exercise at a hard workload maintained until exhaustion with a steady incline in RPE (Dalsgaard et al, 2004d, 2004a).
Paradigm of Cerebral Activation
With an apparent inverse relation between the mental effort to exercise and MR, it seems to reach a progressively lower value during increasingly intense cerebral activation (Figure 8). Thus, in accordance with an intensely stimulated brain region (Fox et al, 1988), during exhaustive exercise the global MR approaches a lower limit of ~3 (Dalsgaard et al, 2004c; Gonzalez-Alonso et al, 2004) and may as such represent ‘maximal’ cerebral activation. A specific brain stimulus appears to require an absolute level of neuronal activity, that is, the CMRglucose reached during the stimulus is independent of the baseline neuronal activity (Rothman et al, 2003). However, the nadir of MR reached during the stimulus is not simply a matter of intensity but is also influenced by the complexity of the stimulus (Gjedde et al, 2002). Likewise, during exercise the time course and the nadir of reduction in MR depend on the paradigm. This might be explained by the fraction of the brain regions engaged and the magnitude of mental effort, but also by the intensity of the stimulus, ultimately determined by the capability of the subject to become exhausted. Firstly, motivation is essential so that exercise is not terminated before the mental effort and the sensory input to brain reach a maximal level (Asmussen, 1979). Secondly, an optimal performance requires that the subject can focus on the task, that is, being familiar with the modality of exercise and the experimental protocol (Secher, 1992). An exception is non-exercise activation of the brain, where familiarisation alleviates an increase in rCBF (arithmetic test; Ingvar and Risberg, 1967), maybe by reducing arousal. Also, imbalance between the will and the sensory input to the brain, that is, if one factor is enhanced while the other is not, may limit performance and hinder a combined maximal stimulation of the brain. This is illustrated when MR is reduced only moderately during exercise with partial neuromuscular blockade despite that exercise is perceived as hard (RPE 16; scale 6 to 20) and the subject is trying with maximal effort, presumably because work rate and thereby sensory feedback are low (Dalsgaard et al, 2002). Thus, a comparatively unfamiliar task may become so protracted that motivation wanes, and this could explain why exhaustive arm cranking reduces MR less than leg exercise (Dalsgaard et al, 2004d). Also, with exercise in an awkward position as semi-supine cycling, performance probably becomes limited at lower workloads and MR is reduced to 3.7 (Dalsgaard et al, 2002; Ide et al, 2000b), while for open-loop exercise at a low workload, continuation becomes a matter of endurance and MR decreases more (Dalsgaard et al, 2004a). Furthermore, when athletic cyclists reach their limit under familiar conditions in the heat, MR drops to 3 (Gonzalez-Alonso et al, 2004).
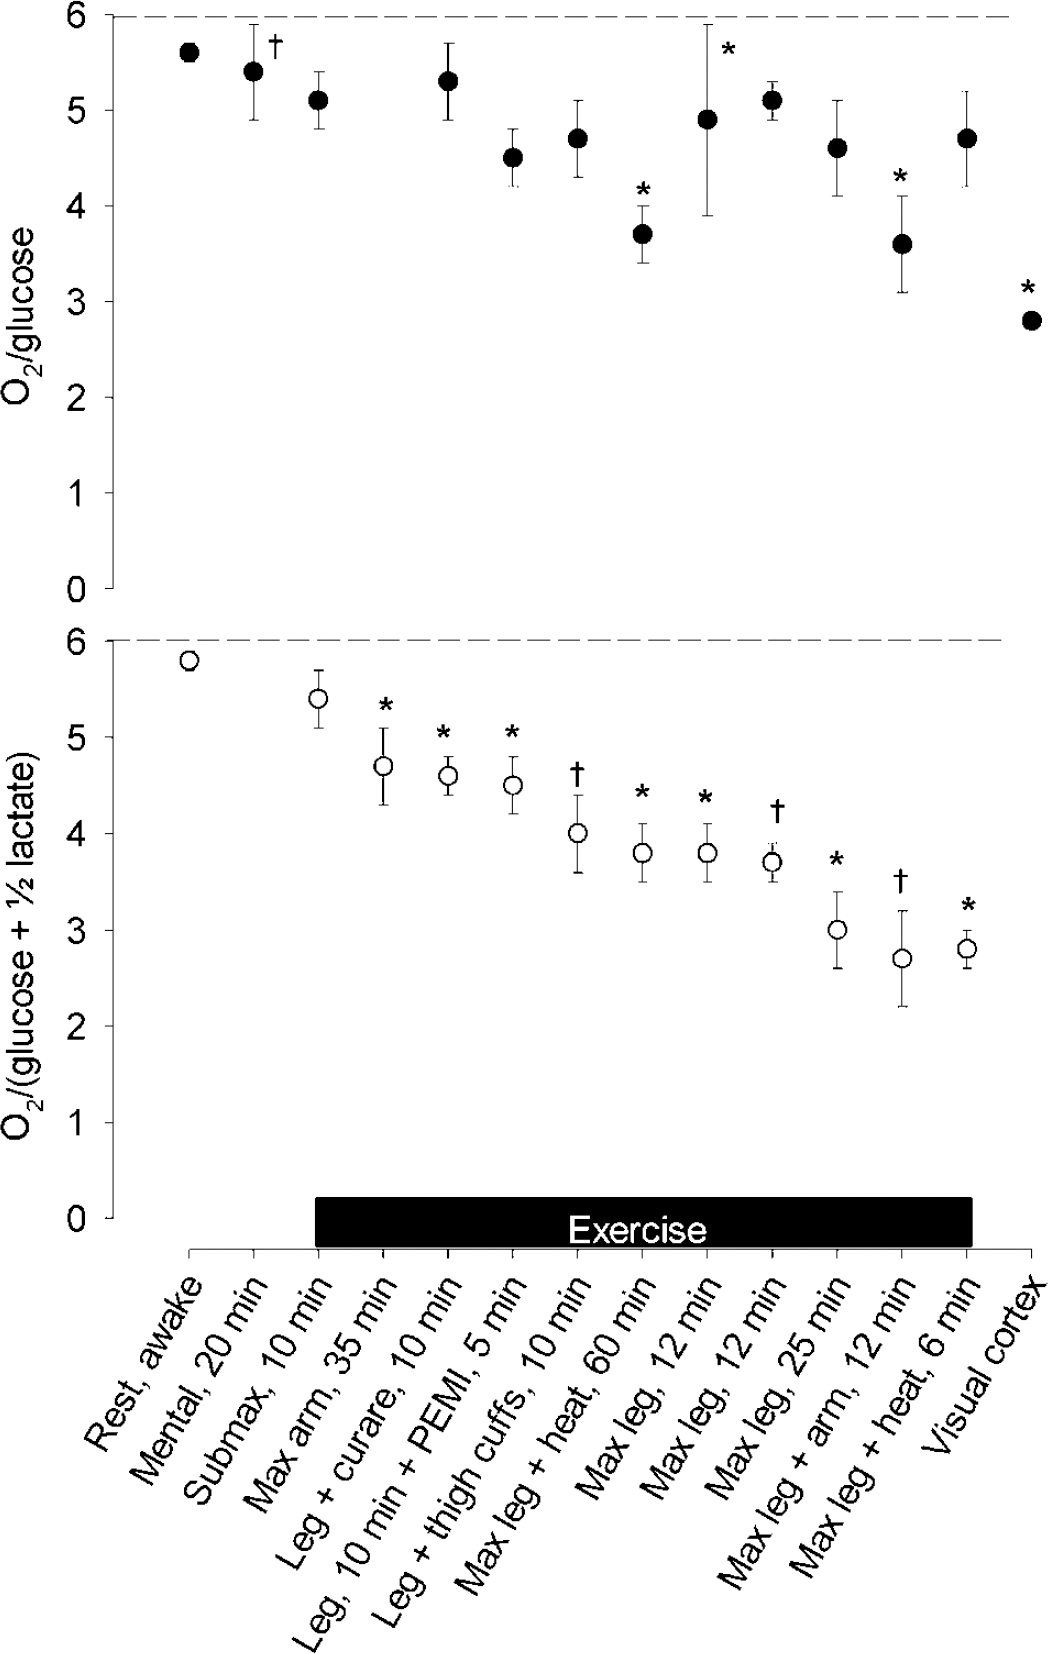
The nadir of the MR depends on the paradigm of activation. Reported values for MR have been ranked (bottom panel), with the contribution from the cerebral lactate uptake depicted by the corresponding OGI (O2/glucose; top panel). Dashed horizontal lines illustrate the theoretical maximal value of 6. Listed on the x-axis are paradigms of activation, including exercise protocols as denoted by the horizontal bar. ‘Rest, awake’, mean resting value across the protocols. References: ‘Mental, 20 mins’ (Madsen et al, 1995); ‘Submax, 10 mins’, mean value from four bouts of light exercise (Dalsgaard et al, 2002, 2003); ‘Max arm, 35 mins’ (Dalsgaard et al, 2004d); ‘Leg + curare, 10 mins’ (Dalsgaard et al, 2002); ‘Leg, 10 mins + PEMI (post-exercise muscle ischemia), 5 mins’ and ‘Leg + thigh cuffs, 10 mins’ (Dalsgaard et al, 2003); ‘Max leg + heat, 60 mins’ (Nybo et al, 2003b); ‘Max leg, 12 mins’ (Dalsgaard et al, 2002; Ide et al, 2000b); Max leg, 25 mins (Dalsgaard et al, 2004a); ‘Max leg + arm, 12 mins’ (Dalsgaard et al, 2004c); ‘Max leg + heat, 6 mins’ (Gonzalez-Alonso et al, 2004); Visual cortex (Fox et al, 1988). Values are mean ± s.e.m. (s.d. for ‘Mental, 20 mins’). Different from individual resting values: *P < 0.05 and †P < 0.01. Modified from Dalsgaard et al (2004d).
Why is the Cerebral Metabolic Ratio Reduced in Exercise?
Endocrine Factors
Exercise differs from other paradigms of cerebral activation by the endocrine response, especially when intense, but such changes do not appear to affect MR. Insulin crosses the blood-brain barrier only with difficulty (Reinhardt and Bondy, 1994) and insulin-sensitive glucose transport (GLUT4) across the blood-brain barrier, and within the brain plays but a minor role as the insulin-insensitive isoforms GLUT1 and GLUT3 predominate (Bingham et al, 2002). Furthermore, during exercise blood glucose homeostasis is maintained with low systemic levels of insulin (Guezennec et al, 1982). Thus, during maximal exercise the reduction in MR takes place without any change in A-JVinsulin or in CSF insulin concentration (Dalsgaard et al, 2004b). Moreover, the effects of insulin would be exerted only after the fast reduction and normalisation of MR that commonly takes place within few minutes after cessation of exercise. Yet, insulin rebounds in the recovery from exercise when blood glucose increases and could, especially on food intake, promote cerebral glucose uptake for, for example, glycogen synthesis (Choi et al, 2003; Dringen and Hamprecht, 1992; Swanson and Choi, 1993). Conversely, the blood concentration of insulin-like growth factor (IGF)-I increases during exercise (Schwarz et al, 1996) and IGF-I is superior to insulin in regard to both glucose transport into the brain (Reinhardt and Bondy, 1994) and its stimulatory effect on brain glucose metabolism (Cheng et al, 2000; Dringen and Hamprecht, 1992). However, increased levels of IGF-I in blood with exercise do not affect A-JVIGF and IGF-I remains low in the CSF (< 21 ng) as a potential site of entry (Dalsgaard et al, 2004b).
Noradrenaline and Other Neurotransmitters
The neurotransmitter noradrenaline not only regulates glucose metabolism in the brain but also influences the level of neuronal activity (Berridge and Waterhouse, 2003; Hertz et al, 2004). The noradrenergic neurons of the locus coeruleus within the brainstem project to widespread areas of the brain, providing noradrenaline to the neocortex and hippocampus and, vice versa, the locus coeruleus receives afferents from several cerebral structures, including the prefrontal cortex and amygdala, thus allowing it to respond to several stimuli (Berridge and Waterhouse, 2003; Magistretti, 1988). Particularly, stressful stimuli increase the activity and release of noradrenaline within the system, elevating the level of ‘arousal’ and improving cognitive performance (e.g. as learning), sensory processing and motor activity, which are all aspects of exercise. Thus, noradrenaline in the CSF increases by 50% with intense exercise in the dog (Radosevich et al, 1989). Likewise, exhaustive exercise elicits a ~300% increase in CSF noradrenaline after both brief (Dalsgaard et al, 2004b) and 2 h of maximal exercise (unpublished), which seems to be related to factors within the brain rather than the blood glucose homeostasis. Although noradrenaline in CSF may increase with the blood level, exercise per se seems not to be the cause (Dalsgaard et al, 2004b). In fact, noradrenaline may even spill over from the brain (Gonzalez-Alonso et al, 2004), suggesting increased intracerebral levels, albeit release from the sympathetic nerve endings in cerebral vessels may contribute (Ide et al, 2000a; Krog, 1964).
The effect of noradrenaline is conveyed via adrenergic receptors (mainly β,α1 and α2), as illustrated when agonists (e.g. amphetamine) or antagonists (β- and α-adrenergic blockers), respectively, enhance or attenuate arousal (Berridge and Waterhouse, 2003; Estler and Mitznegg, 1971). The metabolic actions of noradrenaline includes stimulating glucose metabolism in cultures of brain cells and, specifically, glycogen breakdown and resynthesis, with the latter proceeding even to levels above those at baseline (Allaman et al, 2000; Cambray-Deakin et al, 1988; Sorg and Magistretti, 1992).
Interestingly, after exhaustive exercise, CSF noradrenaline is elevated when MR is lowest (Dalsgaard et al, 2004b; Nybo et al, 2003b) and blocking the effect of noradrenaline in the brain by the β1/β2-blocker propranolol prevents the decrease of MR in rats (Schmalbruch et al, 2002). In contrast, the decrease in MR in exercising humans is not abolished by administration of the β1-adrenergic blocker, metoprolol (Dalsgaard et al, 2004a). Consequently, noradrenergic stimulation in humans seems mediated via several receptors (Berridge and Waterhouse, 2003) and may play a role in the reduction in MR.
Vasoactive intestinal peptide (VIP) exerts comparable effects on brain glucose and glycogen metabolism as noradrenaline (Allaman et al, 2000; Cambray-Deakin et al, 1988; Sorg and Magistretti, 1992), but the concentration in CSF is unchanged after both brief and prolonged maximal exercise. Also, dopamine may affect cerebral carbohydrate turnover (Fellows et al, 1993) and is released in small amounts from the brain during prolonged exercise (Nybo et al, 2003b). Tryptophan, the precursor of the neurotransmitter serotonin (Bequet et al, 2001; Cambray-Deakin et al, 1988), is taken up from blood in small amounts. In addition, adrenaline and cortisol are important for arterial glucose homeostasis during exercise and may have comparable actions within the brain (De Bruin et al, 1990; Radosevich et al, 1989; Stone et al, 2003); yet, during exhaustive exercise, their A-JV and CSF concentrations remain stable (Dalsgaard et al, 2004b).
Cytokines
Prolonged vigorous exercise provokes a cerebral release of interleukin (IL)-6 (Nybo et al, 2002) which, because of stable levels of tumour necrosis factor (TNF)-α, is unlikely to reflect inflammatory stress (Sawada et al, 1992). Inasmuch as depletion of glycogen in skeletal muscle enhances IL-6 release (Steensberg et al, 2001), IL-6 is suggested to reflect low energy reserves. Surprisingly, IL-6 remains stable in CSF after both brief (Dalsgaard et al, 2004b) and prolonged exercise (Steensberg, unpublished) and cerebral IL-6 release is diminished when exercising under hypoglycaemia (Nybo et al, 2003a). In addition, heat shock protein (HSP72), which is equally responsive to a low glycogen content (Febbraio et al, 2002), remains stable in A-JV and CSF (Dalsgaard et al, 2004b).
In summary, during exercise the reduction in MR seems independent of peripheral hormones and IL-6, confirming that it is governed by factors intrinsic to the brain. Notably, the noradrenaline level in the brain is markedly increased after exhaustion when MR reaches its nadir. Noradrenaline is distributed via axons originating in the locus coeruleus and this system responds to stressful stimuli as physical exercise to ‘arouse’ baseline neuronal activity. Noradrenaline mobilises glycogen and stimulates its resynthesis to a level even higher than at baseline. Thus, noradrenaline might be a constituent in the disproportional glucose uptake by the brain.
Ammonium and Amino Acids
In addition to the endocrine response to exercise, changes in systemically released metabolites could influence cerebral metabolism. During exercise, skeletal muscle releases ammonium (NH+4, which equilibrates rapidly with the readily diffusible ammonia, NH3) and cerebral uptake (Felipo and Butterworth, 2002) could alter MR (Tsacopoulos et al, 1997). The NH3 may also affect neurotransmitter metabolism of glutamate and y-amino butyric acid (Guezennec et al, 1998; Sonnewald et al, 1997) and deteriorate cerebral function as surmised in hepatic encephalopathy and hyperammonaemia (Strauss et al, 2003).
During maximal exercise, the A − JVNH+4 over the brain seems to increase with the arterial concentration but its CSF concentration does not, suggesting that the NH+4 taken up is utilised (Figure 9) (Dalsgaard et al, 2004b). A correlation between the cerebral NH+4 uptake and the arterial level is confirmed after hours of exercise, and, even with such long-lasting uptake, there is but a trivial (micromolar) accumulation of NH+4 in CSF (Nybo et al, 2005). When available, NH+4 may provide the working brain with nitrogen residues, for example, for neurotransmitter synthesis and/or inactivation (Sonnewald et al, 1997). After sensory stimulation, the cerebral pools of glutamate and glutamine increase in the rat (Dienel et al, 2002). However, magnetic resonance spectroscopy of the human brain after maximal exercise with a low MR (Dalsgaard et al, 2004c) shows no increase in the concentration of glutamate + glutamine or of N-acetylaspartate within detectable changes of 3 to 4 and 1 to 2 mmol/L, respectively (Danielsen, unpublished). Also, such amino-acid synthesis would require a corresponding NH+4 uptake, but in that situation it accounts for less than 3% of the recorded change in MR (Dalsgaard et al, 2004b) and a compatible fraction (3% to 14%) is obtained at the final stage of prolonged exercise when comparing the uptake rate of NH+4 with that of surplus glucose (Nybo et al, 2005).
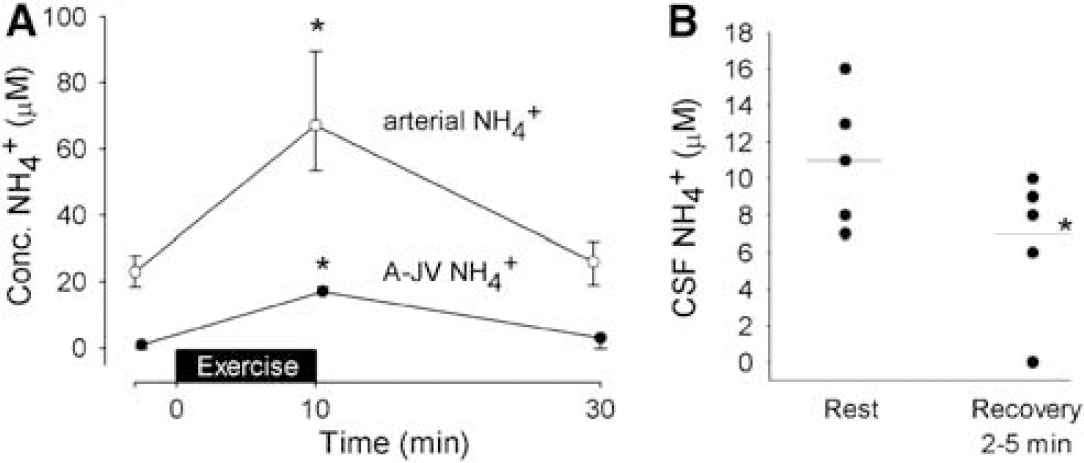
The A-JV and CSF concentration of NH+4. (
The ‘Overshoot’ of the Metabolic Ratio
Since during exercise, lowering of MR appears to be unaccounted for by hormones, cytokines and metabolites, the attention turns to the biochemical reactions that fuel neuronal activity, including lactate metabolism, as discussed previously.
Once a subject recovers from exercise, the MR of O2/glucose may overshoot to 7 to 8, as shown after cerebral activation in general (Fox et al, 1988; Madsen et al, 1998, 1999). This indicates that a build-up of substrate, for example, lactate, amino acids or intermediates of metabolic pathways, becomes oxidised. In keeping with a time-dependent accumulation of some substrate, the amount of surplus glucoseequivalents taken up by the brain apparently decreases with the duration of exhaustive exercise (Dalsgaard et al, 2004a). Delayed metabolism of enlarged metabolite pools would spare glucose uptake and explain why MR tends to increase after 3 h of exercise in spite of a maximal effort where MR should be low (Nybo et al, 2003a). However, when the brain lactate uptake is taken into account, the MR does not overshoot, at least not within the first hour after the stimulus (Figure 2) (Dalsgaard et al, 2002; Ide et al, 2000b), suggesting that complete normalisation of the cerebral metabolic state is a long-lasting process. Nevertheless, there is no exodus from the brain of its major energy sources, why the brain appears to accumulate substrate.
Glycogen Metabolism
During cerebral activation the excess cerebral uptake of glucose plus lactate could be stored and glycogen constitutes the largest single carbohydrate reserve in the brain. For long, the cerebral glycogen content in the rat was thought to range from 3 to 6 μmol/g (Madsen et al, 1999; Siesjo, 1978), but it more likely approaches 10 to 12 μmol/g (Cruz and Dienel, 2002; Kong et al, 2002). Equally high values are determined in biopsies of human brain removed during neurosurgery (5 to 10 μmol/g; unpublished), though the level in conscious human might be lower (Oz et al, 2003).
Glycogen is confined mainly to the astrocytes (Cataldo and Broadwell, 1986; Koizumi, 1974; Phelps, 1975), where its breakdown feeds glycolysis and lactate production (Brown et al, 2003; Dringen et al, 1993) (Figure 10). Secondarily, glycogen can maintain the glucose concentration in the extracellular fluid (Dringen and Hamprecht, 1992). Glycogenolysis may also provide energy for inactivation of glutamate via glutamine (Phelps, 1975). Glycogen turnover seems pronounced in areas of high metabolic capacity (Pfeiffer et al, 1990; Swanson et al, 1992); thus, glycogen is integral in cerebral metabolism, with the level decreasing during cerebral activation (Madsen et al, 1999; Swanson et al, 1992), as mediated by the neurotransmitters noradrenaline, VIP and serotonin, and various byproducts of activity, viz. K+ and adenosine (Sorg and Magistretti, 1991). Conversely, glycogen builds up after attenuation of neuronal activity as in hibernation (Koizumi, 1974) and anaesthesia (Phelps, 1972), presumably because the rate of synthesis stays high (Watanabe and Passonneau, 1973). Hence, when the brain is deprived of periods with low activity and metabolism as during sleep (Madsen and Vorstrup, 1991), glycogen remains low (Kong et al, 2002). Moreover, glycogen accumulates in astrocytes when substrates such as glutamate spare glucose (Swanson et al, 1990).
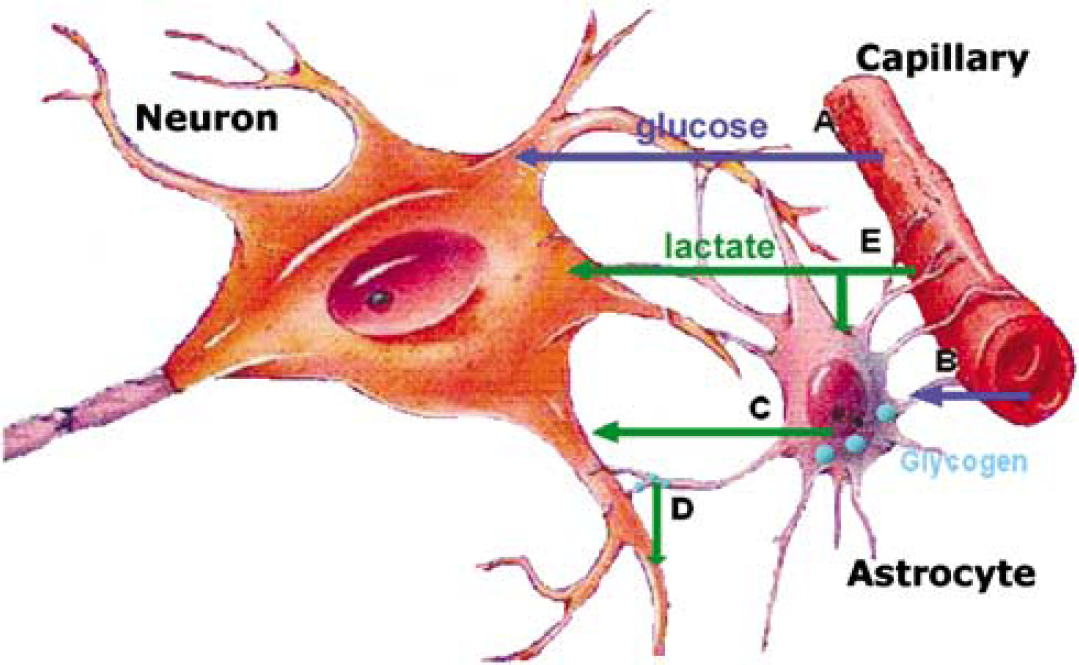
Brain cellular metabolism of lactate and glycogen. (
Replenishment of the glycogen level does not explain the reduction in MR. First, the glucose released from glycogen breakdown adds to the surplus of glucose plus lactate taken up by the brain that is not oxidised. Second, lactate originating from the glucose taken up and that from glycogen breakdown are compartmentalised, that is, the declining MR and glycogenolysis are functionally segregated (Dienel et al, 2002). Finally, even while recovering from a stimulus, glycogen is broken down despite enhanced glycogen turnover (Dienel et al, 2002; Madsen et al, 1999). In contrast, the ‘glycogen shunt hypothesis’ seeks to explain the reduction in MR ratio by intermittent glycogen synthesis/breakdown and predicts a nadir for MR of 3 (Shulman et al, 2001), as provoked at exhaustion (Dalsgaard et al, 2004c; Gonzalez-Alonso et al, 2004). However, during activation, glycogen breakdown would provide 1.5 ATP per lactate formed and spare glucose by a corresponding amount, thus increasing MR, whereas glycogen synthesis would increase glucose consumption and subsequently lower MR. If these opposite processes occur simultaneously, the net result is dissipation of 1 ATP per glucoses-phosphate cycled, which in itself will not change MR. Also, the hypothesis implies lactate accumulation and/or efflux from the brain, which is not the case, and glycogen turnover seems too slow, as observed during cerebral activation in the rat (Dienel et al, 2002) and in conscious subjects (Oz et al, 2003).
While MR normalises within 5 mins after exercise, restoration of brain glycogen continues beyond the duration of the stimulus (Dienel et al, 2002) and it remains unknown at what level resynthesis halts. In response to maximal exercise, by integration of the A-JV for glucose, lactate and O2 the surplus cerebral uptake of glucose equivalents amounts to ~10 mmol (Figure 11) and this amount is confirmed by establishing the net carbon balance over the brain (Dalsgaard et al, 2004a). In fact, for submaximal exercise, even though MR remains stable, there is a slight surplus uptake of glucose equivalents (Figure 11). Thus, the cerebral surplus uptake of glucose equivalents is of a magnitude that is compatible with the global glycogen level. Given the lack of a compensatory increase in oxidative metabolism after normalisation of MR when lactate is included, it is conceivable that glycogen resynthesis ‘super-compensates’, as noted in human skeletal muscle after exercise (Bergstrom and Hultman, 1966) and in the brain of rats after glucose deprivation (Choi et al, 2003).
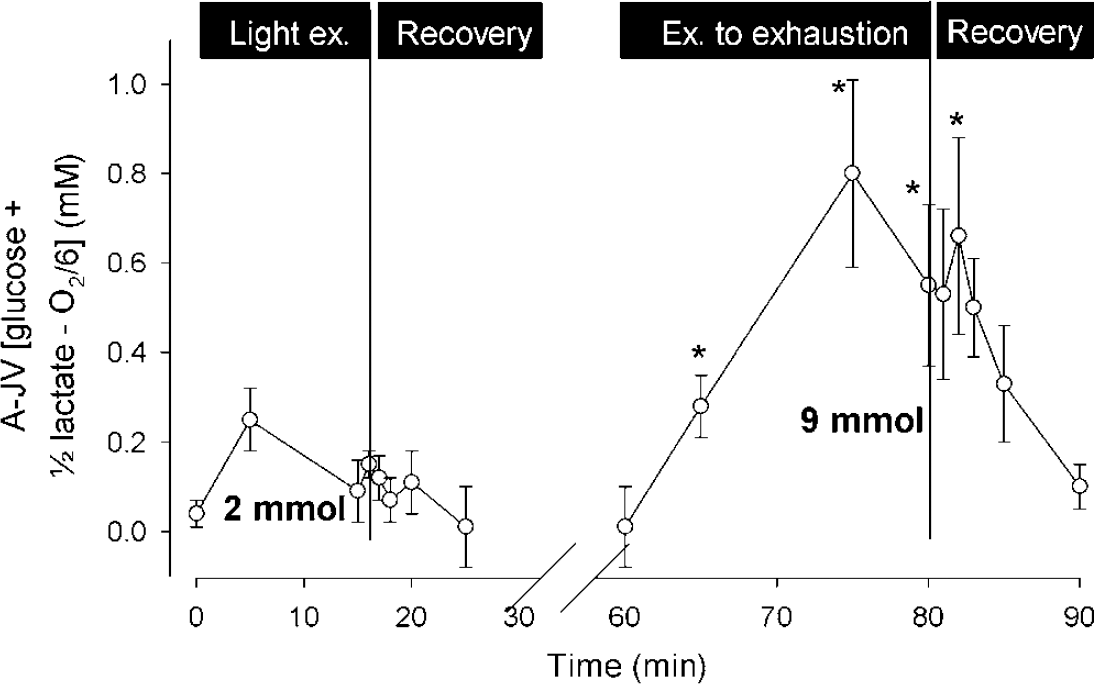
The cerebral ‘surplus’ uptake of glucose plus lactate relative to O2. During and after light exercise, the total ‘surplus’ uptake of glucose equivalents, calculated by integration of the arterial-venous difference for glucose plus lactate that is not accounted for by oxidation, amounts to ~2 mmol, but for maximal exercise it reaches ~ 9 mmol. Data are mean ± s.e.m. from seven subjects. Modified from Dalsgaard et al (2004a).
Compared with the neocortex, the hippocampus neurons have a higher synaptic density and are surrounded by more astrocytes (Choi and Frahm, 1999), so that the two- to three-fold higher glycogen level and the proportional higher enzyme activities of glycogen phosphorylase (unpublished) indicate that glycogen adapts to the metabolic demand. Notwithstanding, rather than explaining the immediate reduction in MR, glycogen metabolism may provide for a long-term balance.
Central Fatigue
Definition and Hypotheses
Undoubtedly, the electrocontractile machinery of skeletal muscles becomes fatigued with repetitive contractions, but also the central nervous system fatigues, as evidenced by a declining corticospinal drive, while the muscle maintains the ability to contract (Nybo and Secher, 2004). This so-called ‘central fatigue’ defines a ‘progressive reduction in voluntary activation of muscle’ (Gandevia, 2001) and may arise along the entire chain of events from the brain to the neuromuscular junction. Yet, fatigue is likely to reside mainly within the brain (Liepert et al, 1996), as shown by a reduced physical performance after a demanding mental task (Mosso, 1904), enhanced performance after conducting ‘diverting activities’ (e.g. exercise with a negligible muscle mass) as compared with a passive recovery (Asmussen and Mazin, 1978b) and on opening of the eyes (Asmussen and Mazin, 1978a). Asmussen (1979) suggests that opening of the eyes enhances arousal, whereas painful impulses relaying in the reticular formation inhibit arousal.
Attempts to account for central fatigue involve an increased cerebral level of the neurotransmitter serotonin, which causes sleep, reduced level of glutamate secondary to uptake of ammonia or a rising temperature within the brain, all of which are applicable for whole-body exercise (Davis, 1995; Gandevia, 2001; Noakes, 2000; Nybo and Secher, 2004), but unlikely to be important when small muscles fatigue.
Brain Metabolism in Fatigue
In the awake state, the flow of thoughts is chaotic with rapid shifts in theme, as visualised by magnetoencephalography with 40 Hz oscillations in neuronal activity throughout the cortex (Llinas and Ribary, 2001). Maybe sustained input to the brain, for example, from muscle pain or the mental effort to exercise, confines activation to distinct brain regions and eventually leads to central fatigue.
Intense stimulation of the brain may require an energy demand that exceeds supply, as illustrated by reduced levels of phosphorous metabolites (Sappey-Marinier et al, 1992) and, eventually, the glycogen level in the astrocytes (Brown et al, 2003) may decrease below a critical level. The ensuing astrocyte task failure would then deteriorate neuronal functioning, for example, because of enhanced extracellular levels of ions (Hertz, 1981) or of neurotransmitters and, perhaps, even be communicated to astrocytes in the vicinity (Kang et al, 1998). Also, as for pain in skeletal muscle, the energetically unfavourable condition in the over-stimulated region might be conveyed to a ‘governor’ (Asmussen, 1979). The other way around, this would explain why mentation provides for a diverting activity.
Of interest, MR reaches its lowest value at exhaustion, suggesting a link between brain metabolism and central fatigue. The low regional MR infers fixed stimulation and shifts in metabolism that may progress to a state of energetic insufficiency. It remains speculative whether such eventual inadequacy of energy provision affects local function or is transmitted to modulating centres, but MR normalises within a few minutes after exhaustive exercise corresponding to the time it often takes an athlete/subject to regain motivation. Of note, cerebral modulation of volition is in accord with AV Hill's proposal of a central governor to protect skeletal muscle and, perhaps even more so, the heart from developing an irreversible (i.e. fatal) state of biochemical imbalance (Noakes, 2000) in analogy with controlling speed by the pedal rather than by the brake.
Perspectives
Reduced motor performance and fatigue are part of the symptomotology of several neuropathologic conditions, for example, chronic fatigue syndrome and mental depression (Chaudhuri and Behan, 2004). The link between brain metabolism and behaviour and mood is illustrated when excitatory agents, for example, amphetamine, stimulate cerebral utilisation of glucose and glycogen (Estler and Mitznegg, 1971). Furthermore, the neurotransmitters noradrenaline and serotonin targeted by antidepressants are important regulators of glycogen metabolism in cell cultures of brain tissue (Cambray-Deakin et al, 1988; Sorg and Magistretti, 1992) and treatment with antidepressant drugs normalises hypometabolism in certain brain regions (Kennedy et al, 2001). While increased metabolism in these cases is coupled to the level of neuronal activity, it is tempting to speculate in terms of brain metabolism for different states of mood and vigour.
Conclusion
During exercise, the MR expresses an enhanced neuronal activity by metabolism in engaged brain regions added to the basal level of activity. Both sensory input from the muscle, and the ‘will’ to exercise and control of muscle groups appear to influence MR (Figure 12) and, when a determined effort is required and beyond, MR decreases with the intensity of exercise to approach a lowest level of ~3 during whole body exercise. Part of the reduction in MR is by the uptake of lactate, which may reach a molar amount similar to that of glucose. The cerebral ‘surplus’ uptake of glucose equivalents relative to O2 might be used for amino-acid synthesis plus accumulation of intermediates and temporal shifts in metabolism may contribute, but the fate and the cell type responsible remain elusive. In fact, an assumed simultaneous breakdown of glycogen adds to the pool of substrate not oxidised and thus not accounted for. However, glycogen is evolving as pivotal in brain metabolism, with deposits several fold larger than previously thought. In that respect, the ‘surplus’ of glucose equivalents equates to the global glycogen level for the human brain and glycogen resynthesis could contribute to establish long-term balance. Thus, glycogenolysis seems to support intense neuronal function and, when cerebral activation becomes confined to specific regions, for example, with repeated excitation of skeletal muscle as during intense exercise, the astrocytic glycogen level may decrease to a critical level. Whatever the reason is for a decreasing MR, it appears to indicate a shortcoming in the fuelling of energy to critical brain areas and thereby provides a biologic manifestation of central fatigue.
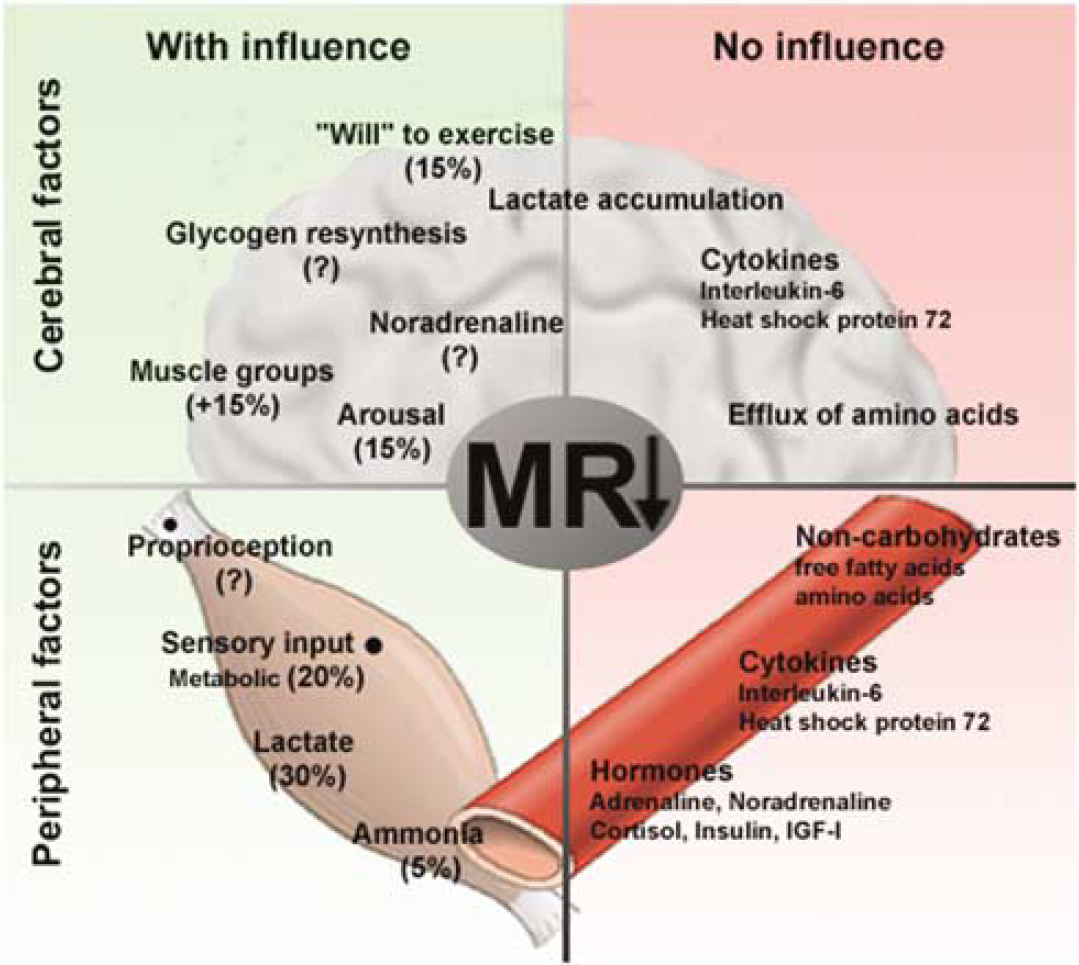
The MR in exercise. The left side (green) depicts factors that are suggested to contribute to the decrease in MR. The right side (red) shows the factors that seemingly do not influence the decrease in MR. Cerebral factors are confined to the upper half of the figure, whereas peripheral factors are on the lower half. ‘Lactate accumulation’ cannot explain the decreasing MR in exercising humans, but it may account for some of the reduction in the rat.
Footnotes
Acknowledgements
I am deeply grateful for the untiring support and encouragement from Professor Niels H Secher. I thank Professor Gerald A Dienel for constructive comments and suggestions to the manuscript.