
Abstract
A dilemma in functional neuroimaging is that immobilization of the subject, necessary to avoid movement artifact, extinguishes all but the simplest behaviors. Recently, we developed an implantable microbolus infusion pump (MIP) that allows bolus injection of radiotracers by remote activation in freely moving, nontethered animals. The MIP is examined as a tool for brain mapping in rats during a locomotor task. Cerebral blood flow–related tissue radioactivity (CBF-TR) was measured using [14C]-iodoantipyrine with an indicator-fractionation method, followed by autoradiography. Rats exposed to walking on a treadmill, compared to quiescent controls, showed increases in CBF-TR in motor circuits (primary motor cortex, dorsolateral striatum, ventrolateral thalamus, midline cerebellum, copula pyramis, paramedian lobule), in primary somatosensory cortex mapping the forelimbs, hindlimbs and trunk, as well as in secondary visual cortex. These results support the use of implantable pumps as adjunct tools for functional neuroimaging of behaviors that cannot be elicited in restrained or tethered animals.
Localization of neural activity in the brain in response to different behaviors or mental processes has been studied in animals with a number of technologies including [15O] positron emission tomography and functional magnetic resonance imaging (Palmer et al., 1999; Spenger et al., 2000; Blaizot et al., 2000; Obayashi et al., 2001). Although each of these approaches offers advantages, one central limitation in their application is that to avoid movement artifact, experimental subjects must be largely immobilized or sedated—interventions that themselves extinguish all but the simplest behaviors. Injection of radiotracers or radiolabeled microspheres through catheters, attached via an implanted body port to an external tether, has allowed the study of regional cerebral blood flow (CBF) in animals that are not immobilized (Foreman et al., 1976; Pannier and Leusen, 1977; Gross et al., 1980; Bryan Jr., 1986). However, the use of tethers is practical only in the study of behaviors of animals in isolation and to behaviors that present a low risk of entanglement of the animal with its catheter. The extent to which tethers reshape “normal” behavior is likely substantial (Becker et al., 1984; Coppinger et al., 1991; Schouten and Wiegant, 1997). Several investigators have reported the ability to image brain activation using 18F-fluoro-2-deoxyglucose for measuring changes in cerebral glucose metabolism (Martinez et al., 1997; Blaizot et al., 2000). Here, imaging typically takes place after completion of the behavior being studied, at a time point when tracer uptake is complete and relatively imperturbable. Limitations here, however, relate to the fact that continuous exposure to the behavior is required for extended periods (usually 30 to 40 minutes), and many behaviors do not show this type of persistence.
To address the problem of immobilization and the need to perform functional brain imaging in a manner that permits rapid capture of short-lived behaviors, while minimizing handling stress, we have recently developed a self-contained, fully implantable microbolus infusion pump (MIP) that allows radiotracer injection by remote activation (Holschneider et al., 2002). The MIP has allowed us to inject CBF tracers in freely moving animals that were not restrained or tethered, and to propose the use of this pump for the study of functional brain mapping using autoradiography. This technology allows functional neuroimaging, with an estimated temporal resolution of less than 12 seconds (Holschneider et al., 2002). Although such temporal resolution is less than that offered by brain electrical recordings using radiotelemetry (Pearce et al., 1998), the CBF technique offers more comprehensive brain maps than the electrophysiologic one, allowing the exploration of extensive cortical and subcortical regions in a single animal. Using this technique, the current study provides the first extensive brain maps of cerebral activation in response to a locomotor challenge in the conscious adult rat.
MATERIALS AND METHODS
Male Sprague Dawley rats (Harlan Sprague–Dawley Labs, Indianapolis, IN, U.S.A.), weighing 350 to 375 g, were used. Experimental protocols were reviewed and approved by the Animal Research Committee of the West Los Angeles VA Medical Center, as well as the University of Southern California. The rats were group housed before surgery and singly housed after surgery on a 12-hour light period between 6:00 a.m. and 6:00 p.m. with free access to water and rodent chow.
Rats were trained over 3 weeks to run on the RotaRod (Columbus Instruments, Columbus, OH, U.S.A.), a rotating cylindrical rod. The rats trained at 20 rpm (7.9 cm/s) for 30 minutes, 5 days a week. Animals were able to easily learn this task and maintain it without falling. After the training period, animals underwent surgical implantation of the MIP.
The design of the MIP, its surgical implantation, loading with the radiotracer, and the in vivo characterization of pressure and flow have been previously described in detail (Holschneider et al., 2002). In brief, the pump consists of a silastic reservoir, which creates a hydraulic pressure source to force liquid out of the MIP at a constant flow rate. Flow is controlled by a solenoid valve inside a separate silicone-embedded electronics module, whose operation is enabled by a phototransistor with peak sensitivity in the infrared spectrum at 880 nm. On being transcutaneously illuminated by infrared light from an external source (an array of 160 light-emitting diodes of wavelengths 850 and 880 nm), the phototransistor produces a photocurrent that activates the controller and latches open the microvalve. Opening of the valve allows the elastomeric reservoir to push the content of the pump out through an intravenous catheter. The MIP is powered with four 3-V lithium batteries located in the electronics module. For functional neuroimaging with a radiotracer, opening of the valve first releases into the animal's circulation the radiotracer contained in the drug ejection chamber of the MIP, and, after a delay of several seconds, injects a euthanasia solution placed in the reservoir.
The total injection volume of the pump is limited by the 1.0-mL volume of the elastomeric reservoir that drives the fluid. The initial flow rate of the MIP is estimated to be ∼170 μL/s (Holschneider et al., 2002), and allows the volume of the saline contained in the intravenous catheter (0.05 mL) and that of the radiotracer (0.3 mL) contained in a drug ejection chamber to be injected in 2 seconds. This represents ∼1.5% of the total blood volume and an injection rate that is ∼10% of cardiac output. This estimate is based on a total blood volume of 24 mL in a 375-g male rat (Lee and Blaufox, 1985) and a cardiac output of 106 mL/min (Delp et al., 1998). The flow rate drops progressively thereafter, with the remainder of the injectate, including the euthanasia solution, finishing its delivery at 7 to 8 seconds after initial triggering of the MIP. The volume of the euthanasia solution (0.65 mL) represents ∼2.7% of total blood volume and an average injection rate that is ∼6% of cardiac output. Arterial pressure recordings obtained during triggering of the MIP reveal a stable perfusion pressure and heart rate until 8 seconds after pump activation (Holschneider et al., 2002). Onset of euthanasia occurs at this time point, with full cardiac arrest at 9 seconds. Here, the perfusion pressure drastically drops, with systolic blood pressures near zero at approximately 12 to 13 seconds after initial pump activation. Recirculation of the tracer through the brain is unlikely in this time frame, given the fact that the time to circulate the entire blood volume of the rat once is estimated at ∼13 seconds.
Animals were anesthetized with halothane (2.5% induction, 1.3% maintenance). The external jugular vein was catheterized with a heparin-bonded polyurethane catheter (3.5F catheter, Instech Laboratories, Inc., Plymouth Meeting, PA, U.S.A.). The catheter tip was advanced to the right atrium, as verified on postmortem autopsy in all animals. The catheter was tunneled through the subcutaneous space to the back, and there connected to the MIP positioned in the infrascapular, dorsal midline. The skin overlying the implant was sutured, allowing for a percutaneous access port (a 2-cm silastic tubing capped with a stainless steel plug). The percutaneous port was used postoperatively for daily flushes of the catheter (20 U heparin in 0.5 mL saline).
On postoperative day 5, the animal was immobilized for 5 minutes in a rodent restrainer (DecapiCone, Braintree Scientific, Braintree, MA, U.S.A.). Keeping the valve in the closed position, the MIP was loaded through the percutaneous port with the CBF tracer, [14C]-iodo-antipyrine (100 μCi/kg in 300 μL of 0.9% saline, Amersham Biosciences, Piscataway, NJ, U.S.A.). Thereafter, the euthanasia solution (1.0 mL of pentobarbital 50 mg/kg, 3 mol/L potassium chloride) was loaded into the reservoir. After removal from the restraining device, animals were allowed to recover undisturbed for 45 minutes in a 12 × 20-cm acrylic plastic rodent cage. Rats were then exposed under standard laboratory fluorescent light conditions, to slow walking on the rotating cylindrical rod (n = 8) at a reduced speed of 8 rpm (3.1 cm/s). Control animals (n = 7) remained undisturbed in the transport cage while being exposed to the sound of the rotating cylindrical rod. Triggering of the pump by a pulse of infrared light occurred after a 2-minute exposure to the locomotor or control paradigm.
Cerebral blood flow–related tissue radioactivity was measured using [14C]-iodoantipyrine with an indicator-fractionation method (Goldman and Sapirstein, 1973; Van Uitert and Levy, 1978; Gjedde et al., 1980; Sage et al., 1981; Patlak et al., 1984; Lee and Blaufox, 1985). In this method, there is a strict linear proportionality between tissue radioactivity and CBF when measurements are made within a brief interval (∼10 seconds) after injection of the radiotracer (Van Uitert and Levy, 1978). Triggering of the pump resulted in bolus intravenous injection of the radiotracer followed immediately by injection of the euthanasia solution, which resulted in cardiac arrest within 9 seconds, a precipitous decrease of arterial blood pressure, termination of brain perfusion, and death (Holschneider et al., 2002). The brains were rapidly removed, flash frozen in methylbutane at −70°C, embedded in OCT compound (Miles Inc., Elkhart, IN, U.S.A.) and stored at −70°C.
Brains were subsequently cut in a cryostat at −20°C in 20-μm-thick coronal sections. Sections were heat-dried on glass slides and exposed for 2 weeks at room temperature to Kodak Ektascan films in spring-loaded x-ray cassettes along with 16 radioactive 14C standards (Amersham Biosciences, Piscataway, NJ). Autoradiographs of brain sections were digitized. In each slice, the optical density was measured for six to eight locations along the cortical rim within each hemisphere using Image Pro-Plus software (Media Cybernetics, Silver Springs, MD, U.S.A.). Regions were sampled using a radial grid overlay, spaced in 15° intervals from the midline. Overlay of this template on to the digitized brain slice images allowed measurement of the optical density of locations in the cortical mantle in a manner invariant between animals.
The topographic distribution of the CBF–related tissue radioactivity (CBF-TR) on the dorsal, lateral, and basal cortical surfaces was displayed for every group as an anatomic map of the mean z scores. In these two-dimensional maps of the flattened cortex, the x-axis (locations) represented the lateral distance from the midline (in mm) along the cortical rim. The y-axis (slices) represented coronal slices, numbered from rostral to caudal, with distance relative to bregma in millimeters (positive values being rostral to this landmark). The z scores of CBF-TR are coded on a color scale. To avoid discontinuities in the graphic representation, the space between our 46 coronal brain slices and 12 to 20 locations within each slice, where there were no measurements, was filled with values calculated by a standard linear interpolation. The borders among cortical regions, as defined and measured in the anatomic atlas of Paxinos and Watson (Paxinos and Watson, 1998), were drawn on the cortical maps to allow a visual correlation between CBF patterns and regional anatomy.
Subcortical structures sampled at anterior–posterior (AP) coordinates relative to bregma included AP 1.60 mm: striatum (dorsomedial, dorsolateral, ventrolateral), white matter; AP −0.26 mm: lateral septum; AP −0.80 mm medial preoptic area; AP −2.12 mm: hypothalamus (ventromedial), thalamic nuclei (centromedial, ventrolateral, lateral dorsal); AP −3.60 mm: lateral habenular nucleus, mediodorsal thalamic nucleus; AP −4.80 mm: substantia nigra (reticular); AP −5.80 mm: hippocampus (CA1, CA2), interpeduncular nucleus, medial geniculate nucleus (dorsal, medial, ventral); AP −6.30 mm: superior colliculus, red nucleus (magnocellular); AP −8.80 mm: inferior colliculus (external cortex, central nucleus). Cerebellar structures sampled at AP −10.04 mm were: central gray, crus 1, lobules 1 to 5 (medial), pontine reticular nucleus (caudal), simple lobule A and B, superior olive; AP −10.80 mm: crus 1, lobules 4 to 6 (medial), facial nucleus, medial vestibular nucleus; AP −12.80 mm: crus 2, intermediate/parvocellular reticular nucleus, lobules 6, 9, 10 (medial); AP 13.30 mm: lobules 7 to 10 (medial), paramedian lobule, copula pyramis. Quantification of optical density of autoradiograms and comparison with that induced by standards of known radioactivity allowed determination of 14C tissue radioactivity.
The animal's tissue radioactivity values were averaged by region for the left and right hemispheres. For every experimental group, means and standard deviations of the means (SD) were calculated for each location, each slice (all locations in a given slice), and globally (all locations in all slices). Tissue radioactivity group differences in slice and global averages were assessed by t-tests (unpaired, two-tailed, P < 0.05). In addition, statistical mapping of the patterns of group differences was performed. A Z-score transformation (Hays, 1973) was performed on the tissue radioactivity data to produce patterns of regional tracer concentrations for each animal. This transformation eliminated variations in mean tracer distribution between subjects and experimental groups created by global effects on vascular smooth muscle and systematic experimental error. The z scores were calculated as:z scorei = (TRi − mean)/SD, where Z scorei was the standard normal deviate of tissue radioactivity at location i, and TRi was the tissue radioactivity of location i. The mean and SD were defined in a given animal as the average and standard deviation of the data set, which included all tissue radioactivities of the selected cortical, subcortical, and cerebellar regions. Differences in regional CBF-TR of animals exposed to the motor challenge and controls were compared using t tests (unpaired, two-tailed, P < 0.05).
RESULTS
Z-scores maps of CBF-TR in control animals are shown in Fig. 1 (top panel). Control animals revealed their highest regional Z-scores in primary somatosensory cortex mapping the barrel field (S1BF), jaw and oral region (S1J), secondary somatosensory cortex (S2), anterior-medial aspects of the auditory cortex (Au), and anterior-lateral portions of visual cortex (V2). Lowest regional z scores were seen in the amygdala (A), entorhinal (Ent), posterior perirhinal (PRh), retrosplenial (RSA), and posterior piriform cortex (Pir). This topographic pattern was similar to that described previously in the unanesthetized, restrained rat (Scremin et al., 1997; Holschneider and Scremin, 1998).
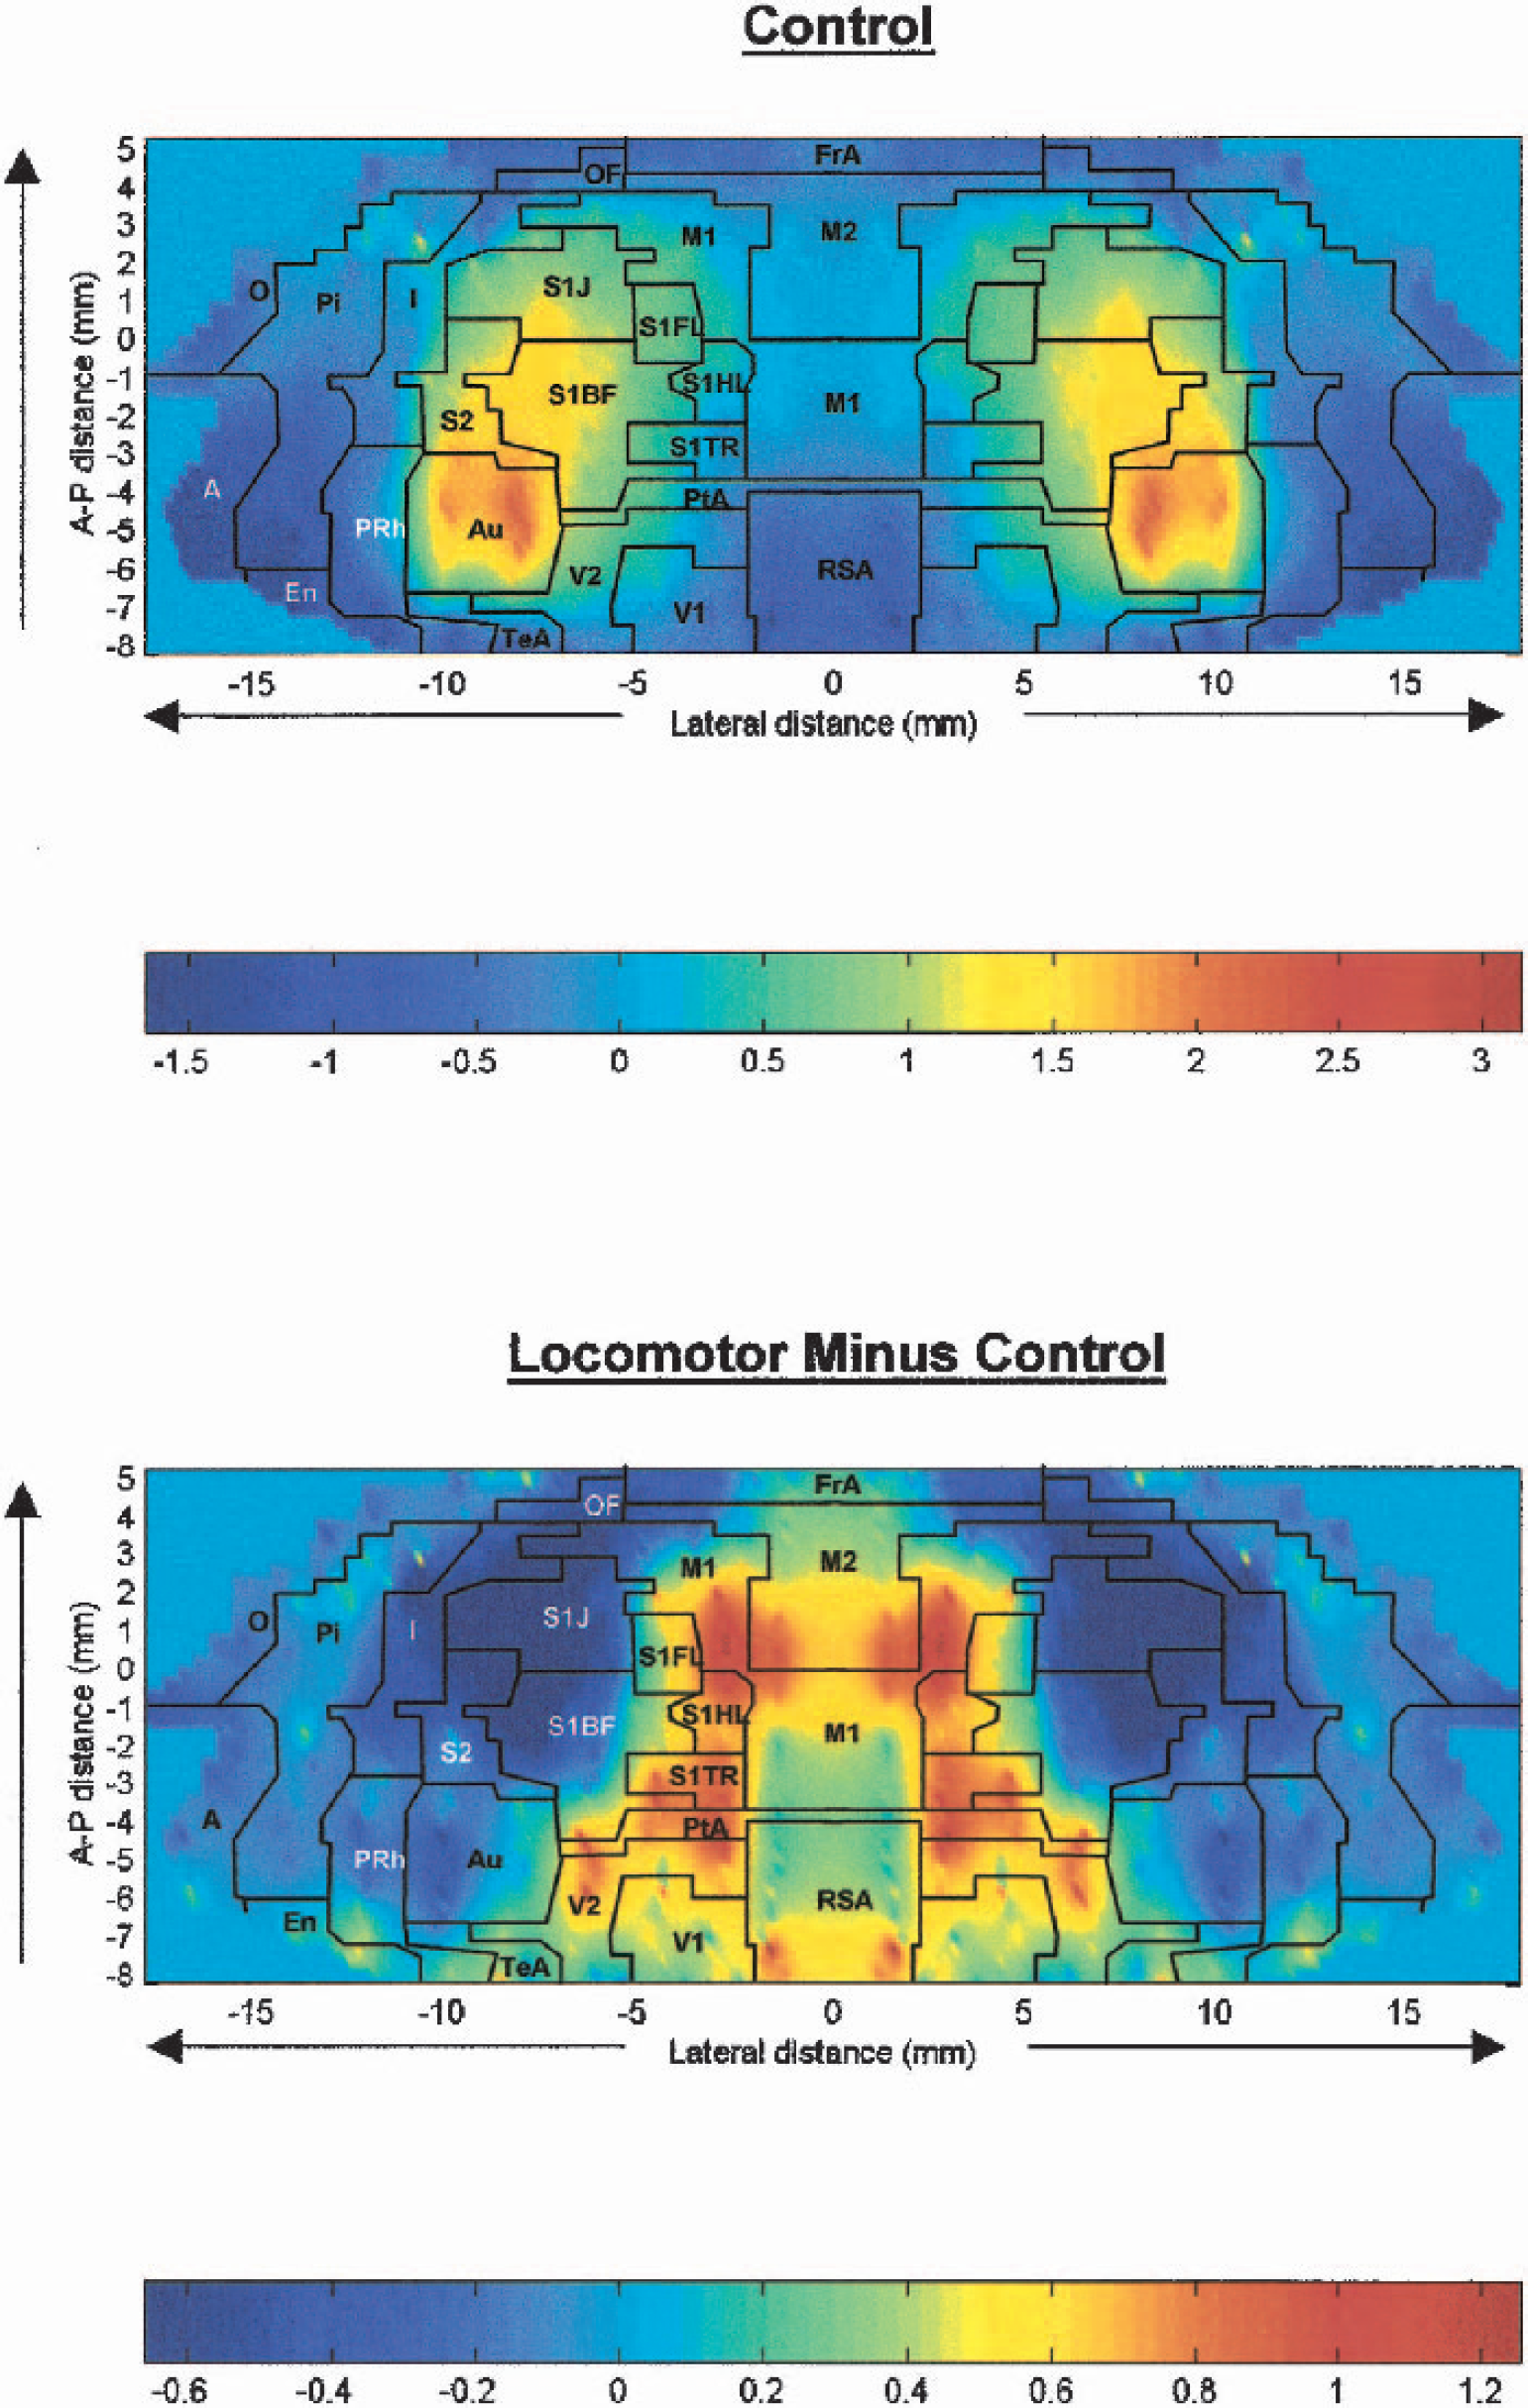
Map of the color-coded average Z-scores of regional cerebral blood flow–related tissue radioactivity (CBF-TR) on the two-dimensional surface of the flattened cortex.
Representative autoradiographs of animals walking compared to quiescent controls are shown in Fig. 2. A cortical map of changes in CBF-TR related to the locomotor challenge is shown in Fig. 1 (bottom panel); its corresponding statistical parametric map is described in Fig. 3. Significant changes in z scores in response to treadmill walking were seen in motor circuits, and involved increases in primary motor cortex (M1, range:P < 0.01 to < 0.001), dorsolateral striatum (P < 0.02), the ventrolateral thalamus (P < 0.02) and cerebellar structures, including cerebellar lobules 3 (P < 0.005), 4 (P < 0.002), 5 (P < 0.003), 6 (P < 0.05), 7 (P < 0.01), 8 (P < 0.005), 9 (P < 0.01), the copula pyramis (P < 0.005), and the paramedian lobule (P < 0.01). In somatosensory circuits, significant increases in CBF-TR were seen in primary somatosensory cortex mapping the forelimbs (S1FL), hindlimbs (S1HL), and the trunk (S1TR)(range:P < 0.01 to < 0.001), whereas significant decreases appeared in primary somatosensory areas mapping the jaw and oral region (S1J), the barrel field cortex (S1BF), and anterior areas of secondary somatosensory cortex (S2) range:P < 0.01 to < 0.001). Visual cortex (mostly V2), as well as parietal association cortex and posterior aspects of retrosplenial cortex, also showed significant increases in CBF-TR (range:P < 0.01 to < 0.001). In addition, Z scores were decreased in the medial, dorsal, and ventral aspects of the medial geniculate nucleus (P < 0.005), the external cortex and central nucleus of the inferior colliculus (P < 0.01 and P < 0.005, respectively), as well as the superior colliculus (P < 0.05). There were no statistical differences between the locomotor and control group in nontransformed CBF-TR or z scores of CBF-TR calculated by slice or globally across all cortical regions.
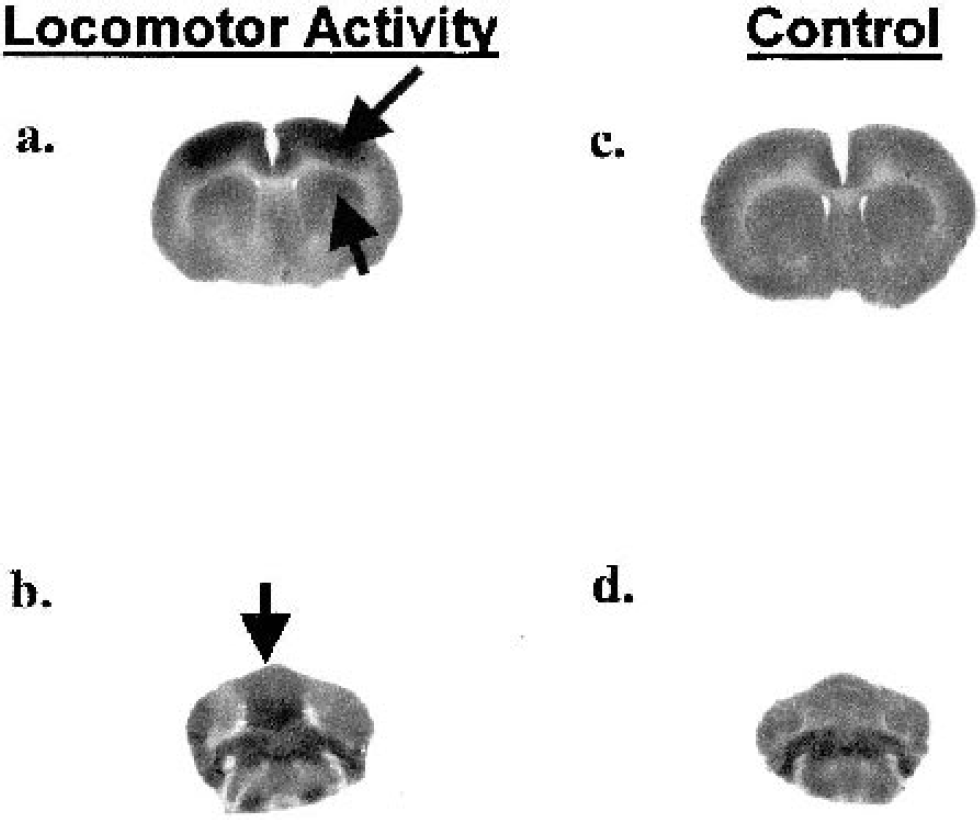
Representative coronal autoradiographs of animals walking
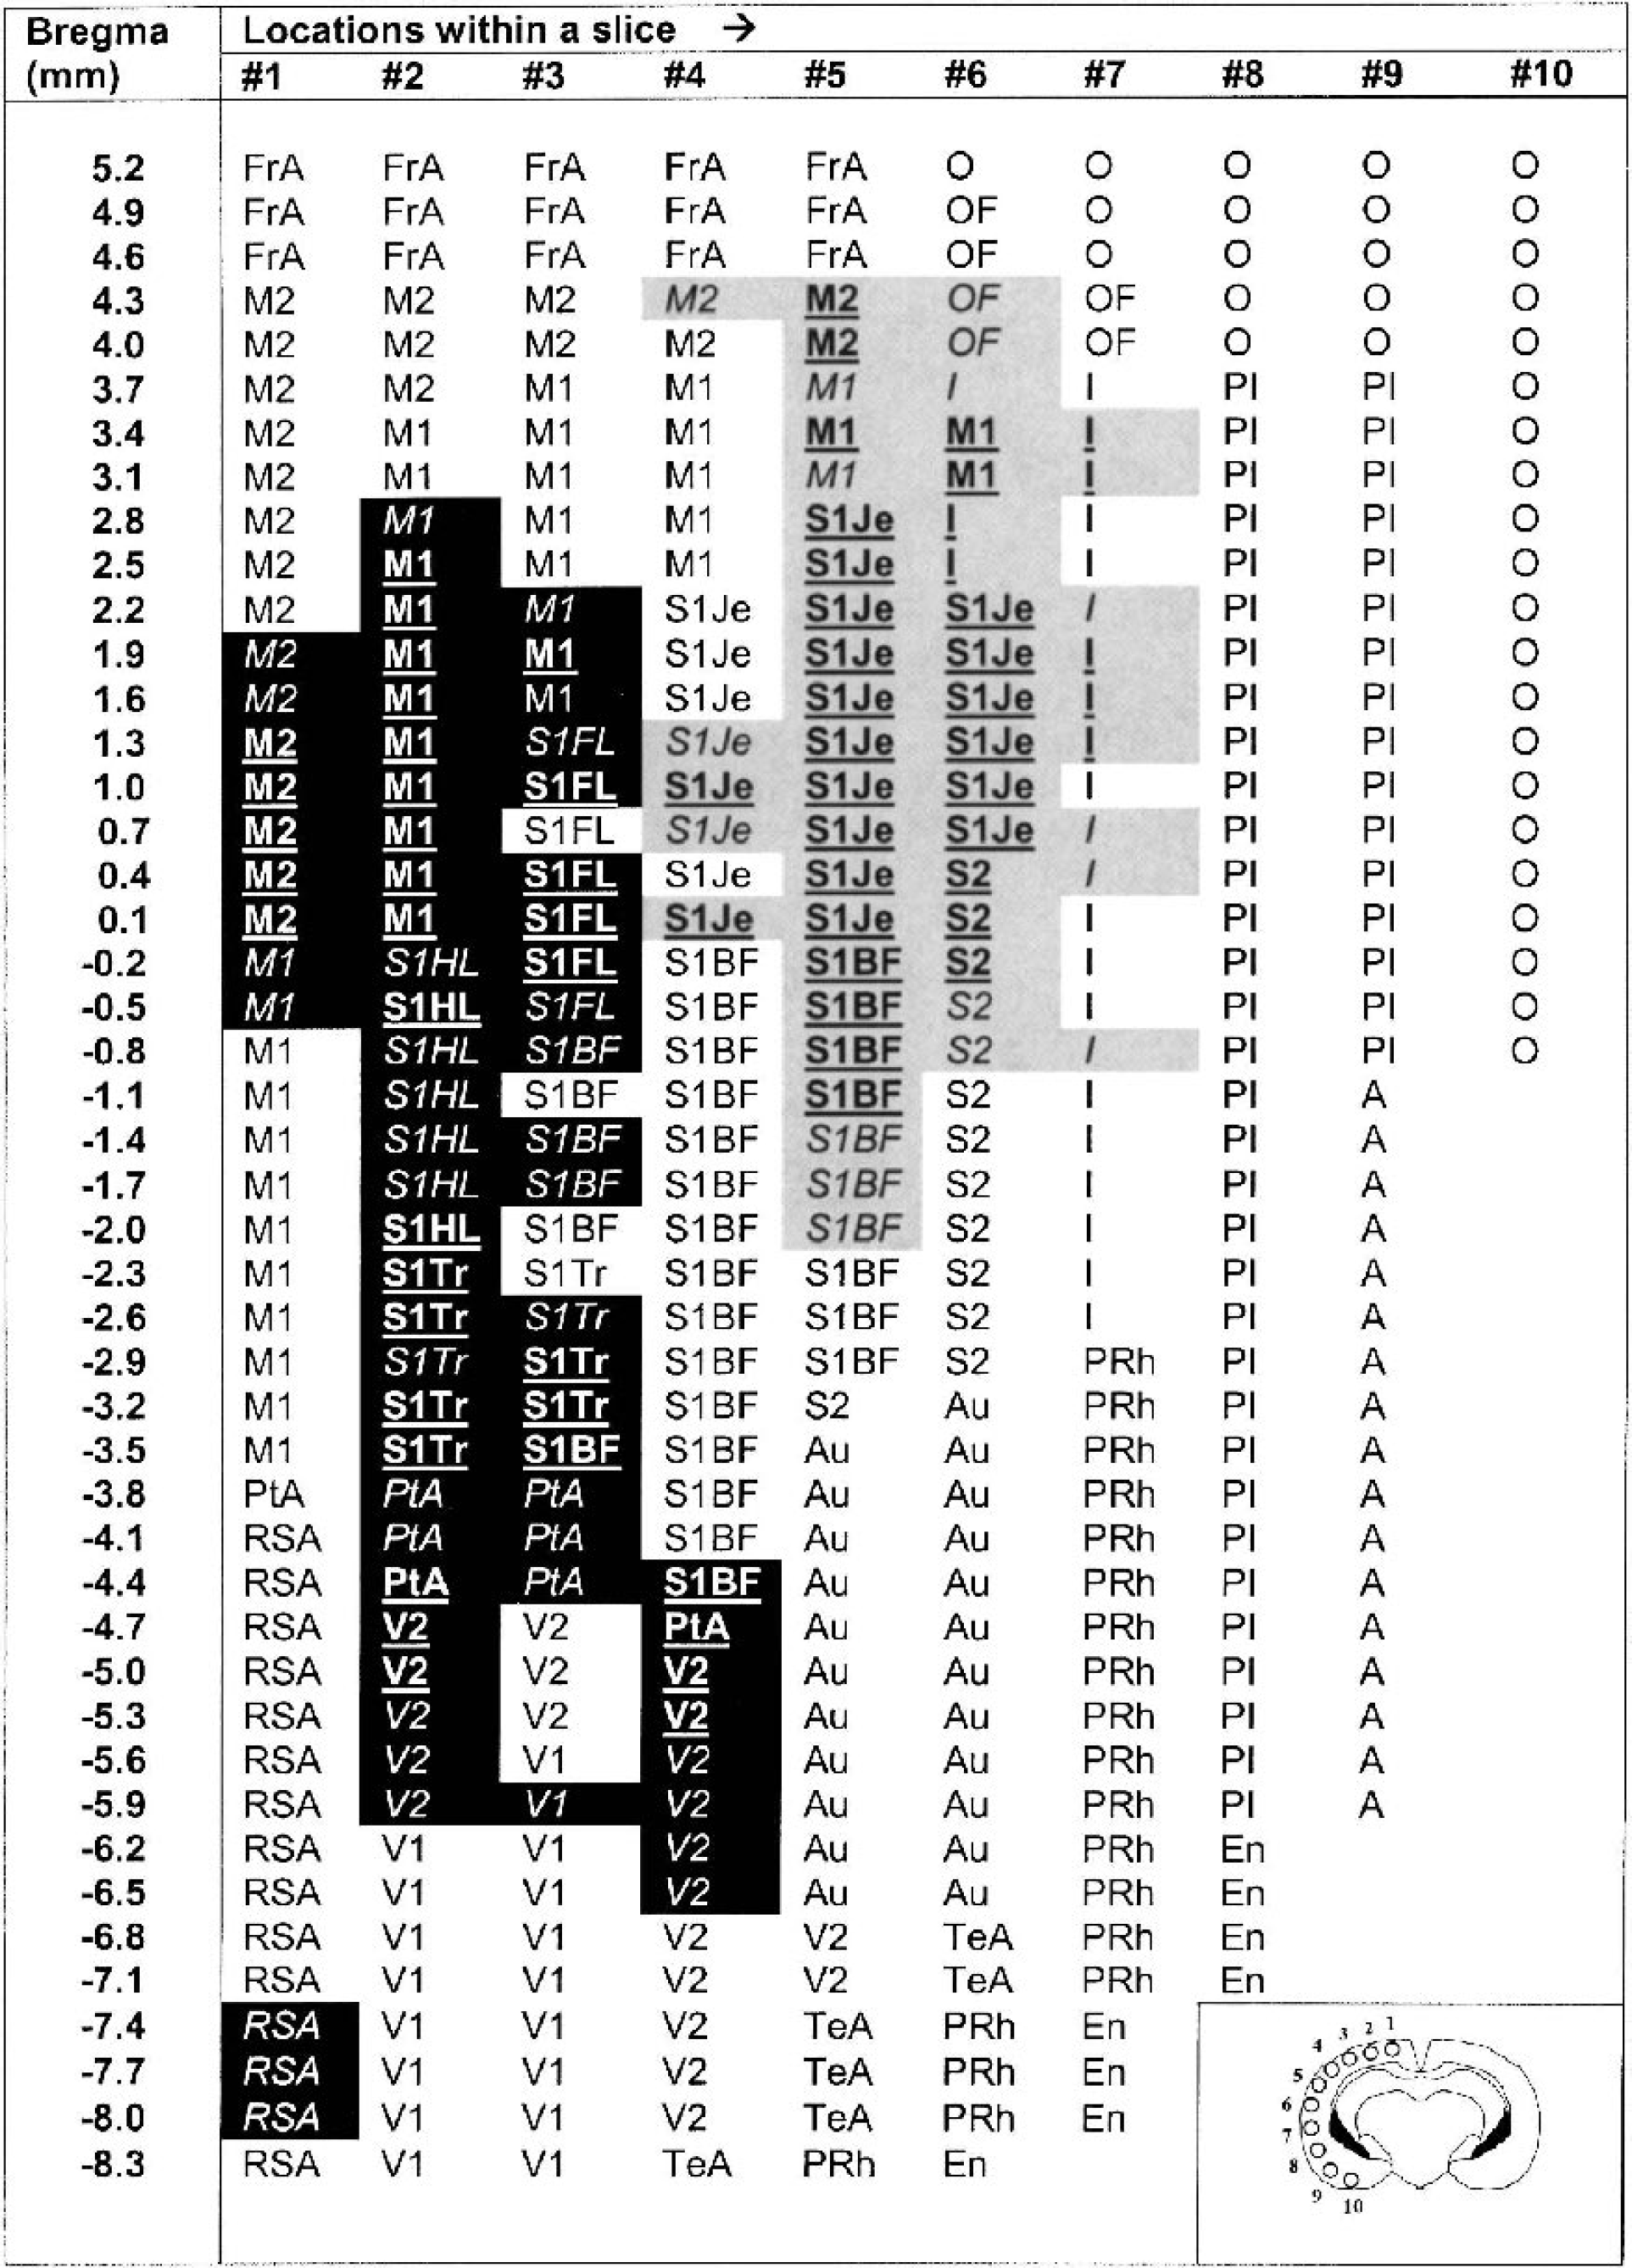
Statistical parametric maps of group differences between Z-scores of regional cortical blood flow related tissue radioactivity (CBF-TR) of the Motor and Control animals. Rows represent coronal slices from rostral to caudal, with distances to bregma in millimeters. Within each slice (rows) cortical locations #1–10 are depicted from medial to lateral. Locations sampled are shown in a representative slice in the figure inset. Shaded cells represent group differences significant at the P< 0.01 level (italics) or P< 0.001 (bold and underlined). Cells depicted as white text on a black background represent significant increases in CBF-TR compared to controls (Z scoreMotor minus Z scoreControl > 0). Cells depicted as black text on a gray background represent significant decreases in CBF-TR (Z scoreMotor minus Z scoreControl < 0). Abbreviations of the anatomic regions are as defined in Figure 1.
DISCUSSION
Treadmill walking on the rotating cylindrical road is a complex behavioral task that requires integration of neural circuits subserving motor and sensory functions. Consistent with this characteristic, increases in CBF-TR in our study were seen not only in motor circuits (primary motor cortex, dorsolateral striatum, ventrolateral thalamus, midline cerebellum), but also in primary somatosensory cortex mapping the forelimbs, hindlimbs, and the trunk. Visual cortex as well as the superior colliculus also showed significant alterations in CBF-TR in animals on the treadmill, consistent with changes in visual processing required for this task.
Because in our application direct arterial blood sampling during the tracer injection was not undertaken, we did not obtain measures of absolute CBF, but rather patterns of tissue radioactivity. Hence, the significant decrease of CBF-TR noted in primary somatosensory cortex mapping the barrel field, jaw, and oral region suggests a redistribution of perfusion away from these areas during the treadmill task.
To our knowledge, our study is the first to report detailed maps of CBF-TR in nontethered, nonrestrained rats during a locomotor task. Results are consistent with work by Greenough, who in nonrestrained rats reported asymmetric changes in regional 2-deoxyglucose uptake in brain during performance of a unilateral reaching task in forelimb motor and somatosensory cortex, caudate-putamen, superior colliculus, inferior colliculus, and regions of the cerebellum (Greenough, 1984). Findings from our study show an increase in CBF-TR in visual cortex but a decrease in the superior colliculus. Such dissociation in the visual system appears to depend on the type visual stimulus and has been reported by others under diffuse lighting conditions (Rooney and Cooper, 1988; Cooper and Allen, 1995). In our study, increases in the striatum of CBF-TR were seen dorsolaterally but not dorsomedially or ventrolaterally. This observation is in agreement with histologic evidence in rats that demonstrates specific projections from forelimb and hindlimb areas of the somatosensory cortex to the dorsolateral quarter of the striatum (Cospito and Kultas-Ilinsky, 1981; Ebrahimi et al., 1992). Increases in CBF-TR noted in the ventrolateral thalamus are consistent with histologic evidence showing that the principal thalamic input to primary motor cortex arises ventrolaterally (Donoghue and Parham, 1983).
Although quadrupel gait may involve activation of different neural circuits than bipedal gait, a comparison of our work in rats to that obtained by others in human subjects may be of related interest. Our results concur with work in humans that demonstrated increases of regional CBF in the supplementary motor area, medial primary sensorimotor area, the striatum, visual cortex, and the cerebellar vermis during walking using single photon emission computed tomography (Fukuyama et al., 1997).
Our results are also largely in agreement with those obtained previously using electrophysiologic or pharmacologic techniques. Stimulation of the forelimbs and hindlimbs has been shown to elicit extracellular recorded responses in the vermis of lobules 2 to 7 (Saint-Cyr and Woodward, 1980), and increases in regional metabolism in the copula pyramis and paramedian lobule (Santori et al., 1986). Decreases in locomotor activity have been reported after injection of dopamine agonists and antagonists into the region of lobule 9/10 (Boulay et al., 2000). These findings are consistent with our results, which show increases in CBF-TR in response to the motor challenge in the midline of cerebellar lobules 3 to 9, the copula pyramis, and paramedian lobule.
Studies evaluating effects of direct brain electrical stimulation have reported functional brain activation, in the areas cited above, as well as in areas not determined to show significant changes in our paradigm (Collins et al., 1986; Sharp et al., 1989). These include changes reported by some, but not others, in the red nucleus, the substantia nigra, the pontine nuclei, the ventromedial thalamus, and the cerebellar hemisphere. The possibility needs to be considered that in these studies, the 30- to 60-minute application of direct brain stimulation, necessary for producing changes in regional brain metabolism (Collins et al., 1986) or early gene response (c-fos) (Sharp et al., 1989; Wan et al., 1992), may have produced unphysiologic patterns by activating areas unrelated to the behavior. In our study, an absence of significant changes in CBF-TR in such well-known motor areas as the red nucleus does not constitute evidence of absence of their functional importance during locomotion. Rather, it may reflect the limits of resolution of the autoradiographic technique (∼0.1 mm), as well as the fact that many structures in the brain may display a nontopographic, mosaic organization of their afferent and efferent projections (Shambes et al., 1978; Gerfen, 1992).
Resolution of the autoradiographic technique is to a large extent determined by diffusion of [14C]-iodoantipyrine—either due to a prolonged infusion period or as a postmortem artifact (Jay et al., 1988; Williams et al., 1991; Hatakeyama et al., 1992; Tajima et al., 1992). For rapid bolus injections, as in our study, diffusion during the period of administration of the radiotracer would likely be minimal. Postmortem diffusion in our study could have occurred over a 3-minute period, which is the estimated time it took from the time of cardiac arrest to removal and freezing of the brain. In our study, regional changes in CBF-TR were extremely robust; all animals performing the treadmill task could easily be distinguished from controls by visual inspection of the motor cortex, striatum, and midline cerebellum in the autoradiographs. Nevertheless, it is well known that diffusion due to delays in freezing of the brain may result in a loss of heterogeneity in the autoradiographs. Such a loss of heterogeneity may in our study have resulted in an underestimation of z score differences in CBF-TR, with a possible loss of power to detect small but significant group differences. An improved method for future work, as has been proposed by others (Williams et al., 1991; Hatakeyama et al., 1992), might include decapitation of the euthanized animal, followed by rapid freezing of the head in liquid nitrogen.
Our study shows that remote activation of an implantable infusion pump allows bolus administration of the flow tracer [14C]-iodoantipyrine in a freely moving animal without the potential confound of handling stress. Currently, there is no commercially available implantable infusion system that allows for rapid bolus delivery of radiotracers in small animals without the use of restraints or attachment to an external motor-driven pump. Our results suggest that the MIP is a promising tool for mapping regions of brain activation, and could be used in future studies to investigate the basic emotional and behavioral neuronal circuits underlying normal and abnormal mammalian brain function.
Footnotes
Acknowledgments
We thank Ben Mandelkern for his assistance in the optical density measurements.