
Abstract
Dysregulation of sodium [Na+]i and calcium [Ca2+]i homeostasis plays a pivotal role in the pathophysiology of cerebral ischemia. Three gene products of the sodium–calcium exchanger family NCX1, NCX2, and NCX3 couple, in a bidirectional way, the movement of these ions across the cell membrane during cerebral ischemia. Each isoform displays a selective distribution in the rat brain. To determine whether NCX gene expression can be regulated after cerebral ischemia, we used NCX isoform-specific antisense radiolabeled probes to analyze, by radioactive in situ hybridization histochemistry, the pattern of NCX1, NCX2, and NCX3 transcripts in the ischemic core, periinfarct area, as well as in nonischemic brain regions, after 6 and 24 h of permanent middle cerebral artery occlusion (pMCAO) in rats. We found that in the focal region, comprising divisions of the prefrontal, somatosensory, and insular cortices, all three NCX transcripts were downregulated. In the periinfarct area, comprising part of the motor cortex and the lateral compartments of the caudate-putamen, NCX2 messenger ribonucleic acid (mRNA) was downregulated, whereas NCX3 mRNA was significantly upregulated. In remote nonischemic brain regions such as the prelimbic and infralimbic cortices, and tenia tecta, both NCX1 and NCX3 transcripts were upregulated, whereas in the medial caudate-putamen only NCX3 transcripts increased. In all these intact regions, NCX2 signal strongly decreased. These results indicate that NCX gene expression is regulated after pMCAO in a differential manner, depending on the exchanger isoform and region involved in the insult. These data may provide a better understanding of each NCX subtype's pathophysiologic role and may allow researchers to design appropriate pharmacological strategies to treat brain ischemia.
Keywords
Introduction
A common feature of cerebral ischemia is the progressive accumulation of intracellular concentration of sodium [Na+]i and calcium [Ca2+]i ions, which can precipitate necrosis and/or apoptosis of vulnerable neurons (Meyer, 1989; Lipton, 1999). The sodium–calcium exchanger (NCX), an integral protein belonging to the superfamily of plasma membrane exchangers, represents one of the major mechanisms for maintaining [Na +]i and [Ca2+]i homeostasis in response to brain ischemia. Indeed, depending on the levels of [Na+]i and [Ca2+]i, NCX can operate either in the forward mode, coupling the uphill extrusion of Ca2+ to the influx of Na+ ions, or in the reverse mode, coupling the extrusion of Na+ and the influx of Ca2+ ions (Blaustein and Lederer, 1999; Philipson and Nicoll, 2000; Annunziato et al, 2004). To date, three NCX genes, NCX1, NCX2, and NCX3, have been identified and cloned (Nicoll et al, 1990, 1996; Li et al, 1994). However, whereas NCX1 is ubiquitously expressed, NCX2 and NCX3 have been found exclusively in the brain and in the skeletal muscle tissues (Lee et al, 1994). Specifically, all three NCX isoforms are expressed in neurons, astrocytes, oligodendrocytes and microglia (Quednau et al, 1997; Thurneysen et al, 2002; Nagano et al, 2004). A recent report from our laboratory has clearly indicated that both the transcripts and the proteins of the three NCX isoforms appear to be selectively expressed in several areas of the CNS, thus suggesting that the large heterogeneity of NCX isoforms generated by the three genes might serve selective functional roles in distinct regions of the brain (Papa et al, 2003). Over the last few years, although extensive studies have focused on the relevant function played by NCX during focal ischemia (Annunziato et al, 2004), a thorough understanding of its role still remains a controversial issue. Particularly, conflicting results have hampered our understanding as to whether suppression or activation of the exchanger would yield potentially beneficial effects on cerebral ischemia (Andreeva et al, 1991; Kiedrowski, 1999; Schroder et al, 1999; Amoroso et al, 2000; Matsuda et al, 2001; Pignataro et al, 2004a, b). Furthermore, because the three NCX isoforms are differently distributed in the brain, it would be of crucial importance to differentiate the expression of each NCX gene transcript according to the brain regions involved in the ischemic process. Therefore, to address this issue, we assessed the pattern of NCX1, NCX2, and NCX3 gene transcripts in the ischemic core, in the periinfarct area, as well as in intact brain regions, after 6 and 24 h of permanent middle cerebral artery occlusion (pMCAO). To this aim, we performed a radioactive in situ hybridization histochemistry using NCX isoform-specific antisense radiolabeled oligonucleotide probes.
Materials and methods
Animals
Male Sprague–Dawley rats (Charles River, Calco, Italy) weighing 250 to 270 g were used in this study. Animals were housed in a temperature and humidity controlled colony room under diurnal lighting conditions (12 h of darkness and 12 h of light), and were allowed to adapt to human handling. Food and water were allowed ad libitum. Experiments were performed on 30 rats, and all animal use procedures were in accordance with the international guidelines for animal research. The experimental protocol was approved by the Animal Care and Use Committee of ‘Federico II’ University of Naples.
Surgical Procedures
The pMCAO was performed as previously described (Pignataro et al, 2004a, b ). Briefly, all rats anesthetized intraperitoneally with chloral hydrate (400 mg/kg body weight) were divided into three groups: (1) control (n = 5); (2) sham-operated (n = 5); (3) ischemic rats (n = 5), the last of which received a permanent occlusion of the middle cerebral artery (pMCAO) for the 6 and 24 h groups. All surgical procedures were performed under an operating stereomicroscope (Nikon SMZ800, Nikon Instruments, Florence, Italy). A 2-cm incision was made vertically between the orbit and the ear, and another was made to divide the temporal muscle. The left lateral aspect of the skull was then exposed by reflecting the temporal muscle surrounding the soft tissue. Next, a small window (diameter = 2 mm) was made just over the visibly identified middle cerebral artery (MCA). Saline solution was applied to the area throughout the procedure to prevent heat injury. The left pMCAO was performed by electrocoagulation with a bipolar electrocauterizer (Diatermo MB122; G.I.M.A., Milan, Italy). Permanent middle cerebral artery occlusion was performed as close as possible to its origin, near the circle of Willis (Tamura et al, 1981). In addition, to prevent the fact that the electro-coagulation of the MCA might cause small coagulation lesions of the cerebral cortex, which in turn might elicit spreading depression unrelated to that induced by the ischemic lesions, MCA was first slightly lifted up and then immediately occluded with a bipolar electrocauterizer forceps. The body temperature was continuously monitored with a rectal probe (Homoeothermic Blanket System, Harvard Apparatus, London, UK) and maintained at 37°C ± 0.5°C until awakening. After awaking, the animals were kept at 37°C ± 0.5°C by placing them in a warmed environment. In sham-operated animals, all procedures, except for electrocoagulation of MCA, were carried out.
Monitoring of Blood Gas Concentration and Cerebral Blood Flow with Laser-Doppler Flowmetry
In some of the experimental and sham-operated rats, a catheter was inserted into the femoral artery to measure arterial blood gases with a blood gas analyser (Rapid lab 860; Chiron Diagnostic, Emeryville, CA, USA). Cerebral blood flow (CBF) was monitored in the cerebral cortex ipsilateral to the occluded MCA with a laser-doppler flowmeter (Periflux system, 5000; Milan, Italy) provided with PC software (Perisoft PSW1, Perimed, Stockholm, Sweden) that recorded the blood flow (Iadecola et al, 1996). In particular, after exposing the skull, we drilled a hole 1 to 2 mm in diameter under a dissecting microscope at a site 2.5 to 3 mm lateral to the midline and 4.2 to 4.5 mm rostral to the interaural line. The dura was left intact and the laser-doppler flowmeter probe (tip diameter 0.8 mm) was positioned 0.5 mm above the dural surface. Once a stable CBF signal was obtained, the MCA was occluded. Cerebral blood flow monitoring was continued up to 30 mins after the end of the surgical procedure. The physiologic parameter values of rats subjected to sham surgery or MCAO are shown in Table 1.
Physiological parameters in rats subjected to sham surgery or pMCAO
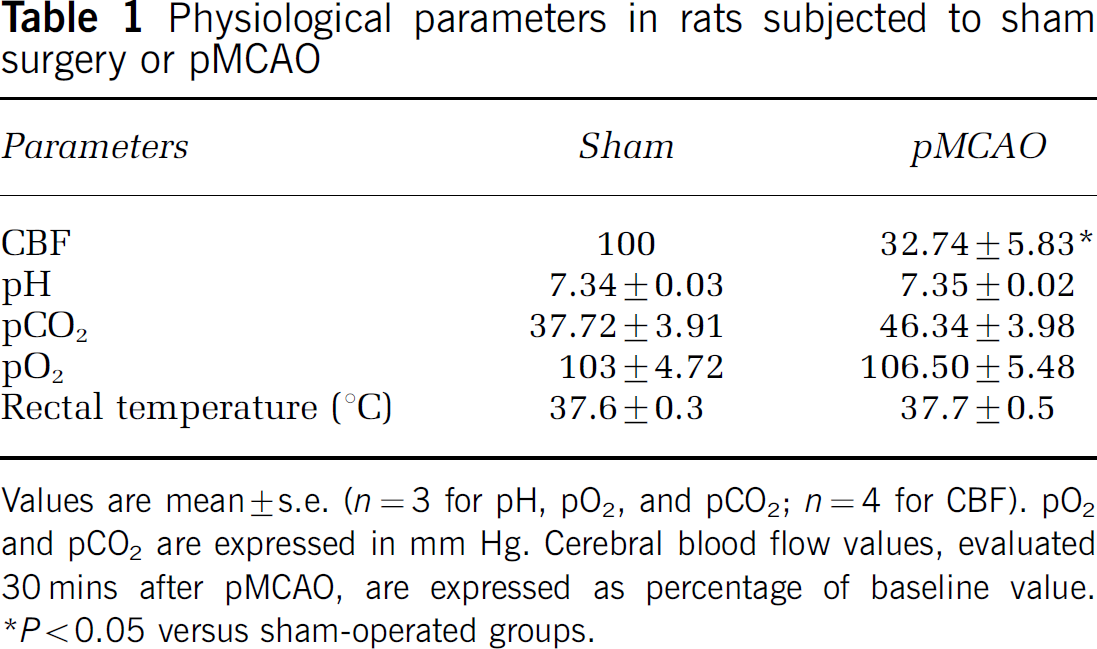
Values are mean ± s.e. (n = 3 for pH, pO2, and pCO2; n = 4 for CBF). pO2 and pCO2 are expressed in mm Hg. Cerebral blood flow values, evaluated 30 mins after pMCAO, are expressed as percentage of baseline value. *P < 0.05 versus sham-operated groups.
Tissue Preparation
The animals were decapitated 6 or 24 h after the onset of the pMCAO. The brains, rapidly removed and quickly frozen on powdered dry ice, were stored at −70°C before sectioning. Serial coronal sections of 12 µm were cut on a cryostat (Cryo-Star HM 560 MV, Microm International GmbH, Walldorf, Germany) at the following levels: medial prefrontal cortex (PFC), anterior caudate-putamen (CPu), posterior caudate putamen (CPu), and dorsal hippocampus (H). All sections corresponded approximately to the bregma levels of +3.20, +1.60, −0.30, −3.14 mm, respectively (Paxinos and Watson, 1998). Each slide contained three adjacent sections of each animal. To select identical anatomic levels in control, sham-operated, and ischemic sections, thionin-stained reference slides were used. Sections were thaw-mounted onto gelatin-coated slides and stored at −70°C for subsequent analysis.
Oligonucleotide Probes and Radiolabeling for In Situ Hybridization
The antisense oligonucleotide probes for labeling NCX1, NCX2, and NCX3 transcripts (MWG Biotech, Florence, Italy) are listed in Table 2. To maximize probe specificity, the probe sequences were chosen in regions of low nucleotide homology among the different NCX isoforms (Table 2). In addition, to maximize the probe stability, we selected those sequences containing guanine and cytosine levels close to 60% and a very low number of oligo duplexes or hairpin stem formations. Hence, the sequences were tested for specificity through a BLAST search (www.ncbi.nlm.nih.gov). NCX1 probe was a 46-base oligodeoxyribonucleotide, complementary to bases 1991 to 2036 of the rat brain NCX1 messenger ribonucleic acid (mRNA) (Genebank No. X68813). In our in situ hybridization experiments, the NCX1 probe should recognize both splicing variants, NCX 1.4 and NCX 1.5, containing AD and ADF exons, respectively (Quednau et al, 1997). The NCX2 probe was a 45-base oligodeoxyribonucleotide, complementary to bases 1431 to 1475 of the rat NCX2 mRNA (Genebank No. U08141). Splice variants generated by the NCX2 gene have not yet been described (Quednau et al, 1997). The NCX3 probe was a 48-base oligodeoxyribonucleotide, complementary to bases 902 to 949 of the rat NCX3 mRNA (Genebank No. U53420). In adult rat brain tissue, the NCX3 probe should recognize both NCX3.2 and NCX3.3 splice variants (Quednau et al, 1997), given that the sequence used to engineer the probe is located outside the described splicing region.
In situ hybridization NCX antisense probe information
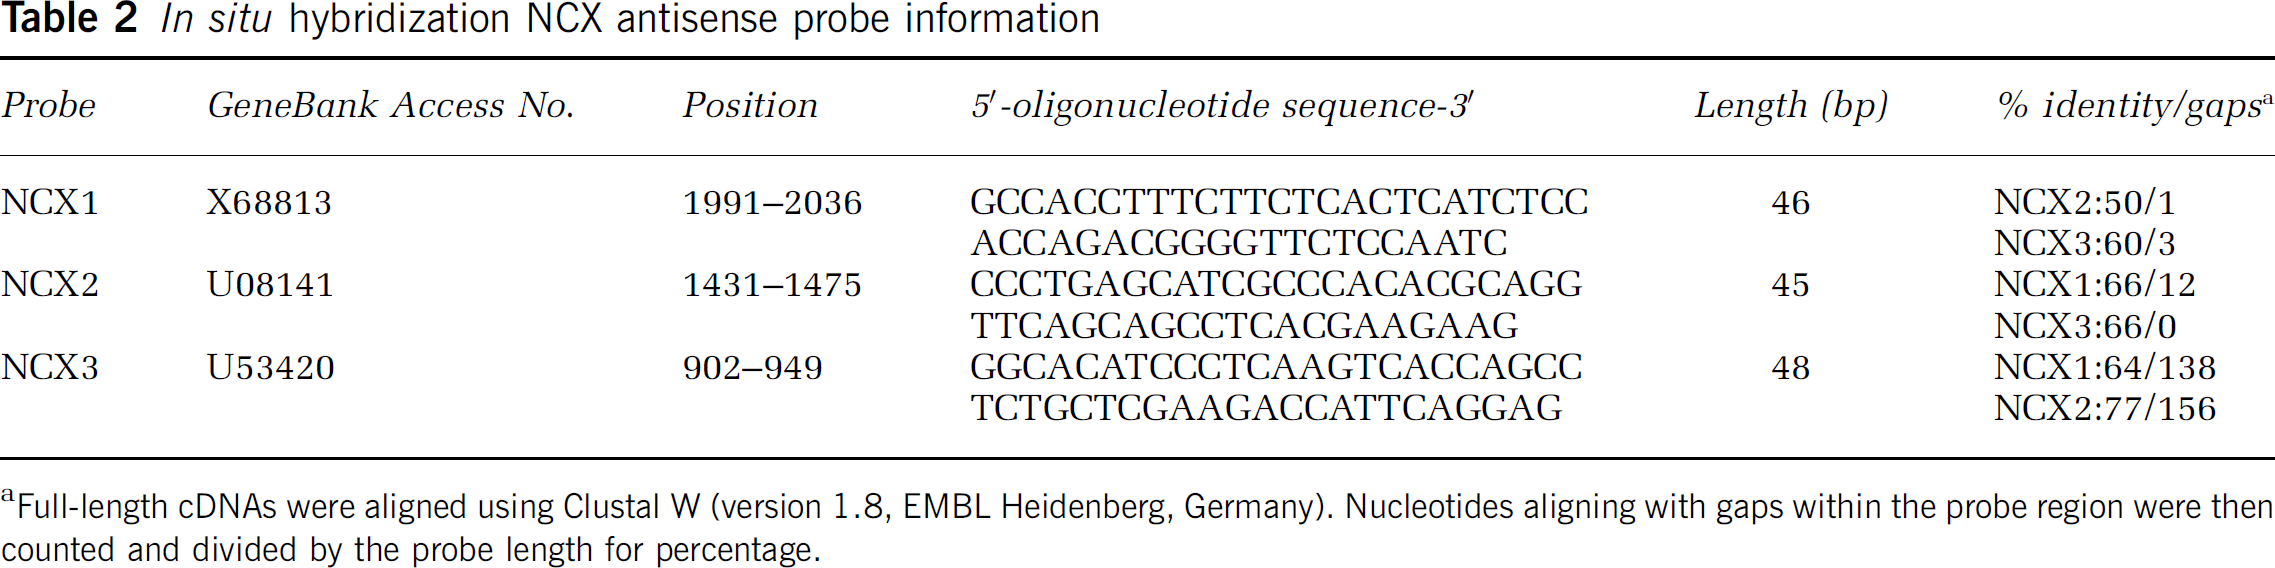
Full-length cDNAs were aligned using Clustal W (version 1.8, EMBL Heidenberg, Germany). Nucleotides aligning with gaps within the probe region were then counted and divided by the probe length for percentage.
Radiolabeling of oligonucleotide probes was performed as previously described (Ambesi et al, 2003). Briefly, for each probe a 50 µl-labeling-reaction mix was prepared on ice using diethylpyrocarbonate-treated water, 1 × tailing buffer, 1.5 mmol/L CoCl2, 7.5 pmol/µl of oligo, 125 U of terminal deoxynucleotidyl transferase (TdT Kit, Roche, Milan, Italy), and 100 µCi 35S-dATP (Amersham Biosciences, Milan, Italy). The mix was incubated for 20 mins at 37°C. The unincorporated nucleotides were separated from radiolabeled DNA using ProbeQuant G-50 microcolumns (Amersham Biosciences, Milan, Italy).
In Situ Hybridization
Sections from sham-operated and ischemic rats were processed for radioactive in situ hybridization (de Bartolomeis et al, 2002). All solutions were prepared with sterile double distilled water. The sections, fixed in 1.5% (w/v) formaldehyde in 0.01 mol/L phosphate saline buffer pH 7.4 (PBS), were quickly rinsed three times with PBS and placed in 0.25% (v/v) acetic anhydride in 0.1 mol/L triethanolamine and 0.9% (w/v) NaCl, pH 8.0 for 10 mins. Next, they were dehydrated, in succeeding steps, in 70, 80, 90, and 100% ethanol. Then they were delipidated in chloroform for 5 mins, rinsed again in 100% ethanol, and air dried. Sections were hybridized with 0.4 to 0.6 × 10⁶ cpm of radiolabeled oligonucleotide in buffer containing 50% (v/v) formamide, 600 mmol/L NaCl, 80 mmol/L Tris-HCl (pH 7.5), 4 mmol/L EDTA, 0.1% pyrophosphate (w/v), 0.2 mg/ml heparin sulfate, and 10% (w/v) dextran sulfate. The slides, covered with coverslips, were incubated in a humid chamber at 37°C for 20 h. After hybridization, the coverslips were removed in a standard saline sodium citrate solution 0.15 mol/L NaCl and 0.015 mol/L sodium citrate. The sections were first washed four times (15 mins each wash) in 0.3 mol/L NaCl and 0.03 mol/L sodium citrate containing 50% formamide at 40°C, and then twice (30 mins each wash) with a solution containing 0.15 mol/L NaCl and 0.015 mol/L sodium citrate at 40°C. Finally, the slides were rapidly rinsed in distilled water and then in 70% ethanol.
Autoradiography
The sections were first dried and then exposed to Kodak-Biomax MR Autoradiographic film (Amersham Biosciences, Milan, Italy) for 2 weeks to detect NCX2 mRNA and for 3 weeks to detect NCX1 and NCX3 mRNA. A slide, containing a scale of 16 known amounts of 14C standards ranging from 0.00 to 35.00 µCi/g, was coexposed with the samples (ARC-146; CG, American Radiolabeled Chemicals, St Louis, MO, USA). An optimal time of exposure was chosen to maximize signal-to-noise ratio and to prevent optical density from reaching the limits of saturation. The film development protocol consisted of a 1.5 mins dip in the developer solution and of a 3 mins dip in the fixer. Sham-operated and ischemic rat hybridized sections for each NCX isoform were exposed on the same X-ray film sheet.
The autoradiographic signal yielded by the probes was compared with the results of our laboratory, obtained with nonradioactive in situ hybridization (Papa et al, 2003), and with the results of other studies, obtained with radioactive in situ hybridization (Marlier et al, 1993). The specificity of each probe for the three NCX isoforms, NCX1, NCX2, and NCX3, was further tested by a control experiment using the corresponding sense oligo (negative control) (Figure 8, panels D to F).
Image Analysis
To quantify the hybridization signals, autoradiographic images from X-ray films were digitized using the Apple Power PC G4 and the high-resolution transparency film scanner Umax powerLook 1120 (Umax UK, Gomshall Surrey, UK). Brain regions of interest (ROI) were outlined on digitized autoradiograms using an oval template tool of ImageJ software (version 1.32j). The mean optical density was measured within each ROI, both in the ipsilateral and in the contralateral hemispheres of the control, sham-operated and ischemic groups.
Within the PFC region, at the bregma level of + 3.20 mm, four ROIs were defined: PFC1 was placed in the center of the infarct area (core region); PFC2 was equivalent to the periinfarct area; PFC3 included the deep layer of the infralimbic and prelimbic cortices, whereas tenia tecta (TT) was outlined within the homonymous territory (Figure 1A). At the bregma level of + 1.60 mm, four ROIs were chosen in the cortex (CTX1, CTX2, CTX3, and CTX4) and in the striatum (DM, dorsomedial; DL, dorsolateral; VM, ventromedial; and VL, ventrolateral), whereas only one ROI was chosen for the septum (lateral septum, LS) (Figure 2A). At the bregma level of −0.30 mm, four ROIs were chosen in the cortex (CTX1, CTX2, CTX3, and CTX4), one in the striatum (CPu), and one in septum (LS) (Figure 3A). At the bregma levels of +1.60 mm and −0.30 mm, CTX4 was located outside the infarct area; CTX3 was most likely located in the periinfarct zone; and CTX2 and CTX1 were located within the core lesion area. Analogously, at the bregma level of −3.14 mm, four ROIs were defined for CTX. In the hippocampus, a region that lies, in our model, outside the ischemic region, CA1, CA3, CA4, and the dentate gyrus (DG) subregions were identified (Figure 4A). Densitometrie measurements in regions difficult to outline manually, such as the Cornus Ammonis (CA) and DG, were obtained using the threshold filter, as previously described (Ambesi et al, 2003). Such a filter, provided with ImageJ software, is useful for measuring small regions characterized by a strong contrast with their surroundings. By virtue of this approach, it is possible to limit the measurement of any ROI selected to those pixels whose density level exceeds the chosen threshold.
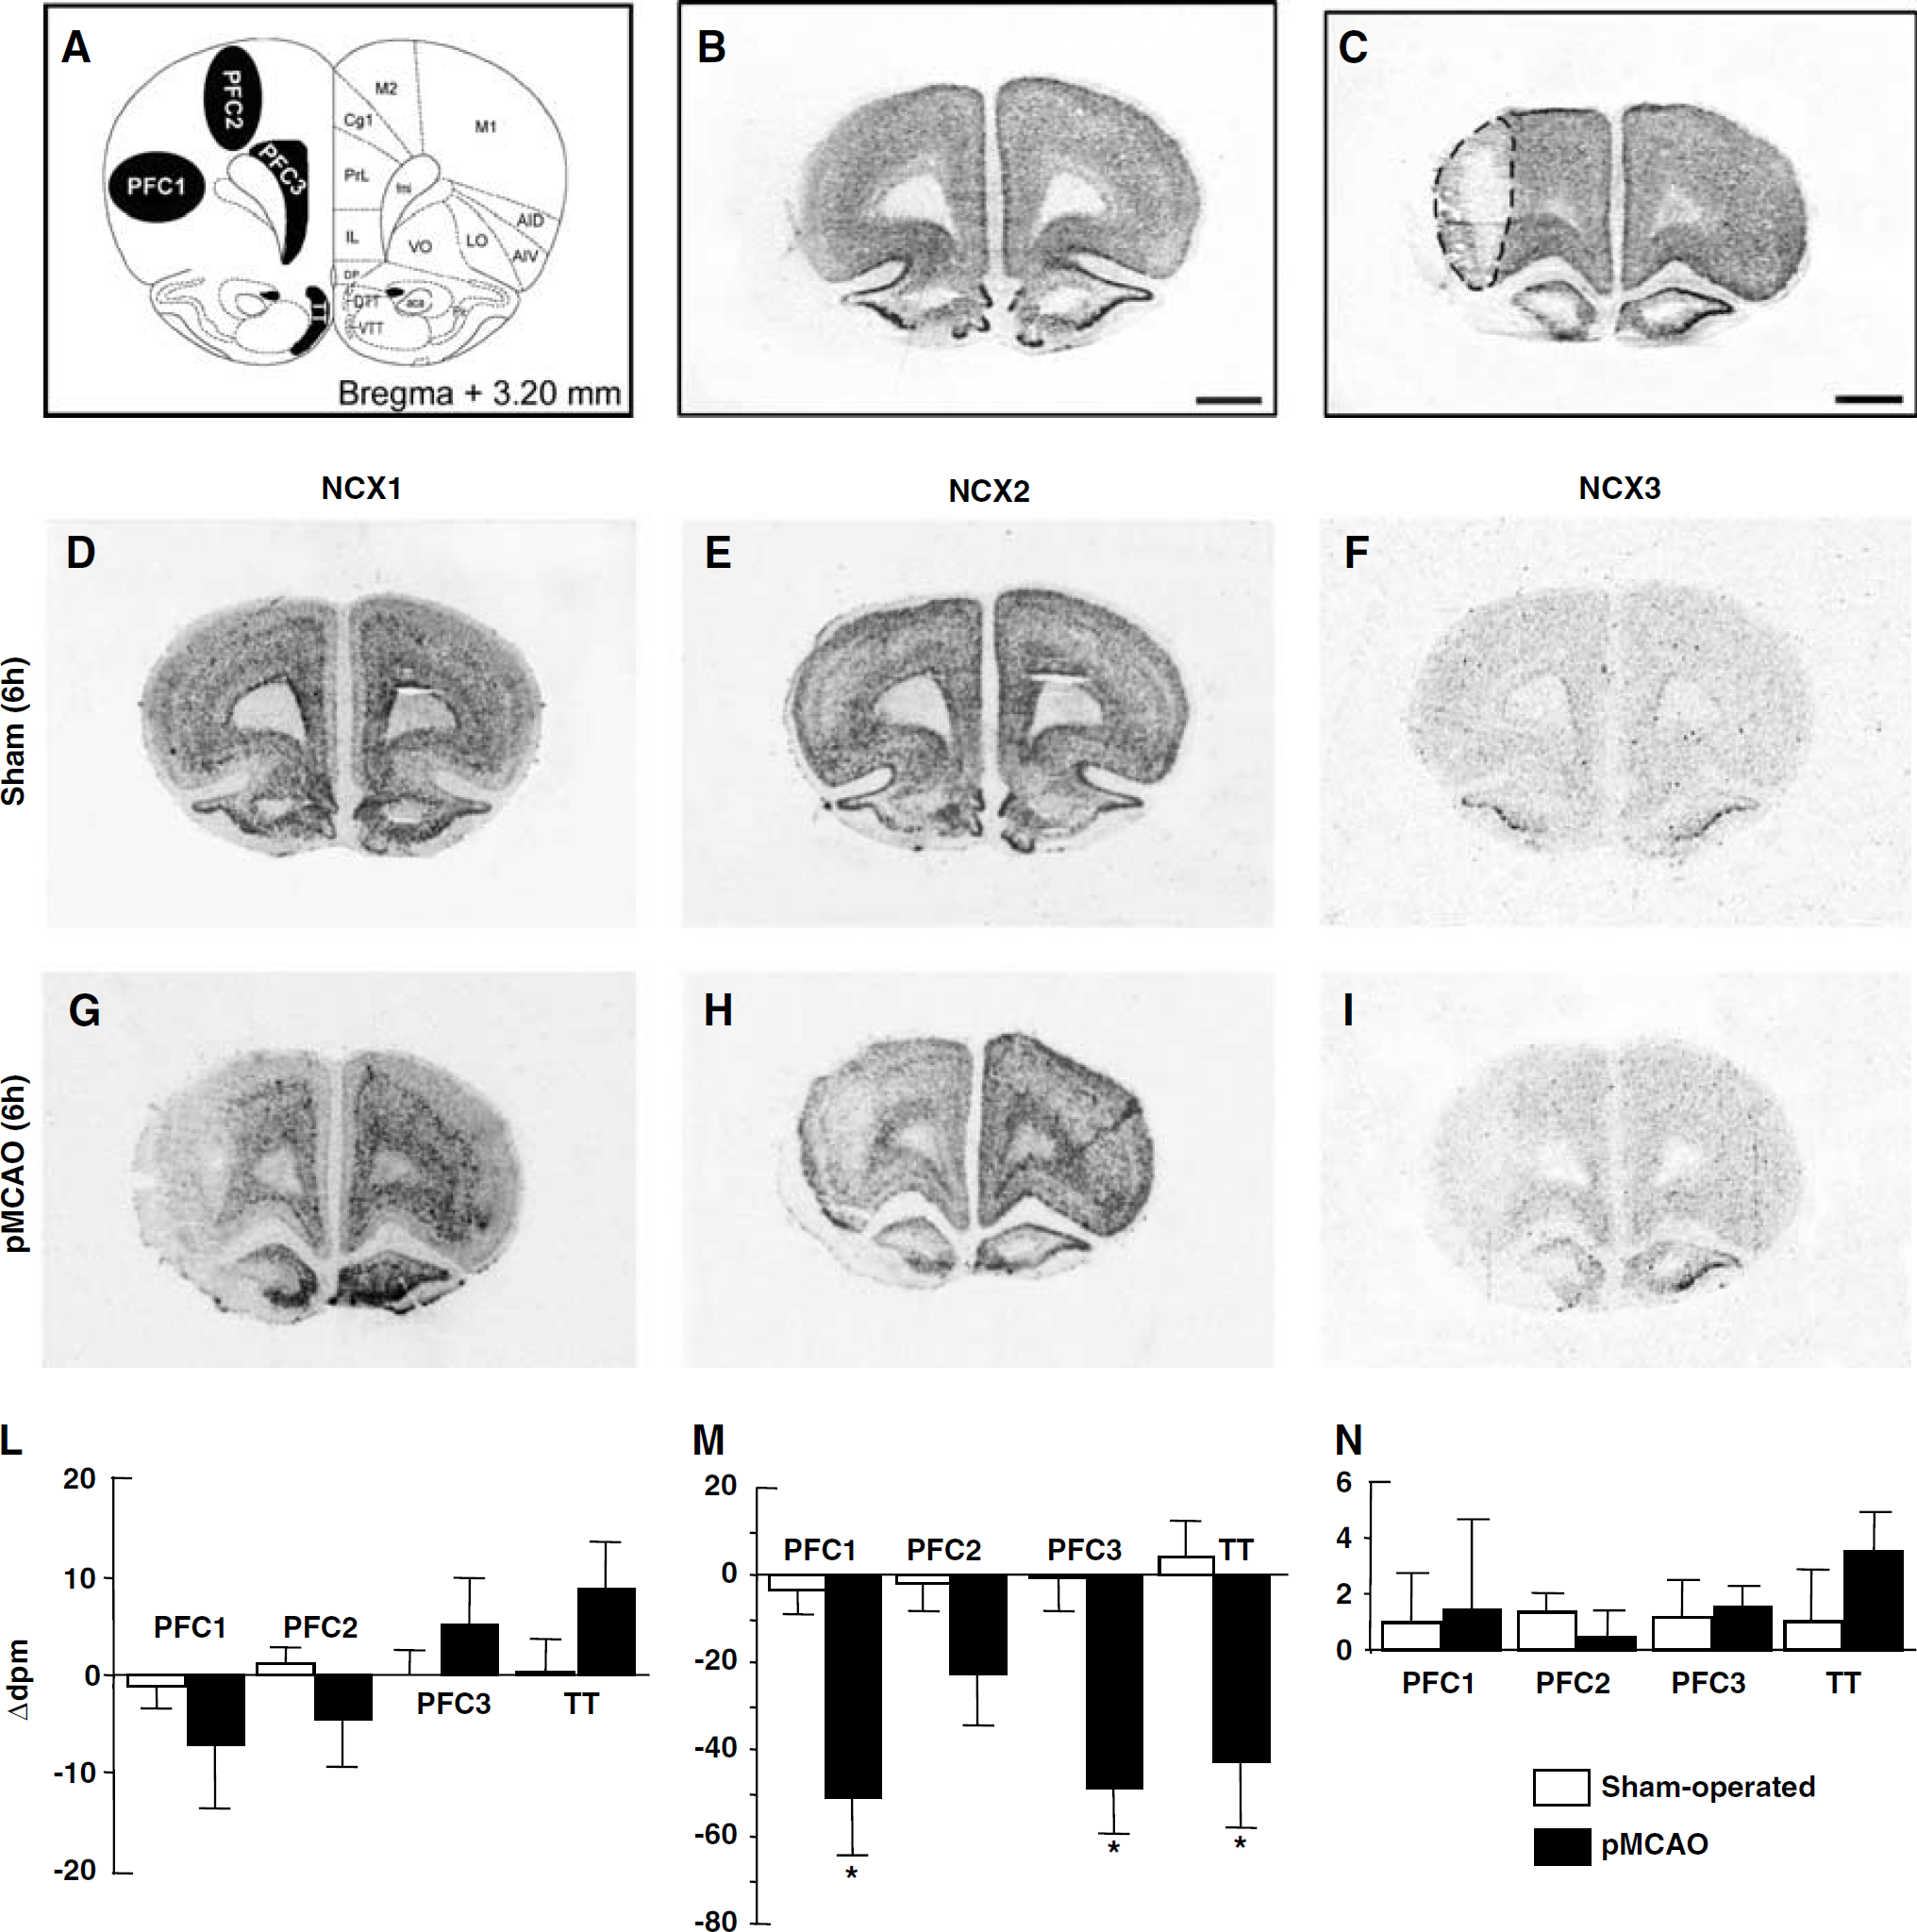
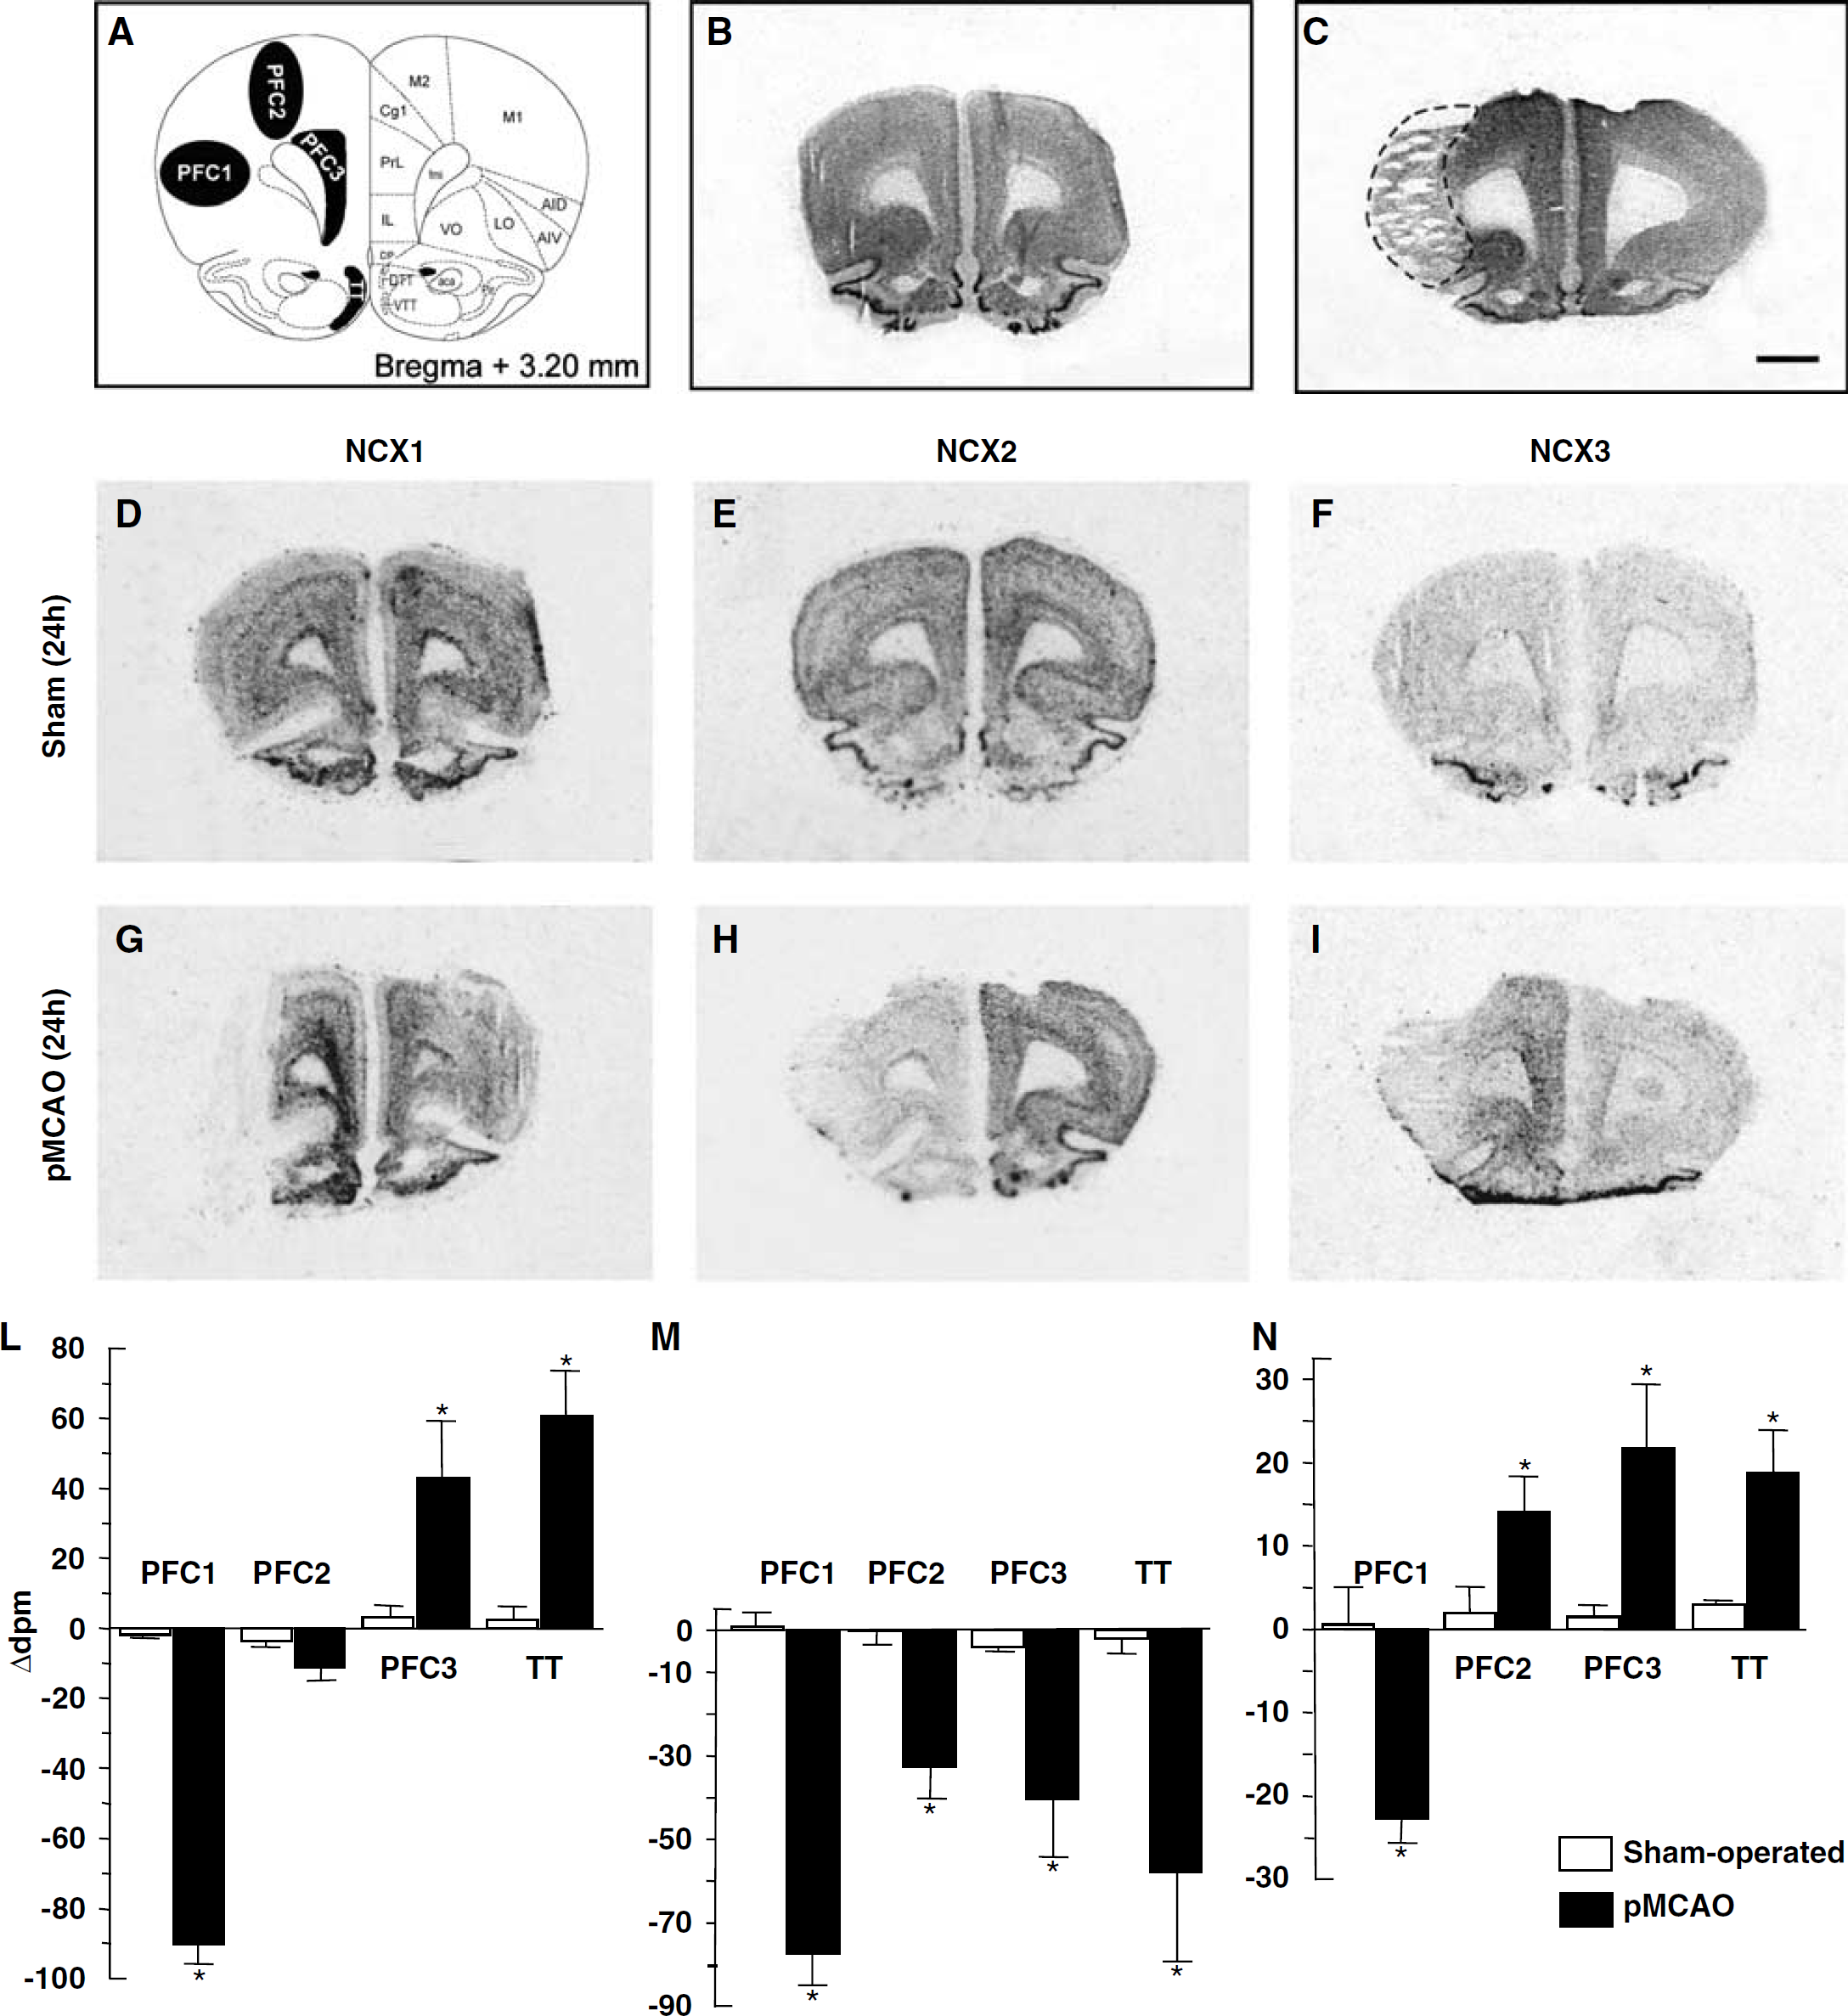
NCX1, NCX2, and NCX3 mRNAs in the prefrontal cortex of sham-operated and ischemic animals 6 h after sham surgery or pMCAO. A schematic diagram of ROIs at coronal bregma levels of +3.20 mm is shown in panel A. Representative brain NeuN-immunohistochemistry-processed sections deriving from sham-operated and pMCAO bearing rats are shown in panels B and C, respectively. Panels D to I represent the in situ hybridization autoradiographic film images obtained from sham-operated and ischemic brain sections with NCX1 (D, G), NCX2 (E, H), and NCX3 (F, I) antisense probes. Messenger ribonucleic acid levels of NCX1, NCX2, and NCX3, expressed as Δd.p.m. ± s.e.m. and presented for each ROI analyzed, with white columns for sham-operated rats and black columns for pMCAO rats, are shown in panels L, M, and N, respectively. Δd.p.m. indicates the difference between the d.p.m. value of each ROI ipsilateral to the ischemic side and that of the contralateral corresponding side. *P < 0.05 versus respective values in sham-operated groups, aca, anterior commissure, anterior part; AID, agranular insular cortex, dorsal part; AIV, agranular insular cortex, ventral part; Cg1, cingulate cortex, area 1; DP, dorsal peduncular cortex; DTT, dorsal tenia tecta; fmi, forceps minor of the corpus callosum; IL, infralimbic cortex; LO, lateral orbital cortex; M1, primary motor cortex; M2, secondary motor cortex; Pir, piriform cortex; PrL, prelimbic cortex; VO, ventral orbital cortex; VTT, ventral tenia tecta. Scale bar in panels B and C: 2 mm.
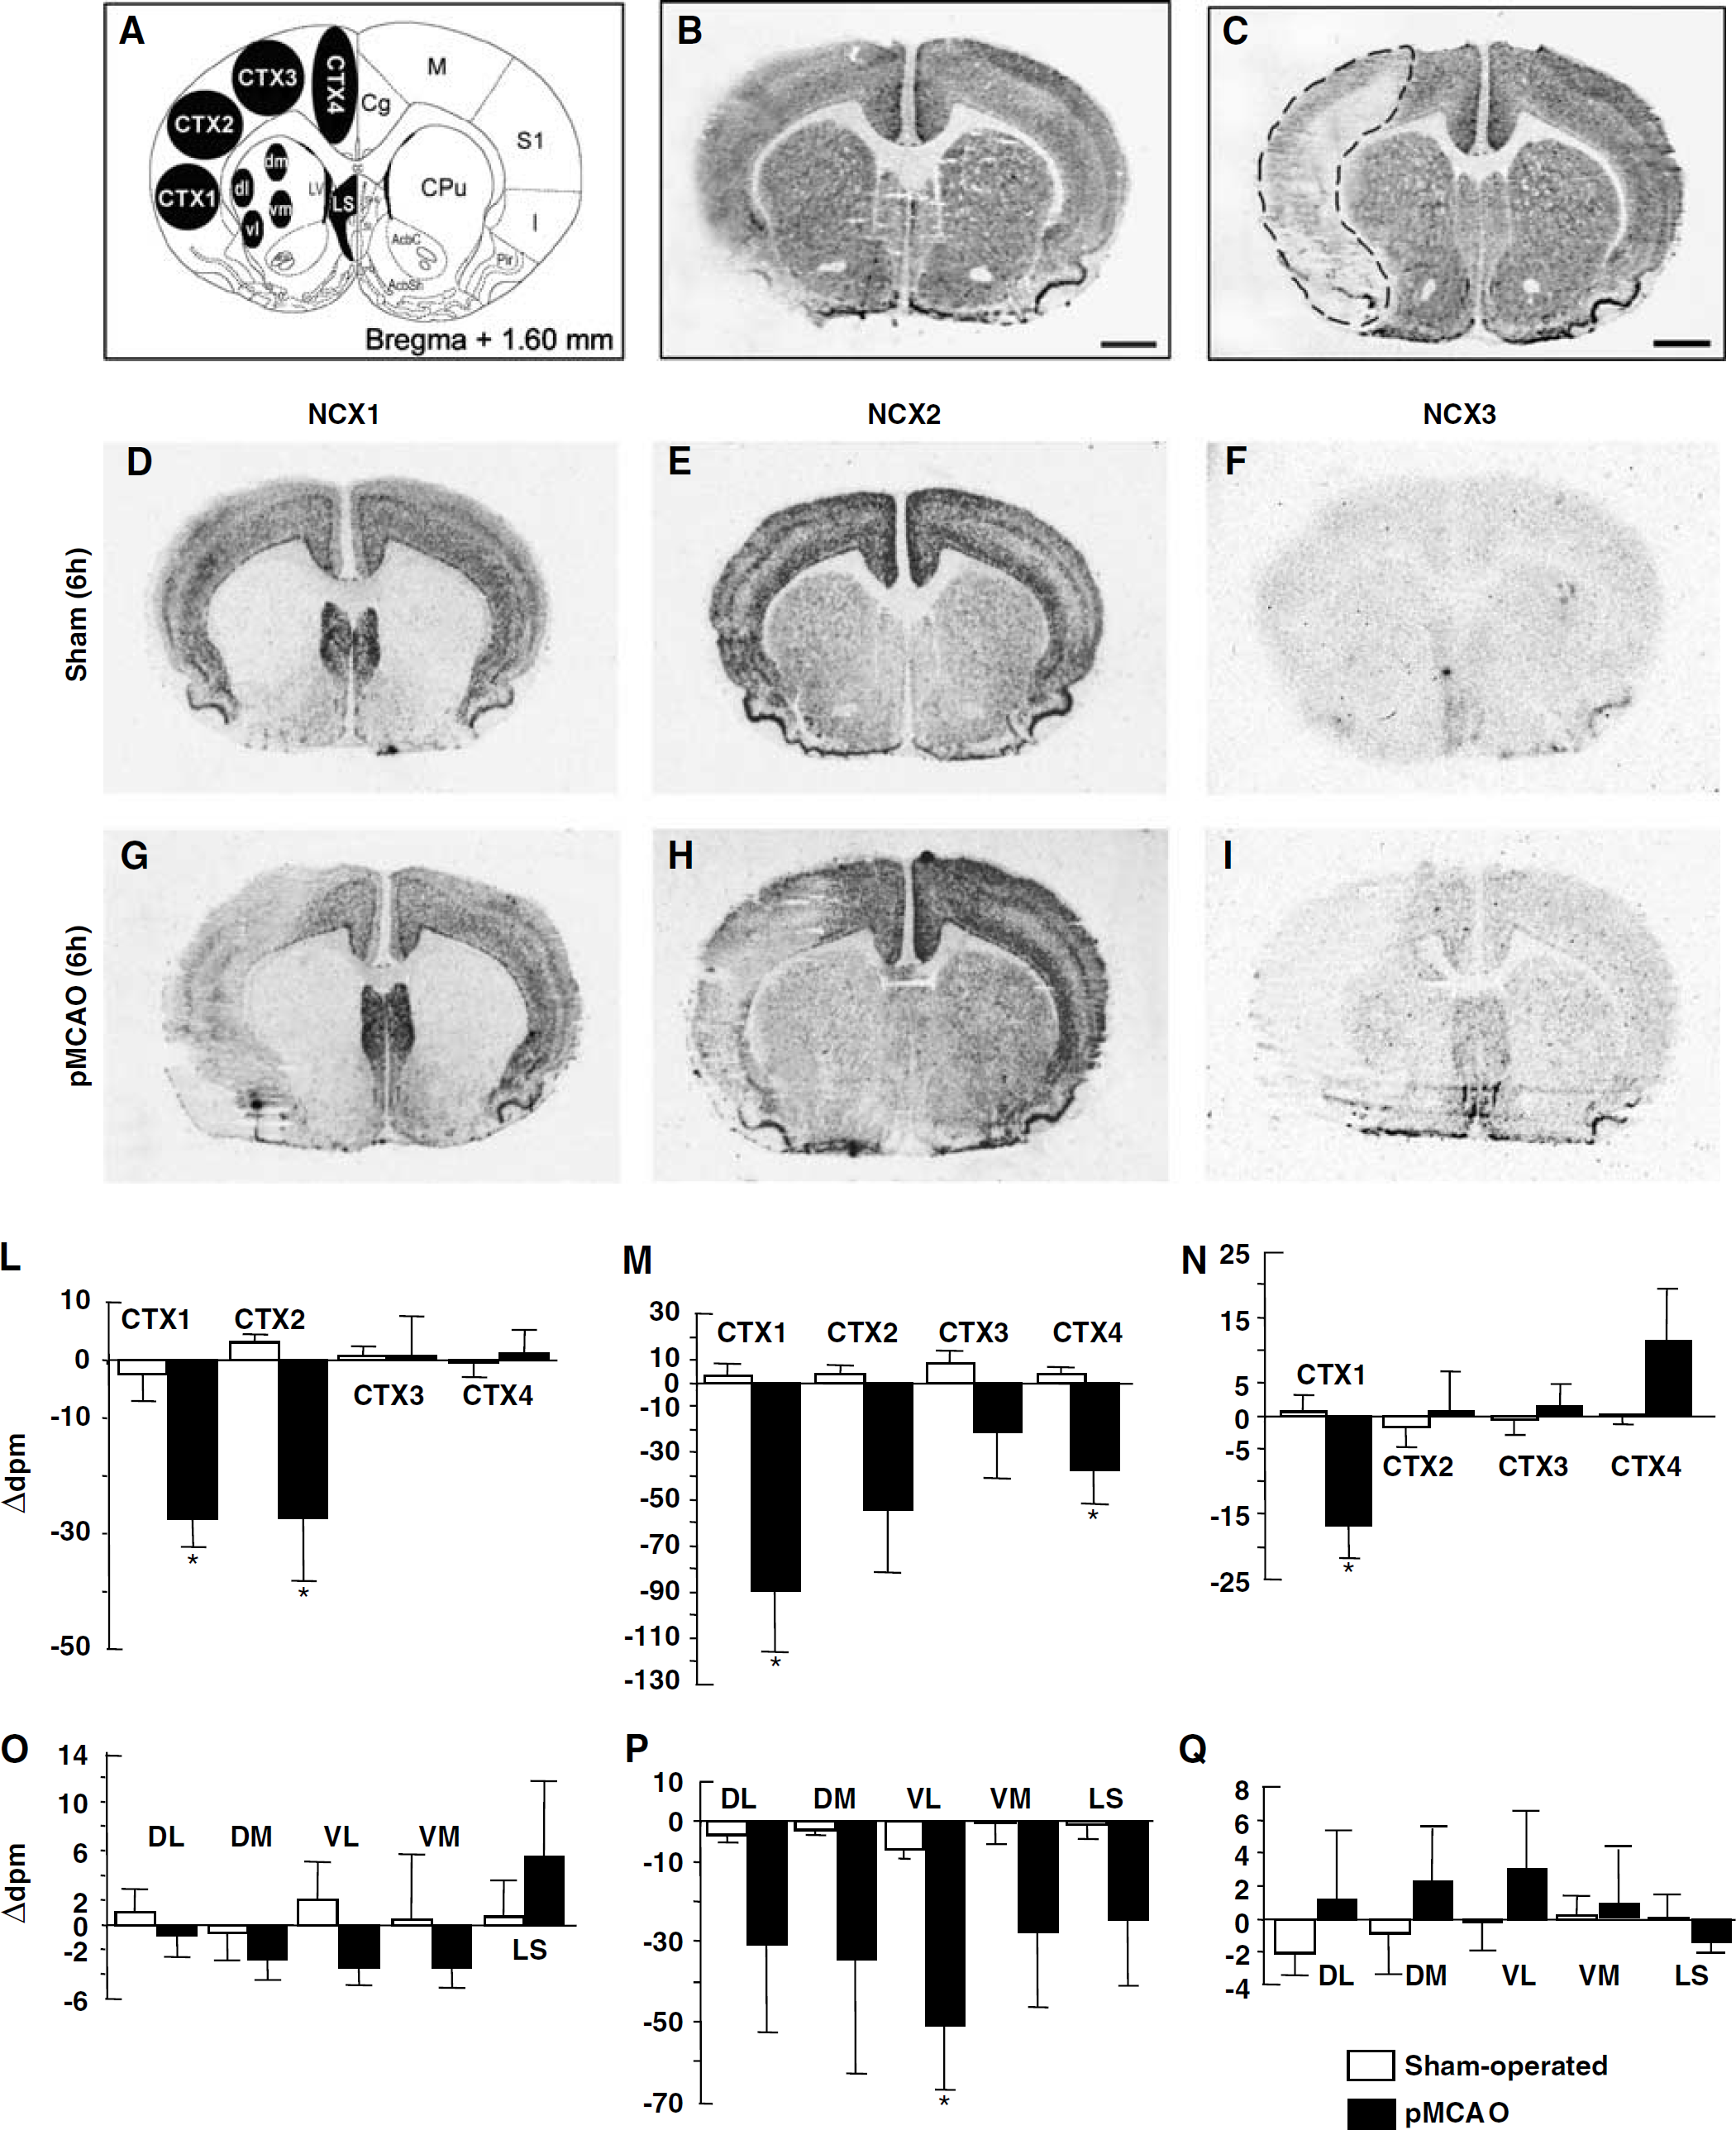
NCX1, NCX2, and NCX3 mRNAs in the cerebral cortex, caudate putamen, and lateral septum of sham-operated and ischemic animals 6 h after sham surgery or pMCAO. A schematic diagram of ROIs at coronal bregma levels of + 1.60 mm is shown in panel A. Representative brain NeuN-immunohistochemistry-processed sections deriving from sham-operated and pMCAO rats are shown in panels B and C, respectively. Panels D to I represent the in situ hybridization autoradiographic film images obtained from sham-operated and ischemic brain sections with NCX1 (D, G), NCX2 (E, H), and NCX3 (F, I) antisense probes. Messenger ribonucleic acid levels of NCX1, NCX2, and NCX3, expressed as Δd.p.m. ± s.e.m. and presented for each ROI analyzed, with white columns for sham-operated rats and black columns for pMCAO rats, are shown in panels L and O; M and P, N and Q, respectively. *P < 0.05 versus respective values in sham-operated groups. AcbC, accumbens nucleus, core; AcbSh, accumbens nucleus, shell; cc, corpus callosum; Cg, cingulate cortex; CPu, caudate putamen; ***l, insular cortex; LS***I, lateral septal nucleus; LV, lateral ventricle; M, motor cortex; Pir, piriform cortex; S1, primary somatosensory cortex; Shi, septohippocampal nucleus. Scale bar in panels B and C: 2 mm.
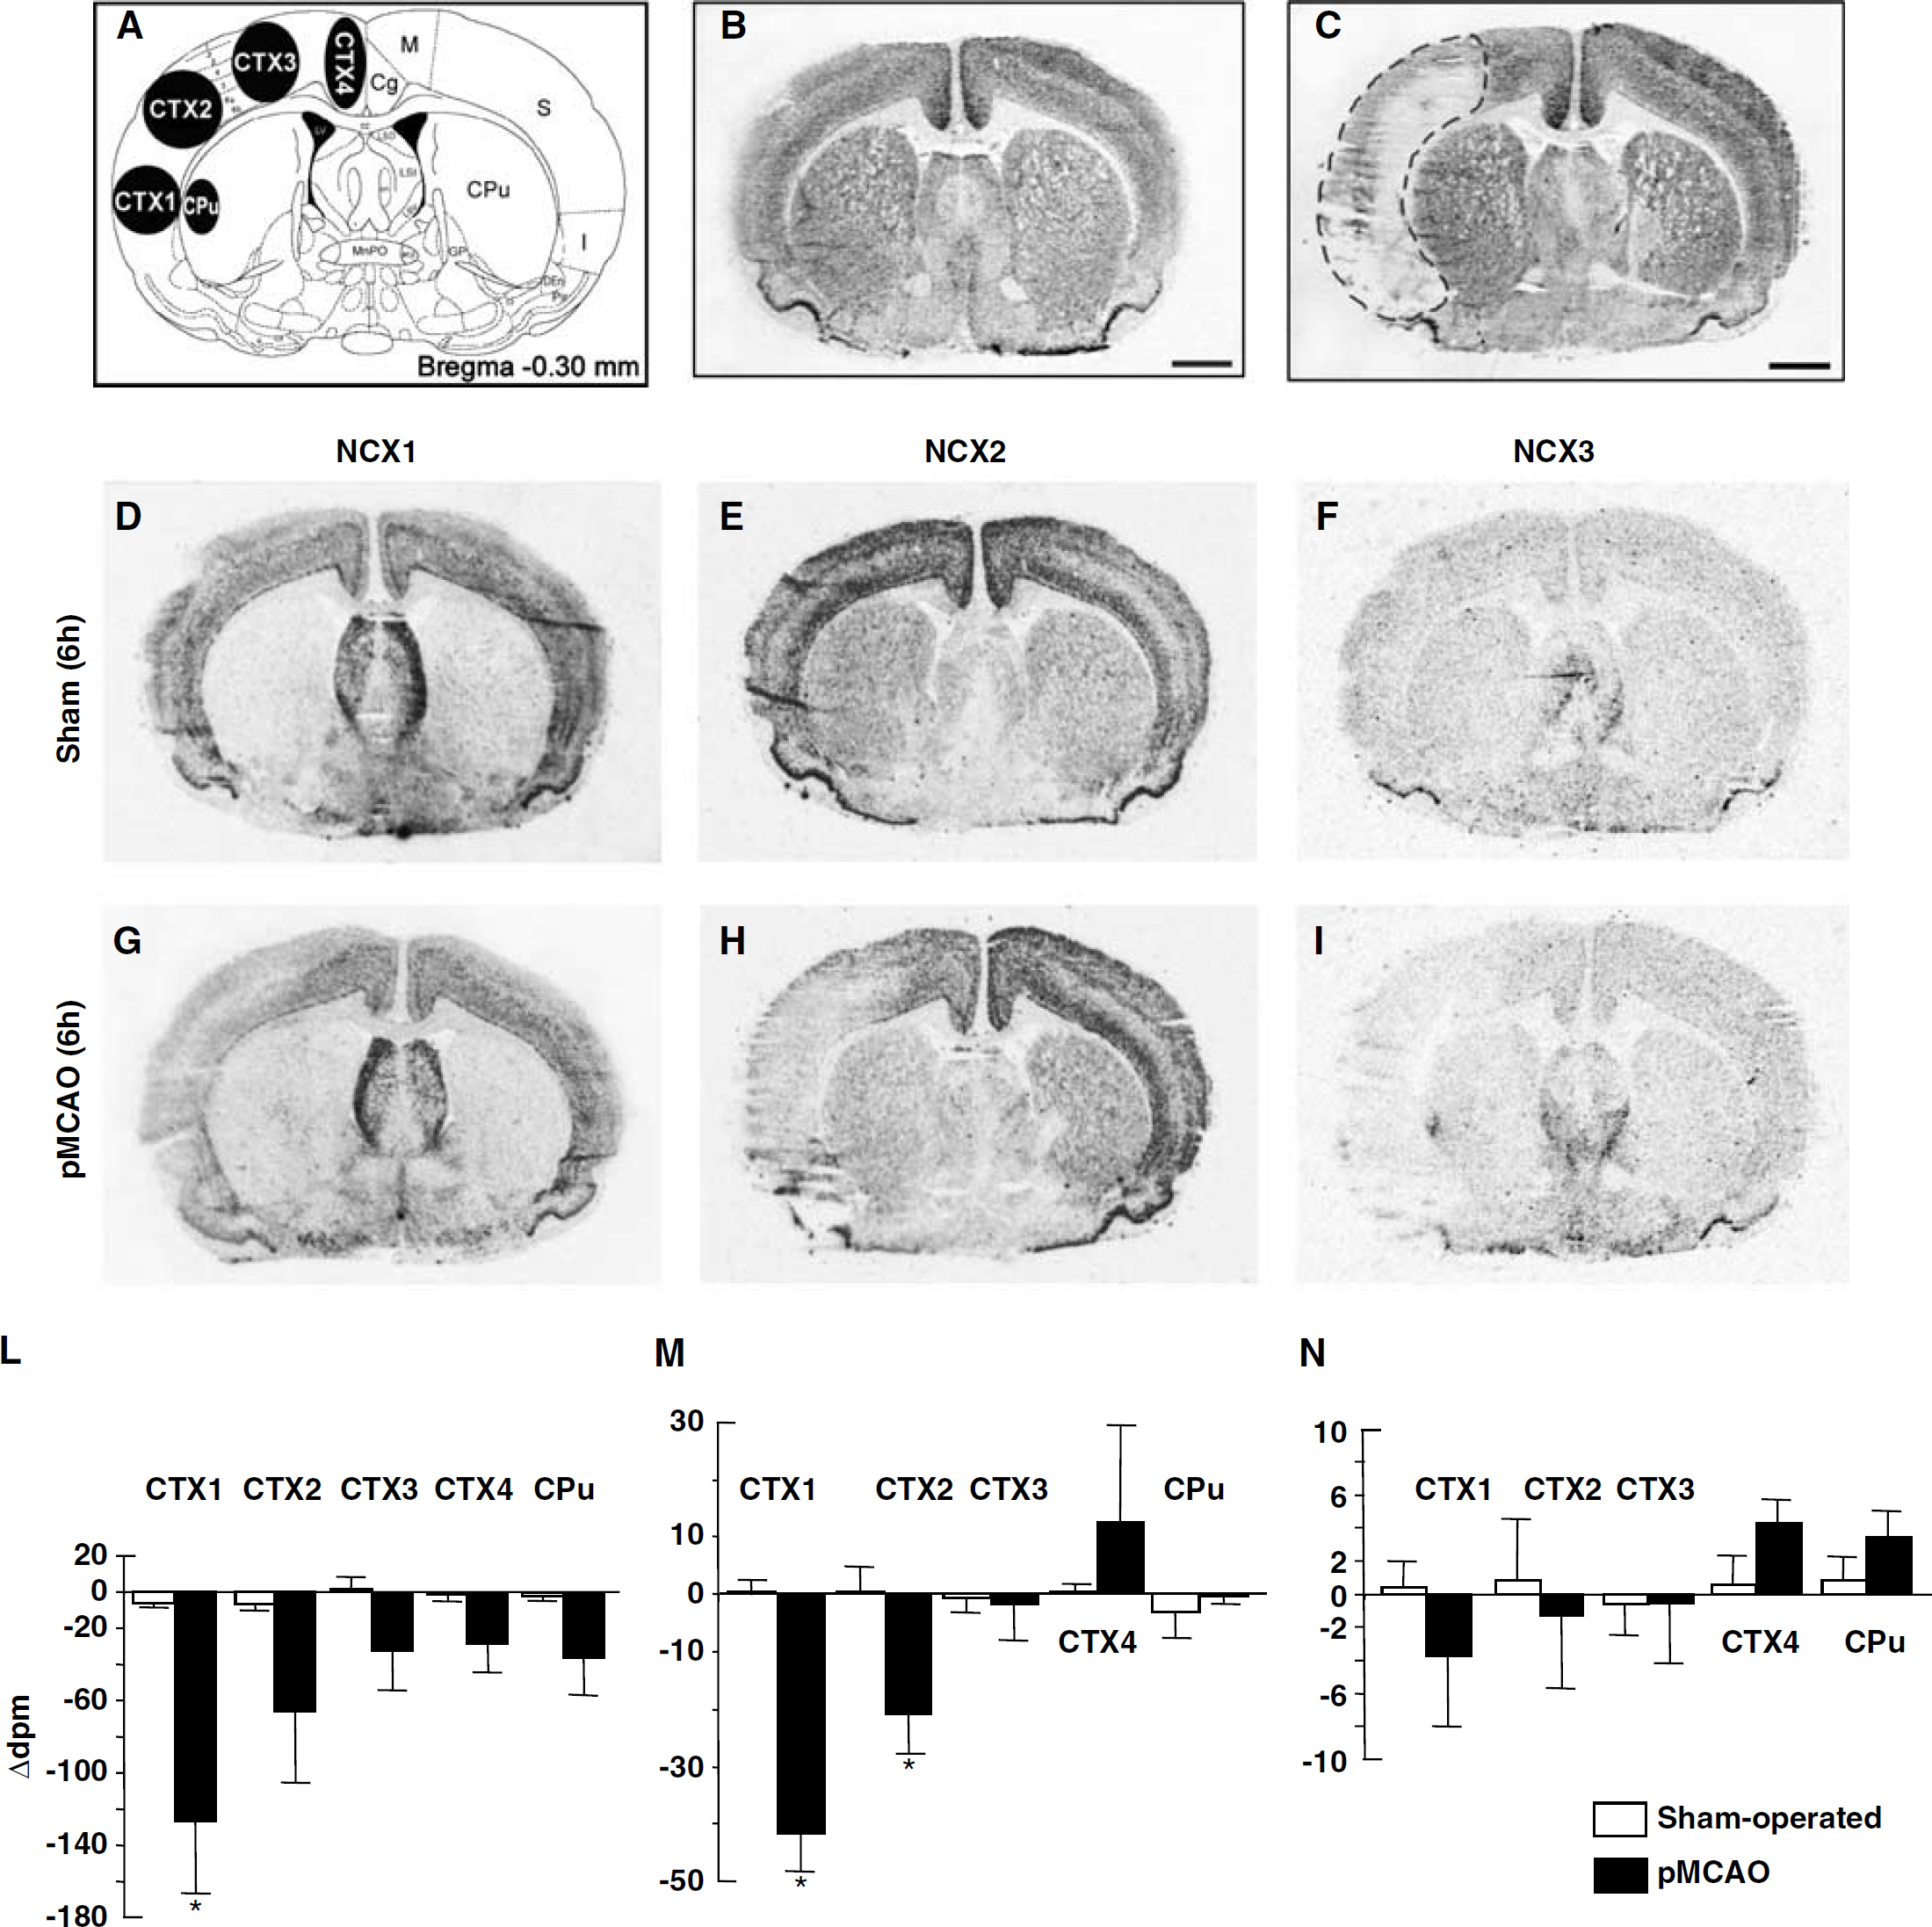
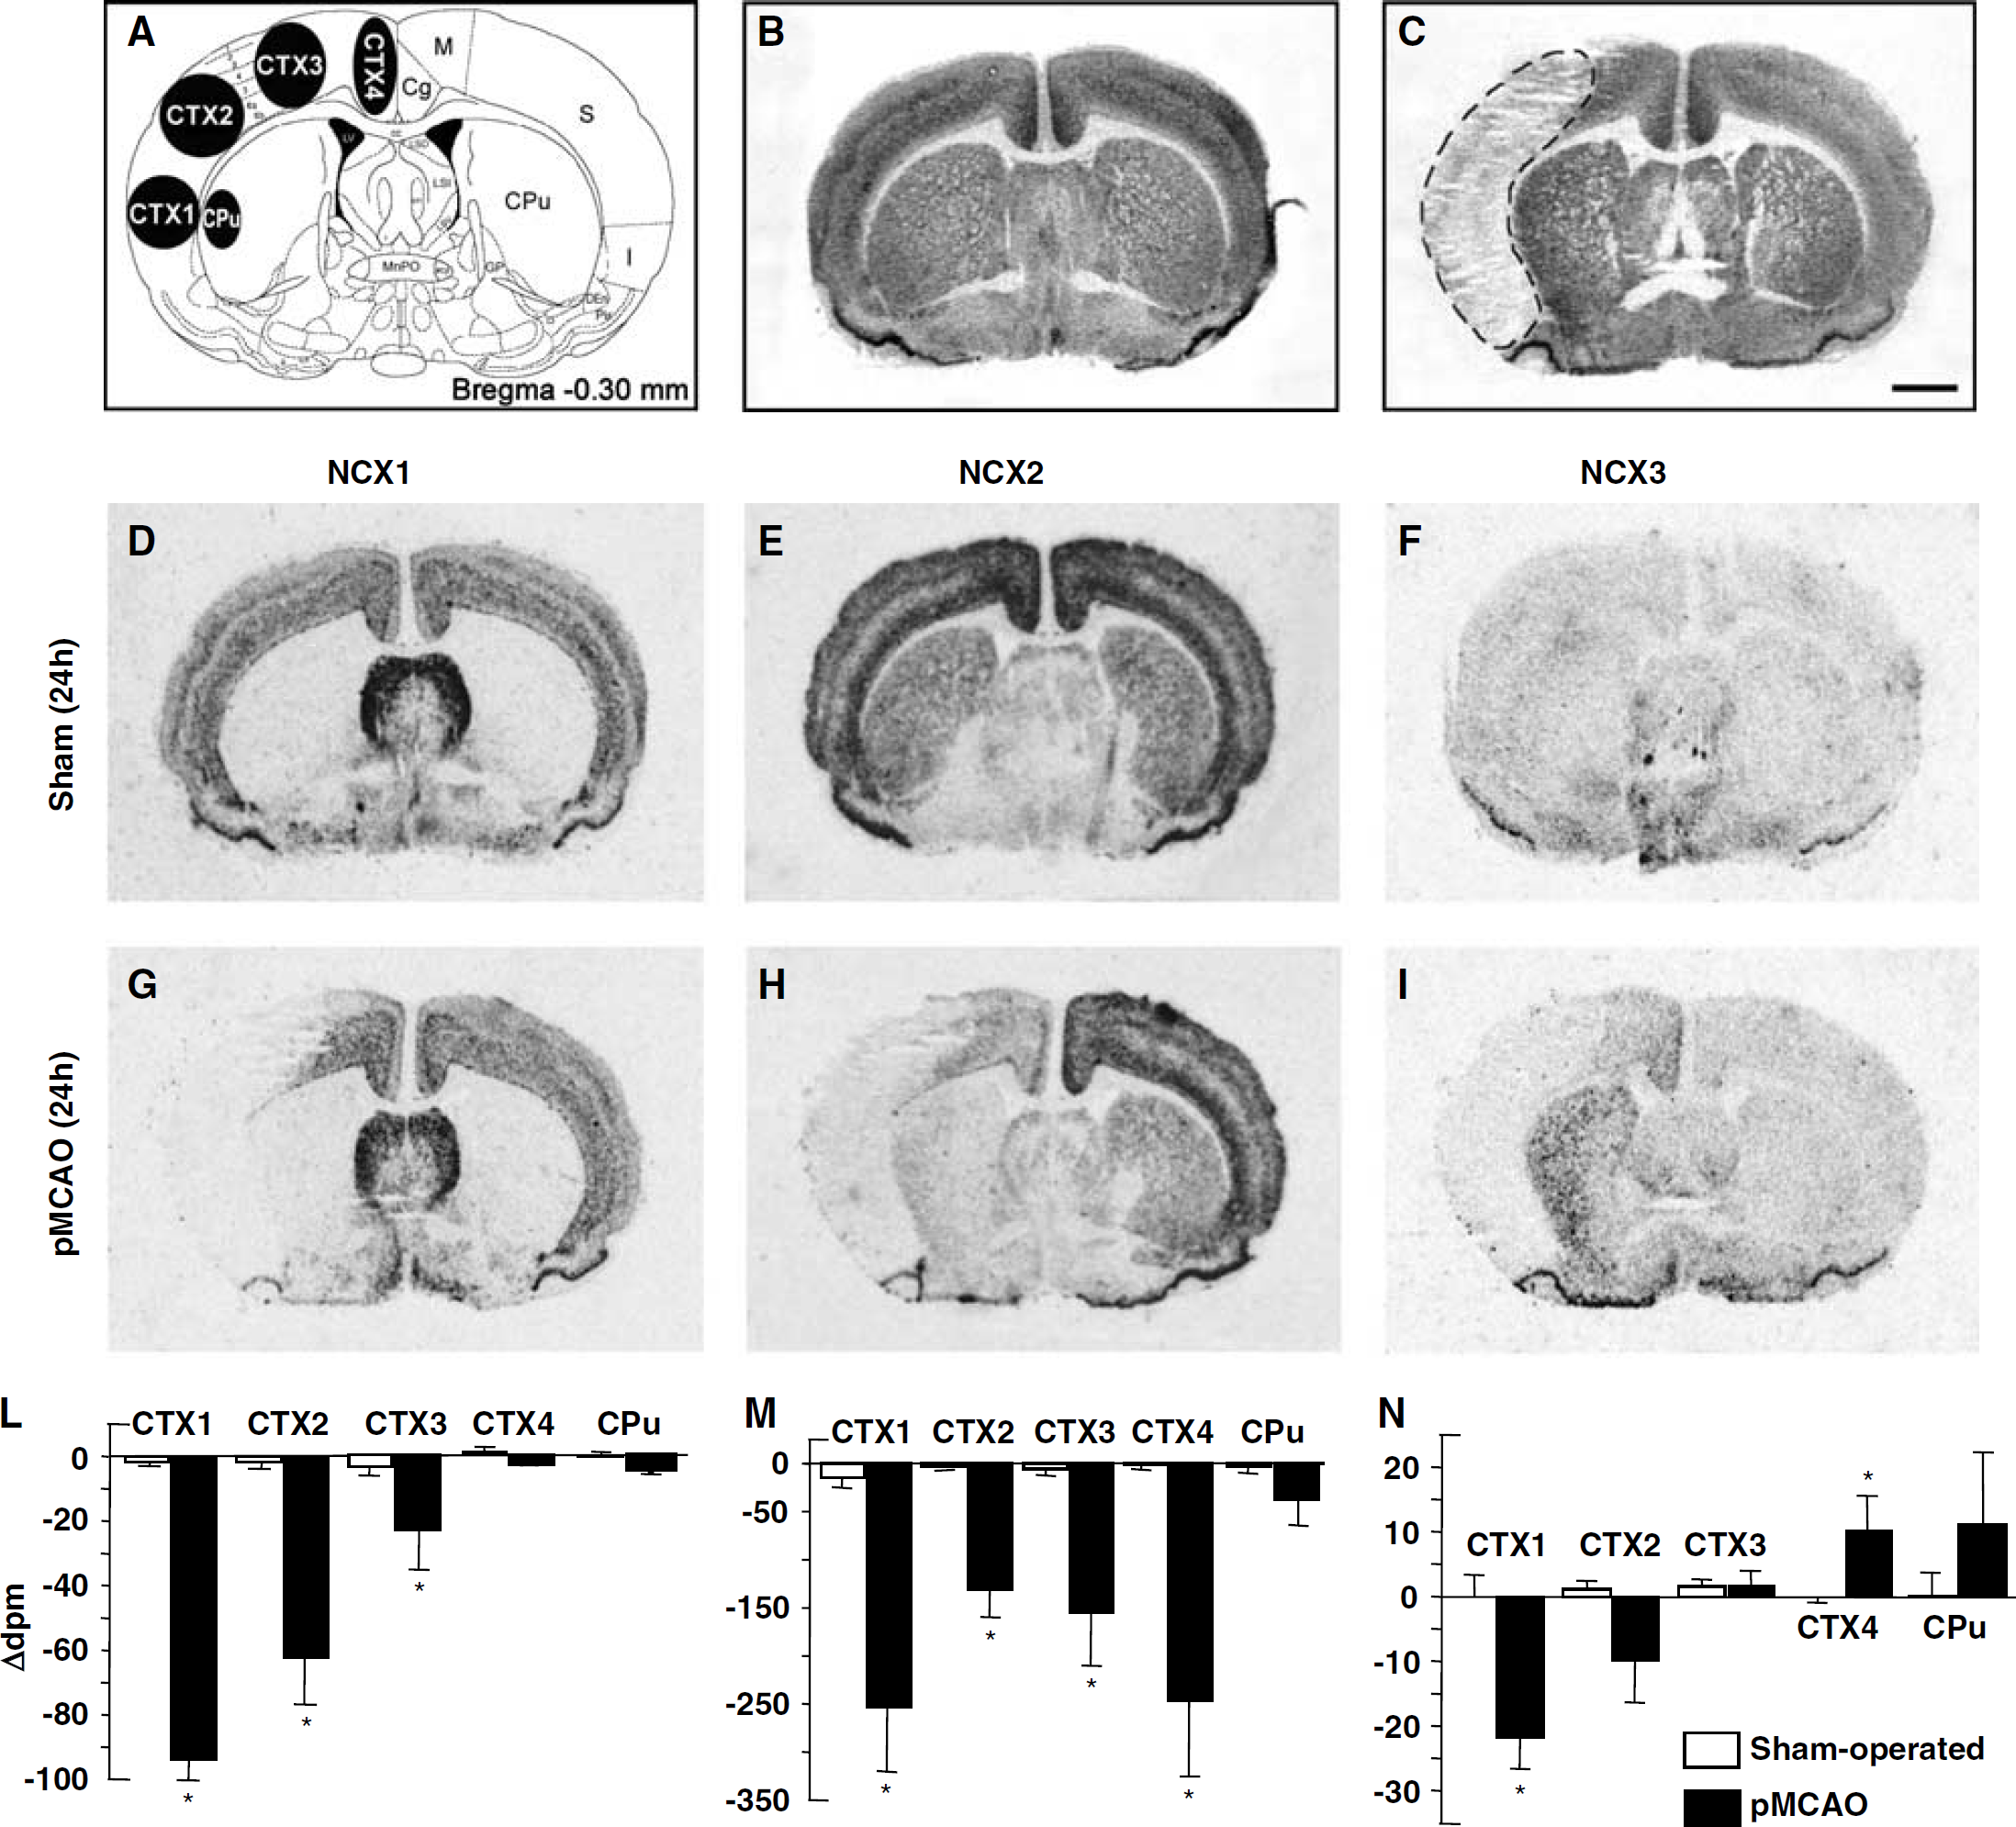
NCX1, NCX2, and NCX3 mRNAs in the cerebral cortex and caudate putamen of sham-operated and ischemic animals 6 h after sham surgery or pMCAO. A schematic diagram of ROIs at coronal bregma levels of −0.30 mm is shown in panel A. Representative brain Neun-immunohistochemistry-processed sections deriving from sham-operated and pMCAO rats are shown in panels B and C, respectively. Panels D to I represent the in situ hybridization autoradiographic film images obtained sham-operated and ischemic brain sections with NCX1 (D, G), NCX2 (E, H), and NCX3 (F, I) antisense probes. Messenger ribonucleic acid levels of NCX1, NCX2, and NCX3, expressed as Δd.p.m. ± s.e.m. and presented for each ROI analyzed with white columns for sham-operated rats and black columns for pMCAO rats, are shown in panels L, M, and N, respectively. *P < 0.05 versus respective values in sham-operated groups. Cc, corpus callosum; Cg, cingulate cortex; CPu, caudate putamen; Den, dorsal endopiriform nucleus; GP, globus pallidus; ***I, insular cortex; LSD, lateral septal nucleus, dorsal part; LS***I, lateral septal nucleus, intermediate part; LSV, lateral septal nucleus, ventral part; LV, lateral ventricle; M, motor cortex; MnPO, median preoptic nucleus; Pir, piriform cortex. Scale bar in panels B and C: 2 mm.
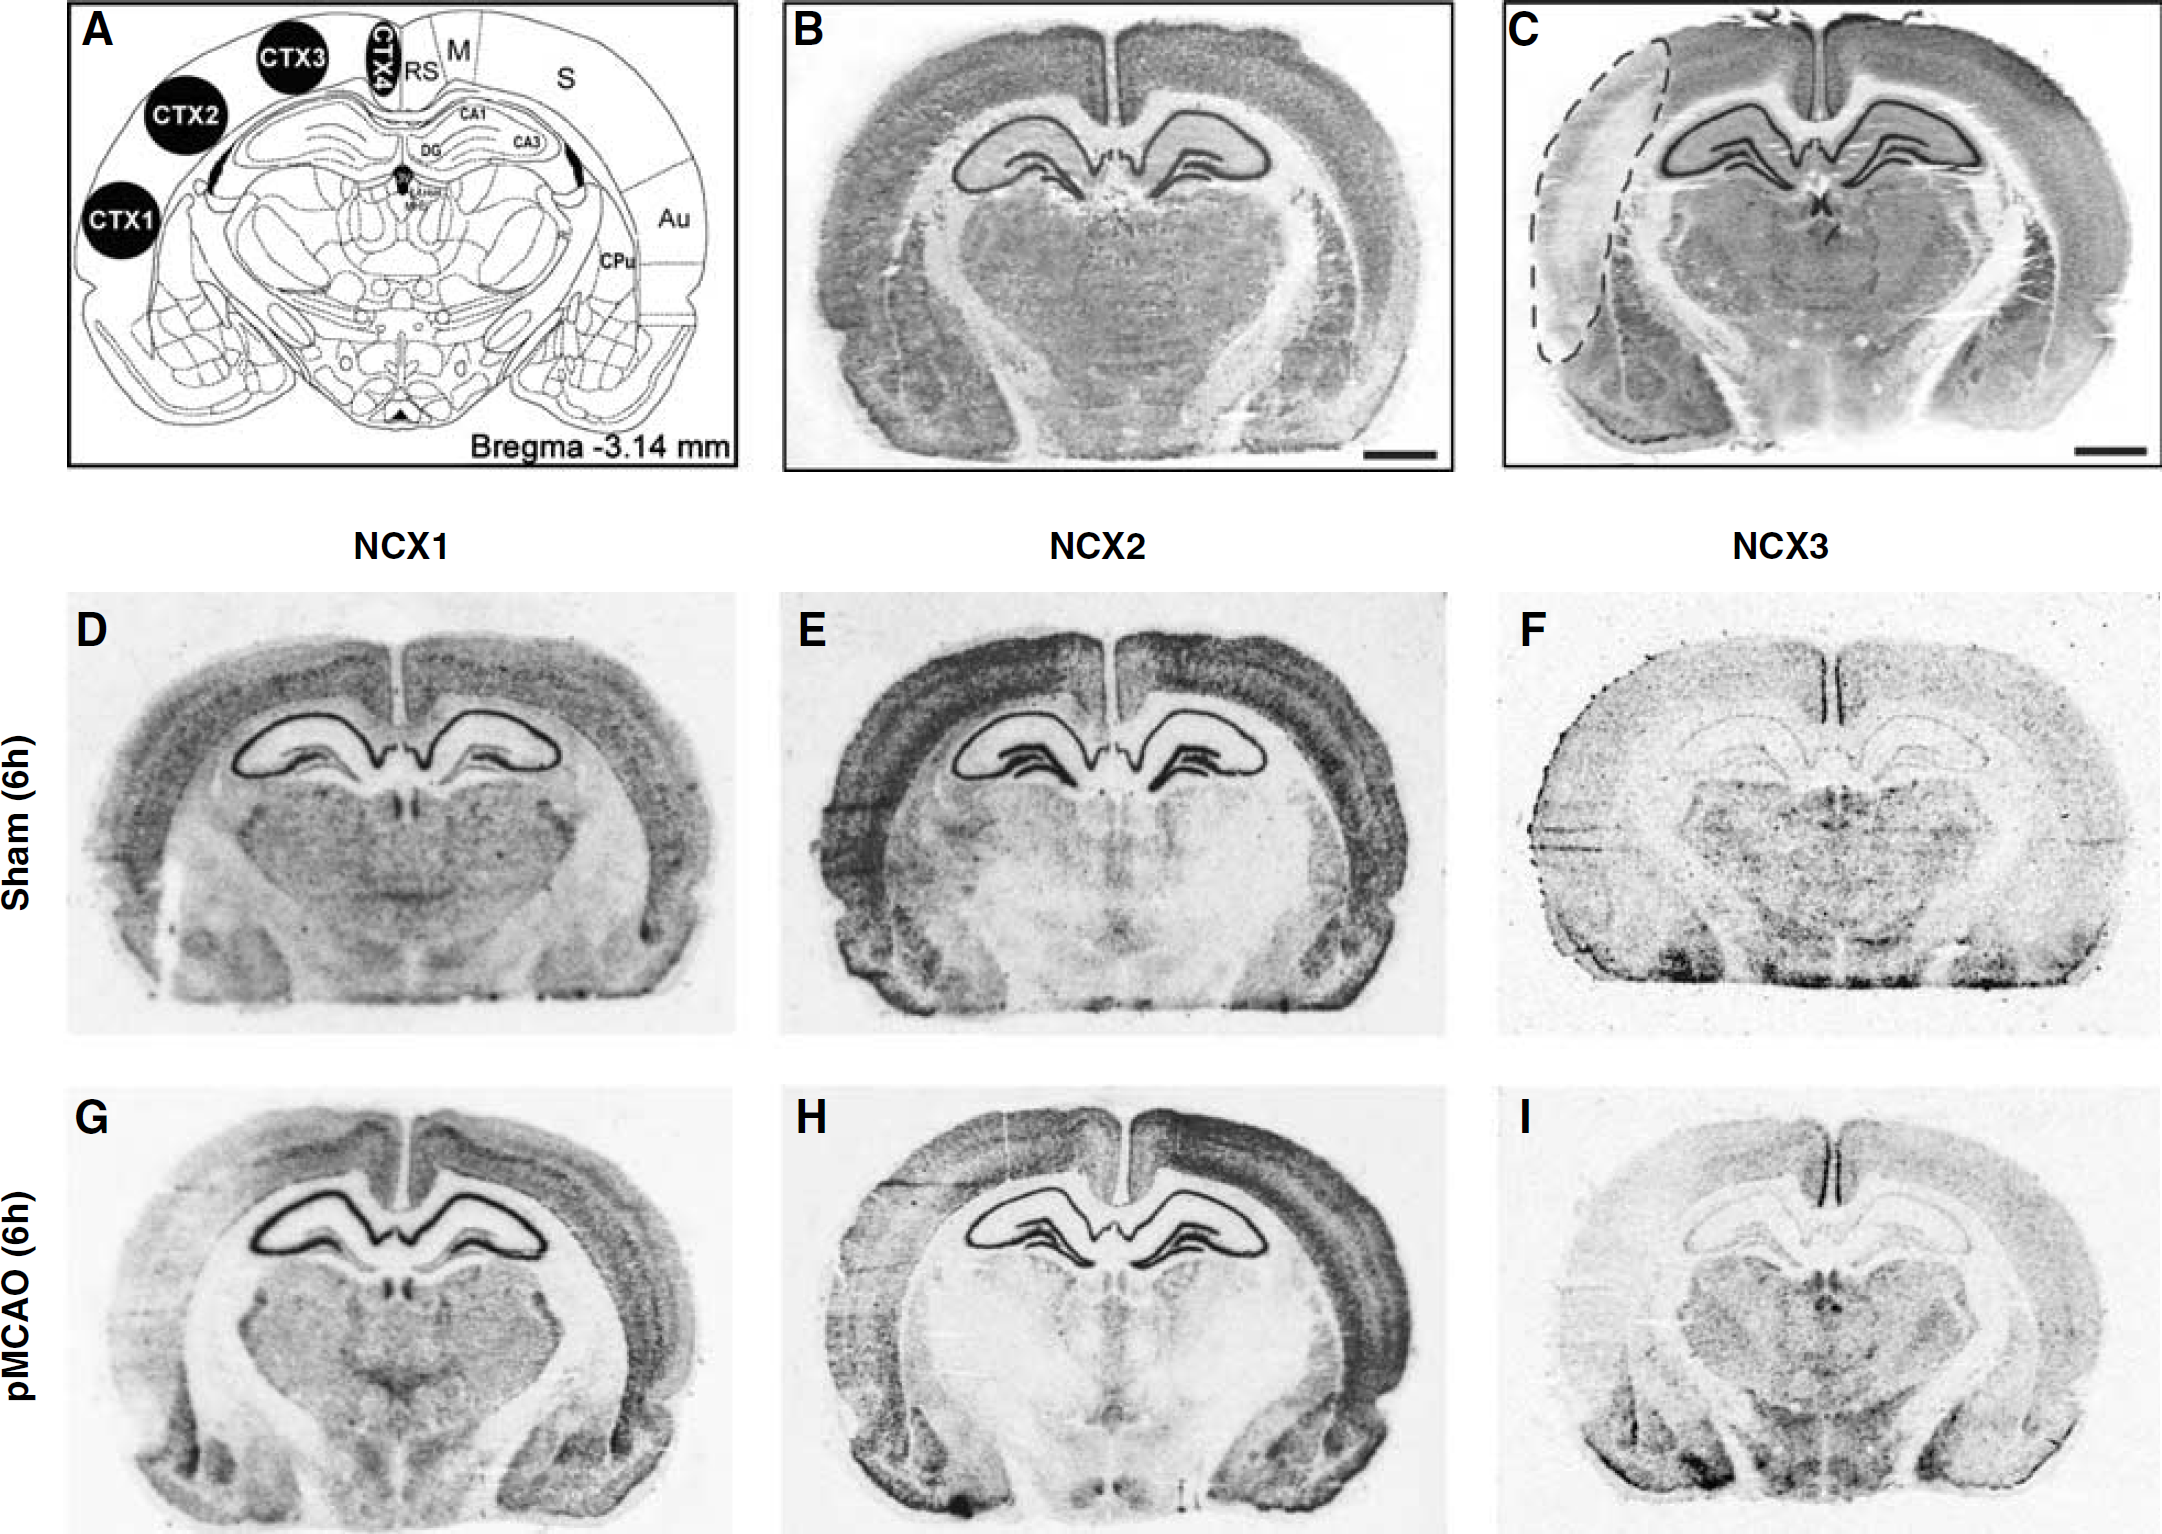
NCX1, NCX2, and NCX3 mRNAs in the cerebral cortex and hippocampus of sham-operated and ischemic animals 6 h after sham surgery or pMCAO. A schematic diagram of ROIs at coronal bregma levels of −3.14 mm is shown in panel A. Representative brain NeuN-immunohistochemistry-processed sections deriving from sham-operated and pMCAO rats are shown in panels B and C, respectively. Panels D to I represent the in situ hybridization autoradiographic film images obtained from sham-operated and ischemic brain sections with NCX1 (D, G), NCX2 (E, H), and NCX3 (F, I) antisense probes. Au, auditory cortex, CA1, field CA1 of hippocampus; CA3, field CA3 of hippocampus; CPu, caudate putamen; DG, dentate gyrus; LHb, lateral habenular nucleus; MHb, medial habenular nucleus; M, motor cortex; RS, retrosplenial cortex; Rt, reticular thalamic nucleus; 3V, third ventricle. Scale bar in panels B and C: 2 mm.
NCX1, NCX2, and NCX3 mRNAs in the prefrontal cortex of sham-operated and ischemic animals 24 h after sham surgery or pMCAO. A schematic diagram of ROIs at coronal bregma levels of +3.20 mm is shown in panel A. Representative brain NeuN-immunohistochemistry-processed sections deriving from sham-operated and pMCAO bearing rats are shown in panels B and C, respectively Panels D to I represent the in situ hybridization autoradiographic film images obtained from sham-operated and ischemic brain sections with NCX1 (D, G), NCX2 (E, H), and NCX3 (F, I) antisense probes. Messenger ribonucleic acid levels of NCX1, NCX2, and NCX3, expressed as Δd.p.m. ± s.e.m. and presented for each ROI analyzed, with white columns for sham-operated rats and black columns for pMCAO rats, are shown in panels L, M, and N, respectively. Δd.p.m. indicates the difference between the d.p.m. value of each ROI ipsilateral to the ischemic side and that of the contralateral corresponding side. *P < 0.05 versus respective values in sham-operated groups, aca, anterior commissure, anterior part; AID, agranular insular cortex, dorsal part; AIV, agranular insular cortex, ventral part; Cg1, cingulate cortex, area 1; DP, dorsal peduncular cortex; DTT, dorsal tenia tecta; fmi, forceps minor of the corpus callosum; IL, infralimbic cortex; LO, lateral orbital cortex; M1, primary motor cortex; M2, secondary motor cortex; Pir, piriform cortex; PrL, prelimbic cortex; VO, ventral orbital cortex; VTT, ventral tenia tecta. Scale bar in panels B and C: 2 mm.
Data Processing
Measurements of transmittance within ROI were then converted into relative disintegration per minute (relative d.p.m.) using a calibration curve based on 14C standard scale coexposed with the sections, and crosscalibrated with 35S-labeled brain paste standards containing a known amount of radioactivity. For this purpose, a ‘best fit’ thirddegree polynomial was used, as already described (de Bartolomeis et al, 2002; Ambesi et al, 2003). Quantitative comparisons among different experimental groups were performed using images from hybridized sections exposed on the same X-ray film sheet.
For each individual section, the value of each ROI contralateral to the ischemic side was subtracted from that of the corresponding ipsilateral side. Differences were calculated in the control, sham-operated and pMCAO bearing animals. Measurements from two to three consecutive sections of each animal were averaged. The data calculated in the control, sham-operated and ischemic animals were averaged and processed for statistical analysis. Data were analyzed by means of unpaired two-tailed Student's t-test. Since no statistically significant difference was found between control and sham-operated animals, the data are presented as a comparison of pMCAO bearing animals and sham-operated rats.
Neuronal Immunohistochemistry
Sham-operated and ischemic slices kept on chromallumegelatine slide were fixed at room temperature in 4% (w/v) paraformaldheyde in PBS for 30 mins. Briefly, slices were washed four times in PBS, treated with 1% (v/v) hydrogen peroxide (H2O2) in PBS for 5 mins, washed three times in PBS and, finally, preincubated in PBS containing 3% (w/v) bovine serum albumin (Sigma, Milan, Italy) and 0.1% (v/v) Triton-X (Biorad, Milan, Italy). Then, the sections were incubated with the primary antibody anti-NeuN (1:2000; Chemicon, Milan, Italy) at 4°C overnight, washed six times in PBS, and finally incubated with the biotinylated secondary antibody (1:200; horse anti-mouse IgG, Vector Labs, Burlingame, CA, USA) for 2 h at room temperature. Next, they were washed in PBS and processed with the Elite Vectastain avidin-biotin Kit (1:300, Vector Labs, Burlingame, CA, USA, 1.5 h). The peroxidase reaction was developed by 3-3'-diaminobenzi-dine tetrahydrochloride (DAB, Sigma, Milan, Italy) as a chromogen. After the final wash, sections were dehydrated and coverslipped. Slices were acquired with a CCD digital camera (C-5985, Hamamatsu Photonics, Milan, Italy) and Image Pro-Plus software (Media Cybernetics, Silver Springs, MD, USA).
Results
Extent of Ischemic Damage 6 and 24 h after Permanent Middle Cerebral Artery Occlusion
Neuron specific nuclear protein (NeuN) immunohistochemistry revealed that 6 and 24 h after pMCAO, the ischemic damage included the prefrontal (motor and insular compartments), somatosensory (parietal), and insular cortices, whereas the cingulate and retrosplenial cortices, the caudate-putamen, and the dorsal hippocampus regions were outside the ischemic core and the periinfarct area (Figures 1 to 8, panel C). In sham-operated animals, NCX1, NCX2, and NCX3 mRNA distribution in different brain regions, obtained by radioactive in situ hybridization (Figures 1 to 7, panels D, E, and F; Figure 8, panels G, H, and I, respectively), was largely in agreement with previous studies performed in our lab with isoform-specific nonradioactive digoxygenin-labeled riboprobes (Canitano et al, 2002; Papa et al, 2003).
NCX1, NCX2, and NCX3 mRNAs in the cerebral cortex and caudate putamen of sham-operated and ischemic animals 24 h after sham surgery or pMCAO. A schematic diagram of ROIs at coronal bregma levels of −0.30 mm is shown in panel A. Representative brain Neun-immunohistochemistry-processed sections deriving from sham-operated and pMCAO rats are shown in panels B and C, respectively. Panels D to I represent the in situ hybridization autoradiographic film images obtained from sham-operated and ischemic brain sections with NCX1 (D, G), NCX2 (E, H), and NCX3 (F, I) antisense probes. Messenger ribonucleic acid levels of NCX1, NCX2, and NCX3, expressed as Δd.p.m. ± s.e.m. and presented for each ROI analyzed with white columns for sham-operated rats and black columns for pMCAO rats, are shown in panels L, M, and N, respectively. *P < 0.05 versus respective values in sham-operated groups. Cc, corpus callosum; Cg, cingulate cortex; CPu, caudate putamen; Den, dorsal endopiriform nucleus; GP, globus pallidus; ***I, insular cortex; LSD, lateral septal nucleus, dorsal part; LSI, lateral septal nucleus, intermediate part; LSV, lateral septal nucleus, ventral part; LV, lateral ventricle; M, motor cortex; MnPO, median preoptic nucleus; Pir, piriform cortex. Scale bar in panels B and C: 2 mm.
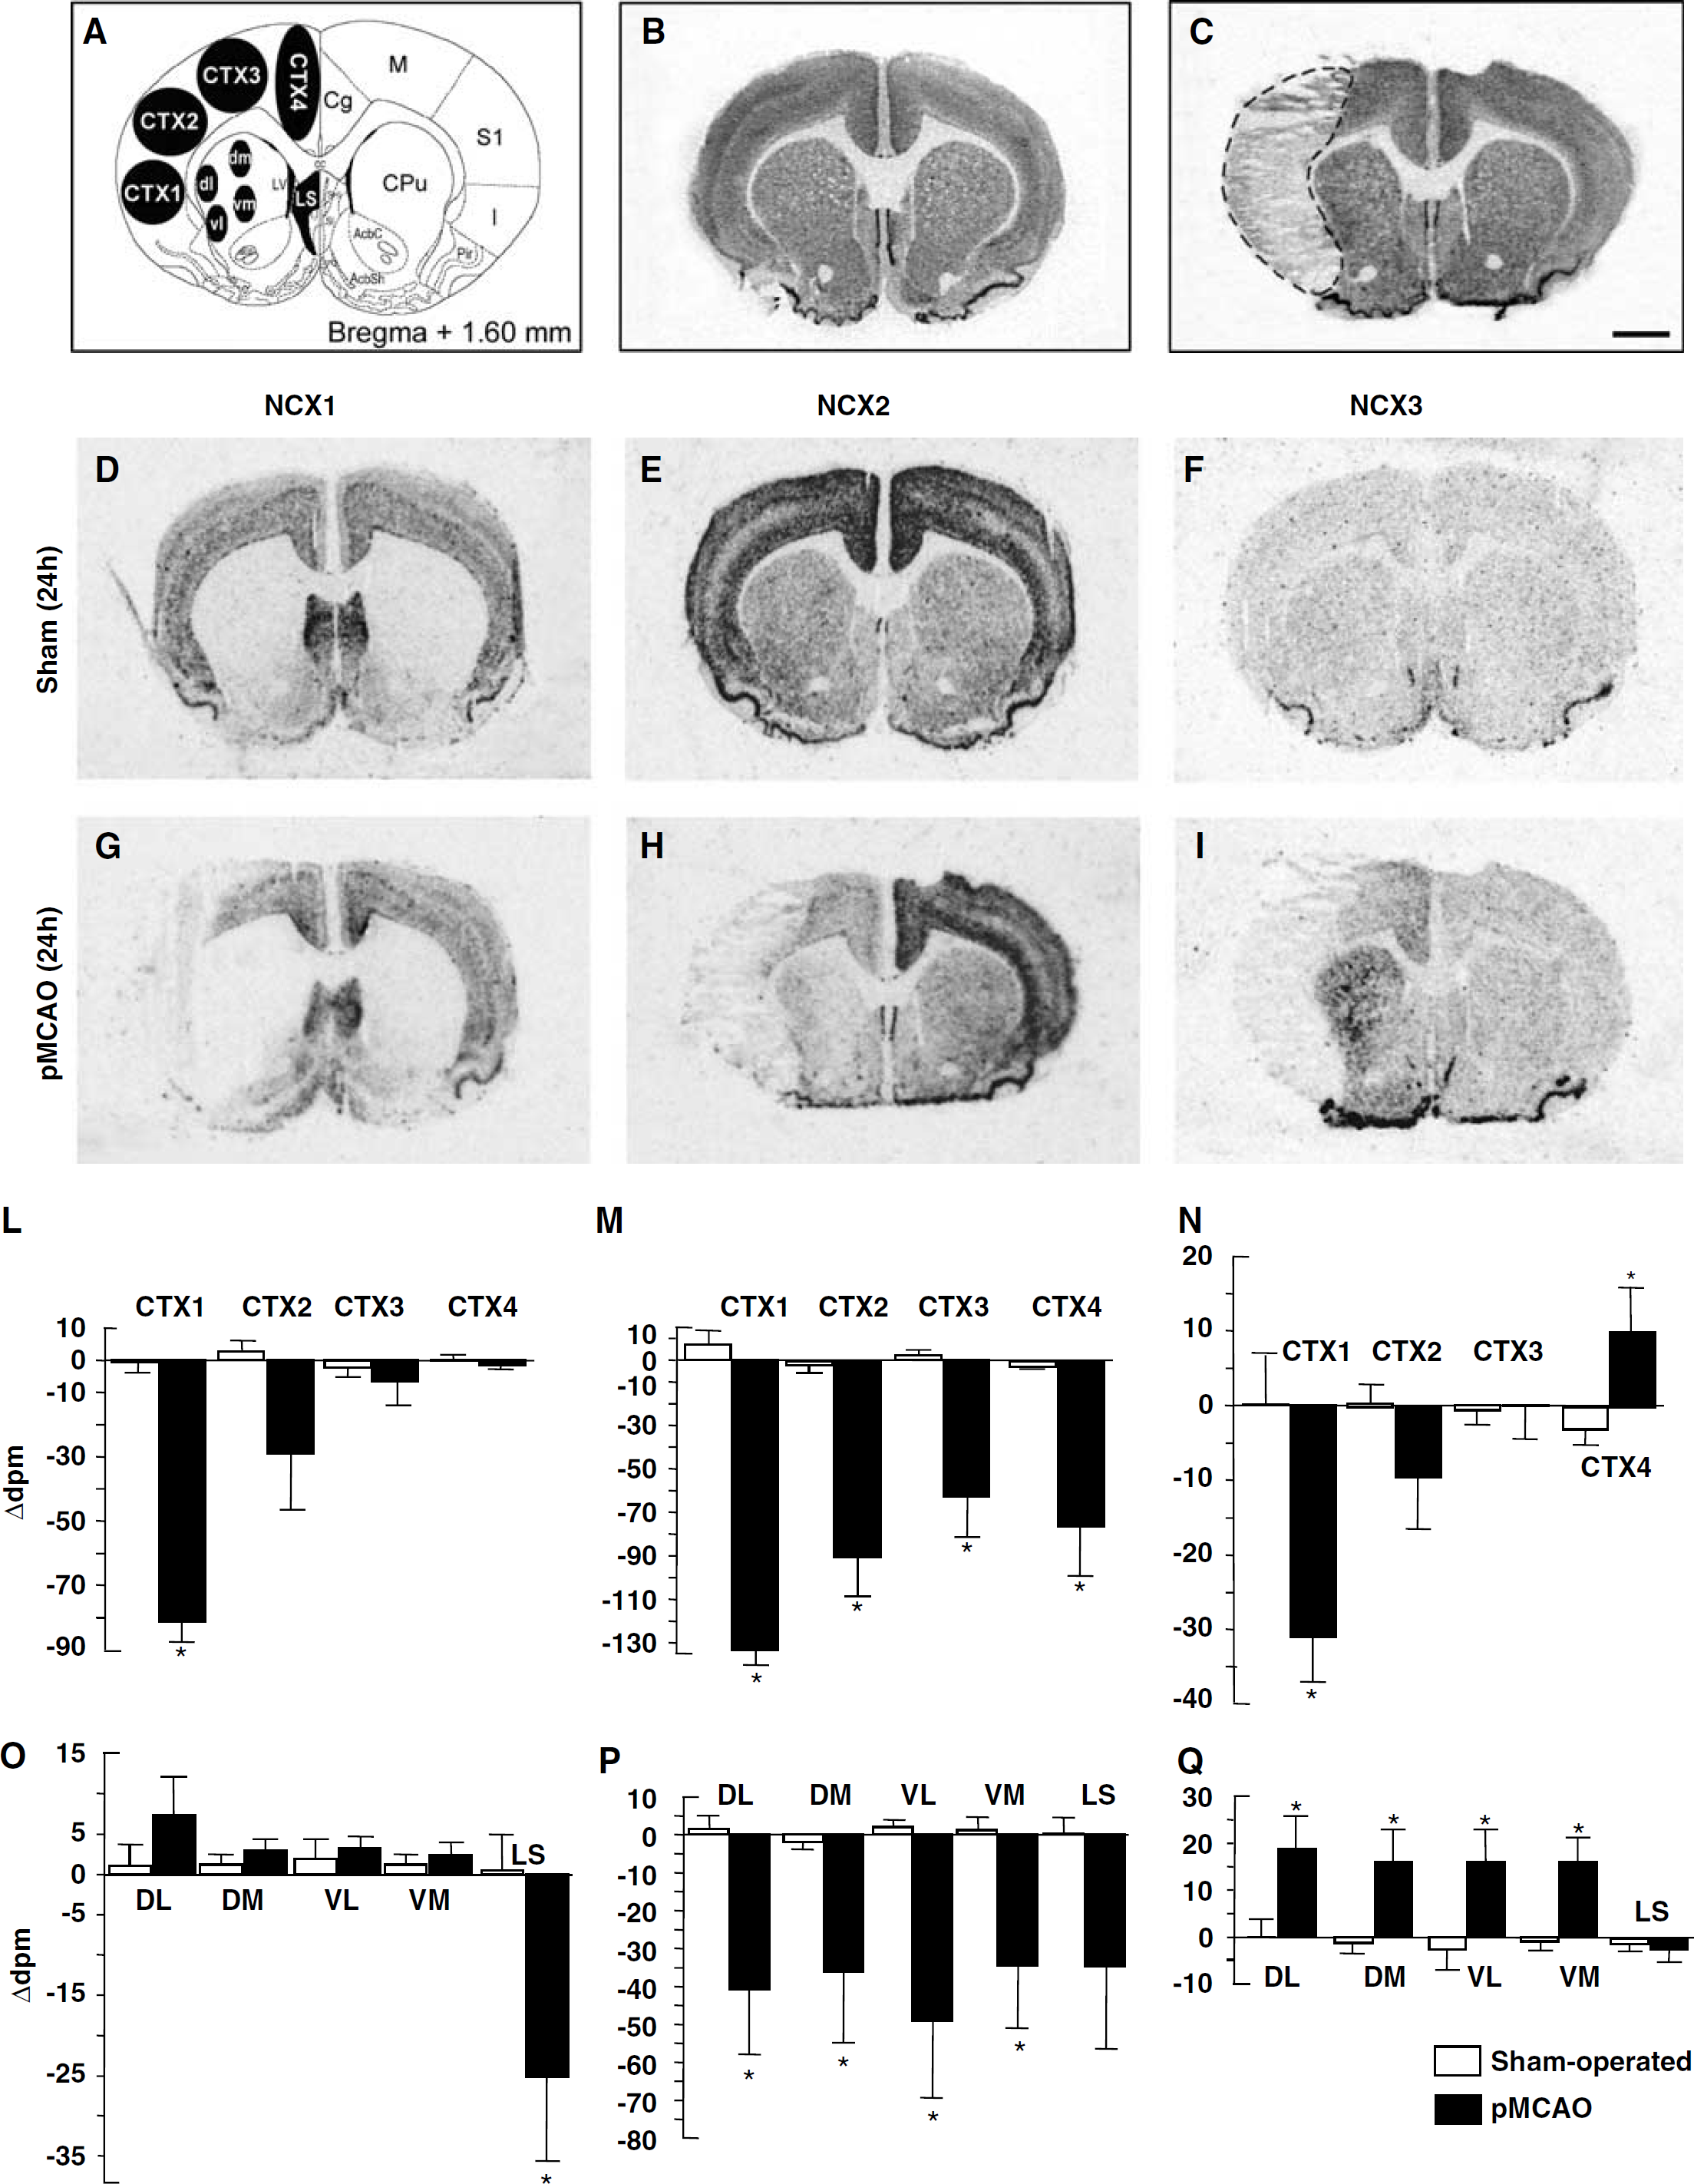
NCX1, NCX2, and NCX3 mRNAs in the cerebral cortex, caudate putamen, and lateral septum of sham-operated and ischemic animals 24 h after sham surgery or pMCAO. A schematic diagram of ROIs at coronal bregma levels of + 1.60 mm is shown in panel A. Representative brain NeuN-immunohistochemistry-processed sections deriving from sham-operated and pMCAO rats are shown in panels B and C, respectively Panels D to I represent the in situ hybridization autoradiographic film images obtained from sham-operated and ischemic brain sections with NCX1 (D, G), NCX2 (E, H), and NCX3 (F, I) antisense probes. Messenger ribonucleic acid levels of NCX1, NCX2, and NCX3, expressed as Δd.p.m. ± s.e.m. and presented for each ROI analyzed, with white columns for sham-operated rats and black columns for pMCAO rats, are shown in panels L and O; M and P, N and Q, respectively. *P < 0.05 versus respective values in sham-operated groups. AcbC, accumbens nucleus, core; AcbSh, accumbens nucleus, shell; cc, corpus callosum; Cg, cingulate cortex; CPu, caudate putamen; ***I, insular cortex; LSI, lateral septal nucleus, LV, lateral ventricle; M, motor cortex; Pir, piriform cortex; S1, primary somatosensory cortex; Shi, septohippocampal nucleus. Scale bar in panels B and C: 2 mm.
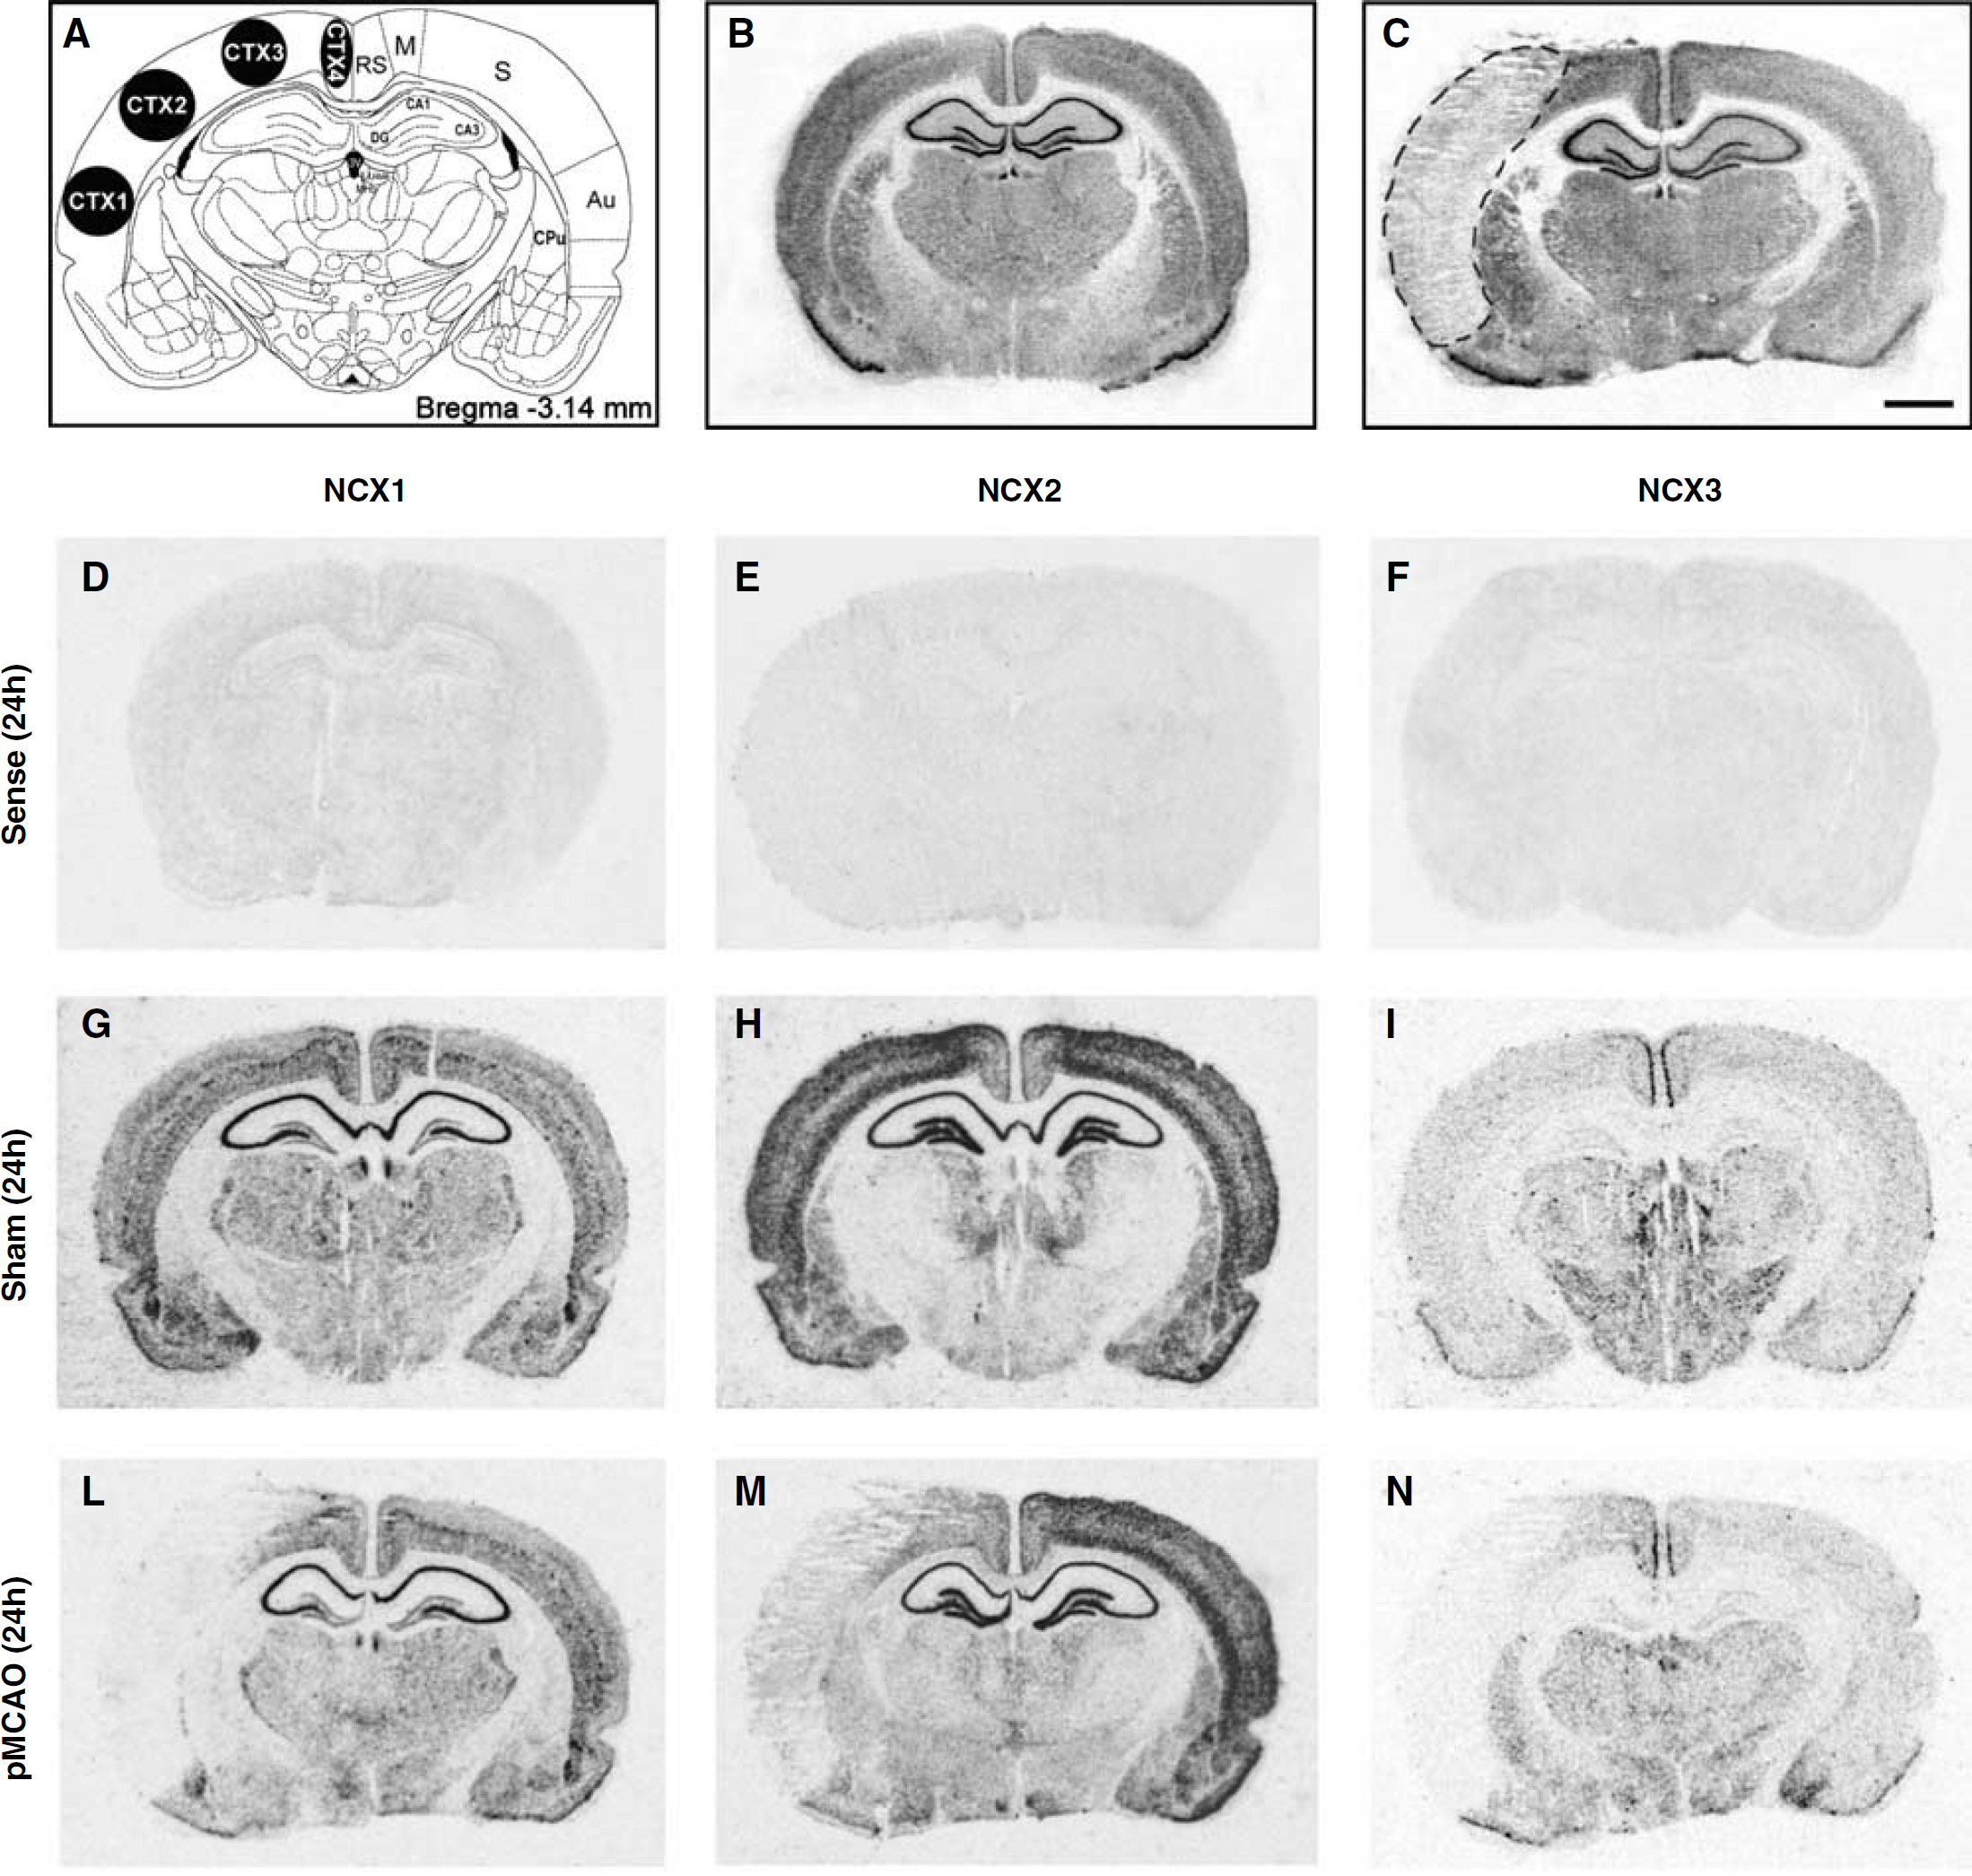
NCX1, NCX2, and NCX3 mRNAs in the cerebral cortex and hippocampus of sham-operated and ischemic animals 24 h after sham surgery or pMCAO. A schematic diagram of ROIs at coronal bregma levels of −3.14 mm is shown in panel A. Representative brain NeuN-immunohistochemistry-processed sections deriving from sham-operated and pMCAO rats are shown in panels B and C, respectively. Panels D to I represent the in situ hybridization autoradiographic film images obtained from sham-operated brain sections with sense (D, E, and F), or antisense (G, H, and I) probes for NCX1, NCX2, and NCX3, respectively. Panels L and M represent the in situ hybridization autoradiographic film images obtained from ischemic brain sections with NCX1 (L), NCX2 (M) and NCX3 (N) antisense probes. Au, auditory cortex; CA1, field CA1 of hippocampus; CA3, field CA3 of hippocampus; CPu, caudate-putamen; DG, dentate gyrus; LHb, lateral habenular nucleus; MHb, medial habenular nucleus; M, motor cortex; RS, retrosplenial cortex; Rt, reticular thalamic nucleus; 3V, third ventricle. Scale bar in panels B and C: 2 mm.
NCX1, NCX2, and NCX3 Messenger Ribonucleic Acids in the Prefrontal Cortex and Tenia Tecta of Sham-Operated and Permanent Middle Cerebral Artery Occlusion Bearing Rats 6 and 24 h after Permanent Middle Cerebral Artery Occlusion
Densitometrie measurements of in situ hybridization autoradiographs revealed that in the hemisphere ipsilateral to pMCAO, the PFC1 subregion of the prefrontal cortex, an area belonging to the motor function and located in the ischemic core, displayed a significant downregulation (50%) of only NCX2 transcripts at 6 h (Figure 1, panels E, H, and M), whereas at 24 h all NCX1, NCX2, and NCX3 transcripts were downregulated (90%) (Figure 5, panels D to N). In the other motor PFC2 subregion, most likely belonging to the periinfarct zone, the two transcripts NCX2 and NCX3 revealed a divergent behavior at 24 h. Indeed, NCX2 mRNA decreased by 50% (Figure 5 panels E, H, and M), whereas NCX3 mRNA increased by 50% (Figure 5, panels F, I, and N). In the PFC3 subregion of the prefrontal cortex—an area corresponding to the deep layers (V to VI) of the infralimbic and prelimbic cortices—and in the TT—an area considered as an anterior hippocampal rudiment—NCX1 and NCX3 mRNAs remarkably increased from 30% to 60% only at 24 h (Figure 5, panels D, G, L, and F, I, and N, respectively). By contrast, in the same subregions, pMCAO elicited a marked decrease in NCX2 mRNA expression both at 6 and 24 h (Figures 1 and 5, panels E, H, and M).
NCX1, NCX2, and NCX3 Messenger Ribonucleic Acids in the Cingulate, Motor and Somatosensory Cortices; Caudate-Putamen and Lateral Septum of Sham-Operated and Permanent Middle Cerebral Artery Occlusion Bearing Rats 6 and 24 h after Permanent Middle Cerebral Artery Occlusion
At 6 h after pMCAO NCX1 transcripts were downregulated of approximately 30% in the CTX1 and CTX2 corresponding to the insular and somatosensory cortices, whereas NCX2 and NCX3 mRNA significantly decreased only in the CTX1 lesioned area (Figure 2, panels D, G, and L for NCX1; E, H, and M for NCX2; F, I, and N for NCX3). In the area most likely corresponding to the periinfarct zone, the primary and secondary motor cortices CTX3 did not display any significant change of NCX transcripts (Figures 2 and 3, panels D, G, and L for NCX1; E, H, and M for NCX2; F, I, and N for NCX3). In the cingulate cortex, CTX4, an intact region of the hemisphere ipsilateral to the pMCAO, only NCX2 transcripts were downregulated (Figures 2 and 3, panels E, H, and M). In the VL, VM, DL, and DM compartments of the caudate-putamen, a subcortical region which was not affected by pMCAO, only NCX2 gene transcripts displayed a downregulation (50%) (Figure 2, panels E, H, and P for NCX2).
At 24 h after pMCAO NCX isoform transcripts were downregulated in the infarct areas CTX1 and CTX2, respectively (Figure 6, panels D, G, and L for NCX1; E, H, and M for NCX2; F, I, and N for NCX3). Analogously, in the area most likely corresponding to the periinfarct area, the primary and secondary motor cortices CTX3 displayed a pronounced decrease in NCX2 transcripts (Figures 6 and 7, panels E, H, and M) and a slightly reduced signal in NCX1 transcripts (Figures 6 and 7, panels D, G, and L).
In CTX4, NCX2 (Figures 6 and 7, panels E, H, and M) and NCX3 (Figures 6 and 7, panels F, I, and N) transcripts displayed an opposite regulation: the former isoform decreased and the latter increased.
In the VL, VM, DL, and DM compartments of the caudate-putamen, the two NCX gene transcripts behaved differently: NCX2 mRNA decreased and NCX3 mRNA increased. A similar behavioral pattern was also detected in other periinfarct and intact areas (Figure 6, panels E, H, and P for NCX2; F, I, and Q for NCX3, and Figure 7, panels E, H, and M for NCX2; F, I, N for NCX3).
Within the septal area, a pMCAO-resistant region in which NCX1 transcripts are largely distributed, a remarkable reduction (35%) of this isoform was detected in the lateral division (Figure 6, panels D, G, and O), whereas NCX2 (Figure 6, panels E, H, and P) and NCX3 mRNA expression remains unchanged (Figure 6, panels F, I, and Q).
In the hippocampus, a region outside the core and the periinfarct regions, where the three transcript isoforms are differently but highly expressed, no variation in NCX isoforms was detected both at 6 and 24 h after pMCAO (Figure 4, panels D to I and Figure 8, panels G to N).
Finally, NCX1, NCX2, and NCX3 sense probes did not reveal any detectable mRNA expression in all the brain regions at the −3.14 mm bregma level (Figure 8, panels D to F), whereas a specific autoradiographic in situ hybridization signal was detected with NCX1, NCX2 and NCX3 antisense probes (Figure 8, panels G to I).
Discussion
The results of the present study clearly demonstrate that pMCAO affects NCX gene expression in a differential manner, depending on the exchanger isoform and brain region involved in the insult. In addition, the in situ hybridization results showed that the NCX family gene expression after cerebral ischemia was time-dependent since changes in the level of transcripts of some NCX isoforms began at the early time of 6 h and became more evident 24 h after the lesion. Particularly, in the ischemic core region, NCX1, NCX2, and NCX3 mRNAs were downregulated in those areas that survived the ischemic insult. The pattern of these three NCX transcript expression mirrors the decline of NCX1, NCX2, and NCX3 proteins recently observed, by means of Western blot experiments, by Pignataro et al (2004b) in the core region. By contrast, in the periischemic area, which included parts of the somatosensory parietal cortex and of the dorsolateral caudate-putamen, the two NCX transcripts, NCX2 and NCX3, revealed a divergent behavior: NCX2 was downregulated, whereas NCX3 was upregulated. NCX2 downregulation in the periischemic area, a region adjacent to the infarct area, may be related to the transcriptional mechanisms controlling its expression. In effect, the repetitive spreading depression-like depolarization occurring during ischemia and originating in the ischemic core, propagates to the surrounding brain regions of the same hemisphere (Hossmann, 1996), thus producing changes in the NCX2 gene expression. This hypothesis is supported by RT-PCR and Northern blot analysis studies showing that in primary cerebellar granule cells (CGNs) K+-induced depolarization, followed by calcium influx, causes a selective downregulation of NCX2 mRNA in a calcineurin-dependent way (Li et al, 2000). In contrast, the expression of the other NCX gene, NCX3, seemed to reveal an opposite regulatory mechanism, as demonstrated by its increase in the periinfarct region. Consistently, in primary neuronal cultures, depolarization upregulates NCX3 mRNA in a calcineurin-independent manner (Li et al, 2000). Furthermore, the upregulation of NCX3, as opposed to NCX2 downregulation, might be interpreted as a compensatory mechanism induced by NCX3 isoform to counterbalance the reduced activity of the NCX2 protein and, thus, counteract the dysregulation of [Na+]i and [Ca2+]i homeostasis. Accordingly, we hypothesized that NCX3 may exert a neuroprotective response. Evidence for NCX3 neuroprotective role is that a remarkable broadening of the infarct volume occurs when NCX3 protein is knocked down with a selective antisense oligonucleotide, thereby worsening the neurologic deficits (Pignataro et al, 2004b). Confirming this evidence, very recently, Bano et al (2005) showed that the silencing of NCX3 expression by RNA interference sensitizes CGNs vulnerability to Ca2+ overload and excitotoxicity.
However, since ischemia causes a relevant reduction of NCX proteins in the core and in the remaining ipsilateral nonischemic areas (Pignataro et al, 2004a), the possibility exists that all the changes observed in the present paper for NCX family transcripts might be ascribed to regional differences in protein synthesis activity.
As regards our hypothesis that NCX gene responses are not confined exclusively to core and periinfarct areas, but can also be found in remote nonischemic brain regions, a large body of studies have, in fact, demonstrated that ischemic lesions consequent to MCAO induce a complex pattern of genomic responses in regions anatomically distant but functionally connected with the infarct areas (Kiessling and Gass, 1994; Hata et al, 2000; Kury et al, 2004). Consistently, we found that NCX1 and NCX3 mRNAs were upregulated in the deep layers of the infralimbic and prelimbic cortices. The upregulation of NCX1 and NCX3 gene expression in these two intact limbic cortical regions could be interpreted as a homeostatic response consequent to the reciprocal anatomic and functional connections existing between the insular cortex, damaged by pMCAO, and the infralimbic and prelimbic cortices, not involved in the insult (Saper, 1982; Gabbott et al, 2003). Interestingly, neurons in these two limbic cortical regions project to brainstem nuclei, such as the nucleus of the solitary tract involved in the central cardiovascular control (Vertes, 2004; Verberne and Owens, 1998). Therefore, the increase in NCX1 and NCX3 expression may be related to a compensatory response activated in these circuits after stroke (Cheung et al, 1997; McDougall et al, 2004; Resstel et al, 2004). It is worth underlining that in humans, brain damage consequent to stroke is associated with sympathetic activity imbalance resulting in subsequent injury, arrhythmia, and sudden death (Cheung and Hachinski, 2000; Tamayo and Hachinski, 2003).
Interestingly, NCX1 and NCX3 upregulation was also detected in the TT, an area thought to be an anterior hippocampal rudiment and enriched in both serotonin (Santana et al, 2004) and orexin terminals and receptors (Trivedi et al, 1998). Indeed, in the brain, the excitatory effect elicited by the stimulation of these two receptors is mediated by the activation of NCX exchanger currents (Eriksson et al, 2001a, b ; Sergeeva et al, 2003; Wu et al, 2002, 2004; Burdakov et al, 2003). In addition, in the same TT region, pMCAO induces NOS neuronal expression (nNOS) (Peng et al, 1996), whose gaseous end-product NO activates NCX (Asano et al, 1995).
Like in the periinfarct regions, in the four compartments of the caudate-putamen, an area which is not affected by the ischemic lesion, but is adjacent to the core, NCX2, displayed a downregulation. By contrast, in the same striatal subregions, the NCX3 isoform displayed an upregulation. The behavioral discrepancy between NCX2 and NCX3 suggests, once again, that when NCX2 expression decreases in response to hypoxic conditions, NCX3 may assume a replacing function. Consistently, biochemical studies have clearly demonstrated that whereas NCX2 activity is strictly dependent on ATP levels, which are lowered during the development of brain ischemia, NCX3 is the only NCX gene product that is independent of ATP (Linck et al, 1998).
On the whole, all these results indicate that NCX1, NCX2, and NCX3 mRNAs expression is differentially regulated after pMCAO in the ischemic core, in the periinfarct region as well as in anatomic and functional areas, located in the hemisphere ipsilateral to the lesion and related to the infarct regions. Furthermore, because over the past few years an increasing number of studies have endeavoured to provide pharmacological agents able to selectively modulate NCX isoforms to gain a better understanding of their role and to develop more effective approaches for the treatment of ischemia, the data of this study could deepen our insights into NCX pathophysiologic role.
Footnotes
Acknowledgements
The authors thank Dr Adriana Canitano for useful suggestions in NCX probe selection and Dr Paola Merolla for her invaluable editorial revision.