
Abstract
Abnormal metabolism of tryptophan has been implicated in modulation of tumor cell proliferation and immunoresistance. α-[11C]Methyl-
Keywords
Introduction
Tryptophan is an essential amino acid required for biosynthesis of proteins, serotonin, and niacin in the brain and other tissues (Peters, 1991). Under some pathologic conditions, induction of the initial and rate-limiting enzyme of the kynurenine pathway, indoleamine 2,3-dioxygenase (IDO), also leads to a significantly increased metabolism of tryptophan by the kynurenine pathway (Saito et al, 1992). Recently, interest in tryptophan metabolism via this pathway has grown due to the recognition that induction of IDO by interferon gamma leads to local tryptophan depletion, thus inhibiting cell growth in malignant tumors (Ozaki et al, 1988; Aune and Pogue, 1989; Taylor and Feng, 1991; Burke et al, 1995). This observation has led to the proposal that pharmacological induction of IDO might be an effective way to slow down tumor cell growth. In contrast, more recent studies have suggested that enhanced IDO activity in and around tumors may actually exert a potent immunosuppressive effect by blocking T-lymphocyte proliferation locally, thus diminishing T-cell-mediated tumor rejection (Mellor and Munn, 1999; Friberg et al, 2002; Uyttenhove et al, 2003; Munn and Mellor, 2004). Based on this latter mechanism, pharmacological blockade of IDO (e.g., by using the IDO inhibitor 1-methyl-tryptophan) could be clinically useful to reverse local immune suppression (Uyttenhove et al, 2003; Munn and Mellor, 2004; Muller et al, 2005). It remains unclear how pharmacological manipulation of IDO would affect the behavior of different tumor types in vivo.
One potentially important approach for better understanding the role of tryptophan metabolism in tumor growth is to study the in vivo metabolism of tryptophan in various low- and high-grade tumors in humans. This can be performed using the PET radiotracer α-[11C]methyl-
Subsequent studies using AMT PET in children with tuberous sclerosis and epilepsy have shown focal accumulation of AMT in epileptogenic (but not in nonepileptogenic) tubers (Chugani et al, 1998a; Asano et al, 2000; Fedi et al, 2003); this accumulation is likely the result of epileptogenic tubers containing increased levels of quinolinic acid, which is a convulsant and neurotoxic metabolite of the kynurenine pathway (Chugani et al, 1998b; Chugani and Muzik, 2000). Subsequent studies in patients with intractable seizures of various etiologies, including malformations of cortical development, found that increased AMT was highly specific for epileptogenic cortical regions and is a useful method for presurgical evaluation of some patients with intractable epilepsy (Asano et al, 2000; Fedi et al, 2001; Juhász et al, 2003). Increased levels of quinolinic acid reported in the cerebrospinal fluid of children with brain tumors (Heyes et al, 1995), and increased IDO activity in malignant gliomas (Uyttenhove et al, 2003) suggested that abnormal tryptophan metabolism via the kynurenine pathway may also occur in brain tumors. Based on these observations, we hypothesized that AMT PET might be well suited for imaging the abnormal metabolism of tryptophan in various brain tumors, whether they are associated with seizures.
In the present study, in vivo uptake and metabolism of AMT were measured in brain tumors, including histologically verified gliomas and glioneuronal tumors, using PET. The study was designed to clarify differences of in vivo tryptophan metabolism in the most common gliomas and glioneuronal tumors via quantification of AMT uptake and metabolism, and also to investigate the clinical utility of AMT PET for detecting primary and recurrent low-grade tumors that are often difficult to delineate on other imaging modalities such as magnetic resonance imaging (MRI) or glucose metabolism PET.
Materials and methods
Subjects
Forty patients (25 male subjects, age range: 1.5 to 67 years; 16 children; Table 1) with a primary hemispheric brain tumor underwent AMT PET scanning as part of a research protocol approved by the Wayne State University Human Investigational Committee. All tumors were visualized by MRI and the tumor type was determined histologically either by brain biopsy or after resective surgery performed shortly (within 1 month) after the AMT PET scan. In 16 patients the AMT PET scan was obtained after a previous tumor resection, and residual or recurrent tumor was later verified by either re-operation (N = 10) or repeated MRIs, showing a growing tumor mass (N = 6). All PET scans were performed at least 3 months after the first surgery to avoid the confounding effect of increased AMT uptake resulting from postsurgical inflammation. Four of these patients had undergone tumor radio- and chemotherapy after the surgical resection more than 3 months before PET scanning. Thirty-five patients also underwent 2-deoxy-2[18F]fluoro-
Clinical data, PET, and MRI (contrast enhancement) findings of the patients (N = 40)
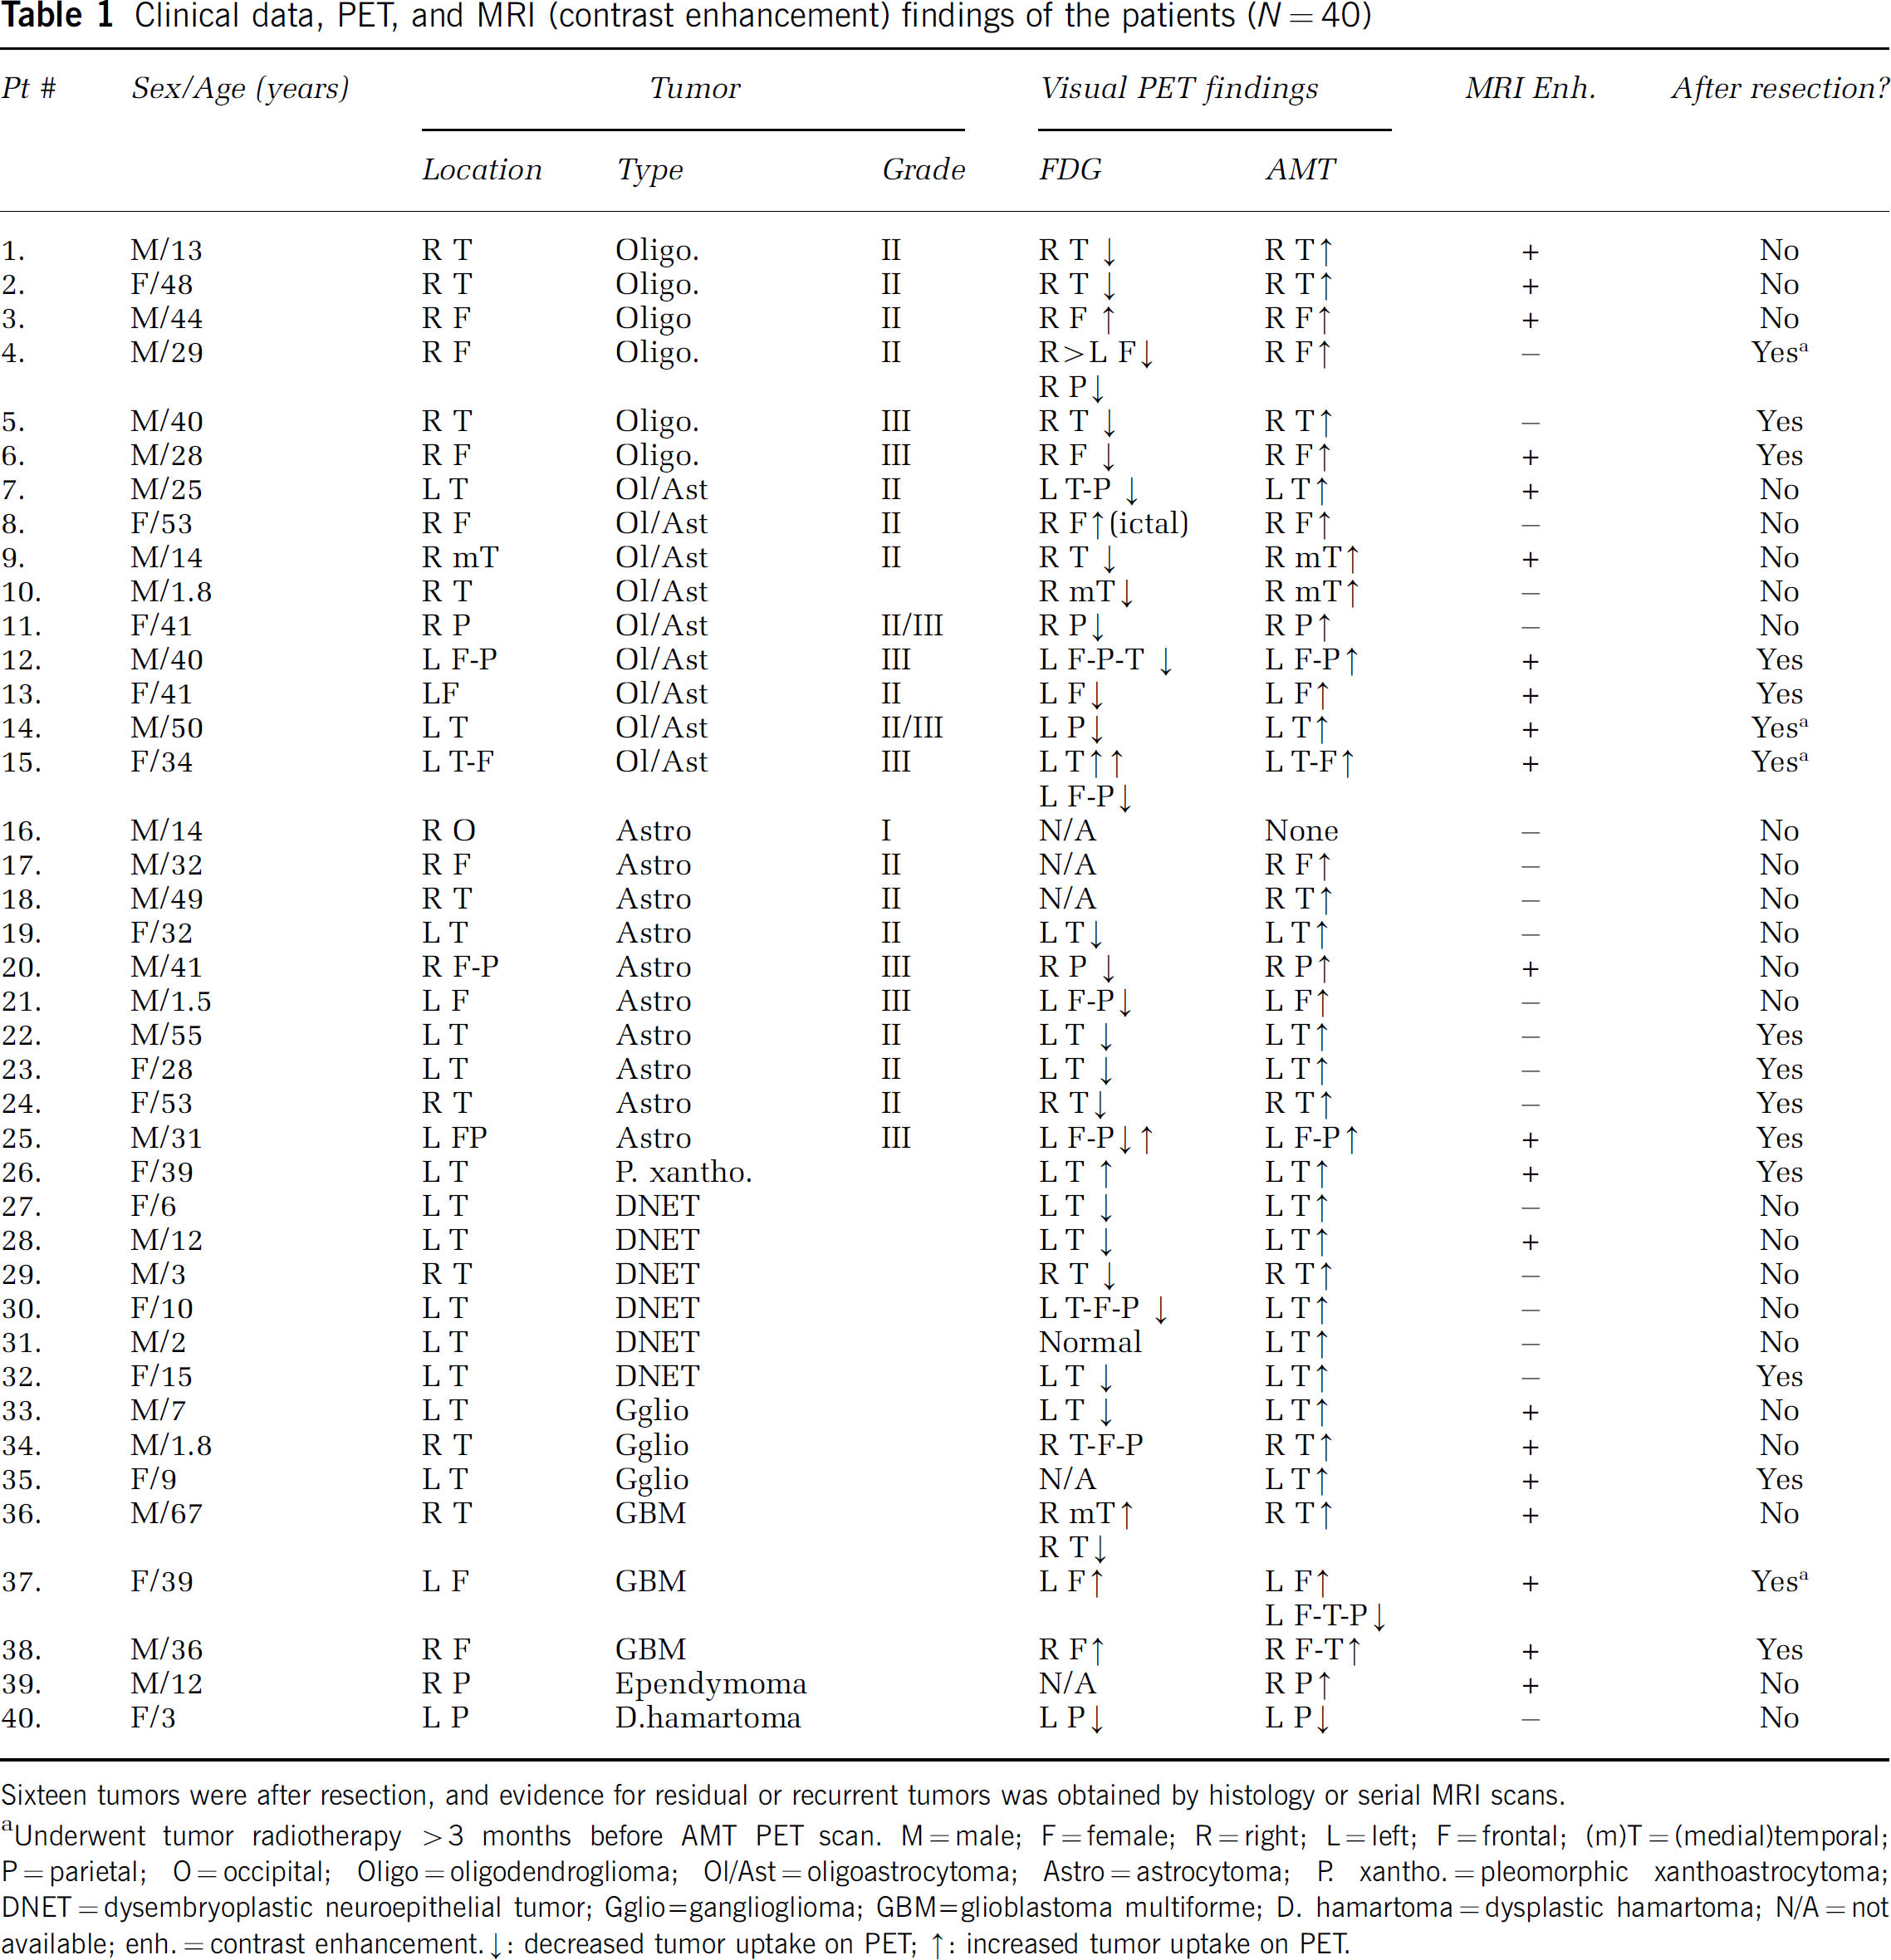
Sixteen tumors were after resection, and evidence for residual or recurrent tumors was obtained by histology or serial MRI scans.
Underwent tumor radiotherapy >3 months before AMT PET scan. M = male; F = female; R = right; L = left; F = frontal; (m)T = (medial)temporal; P = parietal; O = occipital; Oligo = oligodendroglioma; Ol/Ast = oligoastrocytoma; Astro = astrocytoma; P. xantho. = pleomorphic xanthoastrocytoma; DNET = dysembryoplastic neuroepithelial tumor; Gglio=ganglioglioma; GBM = glioblastoma multiforme; D. hamartoma = dysplastic hamartoma; N/A = not available; enh. = contrast enhancement.
decreased tumor uptake on PET
increased tumor uptake on PET.
Magnetic Resonance Imaging
All patients underwent a standard MRI using a 1.5 T GE (GE Medical Systems, Milwaukee, WI, USA) (children) or a 1.5 T Siemens Sonata (Erlangen, Germany) (adults) scanner as part of the clinical evaluation, including pre- and postgadolinium T1- and T2-weighted images as well as axial and/or coronal fluid-attenuated inversion recovery (FLAIR) images. The presence of gadolinium enhancement in the tumor region was evaluated visually by certified neuroradiologists who were unaware of the PET results.
PET Scanning Procedures
PET studies were performed using the CTI/Siemens EXACT/HR whole-body positron tomograph (Knoxville, TN, USA) located in the Children's Hospital of Michigan, Detroit. This scanner has a 15 cm field of view and generates 47 image planes with a slice thickness of 3.125 mm. The reconstructed image in-plane resolution obtained is 5.5 ± 0.35 mm at full-width half-maximum (FWHM) in-plane and 6.0 ± 0.49 mm in the axial direction (reconstruction parameters: Shepp-Logan filter with 1.1 cycles/cm cutoff frequency) for the FDG PET, and 7.5 ± 0.4 mm at FWHM and 7.0 ± 0.5 mm in the axial direction (reconstruction parameters: Hanning filter with 1.26 cycles/cm cutoff frequency) for the AMT PET. The patients were fasted for 4 h before the FDG PET. A venous line was established for injection of FDG (0.143 mCi/kg) produced using a Siemens RDS-11 cyclotron (Knoxville, TN, USA). Computed attenuation correction was applied according to the method of Bergstrom et al (1982). A 20-min static emission scan was initiated 40 mins after tracer injection. Scalp-recorded electroencephalograph (EEG) was monitored during the FDG uptake period in all patients with the history of seizures, using a Nicolet Voyageur Digital EEG equipment (Nicolet Biomedical, Madison, WI, USA).
The procedure for AMT PET scanning has been described previously (Chugani et al, 1998c). In brief, patients were fasted for 6 h before the AMT PET studies. This ensured stable plasma tryptophan and large neutral amino-acid levels during the study. A venous line was established for injection of AMT (0.1 mCi/kg) as a slow bolus over 2 mins. Children were sedated intravenously with either nembutal (5 mg/kg) or midazolam (0.2 to 0.4 mg/kg), if necessary. Prior studies performed in our laboratory on five adults each scanned twice (once without and once with sedation using midazolam) have found that global differences of AMT uptake were less than 10% between the two testing conditions (Muzik et al, 1998). A second venous line was established for collection of timed blood samples (0.5 mL/sample, collected at 0, 20, 30, 40, 50, and 60 mins after AMT injection), and plasma tryptophan concentration was measured as previously described to confirm stable values during the study (Wolf and Kuhn, 1986). After injection of AMT, a 20-min dynamic PET scan of the heart was performed (sequence: 12 × 10 s, 3 × 60 s, and 3 × 300 s) in 2D mode to obtain the left ventricular (LV) input function. Continuation of the arterial input function beyond the initial 20 mins was achieved using the venous blood samples as described previously (Muzik et al, 1994; Suhonen-Polvi et al, 1995). At 25 mins after tracer injection, a dynamic emission scan of the brain (7 × 5 mins) was acquired in high-sensitivity 3D mode. Measured attenuation correction was applied to the AMT PET images of the heart, whereas computed attenuation correction was used to correct the brain images. Scalp-recorded EEG was monitored throughout the AMT PET examinations in 17/35 patients who had a history of seizure(s). The other 18 patients were being observed during the AMT uptake period and none of them had clinical seizures.
PET Image Analysis
The AMT PET image volumes were coregistered with the MRI images (using T1, T2, or FLAIR sequences, depending on which sequence was best in visualizing the tumor) and regions of interest (ROIs) were drawn around the visualized tumors. These ROIs were then copied to the coregistered PET images. Since some tumors showed inhomogeneous activity on PET, presumably due to a necrotic core that showed no or minimal activity on the PET scans, the MRI-based tumor ROIs were modified by using a threshold-based delineation of the tumor part that showed at least 50% of the average activity on the AMT PET images. This procedure ensured that AMT uptake in tumor tissue was not underestimated due to inclusion of necrotic regions. The AMT uptake in the tumor region was characterized in two different ways:
Standard uptake values (SUVs): The SUV calculation relates tracer concentration in tissue to the dose injected and the subject's mass (Woodard et al, 1975; Kenney et al, 1941) (SUV = tissue concentration in ROI (mCi/cm3)/injected dose per weight (mCi/kg)). Since all subjects received the same injected dose based on weight, the SUV images were directly obtained by averaging the last four frames of the dynamic brain image, during which time there is the most metabolic product. Tumor SUV values were calculated and normalized to SUV values obtained from contralateral homotopic normal cortex, thus accounting for global changes of tryptophan metabolism and individual differences.
Patlak analysis: To quantify unidirectional AMT uptake and metabolism in tumors, a Patlak graphical analysis was performed using the arterial input function (obtained from the LV) and the dynamic brain sequence (7 × 5 mins frames starting 25 mins after injection). Tumor ROIs were copied to the dynamic image sequence and regional tissue time–activity curves were generated. The Patlak graphical analysis was based on the following equation (Gjedde, 1981; Patlak et al, 1983)
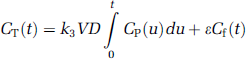
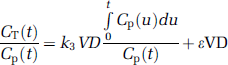
with CT(t) representing tissue concentration derived from PET imaging, Cp(t) representing the plasma tracer concentration, and Cf(t) representing the tracer concentration in the free precursor pool. Furthermore, the rate constant k3 characterizes the enzymatic conversion of AMT, and VD (= k1/(k2 + k3)) represents the volume of distribution of the tracer in the free precursor pool (Figure 1). Finally, the factor ɛ (= k2/(k2 + k3)) takes into account the time lag of the free precursor pool relative to the changing plasma tracer concentration. On reaching dynamic equilibrium (dCf/dt = 0; Cf(t) = VD Cp(t)), equation (1) reduces to
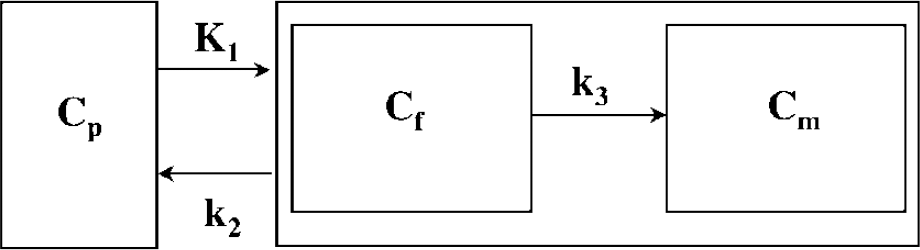
Three-compartmental model for AMT kinetics in brain, using first-order rate constants (Diksic et al, 1991). The inflow rate constant k1 and the outflow rate constant k2 describe the exchange of AMT between vascular space (Cp) and the cell cytoplasm (Cf). The volume of distribution (VD') is derived from the ratio k1/(k2 + k3). Breakdown of the blood–brain barrier will result in an increase in k1 and VD'. Irreversible enzymatic conversion of AMT to its metabolite(s) is characterized by the metabolic rate constant k3.
The slope parameter (k3 VD) corresponds to the previously described K-complex (Muzik et al, 1997; Chugani et al, 1998c) reflecting the unidirectional uptake of tracer into tissue. In the case of AMT, the value of the K-complex is thought to be proportional to the tryptophan metabolism via the serotonin and/or the kynurenine pathway when the blood–brain barrier is intact. However, breakdown of the blood–brain barrier in some brain tumors may influence the K-complex due to increased tracer availability. To distinguish transport of tryptophan from tryptophan metabolism, the intercept of the Patlak plot, which we termed VD' (= ɛ VD), and the ratio between slope and intercept, termed k'3 (= k3/ɛ), were assessed. We made the assumption that the effect of ɛ on VD' and k'3 is small, based on our previous work showing that the unidirectional outflow rate constant k2 is at least twice as large as k3 in brain tissue (Muzik et al, 1997). Thus, ɛ is a relatively stable parameter approximately equal to 0.7, and VD' and K'3 represent reasonable estimates of VD and k3. The VD' value is increased when the blood–brain barrier is compromised, and the value of k'3 characterizes the metabolism of tryptophan. This assumption was tested by comparing k'3 values in tumors showing impaired blood–brain barrier as evidenced by gadolinium enhancement with those with no enhancement.
Histology of the Resected Tumor Tissues
All fresh tumor specimens were processed according to standard surgical pathology protocols in the pathology department. In summary, specimens were fixed in 10% formalin solution, processed and embedded in paraffin, and sectioned at 5-μm-thick sections. Tumors were initially evaluated using hematoxylin and eosin staining supplemented by immunohistochemical staining for antibodies including glial fibrillary acidic protein (Dako), Ki-67 (Ventana), and synaptophysin (BioGenex), in selected cases. Additional staining in selected cases included cresyl violet, Luxol fast blue counterstained with periodic acid-Schiff, and Bielschowsky silver stains. Diagnostic criteria and nomenclature were applied according to the World Health Organization Classification of Tumors, based on the findings of the Consensus Conference in Lyon, France, 1999 (Kleihues and Cavenee, 2000) and on published histological criteria (Burger and Scheithauer, 1994; Burger et al, 2002) by one neuropathologist (WJK).
Study Design
First, MRI and FDG PET images were visually evaluated to decide whether tumors show gadolinium enhancement and altered glucose metabolism in the tumor region. Standard uptake value was measured on AMT PET in each tumor. Then Patlak graphical analysis was performed in 23 patients (where blood input data were available) and the VD' and k'3 parameters were compared between patients with and without contrast enhancement on MRI, to assess whether these measures were influenced by changes in the impaired blood–brain barrier. Furthermore, to assess whether k'3 values determined in tumor tissue were abnormally increased or decreased, a tumor to cortex ratio for k'3 was calculated. The cortical region was defined in the contralateral hemisphere homologous to the tumor region. The VD', k'3 and the tumor/cortex k'3 ratio were compared among four different tumor types: (1) oligodendrogliomas, (2) astrocytomas, (3) mixed oligoastrocytomas, and (4) dysembrioplastic neuroepithelial tumors (DNETs). To diminish the confounding effect of tumor grade, high-grade (grade III to IV) tumors were not included in this analysis. Furthermore, VD' and k'3 parameters were correlated with tumor grade; in this analysis, only 12 tumors with astrocytic components (astrocytomas grade II to IV and mixed oligoastrocytomas) were included to reduce the confounding effect of tumor type.
Statistical Analysis
The SUV, VD', and k'3 parameters in tumors showing gadolinium enhancement and those with no gadolinium enhancement were compared using an unpaired t-test. Differences in VD' and k'3 parameters observed in different tumor types were evaluated using a one-way ANOVA. Correlations between tumor grade and AMT uptake were calculated using the Spearman's rank correlation test. A P-value <0.05 was considered to be significant.
Results
Gadolinium Enhancement, Glucose Metabolism and α-[11C]Methyl-l-Tryptophan Uptake in Brain Tumors
On MRI, 21/40 tumors showed gadolinium enhancement. On FDG PET (performed in 35 patients), 8 tumors showed increased uptake, 26 showed decreased FDG uptake, while one tumor (a DNET, patient #31) could not be visualized (Table 1). On AMT PET scans, 38/40 tumors (including all grade II to IV gliomas and all glioneuronal tumors) showed higher SUV than normal contralateral cortex (mean: 51% ± 43% increase) (Figure 2). The only grade I astrocytoma (patient #16) showed AMT SUV similar to normal cortex, while the only hamartoma (#40) showed decreased AMT SUV All 16 residual/recurrent tumors showed increased AMT SUV (Figure 3). Tumors with gadolinium enhancement showed higher SUVs for AMT than those with no enhancement (1.69 ± 0.54 versus 1.32 ± 0.18; P = 0.01).
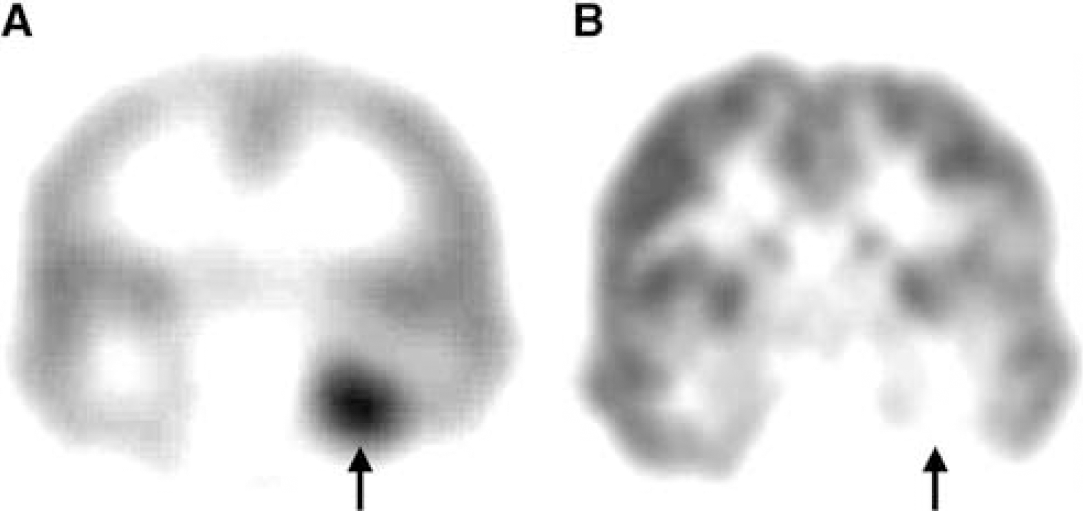
Interictal PET scans showing increased AMT (
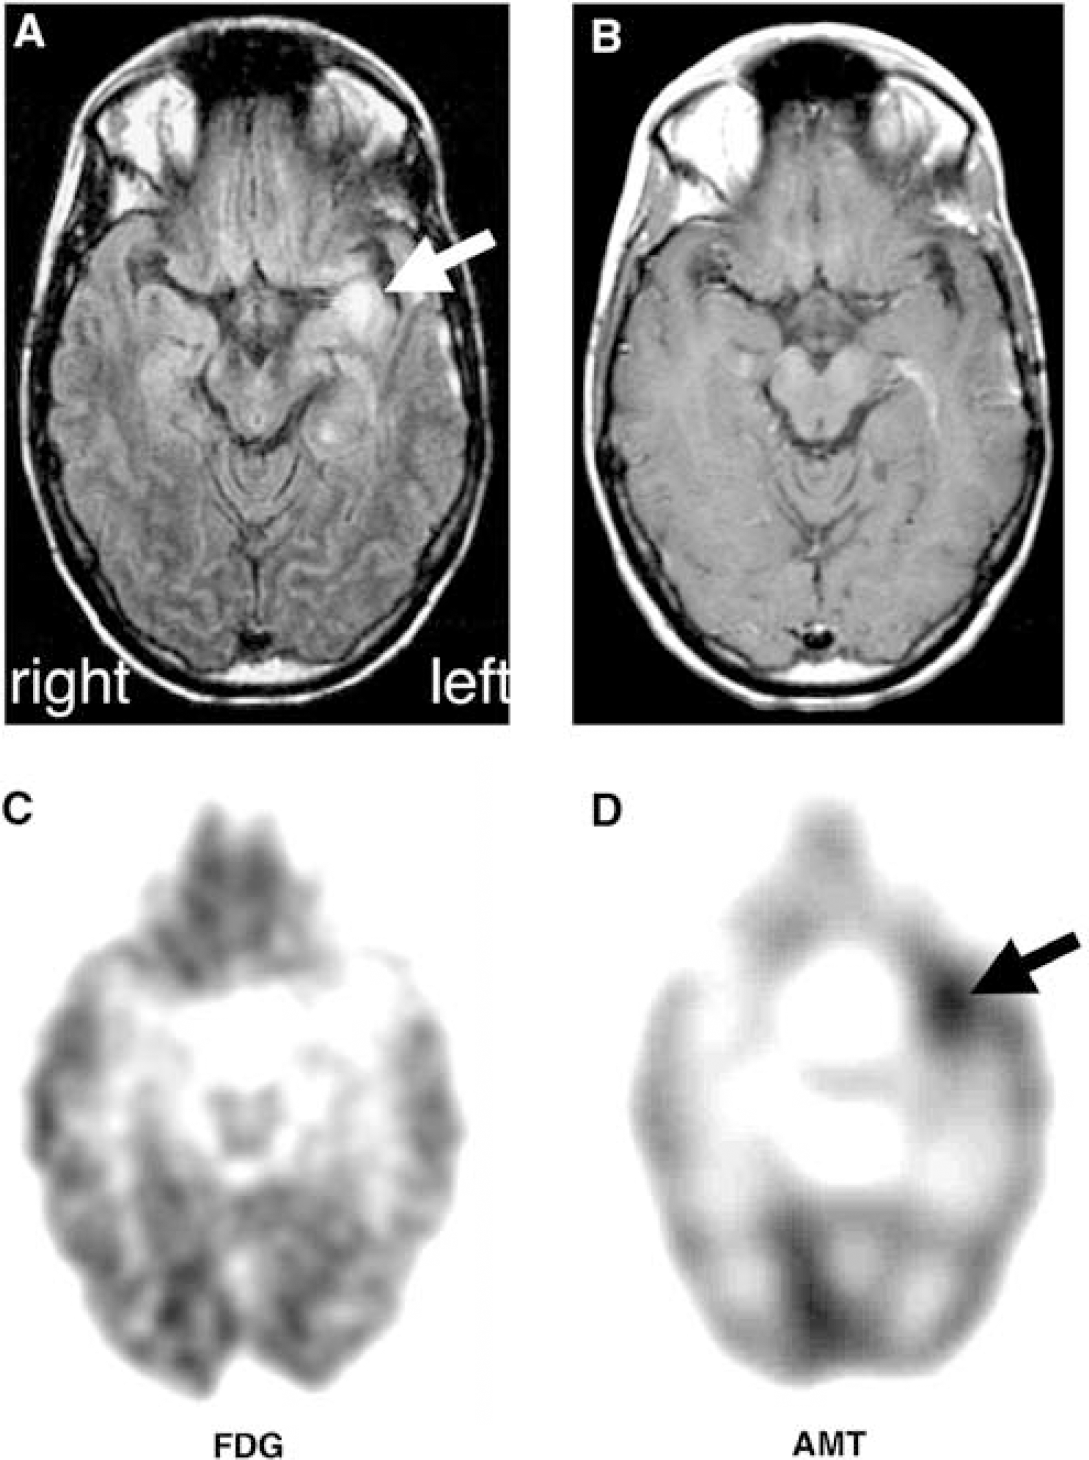
Detection of a recurrent left temporal glioma by AMT PET. The patient (#23) had a previous resection of a grade II astrocytoma, but her seizures recurred and became intractable. (
Patlak Analysis: Effect of Gadolinium Enhancement, Tumor Type, Tumor Grade and Seizures
Gadolinium Enhancement: Tumor VD' and k'3 values for 23 tumors are shown in Table 2. VD' values were significantly higher in gadolinium-enhancing tumors as compared with those with no contrast enhancement on MRI (0.62 ± 0.23 versus 0.39 ± 0.09, respectively; P = 0.008), while tumor k'3 values were not different between these two groups (0.018 ± 0.004 mins−1 versus 0.019 ± 0.005 mins−1; P = 0.71). These findings indicated that high VD' values reflected impairment of the blood–brain barrier, while k'3 values appeared to be independent of tracer leakage at the blood–brain barrier and are therefore a better measure of tryptophan metabolism.
Volume of distribution (VD') and metabolic rate constant (k'3 (mins−1)) values for AMT in 23 tumors
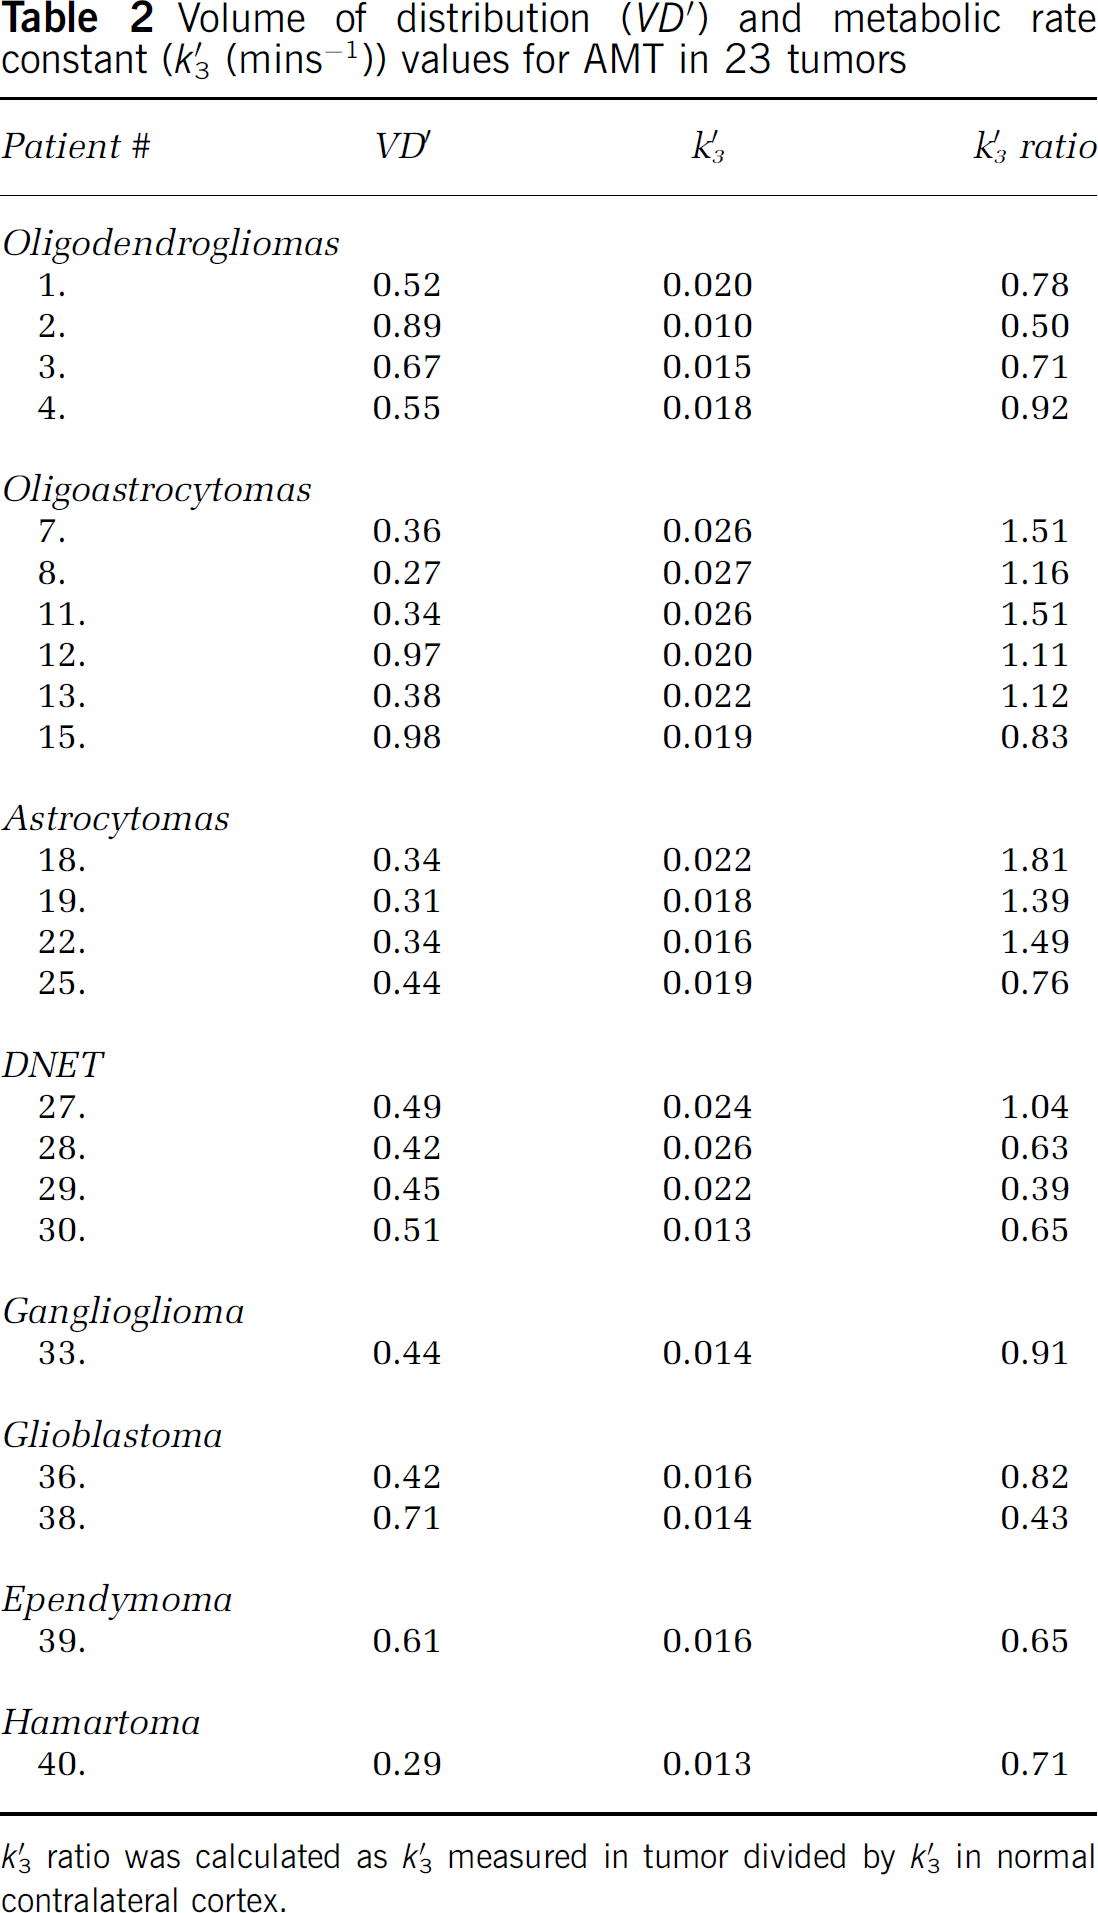
k'3 ratio was calculated as k'3 measured in tumor divided by k'3 in normal contralateral cortex.
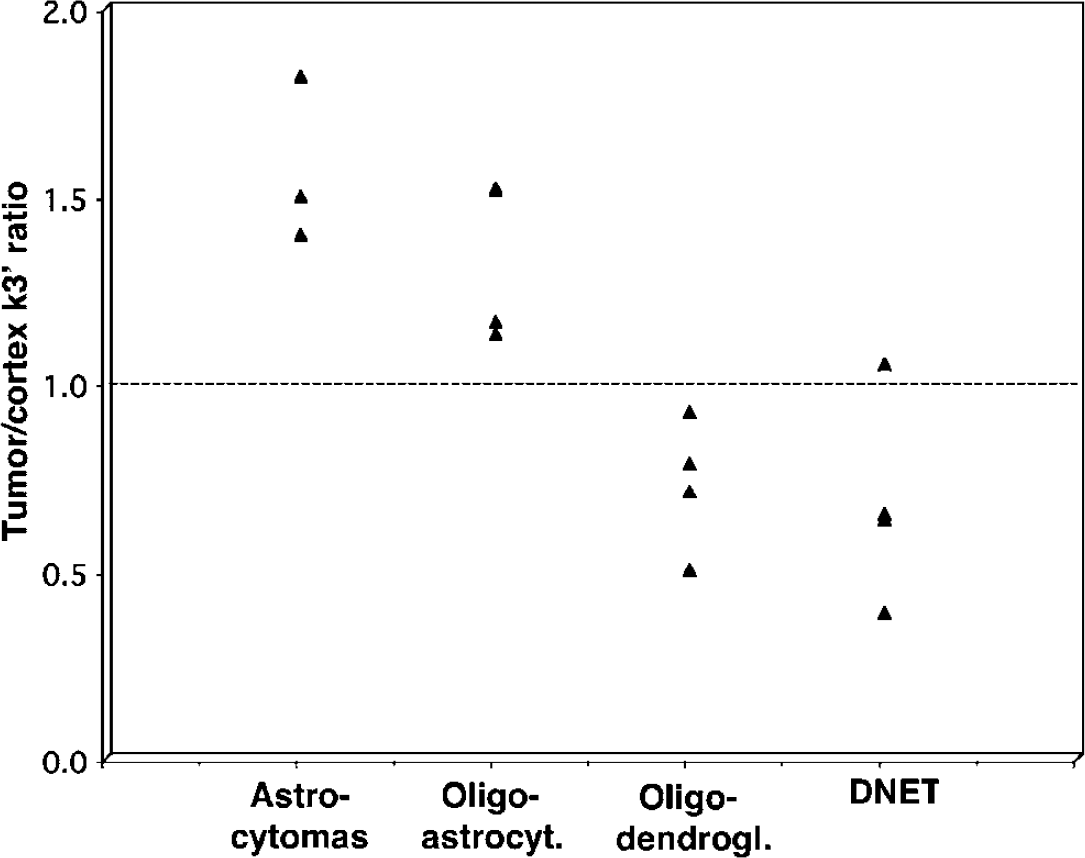
Tumor Type: The values for k'3 were higher in tumors than in the normal cortex in low-grade gliomas with astrocytic components (astrocytomas and oligoastrocytomas; n = 7; mean tumor/cortex k'3 ratio for astrocytomas: 1.57 ± 0.22; for oligoastrocytomas: 1.29 ± 0.15), but lower than the normal cortical values in oligodendrogliomas (n = 4; mean: 0.73 ± 0.17) (Figures 4 and 5). Dysembrioplastic neuroepithelial tumors had also low tumor/cortex k'3 ratios (mean 0.68 ± 0.27) (P<0.001), but this was partly because all four patients with DNET were children whose cortical k'3 values were significantly higher (mean 0.035 ± 0.017 mins−1) than cortical values of the other 3 tumor groups, which did not differ from each other. Thus, a developmental difference in cortical tryptophan metabolism (Chugani et al, 1999) confounds the tumor/cortex ratio method of assessment. When absolute k'3 values were compared among tumor types, mixed oligoastrocytomas showed the highest values (0.025 ± 0.002 mins−1), which were significantly higher than those of oligodendrogliomas (0.016 ± 0.004 mins−1). Astrocytomas and DNETs showed intermediate absolute k'3 values (mean 0.019 ± 0.003 and 0.021 ± 0.006 mins−1, respectively). Tumor VD' values were higher in oligodendrogliomas (0.66 ± 0.16) than in any of the other three tumor types (astrocytomas: 0.33 ± 0.05; oligoastrocytomas: 0.33 ± 0.02, DNETs: 0.47 ± 0.04; P = 0.002; mean VD' in the normal contralateral cortex was 0.32 ± 0.13).
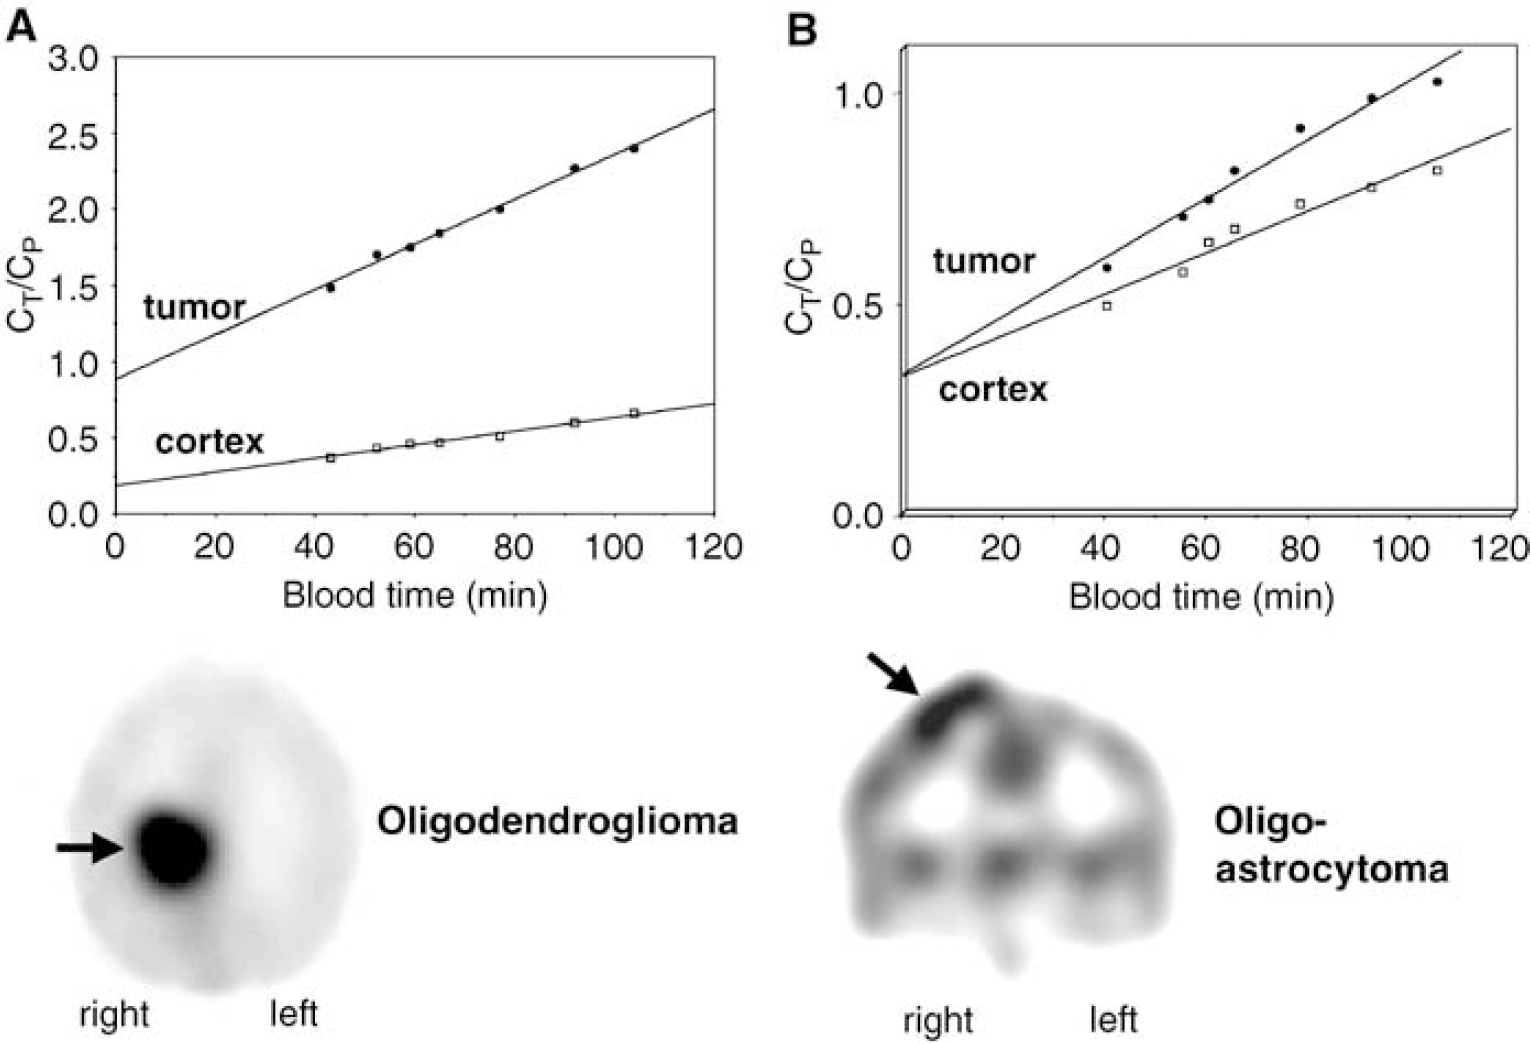
Patlak plots obtained from two tumors with high AMT uptake versus normal contralateral cortex. The x-axis represents transformed time (‘bloodtime’) in units of minutes. CP is the tracer concentration in the blood, and CT is the tracer concentration in tissue. Both tumors showed a steeper slope of the time–activity curve as compared with normal cortex, indicating increased unidirectional uptake of AMT in tumor tissue (see summed activity images on the bottom). However, in the oligodendroglioma (
α-[11C]methyl-
Tumor Grade: The k'3 values in the 12 gliomas with astrocytic component showed a significant inverse correlation with tumor grades (Spearman's rho = −0.59, P = 0.043). (Figure 6), that is, low-grade tumors had higher k'3 values as compared with high-grade tumors. An even stronger inverse correlation was found when tumor/cortex k'3 ratios were correlated to tumor grade (Spearman's rho = −0.85, P<0.001). In contrast, tumor VD' values showed a positive correlation with tumor grade in this group (Spearman's rho = 0.68, P = 0.010).
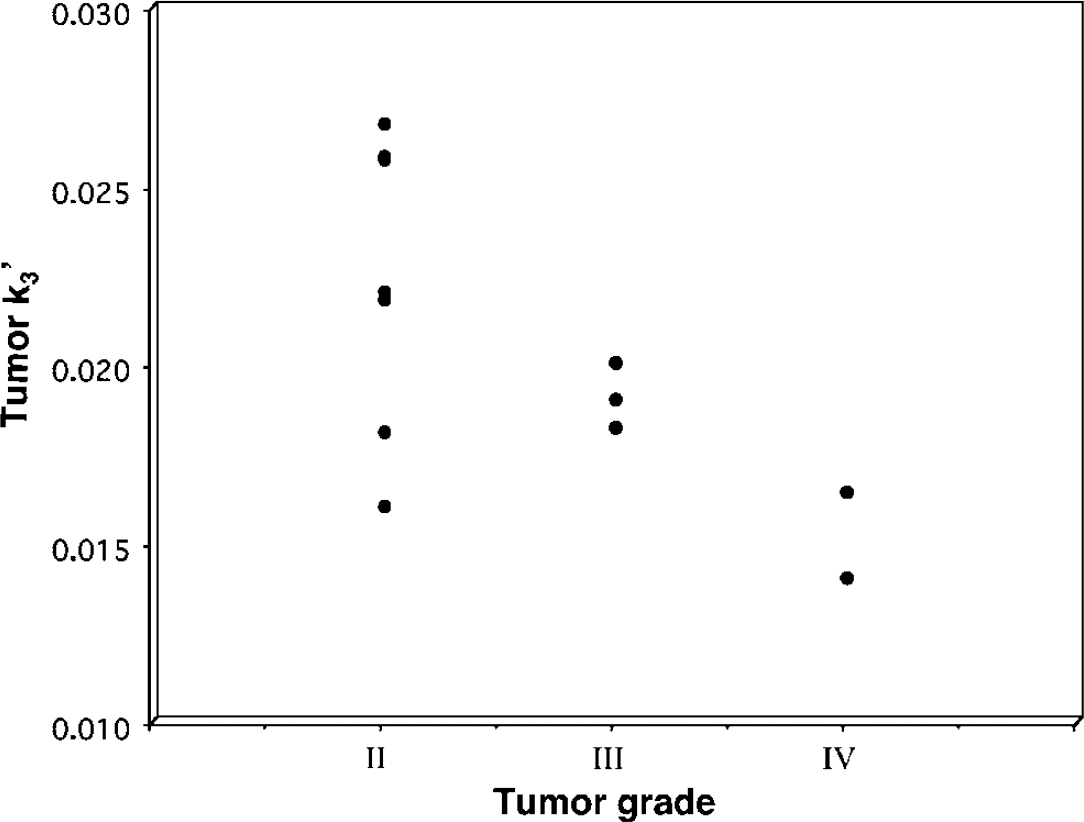
Relationship between tumor grade and the metabolic rate constant k'3. Only tumors with astrocytic components were included in this analysis. Tumor grade showed a significant inverse correlation with k'3 values (Spearman's rho–0.59, P = 0.043).
Electroencephalograph and Effect of Seizures: Electroencephalographs performed during the AMT PET showed no epileptiform activity in 12 patients (including 11 with increased tumor AMT uptake) and showed rare or occasional spikes or spike-and-wave complexes in 5 cases. There was no correlation between the time between the last clinical seizure before AMT PET and any of the quantitative AMT uptake parameters (P>0.35 in all comparisons).
Discussion
This study showed high AMT uptake in primary and recurrent gliomas and glioneuronal tumors, including low-grade tumors. Although the majority of these tumors were associated with seizures, tumors in patients with no history of seizures also showed a marked increase of AMT uptake. Also, accumulation of AMT occurred in many patients who did not show epileptiform activity during the uptake period. Thus, increased AMT uptake does not appear to be the consequence of tumor-induced seizures or interictal epileptiform activity during the tracer uptake. α-[11C]methyl-
Quantification of AMT uptake and metabolism in our study has revealed different mechanisms of increased AMT uptake in different tumor types and grades. Increased AMT uptake in astrocytic gliomas was mostly due to high metabolic rates, likely indicating increased enzymatic conversion of tryptophan. High AMT uptake due to high volume of distribution, prominent in oligodendrogliomas, might be attributed to a variety of mechanisms, including disrupted blood–brain barrier, increased tumor vascularization, increased amino-acid transport, or a combination of these. Inverse correlation between tryptophan metabolism and tumor grade in astrocytic tumors suggests that altered tryptophan metabolism might be related to the biological behavior (such as proliferation rate) of these tumors.
Increased Tryptophan Metabolism in Low-Grade Astrocytic Gliomas
Grade II astrocytic gliomas (including pure astrocytomas and mixed oligoastrocytomas) consistently showed AMT metabolic rates above the normal cortical levels. Increased tryptophan metabolism could reflect increased synthesis of serotonin; however, in tumors it is more likely that increased metabolism of AMT reflects increased IDO activity and resulting increase of metabolism of tryptophan via the kynurenine pathway. The substrate specificity of IDO is low (Shimizu et al, 1978), since this enzyme cleaves the indole ring in various indole derivatives. Since the indole ring remains intact after methylation of the tryptophan molecule in the α position, induction of IDO activity is expected to increase enzymatic conversion of not only tryptophan but also AMT. Stimulation of IDO activity can be attained using interferon gamma (and, to a lesser degree, other interferons) that substantially increases
Increased α-[11C]Methyl-l-Tryptophan Uptake in Oligodendrogliomas and Glioneuronal Tumors
Although oligodendrogliomas showed a high accumulation of AMT on PET, Patlak analysis showed that this was partially due to a high tracer volume of distribution. High tumor VD' values may reflect a leakage of AMT into the tumor tissue due to breakdown of the blood–brain barrier, or might be attributed to high microvessel density. High VD' values in gadolinium-enhancing tumors could occur via both mechanisms. Gadolinium enhancement can occur in areas of blood–brain barrier breakdown (Graif and Steiner, 1986; Whelan et al, 1987), and varying degrees of gadolinium enhancement on conventional brain tumor MR images are likely due to increased microvascular permeability (Tzika et al, 2002). Contrast enhancement can be also due to microvessel proliferation associated with angiogenesis in the tumor tissue (Vaquero et al, 2002). Indeed, increased vascularization is a common feature in human glial tumors, including both oligodendrogliomas and astrocytomas; vessel density was reported to correlate with tumor grade rather than tumor type (Assimakopoulou et al, 1997). A recent PET study using methyl-[11C]L-methionine showed that tracer uptake in gliomas closely correlated with tumor microvessel density (Kracht et al, 2003), providing further evidence that increased amino-acid uptake may reflect increased angiogenesis in these tumors.
Breakdown of blood–brain barrier function in oligodendrogliomas may, at least partly, explain their chemosensitivity. Interestingly, not only anaplastic but also low-grade oligodendroglial tumors may respond to chemotherapy (Hoang-Xuan et al, 2004), possibly due to easy accessibility of drugs to the tumor mass. A recent case study showed that, even within an inhomogeneous tumor mass, oligodendroglioma regions with low apparent diffusion coefficient and higher relative cerebral blood volume showed a marked response to chemotherapy, while other parts of the lesion showed little change (Jager et al, 2005). Thus, high VD' values in oligodendrogliomas may indicate that chemotherapeutic agents are more likely to readily diffuse into the tumor mass.
Since high VD' values occurred even in tumors with no contrast enhancement, it is also possible that an increase in specific transport of tryptophan into the tumor cells contributed to high AMT uptake. In normal brain tissue, transport across the blood–brain barrier is the rate-limiting step for amino-acid movement from the blood to cerebral intracellular spaces (Pardridge, 1984; Boado et al, 1999). Malignant cells are generally believed to have an increased rate of amino-acid transport, presumably due to increased demand for protein synthesis (Isselbacher, 1972; Jager et al, 2001). Alternatively, increased transport of tryptophan to the tumor cell when IDO activity is enhanced may actually diminish the immune response to the tumor, as suggested by studies in human breast cancer cells (Travers et al, 2004).
Increased AMT uptake in DNETs (and also gangliogliomas in which AMT metabolism was not quantified by Patlak analysis) was a somewhat surprising finding, considering that other PET tracers typically are not accumulated in these tumors. Similar to oligodendrogliomas, DNETs showed k'3 values below the cortical levels, but VD' was not as high as in oligodendrogliomas. However, mean cortical values were higher in the patients with DNETs than in other tumor types due to the young age of this group and developmental changes in cortical serotonin synthesis (Chugani et al, 1999). Although the number of subjects with DNET was limited, our data suggest that AMT PET is unlikely to be able to reliably differentiate between gliomas and DNETS. However, increased AMT uptake could be a sensitive indicator of a residual tumor after surgical resection.
When MRI does not show gadolinium enhancement, recurrent or residual low-grade gliomas might not be readily visualized, even by using PET with FDG or other radiolabeled amino acids. Among these latter, 11C-methionine PET can be helpful in detecting residual or recurrent brain gliomas (Derlon et al, 1997; Herholz et al, 1998; Ribom et al, 2001), but it is not able to visualize DNETs (Maehara et al, 2004) which are among the most common epileptogenic tumors (Pasquier et al, 2002). In contrast, AMT PET appears to be an excellent imaging method to delineate residual glioneuronal tumors after surgery.
A possible confound to the interpretation of AMT PET findings in recurrent tumors could be local inflammation after a surgical procedure or radiotherapy. In fact, in our previous AMT PET study of patients after resective epilepsy surgery, we have observed diffuse increases of AMT uptake around the resection margins, but only when cortical resection was performed less than 2 months before the AMT PET scanning (Juhász et al, 2004). Patients whose epilepsy surgery was performed more than 2 months before the AMT PET scan did not show this pattern of increases of AMT uptake, although focal increases in the nonresected epileptic cortex occurred in several cases. In the present study, the AMT PET scans were all performed more than 3 months after tumor resection or radiotherapy. If the tumor tissue would have been completely resected, no major inflammatory reactions triggered by residual tumor tissue or due to acute postsurgical inflammation would be expected several months after surgery. However, reactive gliosis might be present for a variable period of time. In this case, the accompanying inflammatory reactions and microglia activation may affect tryptophan metabolism due to altered activity of IDO. In our previous epilepsy surgery population, no signs of prolonged, focal increases of AMT uptake were seen (except in nonresected epileptic cortex), thus making a prolonged astrogliotic process unlikely to be a major confounding factor for detecting residual tumors by AMT PET. Nevertheless, the specificity of AMT PET to detect residual tumor tissue in the posttreatment period needs to be further investigated.
Another limitation of the interpretation of our results is that our methods were not able to completely account for potential heterogeneity within the tumor mass. Although we did not include presumably necrotic tumor parts in the analysis, biological heterogeneity in the living tumor tissue is common. The measured PET variables provided an estimate of the average AMT uptake and metabolism of the entire tumor tissue, and this was correlated with tumor type and grade, which characterized the bulk of the resected tumor mass. The limited PET image resolution and problems with matching resected tumor portions with their original locations on the images precluded a more detailed analysis.
Further Clinical Implications
Increased tryptophan metabolism in low-grade gliomas may have implications for tumor-associated epilepsy. Despite the known association between brain tumors and seizures, the pathophysiological mechanisms contributing to epileptogenesis in patients with brain tumors remain poorly understood (Beaumont and Whittle, 2000). One of the unexplained aspects of tumor-associated epilepsy is the fact that low-grade tumors are generally more epileptogenic than malignant ones. Indeed, epileptogenic tumors show distinct pathologic features and, therefore, some authors consider low-grade gliomas associated with chronic epilepsy as a distinct pathologic entity (Bartolomei et al, 1997). If high k'3 values in low-grade gliomas indicate increased conversion of tryptophan via the kynurenine pathway, an increased level of convulsant metabolites, such as
Although increased AMT uptake can occur in nontumorous epileptogenic lesions, such as malformations of cortical development, the general magnitude of increase appears to be much higher in brain tumors: the mean increase of AMT uptake was only 13% ± 6% in our previous series of children with intractable epilepsy not related to tumors (Juhász et al, 2003). In contrast, the mean increase in brain tumors in the present study was almost fourfold higher, with more than
Footnotes
Acknowledgements
The authors thank Drs Clifford Patlak (Stony Brook, NY), Albert Gjedde (Aarhus, Denmark), and Robert Koeppe (AnnArbor, MI) for advice regarding the interpretation of model parameters. They also express their gratitude to Galina Rabkin, CNMT, Teresa Jones, CNMT, and Mei-li Lee, MS, Anna Deboard, RN, and Kris Baird, BS, for their expert technical assistance in performing the PET studies.