
Abstract
In this Post mortem study, we examined haem-rich deposits (HRDs) in patients with and without dementia, using a histochemical label (Prussian blue) to show haem, autofluorescence to detect red blood cells (RBCs), and immunohistochemistry for clotting-related factors and collagen IV. The patients studied had no clinical or Post mortem evidence of macrovascular stroke. To allow examination of the spatial relationships between HRDs and the microvasculature, we cut 45-µm sections. Haem-rich deposits were small (< 200 µm diameter). They were rare in younger (< 50 years) patients but were more common in older (> 70 years) patients, particularly in cerebral cortex, and were most abundant in cases with senile plaques. Wherever HRDs appeared they were perivascular and appeared to form around capillaries or small arterioles. Using a software package (Proxan) developed to outline vessels and HRDs, and to analyse the distances between them, a tight spatial correlation between HRDs and capillaries was shown. In addition, HRDs were rich in von Willebrand factor (vWF), fibrinogen, collagen IV and RBCs. These observations suggest that HRDs are the residua of capillary bleeds (microhaemorrhages), and that microhaemorrhages are a common feature of the aging cerebral cortex, particularly where plaque pathology is present.
Keywords
Introduction
In the normal brain, iron is most abundant in ferritin within oligodendrocytes and microglia and is also present in neurons, particularly in the substantia nigra and globus pallidus (Connor et al, 1992b; Morris et al, 1992). The iron content of the brain increases with age, and iron has been shown to accumulate in senile plaques and neurofibrillary tangles (Connor et al, 1992a; Goodman 1953; Lovell et al, 1998) using histological methods (Prussian blue) (Connor et al, 1992a; LeVine 1997; Morris et al, 1994), immunohistochemistry for iron-sequestering proteins such as ferritin and transferrin (Connor et al, 1990, 1992b) and micro-particle-induced X-ray emission (Lovell et al, 1998). This presence of iron in Alzheimer's disease (AD) lesions has been attributed to a dysregulation of metal metabolism; however, a simpler explanation may account for elevated iron, as it is also prominent at the site of intracerebral haemorrhage. Extravasated haemoglobin is digested by macrophages, including microglia, and the haem sequestered into the highly stable protein haemosiderin (Koeppen, 1995; Wagner et al, 2003). As it forms and remains at the site of a bleed and is detectable within ~6 to 10 days (Wagner et al, 2003), haemosiderin has long been used as a marker at autopsy of intracerebral bleeding.
Pathology of large, macroscopically visible vessels is common in AD (seen in perhaps more than 90% of cases (Jellinger, 2002; Kalaria, 2003)) and frequent in the aged without obvious symptoms (Tsushima et al, 2002). However, these earlier observations generally concerned larger, macroscopically visible blood vessels. Capillary abnormalities are also present in AD and the non-demented aged (Buee et al, 1994; Kalaria and Hedera, 1995). Here we show haem-rich deposits (HRDs) and blood vessels in the cerebral cortex of the human brain to test a working hypothesis that HRDs arise from localized cerebral microvascular bleeding. In the present material, HRDs closely surround capillaries, are rich in proteins derived from blood or endothelium (von Willebrand factor (vWF), fibrinogen, collagen IV), and are commonly associated with red blood cells (RBCs) scattered in brain parenchyma. These findings suggest that HRDs might be the residua of microhaemorrhages that have occurred successively, over a long period, before death. We have studied patients in a range of ages, some with and some without dementia. This was done, not to compare disease or age groups, but to test whether HRDs are related to blood vessels over a range of lesion densities.
Materials and methods
Material Studied
Post mortem tissue was obtained through the NHMRC Brain Bank for Mental Health Research. The study was approved by the University of Sydney Human Ethics Committee. Brains were fixed at autopsy (post mortem delay 3 to 57 h) in 15% formalin and stored in 10% formalin after initial diagnosis for up to 7 years. The cases selected for study include 11 with a clinical history of dementia and a post mortem confirmed diagnosis of AD, two with Down's syndrome (DS) and AD and 10 with no clinical history of neurological disorder (Table 1). The cases studied were selected to exclude a clinical history or post mortem evidence of large-vessel stroke.
Case details and maximum P-values for HRD/blood vessel association
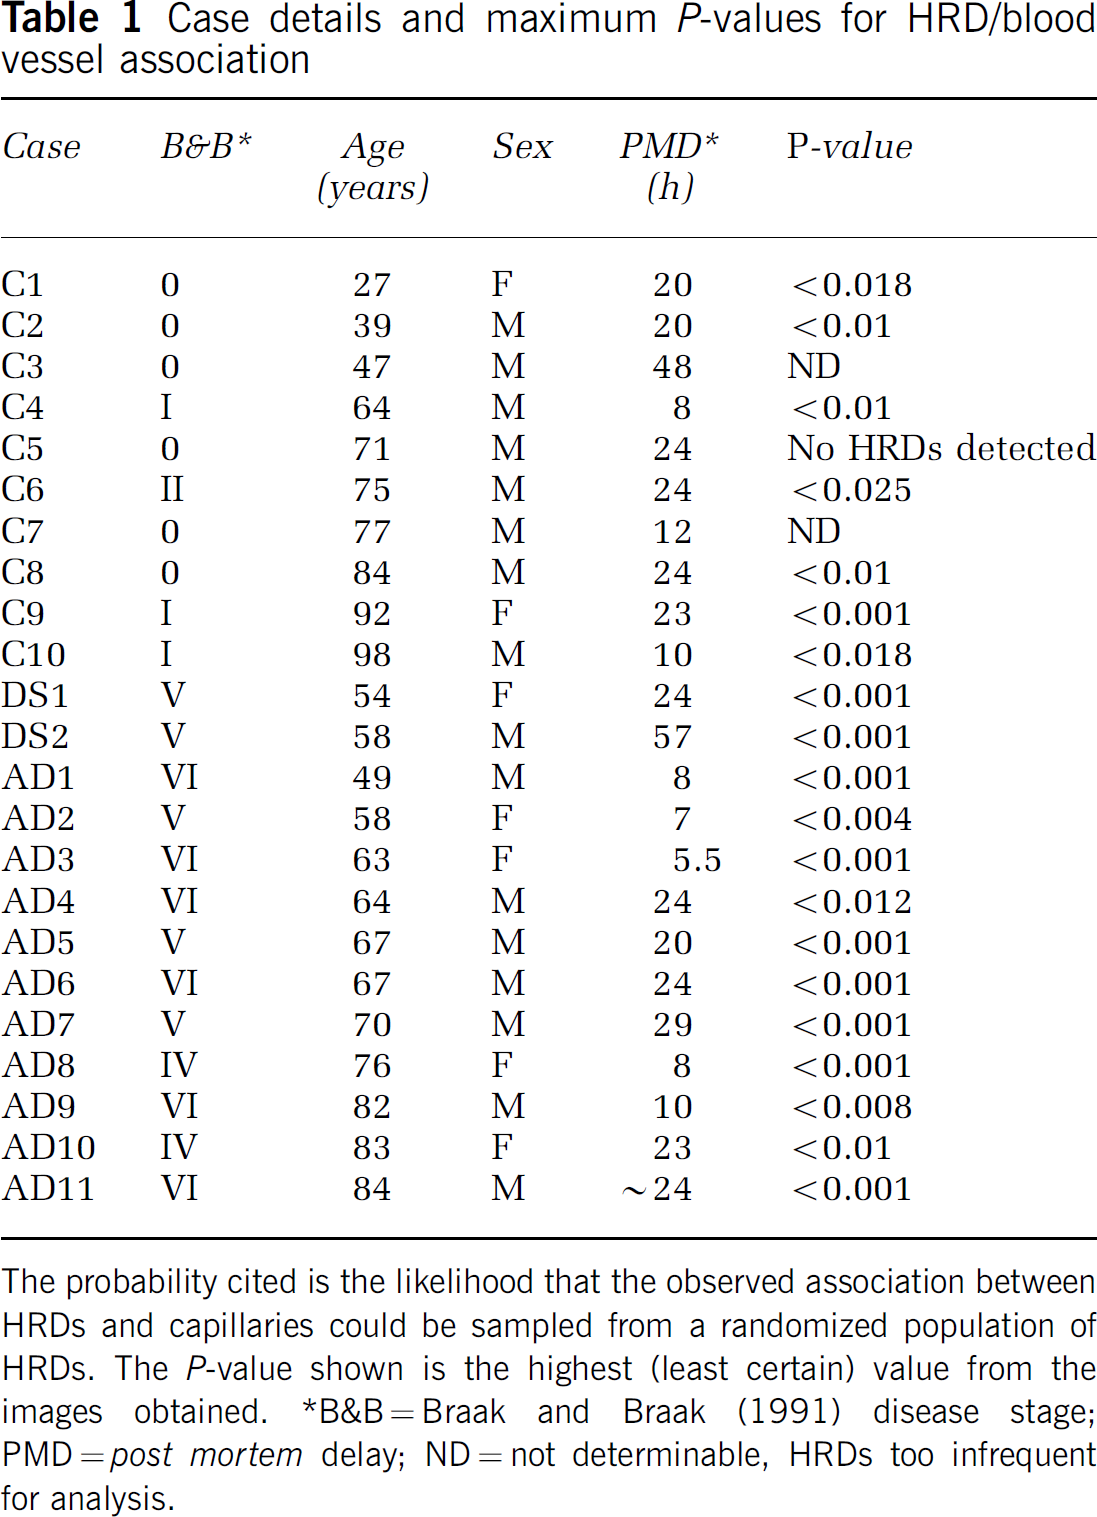
The probability cited is the likelihood that the observed association between HRDs and capillaries could be sampled from a randomized population of HRDs. The P-value shown is the highest (least certain) value from the images obtained. *B&B = Braak and Braak (1991) disease stage; PMD = post mortem delay; ND = not determinable, HRDs too infrequent for analysis.
All AD cases were diagnosed on the basis of ante mortem evidence of dementia and absence of significant motor disturbance. All were diagnosed post mortem by the presence of abundant senile plaques and tangles using Bielschowsky silver staining, and tau and β-amyloid immunohistochemistry. Neuropathology in both demented and nondemented cases was ranked (Braak and Braak, 1991) for AD lesion burden and location. Alzheimer's disease cases were not included if there was evidence of concomitant pathology, including infarcts, Lewy bodies, substantia nigra pallor or Pick's disease. The nondemented control cases showed no evidence of neurological disease and were free from neuropathology except for few plaques and tangles equivalent to Braak and Braak stages I and II in four cases.
Tissue Preparation
Blocks of tissue were taken from 3 to 5 mm coronal slices of the medial temporal lobe (including amygdala) at the level of the lateral geniculate, anterior cingulate and superior frontal cortices at the level of the anterior commissure. Blocks were sectioned at 45 µm on a CO2 Leica microtome and cut in a 1-in-3 series (i.e., every third section collected in a single pot) into 0.1 mol/L Tris buffer (pH 7.4).
The Prussian Blue Reaction
For each case and brain area, series 1 was mounted on 2% gelatinized glass slides. Ferric ion (Fe+ 3) was detected by Prussian blue (potassium ferrocyanide) histochemistry without DAB enhancement. In acid solutions of ferrocya-nides, ferric ion (Fe+ 3) in the tissue combines with ferrocyanide, resulting in the formation of a bright blue ferric ferrocyanide pigment. Before staining, incubation jars were soaked in 1% nitric acid and rinsed 3 × 1 h in double-distilled water. Mounted sections were incubated in 3% potassium ferrocyanide in 3% HCl at 37°C for 72 h. Glass-staining chambers, plastic slide holders and plastic forceps were used throughout to prevent extraneous iron deposits in the solutions (no tissue staining occurred, but solutions became blue and staining time was extended). All stained sections were serially dehydrated in 70%, 95%, 3 × 100% ethanol for 5 mins each, 2 × Histoclear (Astral Scientific) for 5 mins, then coverslipped with Histomount (Astral Scientific) permanent mounting medium. Selected sections were counterstained with cresyl violet (0.5%, pH 5.3) before dehydration. Slides were examined with brightfield (Leica DMLB) and fluorescent (Zeiss Axioplan) microscopy and photographed using a Progres C14 Jenoptik digital camera.
For positive controls we included sections from a brain containing a recent infarct. In these sections, Prussian blue labelling of the infarct site was strong and specific. For negative controls, sections from an AD brain were incubated in 5% oxalic acid for 12 h before incubation in potassium ferrocyanide solution. In these sections, no detectable staining occurred at 48 h incubation in ferrocyanide.
The incubation period of 72 h in potassium ferrocyanide is much longer than that used in many prior studies, particularly experimental studies in animals, in which incubations of 12 to 30 mins were used. In archival human tissue, fixation times can be very long, and tissue may contain haemorrhages occurring several years before fixation. Both factors attenuate Prussian blue staining of haem (Morris et al, 1992), making the extended incubation essential.
Immunhistochemistry for Factor VIII, Collagen IV and Fibrinogen
Series 2 was processed free-floating for collagen IV (1:500; Sigma C1926) immunohistochemistry, vWF (1:1000; Sigma B1275 Vector Laboratory) or fibrinogen (1: 300, DAKO 0080), and mounted on 2% gelatinized glass slides (Cullen, 1997). For collagen IV immunohistochemistry, tissue sections were pretreated in 0.4% pepsin in 0.1 N HCl for 20 min to expose antigenic sites. Sections were washed 3 × 15 min in 50% ethanol, endogenous peroxidase activity quenched in 3% H2O2 in ethanol and nonspecific binding blocked with 1% BSA in 0.1 mol/L Tris containing 0.1% Triton-X. Primary antibody incubations were performed at 4°C for 48 h. The bound antibody was visualized using biotinylated anti-mouse or anti-rabbit antibodies and avidin–biotin peroxidase (ABCelite-Vector Laboratory) using DAB or VIP (Vector Laboratories) as chromogens.
Auto-Fluorescence of Red Blood Cells
Fixation with aldehydes results in high levels of auto-fluorescence in erythrocytes due to unreacted aldehyde groups and intracellular haemoglobin (Baschong et al, 2001).
Analysis of Vessel–Haem Relationship
Sampling: To select areas for analysis of vessel–haem association, strips (approximately 1 mm wide and orthogonal to the pial surface) were drawn onto the coverslips using a marking pen. Cortical strips were selected by counting every fourth strip from an arbitrary start. The cortical strips were digitally photographed (several fields per strip depending on cortical width) at × 200 magnification. For each cortical area, 10 fields, each 0.7 × 0.7 mm2, were sampled. For control cases, most fields were blank, so sampling continued until at least five fields contained one or more HRDs.
Proximity (Spatial Correlation) Analysis (Proxan): To implement a quantitative test of the hypothesis, the Proxan software module was developed by one of the authors (ZK) for use on a Linux platform. A more detailed description of the algorithms is available at www.bendor.com.au/Proxan.
The approach taken in Proxan was as follows:
Colour specification: The analysis requires a colour difference between the two sets of objects whose relationship is being examined, in this case HRDs and vessels. The colours of the two objects were specified using a colour-matching procedure. Proxan can separate objects based on their mixtures of red, green and blue, as well as different colour saturations.
Object identification: In favourable material, Proxan separated HRDs and vessels reliably, in images of sections labelled for haem (using the Prussian blue reaction), and for vessels using cresyl violet. The quality of separation achievable is shown in Figure 1. For some images, it was necessary to enhance colour separation, using Photoshop CS (v8.0 Adobe) Colour Selection tool. Proxan then used detection with iterative sampling to define the vessels and HRDs. Adjustments available in Proxan allowed optimal matching of the boundaries set to the biology of the tissue.
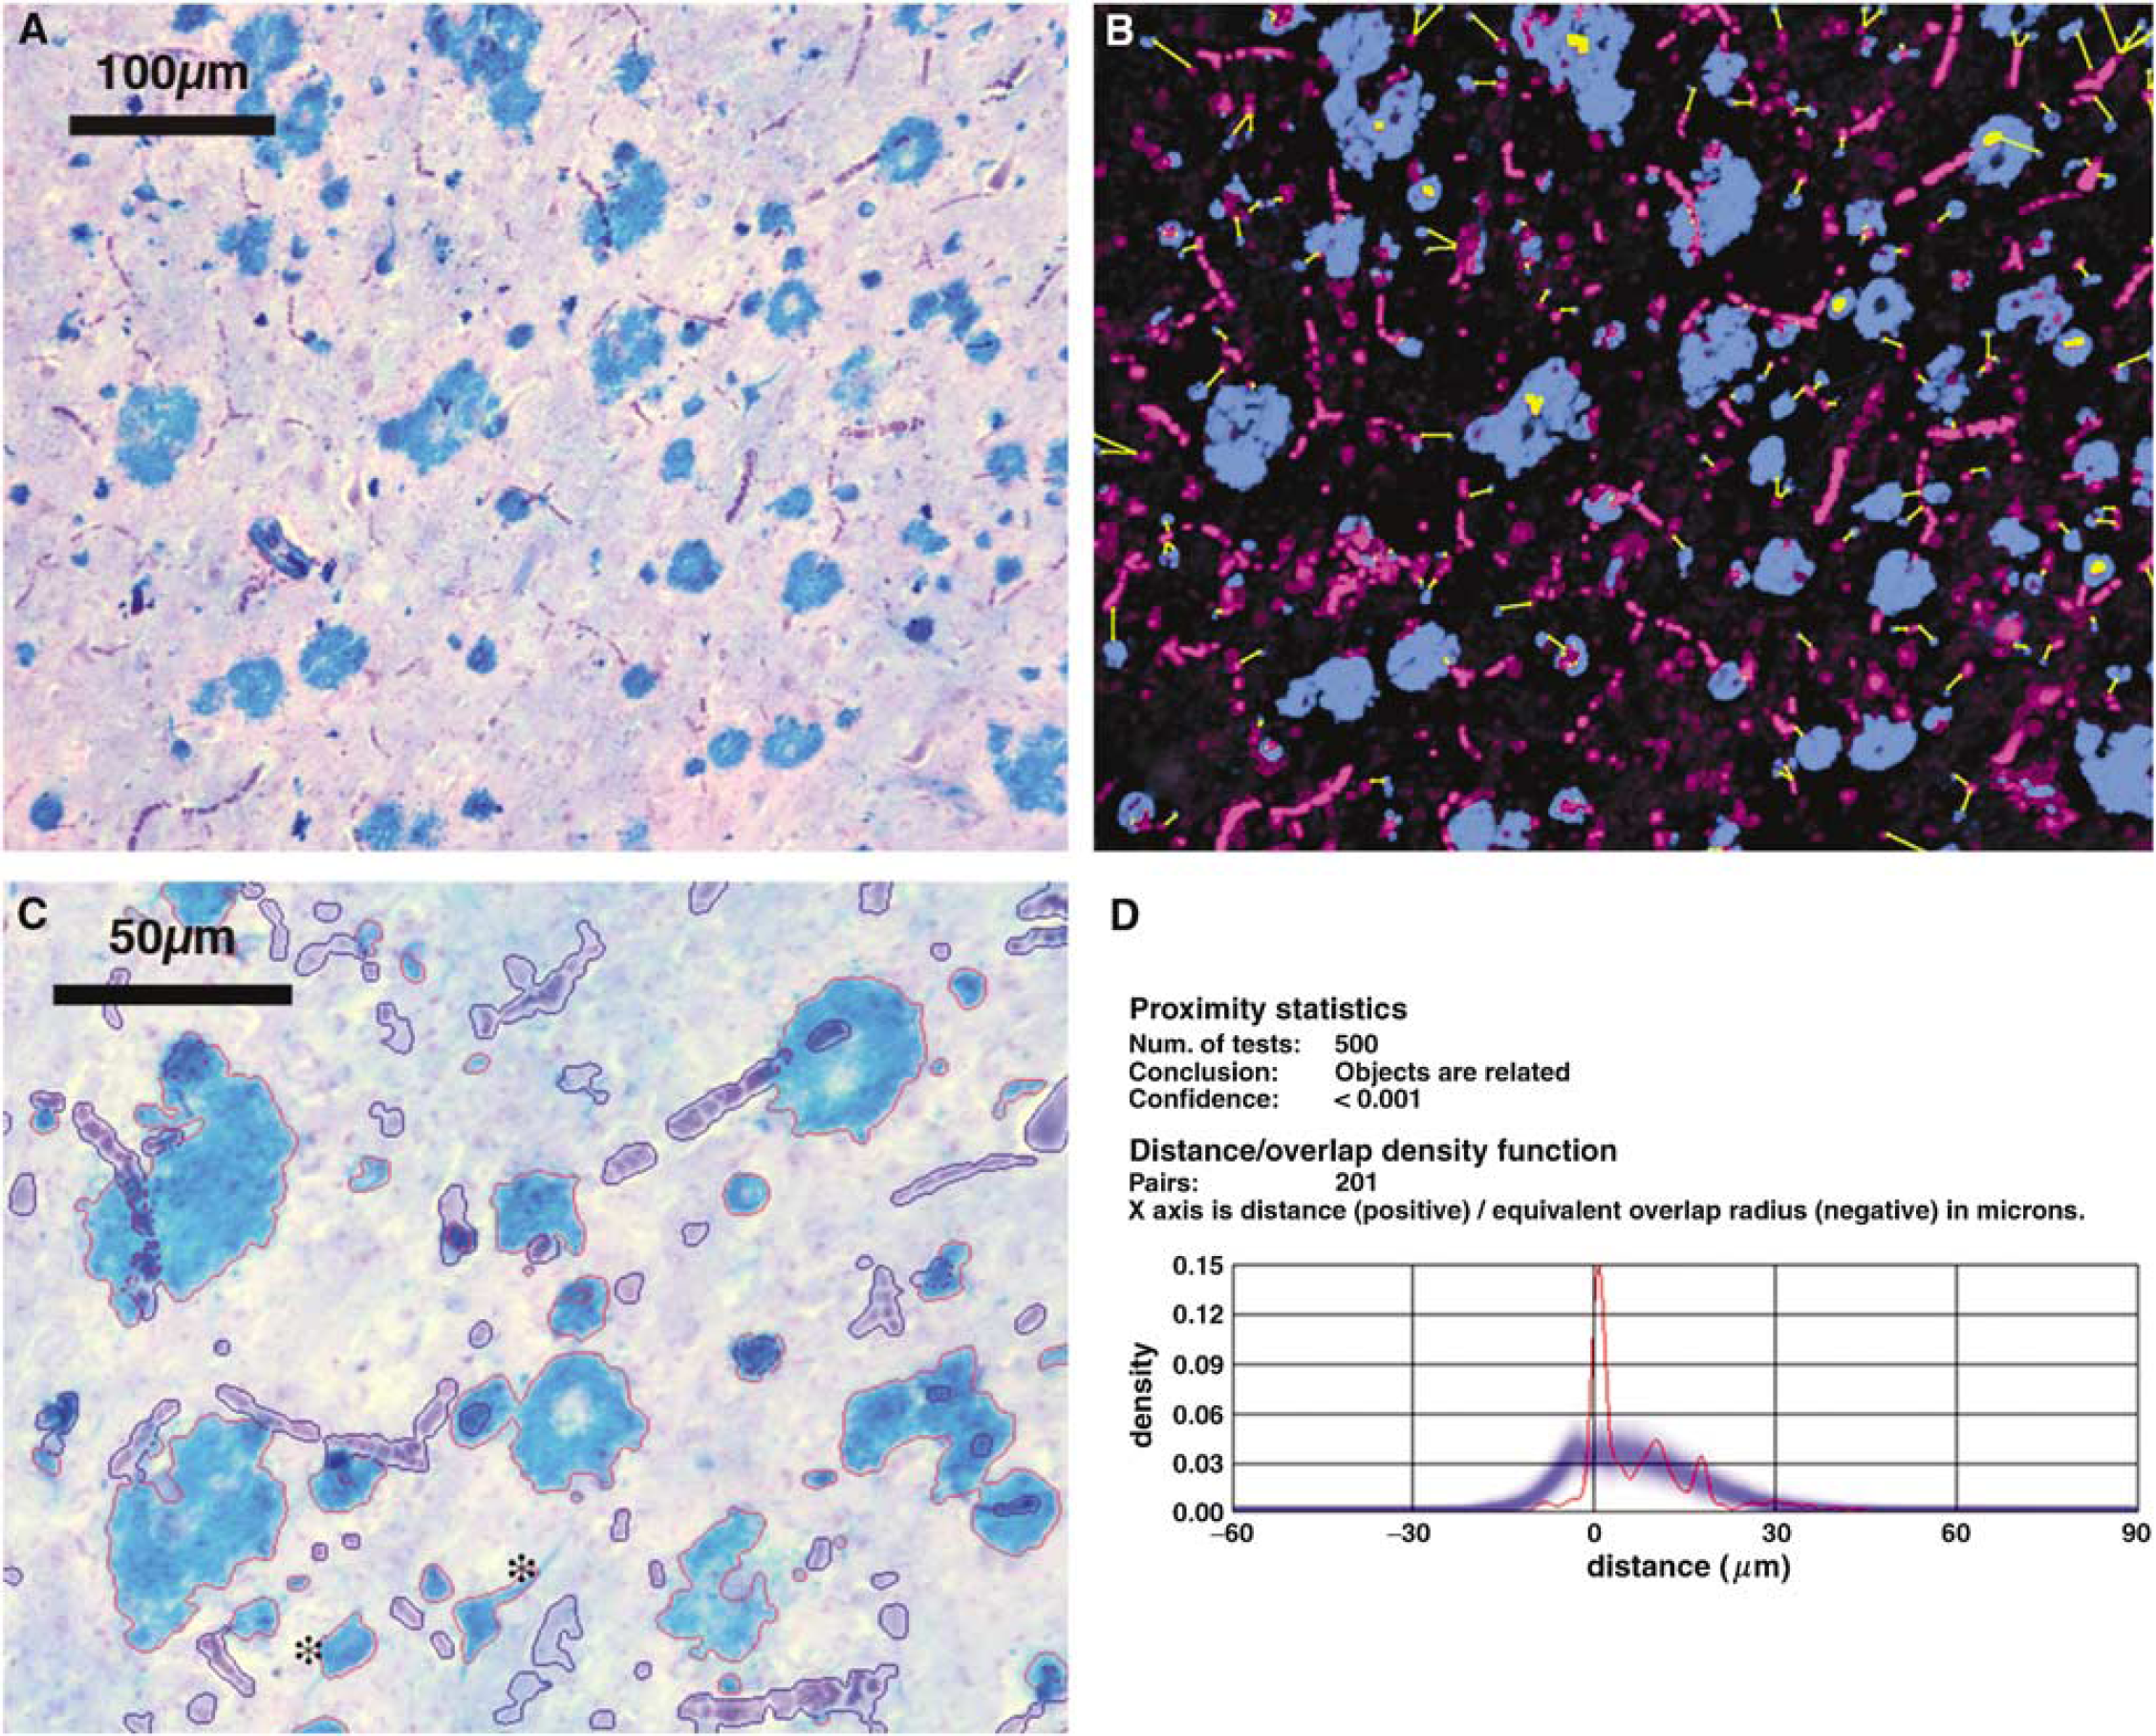
Proxan analysis of an image of haem- and cresyl violet-labelled superior frontal cortex of AD case 2. (
Object pairing: Each HRD was then ‘paired’ with the nearest vessel. For the present analysis, each HRD was paired with only one vessel (the nearest), while each vessel was paired with the nearest HRD and with any HRD not closer to another vessel.
Distance measurements: The fourth step was to measure the Euclidean distances between vessel and HRD in the defined pairings. An example of the pairings defined and distances measured by Proxan is shown in Figure 1. Some HRDs were so closely related to the nearest vessels that their shapes overlapped. For such overlaps, Proxan measured the area of the overlap in pixels, and recorded the negative of the square root of the area as the ‘distance between’ the HRD and the vessel. As a result, overlaps were recorded as small negative distances.
Randomization and statistics: The basic approach of the Proxan analysis is akin to cluster analyses in ecological and epidemiological studies. The method tests the likelihood that the observed proximity of two sets of objects (in this case, HRDs and blood vessels) could have occurred by chance; that is, whether the two sets are located randomly with respect to one another. To test this hypothesis, Proxan measures the distances between each HRD and the nearest vessel in a real image. It then redistributes the HRDs randomly, and remeasures the distances, repeating this step 500 times. The program uses a χ2 test to determine whether the real (observed) distances fit within the randomly generated distribution. If the real image is within the distribution of the created images, it can be concluded that there is no special relationship between HRDs and vessels. However, if the distances between these objects are smaller than for the randomly generated objects, it can be concluded that there is a ‘special’, nonrandom association between the objects.
In practice, Proxan measures the actual distances between objects, then automatically calculates the density distribution for the observed distances between HRDs and vessels and the density distribution of distances for 500 random trials, as well as the mean and variation in pairing distances in the trials (Figure 1D). The probability that the observed distribution of HRDs might be sampled from random distribution is calculated using a χ2 test.
Three-dimensional considerations: The microvascular network and HRDs are three-dimensional structures, which we have examined in 45-µm sections. Our method discards one dimension, the thickness of the section, collapsing the vessels and HRDs in a section into a two-dimensional plane. The effect is to lose one dimension of the separation of HRDs from vessels, reducing the absolute distances measured between them, and increasing instances of overlap. However, the same loss of one dimension applies to the randomized images generated by Proxan (above). Where Proxan finds order in two-dimensional images of HRDs and vessels, there must be order in the three-dimensional world as well. Proxan proved a rapid and compelling tool for assessing object pairings in a two-dimensional array. The major challenges in this study remained traditional–the selection of brains, of labels for key tissue features, of parameters such section thickness and of the working hypothesis.
Results
Working Hypothesis: Haem-Rich Deposits Form Around Capillaries
We formulated this working hypothesis after examining haem-labelled sections of human brain in which vessels were made visible by labelling them with cresyl violet in thick (45 µm) sections. The use of thicker sections (many studies of neuropathology use 6- to 7-µm sections) was, in our experience, important for retaining sufficient vessel structure in a section for their relation to HRDs to be seen. A representative region of superior frontal cortex from an AD brain is shown at low power in Figure 1A. At higher power (Figure 2), we were struck by the common occurrence of images in which HRDs seemed to be formed around or adjacent to capillaries. The haem appeared in characteristic patches up to 200 µm in diameter, which appeared along the length of vessels (Figures 2A, 2D and 2G), at branch points (Figure 2B), or with capillaries running into or through them (Figures 2C, 2E and 2F). There seems to be no prior report of these close relationships of HRDs to vessels.
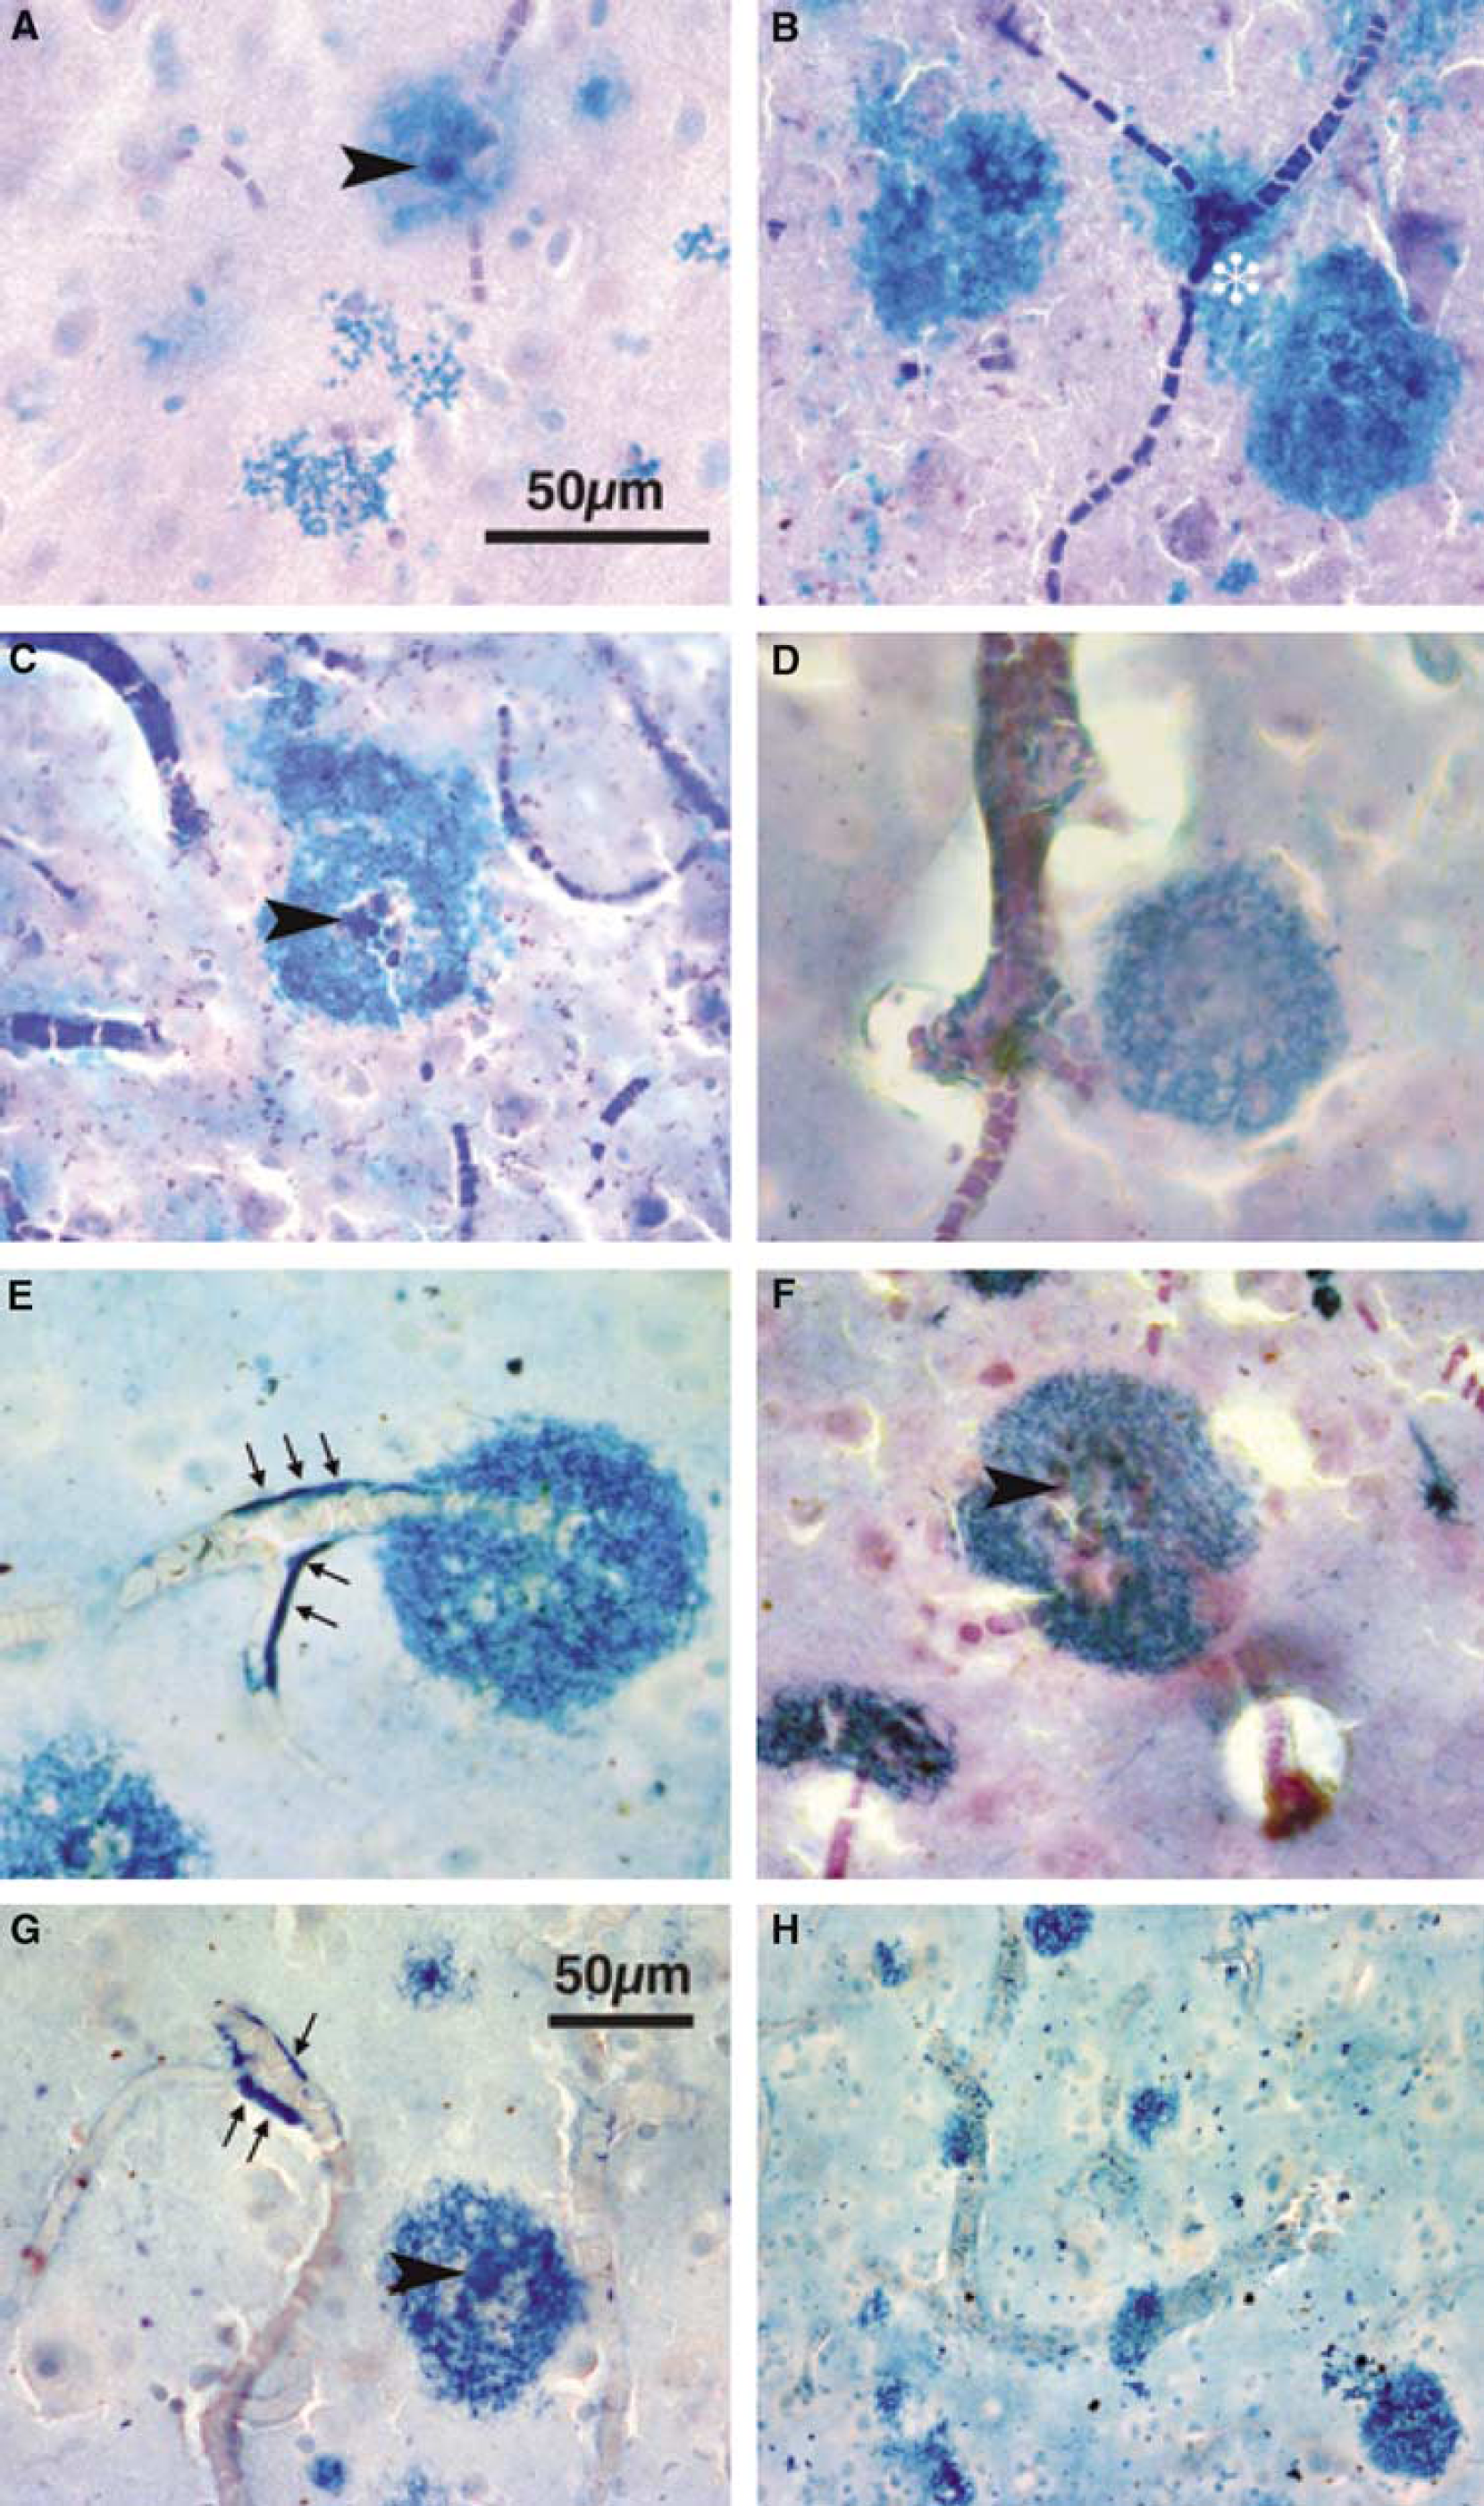
Haem-rich deposits and blood vessels in control, AD and DS cases. Prussian blue-labelled 45-µm sections, light cresyl violet counterstain in (
The numbers of HRDs detected varied widely between the patient groups studied. With the exception of one case (C5), HRDs were detected in all brains studied, although deposits were extremely sparse (2 to 3 per ~2.5 cm × 3 cm tissue section) in the younger (< 50-year old) cases. Haem-rich deposits were more abundant in non-demented cases with a Braak and Braak stageing of at least I–II, and occurred mainly in the hippocampal/entorhinal areas and less frequently (< 20 per section) in superior frontal and cingulate areas. In all AD cases, HRDs were present in large numbers. In some cases, particularly DS patients, haem appeared as a coating along the external aspect of vessels (arrows in Figures 2E and 2G) in addition to the roughly circular deposits.
Quantifying the Spatial Relationship Between Haem-Rich Deposits and Vessels
As described in the Materials and methods section, an image such as that in Figure 1A was processed (if necessary) with the Colour Selection tool of Adobe Photoshop, to increase the colour differential between HRDs and vessels (as in Figure 1B). Using Proxan, the HRDs and vessels were outlined. Proxan paired each HRD with the nearest vessel, and measured the shortest distance between paired objects (yellow lines in Figure 1B). Figure 1C shows at higher power the ability of Proxan to detect and outline HRDs and vessels. Proxan then randomly distributed the HRDs, re-outlined, re-paired and re-measured HRD–vessel distances 500 times. The distribution of real distances (red line Figure 1D) was then compared with the set of 500 of randomly generated distances (Figure 1D, blue line, mean distance, blue shading, variation). At the end of this process, Proxan had available one set of distances measured in the real image, and 500 sets of distances obtained from the same image with the HRDs randomized. Short or negative distances (overlaps) are much more frequent in the real than in the randomized sample. On a χ2 test, the probability of the observed distribution being sampled from the randomized distribution was small (P < 0.01).
This analysis was performed on images from 22 of the 23 (one case, C5, contained no detectable HRDs in the areas sampled). For cases with a high density of HRDs, sampling was performed until 10 images from each of 3 regions were obtained. For cases with few lesions, sampling was performed until no further HRDs could be found in the sections available. The field size of each image measured 700 µm ×700 µm and images were sampled from all layers of cortex. Statistical analysis required that at least three HRDs be contained within the microscopic field. Because of this requirement, two cases (C3 and C7) could not be tested statistically, despite the presence of occasional HRDs in both. In all 20 remaining cases, the observed vessel–HRD distances were nonrandomly distributed (probability of random distribution: P < 0.025, and in most cases P < 0.001; Table 1).
We considered whether the analysis was influenced by ‘edge effects’. Specifically, we considered the effect of an HRD or vessel at the edge of a field being included in the analysis, while its nearest vessel or HRD fell outside the field. The inclusion of either an HRD or a vessel without its nearest pair would (we argue) have the effect of including a number of longer-than-true distances. Since this would occur equally in the observed distribution and randomized distributions produced by Proxan, the effect would be to reduce the difference between the observed and the random relationships and therefore to increase the difficulty of confirming our working hypothesis. In practice, therefore, we did not attempt to correct for edge effects.
For patients in this study, time from death to autopsy ranged from 10 to 57 h. However, cases for which this delay was longer included younger patients in which HRDs were sparse, and, conversely, cases for which the delay was shorter included AD patients in which HRDs were numerous (Table 1). Thus, there was no correlation between the Post mortem delay and the occurrence of HRDs. The close relationship of HRDs to small vessels was evident in all cases, and so was also independent of time to autopsy.
Red Blood Cells
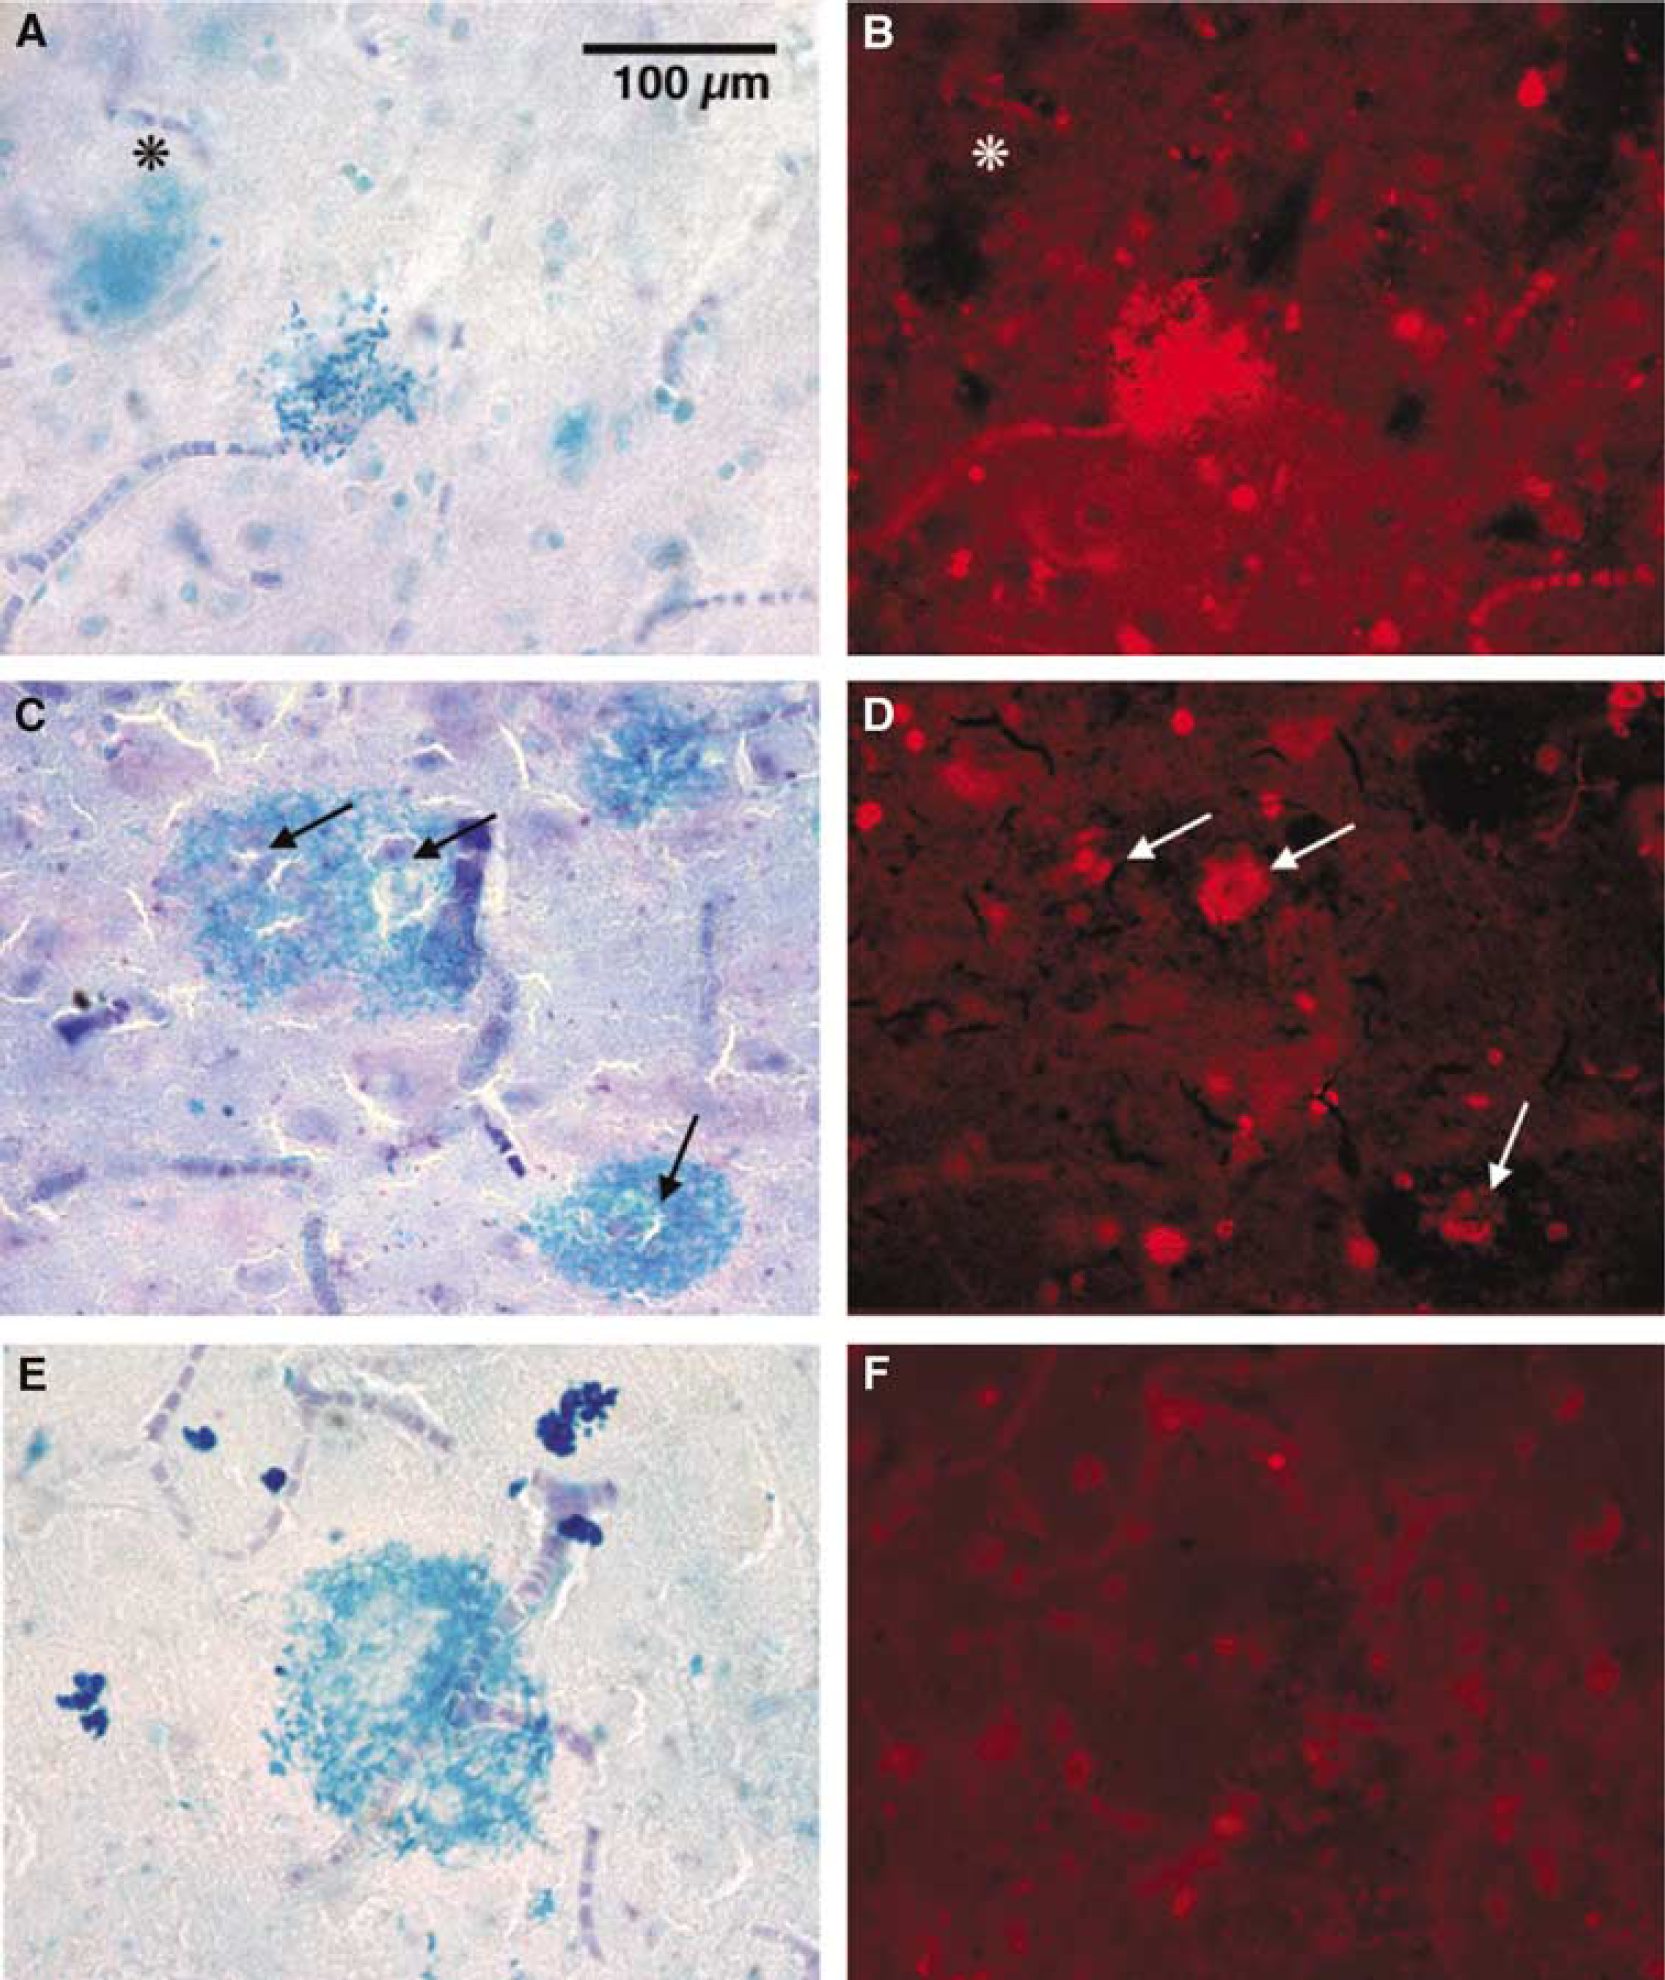
Haem-rich deposits (example in Figure 3A) showed little autofluorescence (Figure 3B), but often contained and were surrounded by brightly autofluorescent (excitation filter 594 nm, peak emission around 620 nm) cells (5 to 7 µm) with a morphology typical of RBCs (example in the inset in Figure 3B). When the colour contrast between vessels, haem and RBCs was enhanced (Figure 3C), there was some evidence of clustering of RBCs in the HRD, but it was also clear that RBCs scattered away from the haem concentrations. In general, RBCs were rare in HRD-free areas of cortex but, where HRDs were common, RBCs were common.
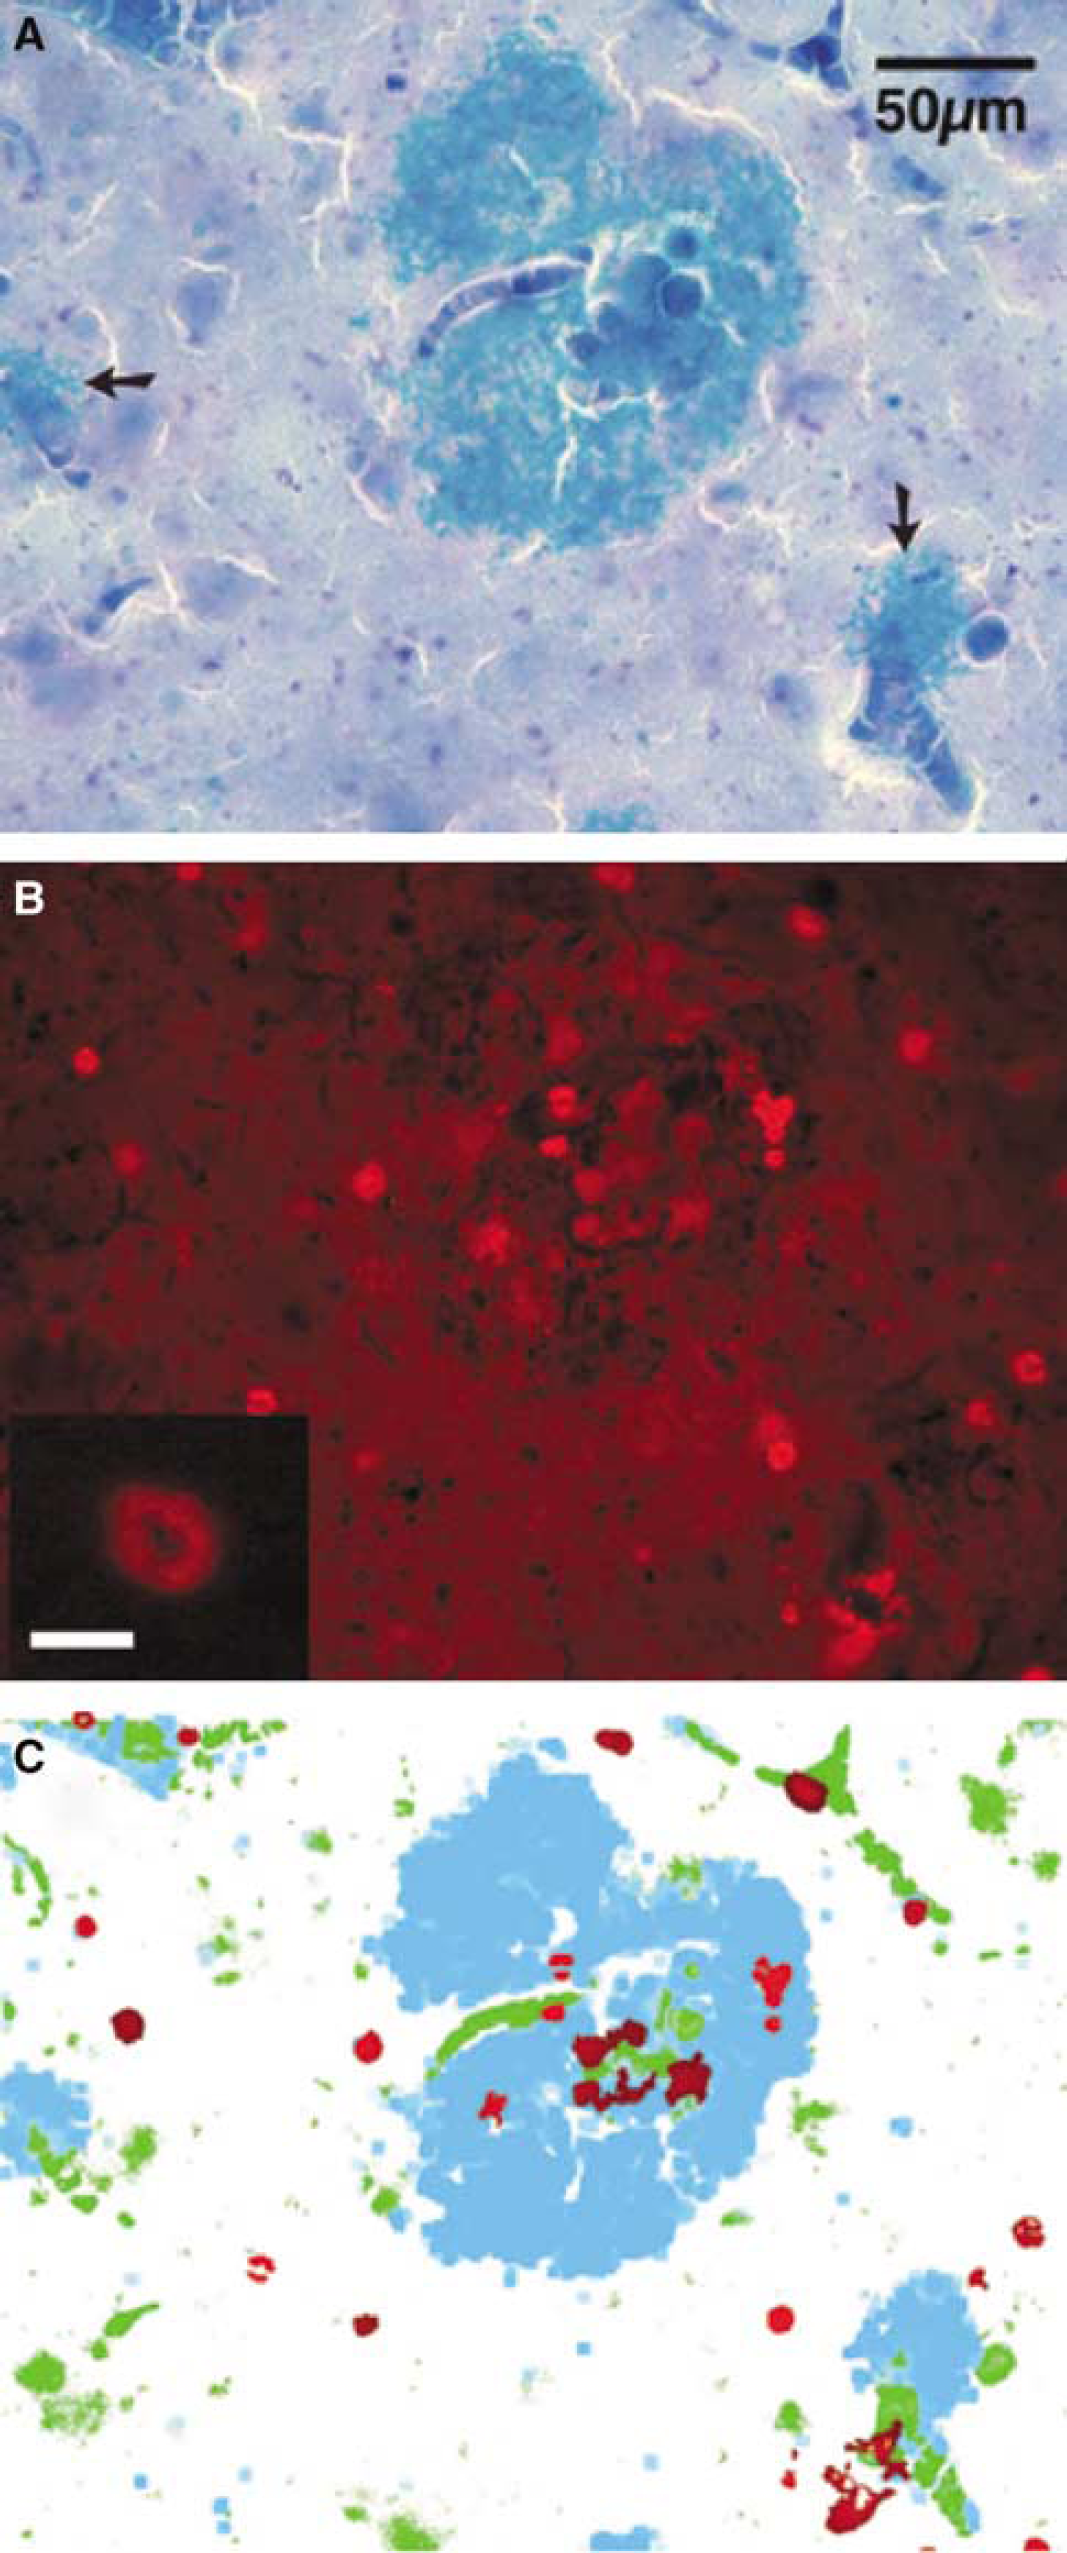
Relation of RBCs to haem in Case AD3. Scale bar = 50 µm for (
Factor VIII, Collagen IV, Fibrinogen
These three proteins were detected by immunohistochemistry, but the acidity of the Prussian blue reaction prevented consistent labelling of haem and of these proteins in the same sections. Instead, we immune-labelled sections adjacent to haem-labelled sections. It was then apparent that immunoreactivity for these three proteins occurred in patterns that resembled the distribution of HRDs, in four ways. First, labelling for all three proteins occurred in patches with a diameter up to ~200 µm (vWF, see Figures 4A and 4B; fibrinogen, Figures 4C and 4D; collagen IV, Figures 4E and 4F). Second, the immunolabelled patches occurred only in regions where HRDs were found, in adjacent sections. Third, the immunolabelled patches had the same close spatial relationship to vessels, as did HRDs. This relationship is clear with the labelling for vWF, which also labels endothelial cells (Figures 4A and 4B); vessels (arrows in A) appear to run into or through vWF-positive blobs. As fibrinogen labelling is less circumscribed than either vWF or collagen (fibrinogen is a soluble protein free in circulation), the vascular relationship is less obvious (Figures 4C and 4D). Nonetheless, the densest areas of fibrinogen are traversed by capillary-size vessels that can be seen as ‘negative’ images, particularly viewed with phase microscopy. The fibrinogen areas, in more organized deposits, were clearly perivascular (Figure 4D). Vessels are seen with particular clarity with collagen IV labelling (Figures 4E and 4F), because collagen is part of the perivascular basal lamina. We noted collagen IV-positive halos around cortical and amygdalar microvessels. von Willebrand factor, fibrinogen and collagen were seen in much lower density than HRDs, presumably because they are less stable than haem, but were found in the same brain regions and with the same vascular relationship. Strong immunoreactivity for these factors was present in all cases and immunoreactive clumps were correlated only to HRD presence and not to post mortem delay.
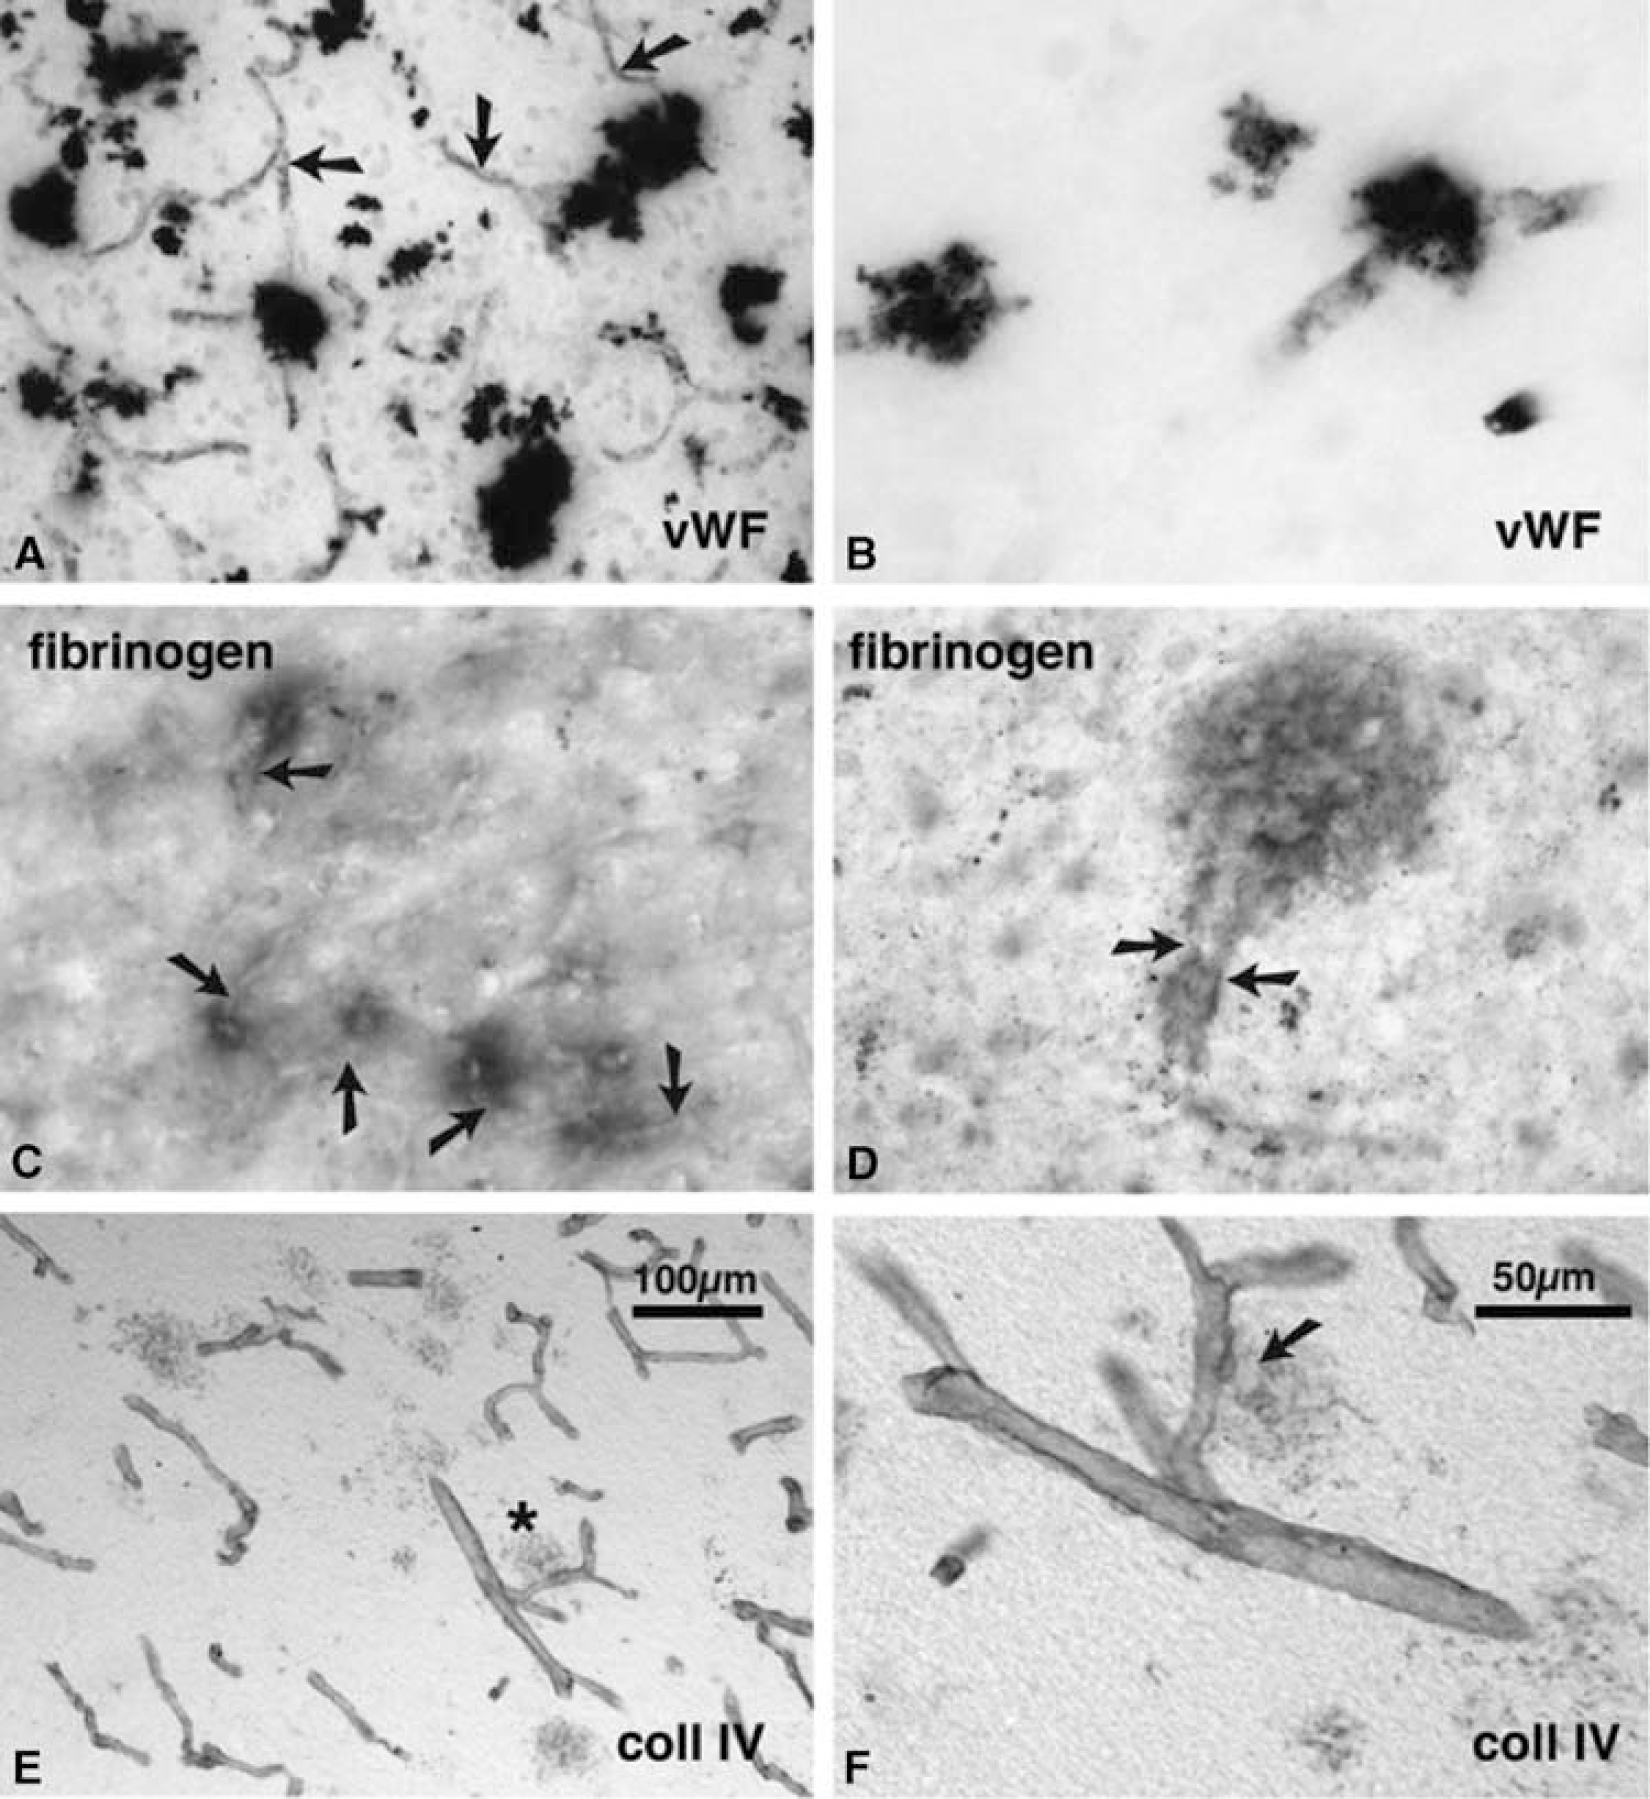
Clotting- and vessel-related immunolabelling in control, AD and DS cortex. Vessels are indicated by arrows. The scale in (
Haem-Rich Deposit Morphology: Staging of Microhaemorrhages
If HRDs are microhaemorrhages, it seemed likely that they would occur successively, over a period time and that, at the time of tissue fixation, there should be present ‘old’ and ‘new’ deposits. The images in Figure 5 illustrate a sequence of microhaemorrhages selected to show ‘fresh’ and ‘old’ features. Recent microhae-morrhage formation is suggested by the strongly haem-positive granular deposits (Figure 5A), which autofluoresce brightly (Figure 5B), suggestive of newly lysed RBCs. Older haem deposits (Figures 5C and 5E) are more clearly circumscribed, less granular and less fluorescent (Figures 5D and 5F). The presence of RBCs in D suggests that this lesion is no more than 10 days after bleed, while their absence from G suggests that this lesion is older. In addition (data not shown), fresh lesions such as in Figures 5A and 5B are immuno-positive for vWF, collagen IV and fibrinogen. These proteins are much less stable than haem, and are absent from HRDs more than several weeks old.
Evidence of HRD ‘stages’: The panels at the left show HRDs seen with conventional transmitted illumination. The panels at the right show the same fields viewed with 594-nm excitation filter. Scale bar = 100 µm for (
Discussion
The present results confirm many previous reports of elevated levels of iron in the aging and diseased human brain (Connor et al, 1992a; Kala et al, 1996; LeVine, 1997; Morris et al, 1994; Qian and Wang, 1998). This iron can be found in small (< 200 µm diameter) patches (HRDs) with a close spatial relationship to the microvasculature. These HRDs were not exclusive to older individuals as they could be found in younger patients (27, 39 and 47 years), albeit very few, and were absent in an older patient (71 years). Haem-rich deposits were more frequent in nondemented individuals with stage I and II AD-like pathology, particularly in hippocampal/entorhinal areas, and were dramatically more abundant in AD cases. However, the major aim of the present study was to determine the spatial relationship of HRDs to blood vessels. Our central conclusion is that, whether HRDs were rare or plentiful, all were perivascular, independent of disease stage, and hence plaque and tangle density.
The relationship of HRDs to capillaries suggests that they are the residuals of bleeding from capillaries, and occasionally from small arterioles or venules. Others have argued that concentrations of haemosiderin in the brain may result from an (unspecified) abnormality of iron metabolism (see the following section). The evidence that HRDs form at the site of capillary haemorrhage can be summarized briefly:
Haemosiderin is the main long-term storage form of haem that enters the brain as the result of bleeding (Koeppen et al, 1995).
When vessels are shown in the same tissue, HRDs resemble small patches of bleeding, surrounding or immediately adjacent to capillaries, venules or arterioles.
When the spatial relationship between HRDs and capillaries was tested quantitatively, the close apposition of HRDs to capillaries was confirmed.
Haem-rich deposits are associated with proteins normally found in blood, or in vessel walls (vWF, fibrinogen, collagen), and with RBCs.
It was possible to stage HRDs, from recent to longstanding, consistent with the idea that microhaemorrhages occur, and HRDs form, successively, over time.
Close apposition of haem to capillaries and arterioles has been described in transgenic CAA mouse, in which cerebral microhaemorrhages were common (Winkler et al, 2001).
Iron and Haemosiderin in the Brain
Concentrations of iron in the brain increase steadily with age, suggesting that iron is not cleared once it accumulates intraparenchymally (Wagner et al, 2003). In previous studies, two ideas of the significance of iron-rich deposits in age and AD have been formulated. Iron, bound to ferritin and other iron regulatory proteins, is one of many compounds known to accumulate in plaques associated with AD (Connor et al, 1990; Lovell et al, 1998). The presence of iron/ferritin in plaques has been seen as part of a complex pathogenic mechanism that may involve dysregulation of metal metabolism. An alternate hypothesis is that ferritin accumulates extracellularly after the breakdown of neurons and glia and the release of their normal iron content (Bishop and Robinson, 2003). The present study proposes a third hypothesis, that iron accumulates in the brain in the iron-rich protein haemosiderin, through episodes of microhaemorrhages. Haemosiderin, sequestered by microglia as they break down haemoglobin, is insoluble and persists for long periods at the site of bleeding (Koeppen, 1995; Wagner et al, 2003), making it a reliable post mortem marker of longstanding haemorrhages (Wagner et al, 2003). The appearance of haemosiderin is dynamic. In a rabbit model of intracranial haemorrhage, the Prussian blue reaction was negative during the first day, but became positive at 24 h along the walls of capillaries and in microglia (Koeppen, 1995). In humans, the time from a vessel rupture to detectable haem is estimated at 6 days (Koeppen, 1995). From this time, blood-borne macrophages or resident microglia convert the haem released from lysed RBCs to haemosiderin. Red blood cells provide another marker of the age of a lesion. By these criteria the lesion in Figure 5A is at least 6 days old, that in Figure 5C is older, up to 10 days, while that in Figure 5E is over 10 days old.
Microvascular versus Macrovascular
Cerebral macrovascular pathology is a major cause of disability, dementia and death, and is correspondingly well-studied. Angiopathy is common in AD patients (Jellinger, 2002; Kudo et al, 2000; Shi et al, 2000), with some estimates that a third of such patients have significant cerebrovascular disease (Kalaria, 2002), or that as many as 98% have amyloid angiopathy (Jellinger, 2002). Alzheimer's disease shares many risk factors for vascular disease (for example, reviewed in Jellinger, 2002; Kudo et al, 2000; Shi et al, 2000). In these studies, however, most attention has been paid to relatively large macroscopically visible lesions. Even the ‘micro-bleeds’ noted in a variety of small vessel diseases are 2 orders of magnitude larger than the microhaemorrhages we note here (diameter, 50 to 200 µm). For instance, in a combined MRI/ autopsy study of hereditary small-vessel disease, the microbleeds detected were larger than 2 mm, with histological identification of haemosiderin in 0.2- to 1.0-mm areas adjacent to arterioles and small arteries (100 to 300 µm diameter) (van Dijk et al, 2002). We describe here an haemorrhagic angiopathy at a significantly smaller scale—the capillary.
The notion that the small (< 200 µm) haemorrhages described here around microvessels are related to degenerative changes in the brain has been considered by relatively few studies. Among the microvasculature abnormalities described in aged brain are abnormal wall structure (Scheibel et al, 1989), altered capillaries density, atrophic capillaries(Buee et al, 1994), tortuosity and narrowing (de la Torre, 2000, 1999) and endothelial degeneration (Kalaria and Hedera, 1995). Several concepts have also emerged of how capillary dysfunction in cerebral cortex may cause degenerative changes and dementia. For instance, one proposal is that capillary tortuosity slows blood flow, inducing ischaemia, breakdown of the blood–brain barrier and resultant pathology of the surrounding tissue (de la Torre, 2000, 1999). Fibrinogen leakage has also been noted around vessels in AD (Fiala et al, 2002). Armstrong (Armstrong et al, 1993, 1996) noted a spatial correlation between some forms of amyloid deposit and cerebral vessels, and the presence in those deposits of proteins of vascular origin. This proximity of plaques and capillaries was not supported by other investigators (Kawai et al, 1990), although this latter study used a sampling method (thin sections) that might have made it difficult to detect the relationship. The present study provides evidence of a spatial correlation between HRDs and capillaries, and the presence within HRDs of vascular components.
The idea that degenerative changes in capillaries can lead to microhaemorrhages gains support from animal studies. Close apposition of haem to capillaries and arterioles has been described in transgenic CAA mouse, in which cerebral microhaemorrhages (containing haem) were common (Winkler et al, 2001), and intravascular infusions of amyloid (Su et al, 1999) can produce capillary damage. Amyloid-induced endothelial damage is a potential mechanism for producing microhaemorrhages in the AD and non-demented cases; however, other mechanisms such as vascular inflammation and haemodynamic forces, and percussive injuries cannot be ruled out at this point. In the younger cases, the deposits were less frequent, smaller and appeared more recent, suggesting that these might be due to events near time of death.
Implications for Clinical Symptoms and Pathogenic Mechanism
Given that haem is a reliable and durable marker of intracerebral haemorrhage, the present evidence that HRDs are closely associated with cerebral capillaries suggests that HRDs form at the sites of capillary bleeding. In patients without clinical symptoms of stroke or dementia, it is likely that the microhaemorrhages were too small, and occurred too asynchronously, to cause acute symptoms. Even larger volume lesions, as detected with high-resolution MRI, might be asymptomatic (Tsushima et al, 2002). However, if HRDs represent microhaemorrhages and the vascular debris indicate a damaged microvasculature, an abundance of these lesions is highly likely to have a major impact on cognition, acutely in reduced capillary perfusion and extravasation of neurotoxic blood contents, later by inflammatory damage and ultimately by neuronal death. A rigorous test of the relationship between HRD accumulation and cortical dysfunction, as well the link between HRDs and AD plaques, seems warranted by the present results.
Footnotes
Acknowledgements
The authors acknowledge the important tissue resource provided by the National Health and Medical Research Council Network for Brain Research into Mental Health.