
Abstract
Brain imaging techniques such as functional magnetic resonance imaging (fMRI) have provided a wealth of information about brain organization, but their ability to investigate fine-scale functional architecture is limited by the spatial specificity of the hemodynamic responses upon which they are based. We investigated the spatiotemporal evolution of hemodynamic responses in rat somatosensory cortex to electrical hindpaw stimulation. We combined the advantages of optical intrinsic signal imaging and spectroscopy to produce high-resolution two-dimensional maps of functional changes in tissue oxygenation and blood volume. Cerebral blood flow changes were measured with laser-Doppler flowmetry, and simultaneously recorded field potentials allowed comparison between hemodynamic changes and underlying neuronal activity. For the first 2 to 3 secs of activation, hemodynamic responses overlapped in a central parenchymal focus. Over the next several seconds, cerebral blood volume changes propagated retrograde into feeding arterioles, and oxygenation changes anterograde into draining veins. By 5 to 6 secs, responses localized primarily in vascular structures distant from the central focus. The peak spatial extent of the hemodynamic response increased linearly with synaptic activity. This spatial spread might be because of lateral subthreshold activation or passive vascular overspill. These results imply early microvascular changes in volume and oxygenation localize to activated neural columns, and that spatial specificity will be optimal within a 2- to 3-sec window after neuronal activation.
Keywords
Introduction
The coupling between neuronal activity and cerebral blood flow was suggested over a century ago in the clinical reports of Mosso and animal experiments of Roy and Sherrington (Mosso, 1881; Roy and Sherrington, 1890). Significant progress has been made in elucidating the mechanisms and characteristics of the hemodynamic response to neural activity, but several questions still remain. Brain imaging techniques based on perfusion-related signals, including functional magnetic resonance imaging (fMRI) and positron emission tomography (PET), are gathering increasing importance for mapping brain function. A sound appreciation of the spatiotemporal characteristics of hemodynamic responses and their relation to underlying neuronal activity is therefore essential.
The hemodynamic response is comprised of a cascade of physiological events including changes in cerebral blood flow (CBF), volume (CBV), and oxygenation (Villringer and Dirnagl, 1995). The fidelity with which these perfusion-related signals match areas of active neurons determines the ultimate spatial specificity of brain mapping techniques. The ability to resolve individual columnar units with these techniques is necessary to realize the fine-scale functional organization of the brain. Because the hemodynamic response profile is dictated by vascular architecture, however, it may extend beyond neuroanatomic boundaries. Previous studies have suggested that the CBF response has coarse spatial regulation (Malonek and Grinvald, 1996) and propagates several millimeters from the site of neural activity (Iadecola et al, 1997). In contrast, others have shown that this response is capable of resolving the functional architecture of ocular dominance columns in primary visual cortex, demonstrating submillimeter specificity (Duong et al, 2001). Similarly, whereas earlier reports suggested a large CBV point spread function (Frostig et al, 1990), we recently demonstrated CBV columnar specificity (Sheth et al, 2004a). Oxygenation changes such as those measured by blood oxygenation level-dependent (BOLD) fMRI were described as predominating in veins distant from activated neurons (Frahm et al, 1994; Kim et al, 2000), but a few reports have shown that under the right circumstances they can also resolve ocular dominance columns (Cheng et al, 2001; Goodyear and Menon, 2001; Menon and Goodyear, 1999).
These previous studies have focused on determining which etiologic aspect of the hemodynamic response (CBF, CBV, or oxygenation) provides the highest spatial specificity. We recently found that signal timing may actually have a larger impact than signal etiology in this regard-that functional maps generated using the first few seconds of the response localize well to active columns, regardless of the etiology chosen (Sheth et al, 2004a). To investigate this concept further, we examined the spatiotemporal evolution of hemodynamic signals with high resolution in this study. Optical intrinsic signal (OIS) imaging (Grinvald et al, 1986) offers high spatial and temporal resolution, and OIS spectroscopy (Malonek et al, 1997; Mayhew et al, 1999) provides physiologic measures of hemoglobin oxygenation and concentration. We combined these advantages to generate high-resolution functional maps of CBV and oxygenation changes. This approach allowed us to investigate the evolution of hemodynamic responses within parenchymal, arteriolar, and venous compartments with improved detail and specificity. In addition, we simultaneously measured local field potentials (FP) and CBF to provide a comprehensive assessment of hemodynamic and neuronal activity.
Materials and methods
Animal Preparation
Nine male Sprague-Dawley rats (300 to 450 g) were studied in accordance with the University of California, Los Angeles Chancellor's Committee on Animal Research. Animals were prepared using a thinned skull preparation performed under halothane anesthesia, as previously described (Sheth et al, 2004a). We cannulated the tail artery for continuous blood pressure monitoring and periodic blood gas sampling, the femoral vein for subsequent anesthetic delivery, and the trachea for artificial ventilation. Anesthesia was then switched to intravenous α-chloralose (60 mg/kg initial bolus, 30 mg/kg h continuous infusion) and pancuronium bromide (2 mg/kg initial bolus, 1.5 mg/kg h continuous infusion), and inspired gases adjusted to maintain physiologic variables within the normal range: mean arterial blood pressure 90 to 110 mm Hg, arterial pO2 121 ± 14 mm Hg, arterial pCO2 39 ± 3 mm Hg (mean ± s.d.). Halothane was discontinued for at least 1 h before imaging.
Optical Imaging
Animals were transferred to the stage of a Nikon SMZ1500 microscope for imaging. Illumination was provided by a DC voltage-stabilized quartz-tungsten-halogen source (PL900, Dolan-Jenner, Lawrence, MA, USA) equipped with a heat filter. Two fiber optic guides with focusing lenses directed the light to the preparation, and reflected light was collected by the microscope and filtered by a filter wheel (Lambda 10-2, Sutter Instruments, Novato, CA, USA) mounted on the exit port. The filtered light was captured by a cooled 16-bit charge-coupled device (CCD) camera (TE/CCD-576EFT, Princeton Instruments, Trenton, NJ, USA) attached to the filter wheel. We used four narrow bandpass transmission filters, centered at 569 (full-width at half-maximum (FWHM) 3 nm), 577 (FWHM 3), 586 (6), and 605 (5) nm. The field of view covered 3.57 × 4.80 mm with a 144 × 192 pixel array, providing 25 μm/pixel resolution.
Each imaging trial lasted 16 secs (6 before stimulus and 10 after stimulus), and images were acquired every 250 ms, resulting in 64 images per trial. Trials were spaced 30 secs apart to allow the hemodynamic response to return to baseline. The four filters were alternated every trial. We designed a LabView (Version 5.1, National Instruments, Austin, TX, USA) virtual instrument to acquire optical and electrophysiologic data, control filter wheel position, and communicate with the stimulator.
Stimulation consisted of a 2-sec train of 1 ms square electrical pulses (ISO-Flex, Master-8, AMPI, Israel) delivered to the left hindpaw via two steel needle electrodes inserted into the plantar surface of the foot and ~10 mm away on the medial aspect of the leg. We varied neuronal activity by modulating the stimulation frequency (2, 5, 10, 15, 20 Hz at 1.2 mA). Stimuli were presented pseudorandomly. We acquired 12 trials per wavelength and stimulation condition, for a total of 240 trials in each subject.
Optical Spectroscopic Imaging
Multiwavelength optical imaging data were analyzed using a spectroscopic approach to calculate deoxyhemoglobin (Hbr) and oxyhemoglobin (HbO2) over the entire two-dimensional image. The data were fit to a model incorporating a modified form of the Beer-Lambert law, which describes light attenuation in the presence of absorbance and scattering:
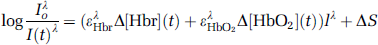
where Io is the pre-stimulus intensity, I(t) the measured intensity time course, ε extinction coefficients, l the path length through the tissue, S scattering, Δ[Hbr](t) is the time course of change in absorbers, and superscript λ indicates wavelength dependency. The four wavelengths of data at each pixel were treated as a discrete spectrum, and these pixel-by-pixel ‘spectra’ were fit to Equation (1) to extract a value of Hbr and HbO2 at each pixel. Wavelength dependency of the optical path length was measured using an in vitro phantom simulating the absorbance and scattering properties of brain tissue (Sheth et al, 2004a). This analysis allowed us to assess the spatiotemporal evolution of hemoglobin concentration and oxygenation changes in response to functional activation with high spatial and temporal resolution.
Response time courses were calculated in a 0.5-mm diameter region of interest (ROI) centered on the focus of activation, as determined by an automated program (Sheth et al, 2003). In each subject, ROIs for arteriolar and venous compartments were also generated based on the surface vasculature pattern in raw cortical images (Figure 1). A caveat should be noted regarding the measurement of responses in vascular compartments. Because reflectance-based imaging in this wavelength range samples approximately the superficial 0.1 mm of tissue (Kohl et al, 2000), functional signals over small vessels might actually have contained contributions from underlying parenchyma.
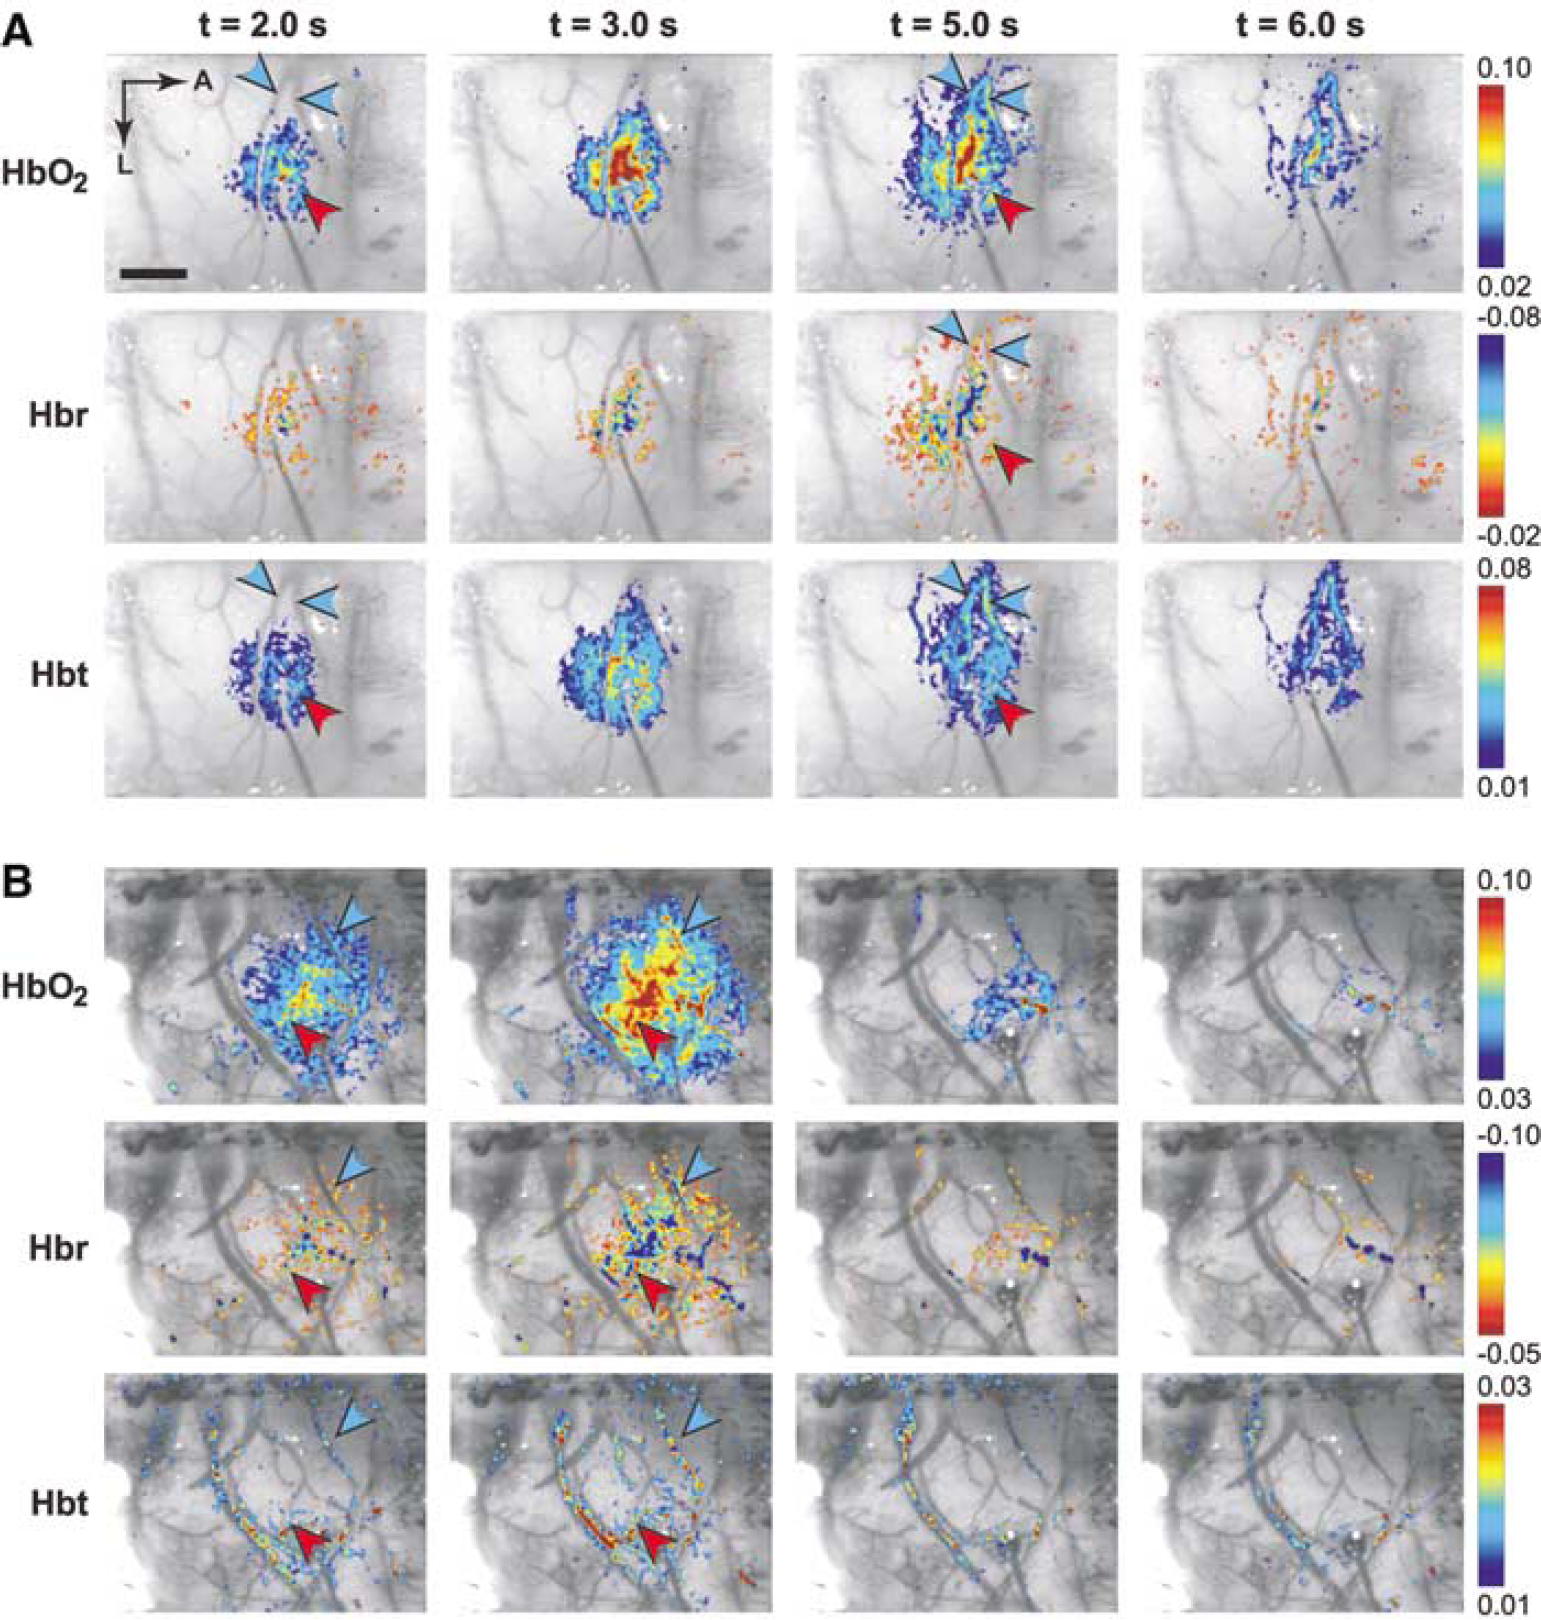
Spatiotemporal evolution of functional hemodynamic changes. Functional HbO2, Hbr, and Hbt responses are shown in two representative subjects (
Spatial extent was calculated by generating statistical significance maps. Images were filtered with a 3-pixel FWHM Gaussian kernel to reduce high-frequency spatial noise. We then performed an ANOVA test at every pixel on a 12 × 3 matrix of values: the pixel value in each of 12 trials at three time points (t = −3.50 secs [prestimulus], t = [peak image-1], t = [peak image]). This analysis provided a P-value map, in which pixels attained high significance if their variance within a trial was large compared with their variance between trials. This process attributed high significance to pixels that responded strongly to the stimulation, and low significance to those that showed large variability from trial to trial (Sheth et al, 2004a). This method tends to assign a smaller area to lower magnitude signals that are closer to the noise, but offers the advantages of de-emphasizing vasomotion artifact unrelated to the stimulus (Mayhew et al, 1996), and providing statistical significance thresholds. Spatial extent was defined as the square root (Brett-Green et al, 2001) of the area with P<0.05, thus providing a linear measure of the response area.
Electrophysiology
During every trial we simultaneously recorded field potentials, which reflect integrated synaptic activity (Mitzdorf, 1987). The response location was identified by 569 nm optical imaging, and a burr hole drilled in the thinned skull near the activation center. The dura was nicked with a 27-gauge needle to prevent tenting, and a tungsten microelectrode (125 μm shaft diameter, 12° tip, A-M Systems, Carlsborg, WA, USA) advanced to 500 to 600 μm (~layer IV). Analog data were amplified 1000 times (SCXI 1120, National Instruments, Austin, TX, USA) and sampled at 1 kHz. A reference electrode was placed in the posterior midline fascia. The microscope was enclosed within a Faraday cage to reduce electromagnetic interference. We waited at least 1 h between electrode insertion and imaging. Summed evoked field potentials (ΣFP) were quantified by summing individual FP magnitudes (large negative deflection) across a stimulation train (Mathiesen et al, 1998; Ngai et al, 1999; Sheth et al, 2003).
Laser-Doppler Flowmetry
Laser-Doppler flowmetry (LDF) was concurrently performed in six of the nine subjects to further evaluate early temporal characteristics of the hemodynamic response. After electrode placement, the laser beam of the LDF instrument (MoorLDI, Moore Instruments, Sussex, UK) was positioned at the activation center, taking care to avoid large vessels and the recording electrode (Sheth et al, 2004b). Data were acquired at 10 Hz with a 0.1-sec time constant. A 615-nm low-pass optical filter was placed in the illuminator to avoid crosstalk with the LDF measurements. Flow data were continuously acquired during the stimulation paradigm described above.
Results
We measured the hemodynamic and electrophysiologic response to peripheral stimulation in rat somatosensory cortex using simultaneous optical imaging, LDF, and field potential recording. Optical data were acquired at four wavelengths and fit to a spectroscopic model incorporating absorption because of changes in hemoglobin concentration and oxygenation. The resulting maps displayed the spatiotemporal evolution of functional CBV and oxygenation changes. Cerebral blood flow was measured at a single point near the response focus. By measuring field potentials concurrently, we investigated the correspondence between synaptic activity and hemodynamic spread.
Hemodynamic Spatiotemporal Evolution
Two-dimensional optical intrinsic signal spectroscopic imaging provided high-resolution functional images of stimulation-evoked changes in oxy- (HbO2), deoxy- (Hbr), and total (Hbt) hemoglobin. Changes in Hbt are proportional to CBV changes under the assumption of a constant hematocrit (Jones et al, 2001). These images are therefore directly analogous to BOLD and CBV-weighted fMRI data. Increases in neuronal activity trigger a local increase in blood flow and volume (Parri and Crunelli, 2003; Villringer and Dirnagl, 1995), and the resulting influx of oxygen-rich blood increases HbO2 and decreases Hbr content, producing the conventional positive BOLD fMRI signal (Ogawa et al, 1992). Some have observed a brief, transient increase in Hbr immediately after stimulation onset and preceding the large hyperoxygenation phase (Kim et al, 2000; Malonek et al, 1997). This initial dip (decrease in BOLD signal) is putatively caused by neuronal oxygen consumption from oxidative metabolism preceding the flow increase (Grinvald et al, 2000).
The profiles of the hemodynamic response at several time points are shown in Figure 1 in two representative subjects. The distinct spatial and temporal characteristics of the oxygenation and volume response elements are readily appreciated. At early times (~2 to 3 secs for HbO2 and Hbr, and ~2 secs for Hbt), the responses are focused in the central parenchymal region and avoid the vasculature. The feeding arterioles and draining veins show little activity even though they course through the active region, while the greatest signal change is in the surrounding capillary bed. The spatial profile during this epoch is smooth and concentric, showing little evidence of curvilinear contributions from vessels.
Over the next few seconds, the hemodynamic responses segregate into vascular compartments. Blood vessels start becoming more prominent by 5 secs, and by 6 secs the largest magnitude changes are over draining veins. The parenchymal contribution steadily declines until it is difficult to distinguish which cortical region was originally activated. Whereas CBV and oxygenation responses colocalize over the central capillary bed over the first few seconds, their only overlap in the later epoch is in the vasculature.
The temporal characteristics of each hemodynamic response can be seen more clearly in Figure 2, which depicts the time course of changes in the central parenchyma. The results are consistent with previous optical (Jones et al, 2001) and fMRI studies (Duong et al, 2000) employing similar stimulation parameters. Oxyhemoglobin and Hbt increase monophasically, and Hbr decreases monophasically. Response magnitude increases with decreasing stimulation frequency, reaching their largest values during 2 Hz stimulation. For that stimulation parameter, HbO2 reaches its peak of 6.8 × 10⁻² at 2.9 secs. Peak magnitudes and time-to-peak (TTP) for Hbr and Hbt are −5.2 × 10⁻² at 2.4 secs and 3.3 × 10⁻² at 2.9 secs, respectively.
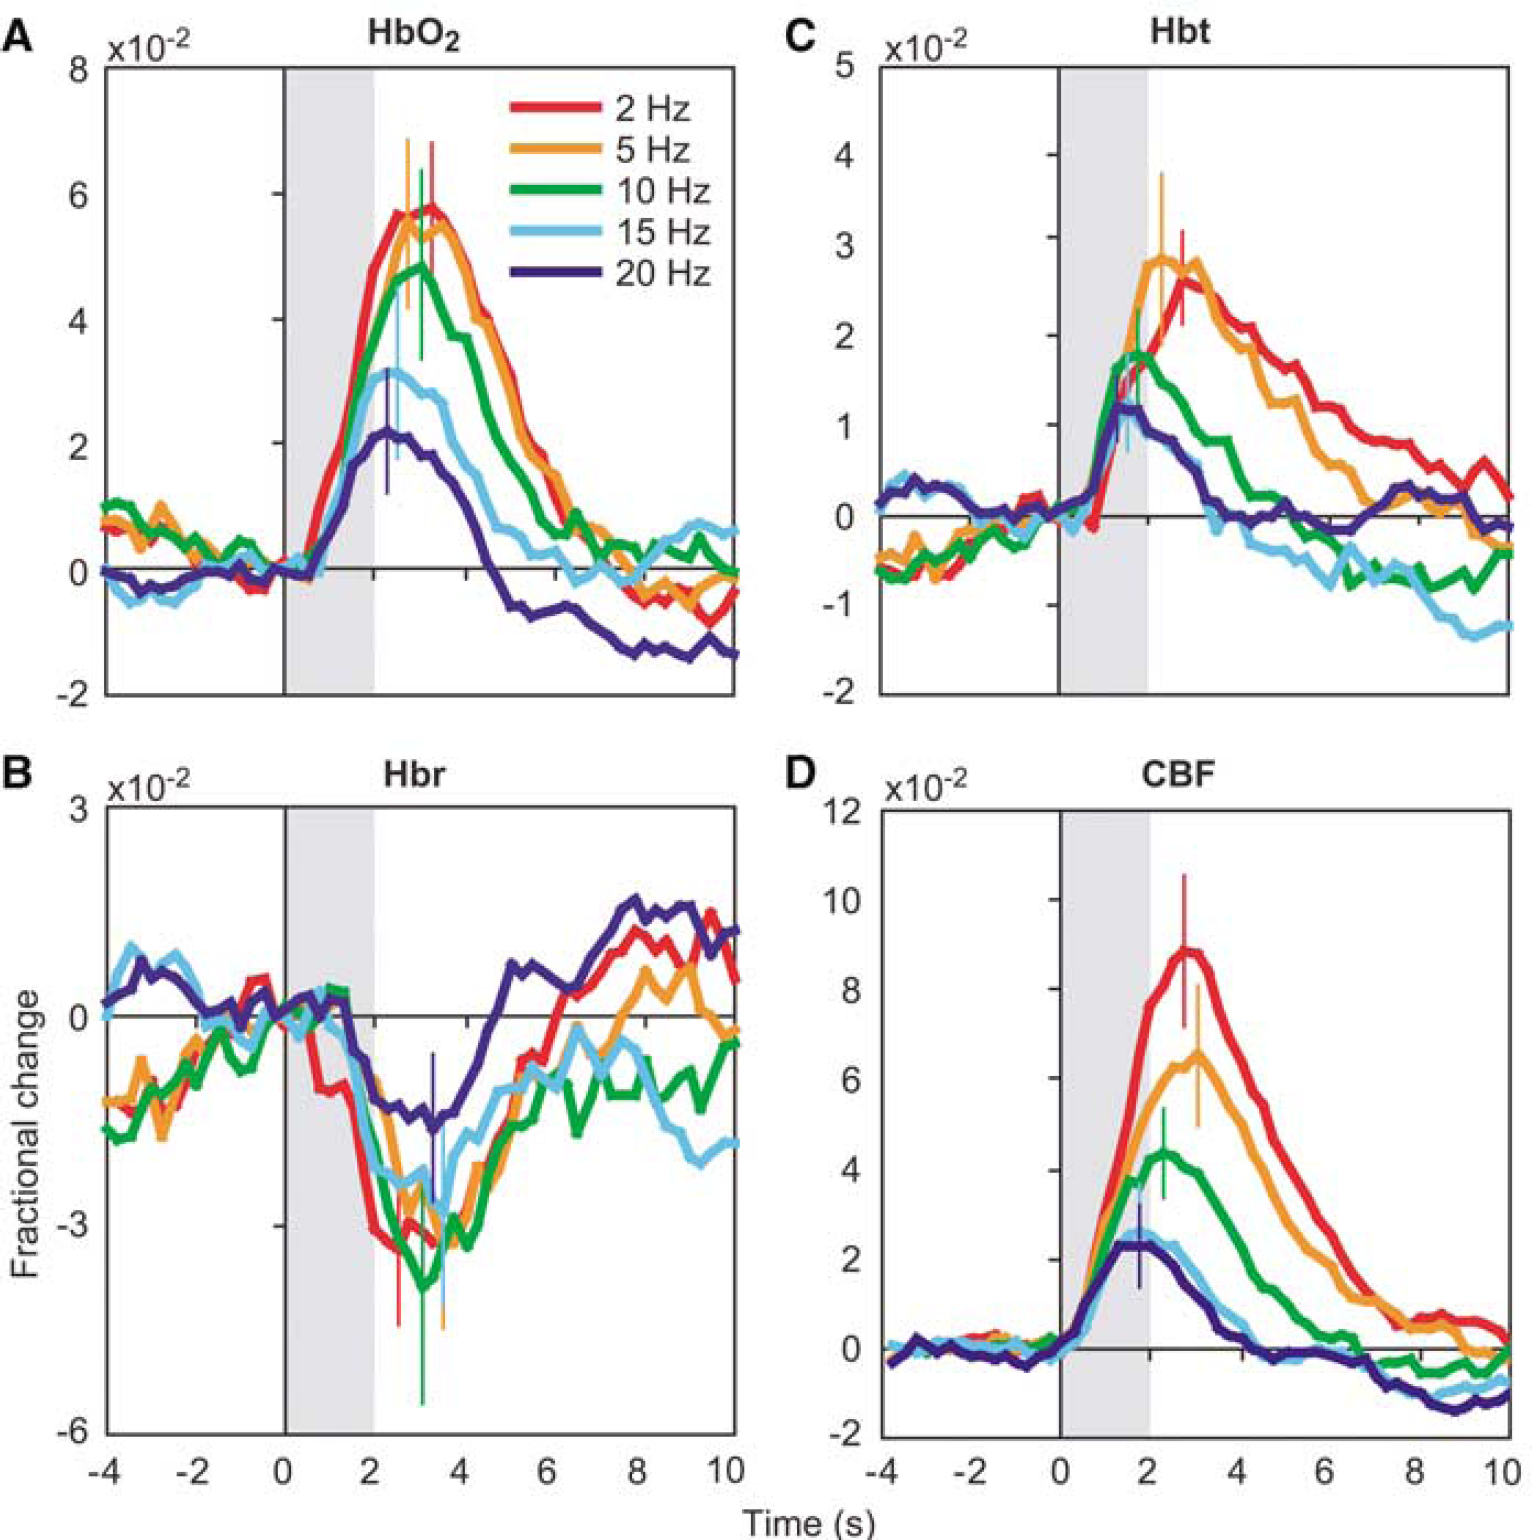
Hemodynamic time courses. The time course of functional changes in HbO2 (
To better understand the response evolution between the parenchymal and vascular compartments, we also measured signals within arteriolar and venous ROIs in each subject. Because the temporal profiles are qualitatively similar to those in Figure 2, these data are summarized in Table 1, which depicts the peak response magnitude (‘Peak’), as well as two temporal measures. The TTP is the latency to reach peak value averaged across all subjects, whereas the delay (‘Delay’) is the difference between the respective vascular and central latency time averaged across all subjects. Because the latter value is measured with respect to the central compartment, the ‘Delay’ fields under ‘Central’ are blank. Differences between compartments are more likely to be revealed with the delay measure, since it preserves temporal differences within each subject that might be washed out after averaging TTP values across all subjects.
Temporal characteristics across parenchymal and vascular compartments
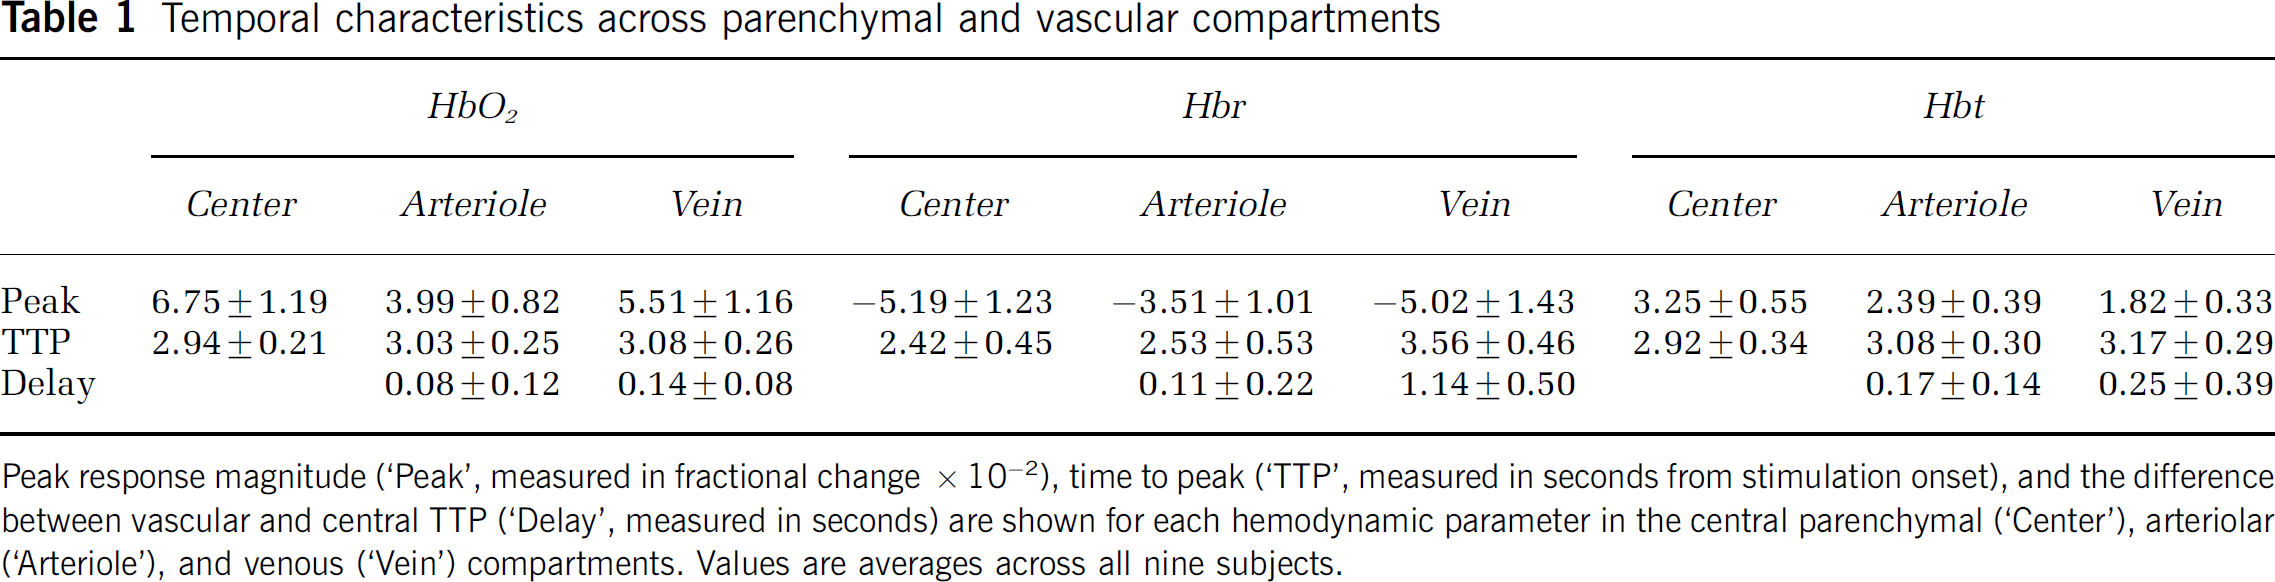
Peak response magnitude (‘Peak’, measured in fractional change x 10−2), time to peak (‘TTP’, measured in seconds from stimulation onset), and the difference between vascular and central TTP (‘Delay’, measured in seconds) are shown for each hemodynamic parameter in the central parenchymal (‘Center’), arteriolar (‘Arteriole’), and venous (‘Vein’) compartments. Values are averages across all nine subjects.
Oxygenation changes in arterioles occur simultaneously with or immediately after central changes. The delay between the parenchymal and arteriolar peak was 80 to 110 ms, but the error bars include zero, making the difference not statistically significant. The magnitude of these upstream arteriolar oxygenation changes is smaller than that of HbO2 and Hbr changes in the central parenchyma and veins. Volume changes in arterioles follow central changes by approximately 170 ms, and are significantly smaller (2.4 × 10⁻² versus 3.3 × 10⁻²).
A different temporal pattern occurs in draining veins-oxygenation changes are delayed compared with the parenchyma, but volume changes are not. HbO2 changes peak 140 ms later in veins, and Hbr changes peak 1.1 secs later. Again, these oxygenation changes are smaller in magnitude in veins than in the central capillary bed. Cerebral blood volume does increase slightly in draining veins, but less so than the central or arteriolar increase, and without a significant delay.
Comparing the hemodynamic parameters across the two vascular compartments, HbO2 and Hbr changes are relatively larger in draining veins than in feeding arterioles, and Hbt changes are relatively larger in arterioles than in veins. To determine whether the vascular responses are due to passive ‘overspill’ without a change in oxygen metabolism, we calculated the ratio of relative peak changes in HbO2 and Hbr in the central parenchyma and downstream veins, normalized by Hbt. The magnitude of this ratio should be lower in a metabolically active area, since oxygen consumption will tend to decrease HbO2 and increase Hbr. The relative changes between the central parenchyma and draining veins for HbO2 are 2.08 ± 0.01 and 3.03 ± 0.01, and for Hbr are −1.60 ± 0.01 and −2.77 ± 0.02, respectively.
To further investigate hemodynamic spatiotemporal characteristics, we calculated the average response size of each parameter within concentric annuli increasing in distance from the focus at 0.5 mm diameter increments (Figure 3). All three parameters decrease in magnitude at increasing distance, but maintain the same overall temporal profile. Relative ratios of HbO2 and Hbr do not vary systematically across annular ROIs, possibly as a result of the inclusion of both parenchymal and vascular compartments in the annular ROIs, resulting in an ‘averaging’ of the relative ratios.
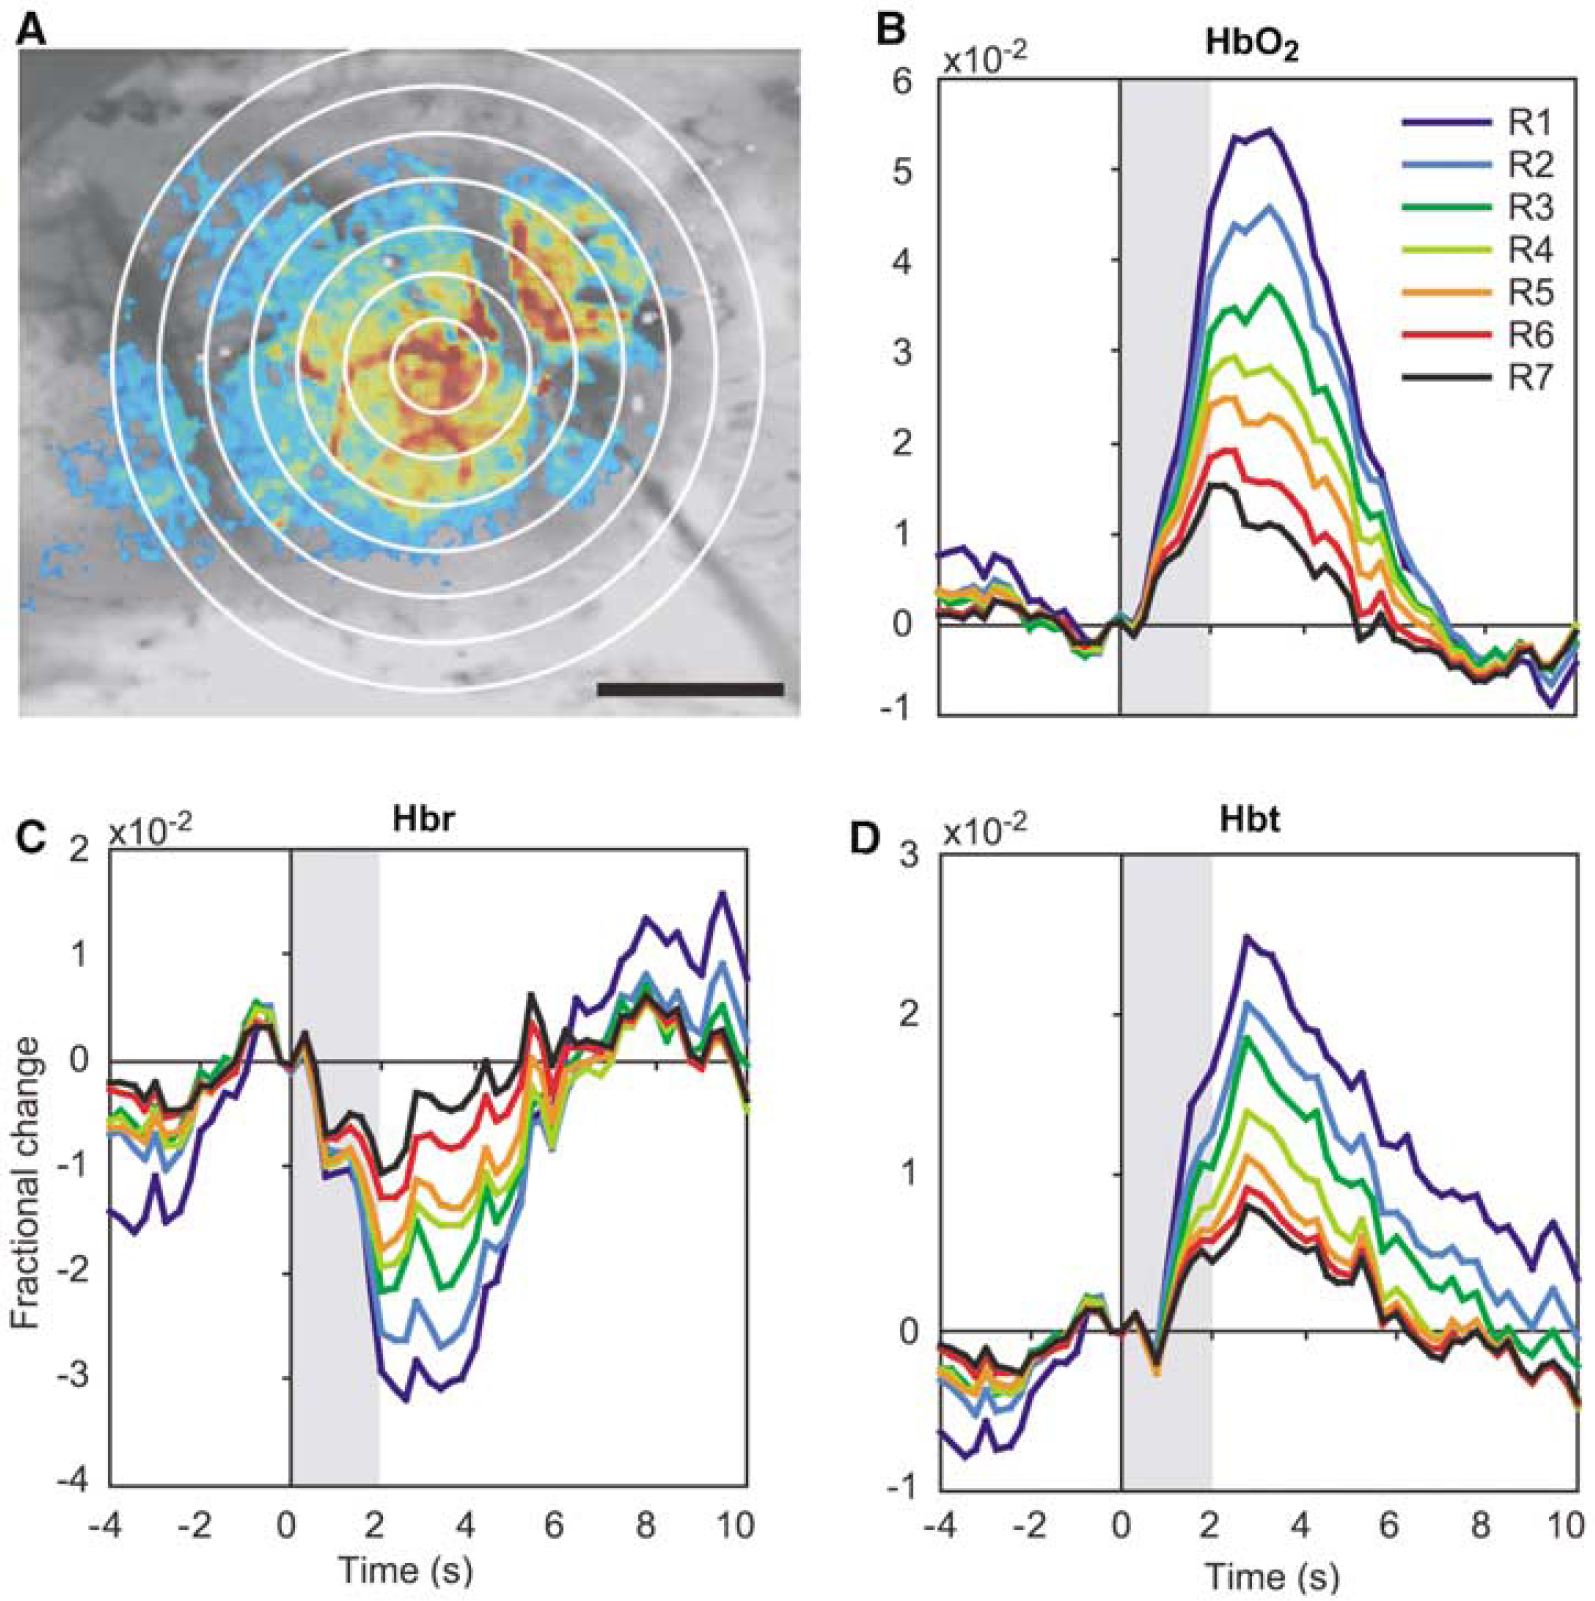
Concentric annulus analysis. (
Taken together, these data show that functional changes in oxygenation and volume initially colocalize in the central capillary bed, avoiding vascular structures. Over time, the responses propagate into vascular compartments, with volume changes predominating in upstream arterioles and oxygenation changes in downstream veins. These responses attain peak values slightly later in their respective vascular compartments than in the central parenchyma. The spatial profiles of the late epoch, therefore, are heavily biased towards vasculature distant from the site of neuronal activity.
Simultaneously measured CBF responses in six of the nine subjects are shown in Figure 2D. Flow responses increase in magnitude and TTP with decreasing stimulation frequency. Under our experimental conditions, flow increases rapidly after stimulation presentation, with an onset time (>2 s.d. above before stimulation fluctuations) of 0.4 ± 0.14 secs (mean ± s.d.). Figure 4 shows a more detailed temporal comparison between the 2 Hz CBF and CBV responses. In both panels, CBF changes precede CBV changes at stimulation onset, and CBV returns to baseline more slowly than CBF.
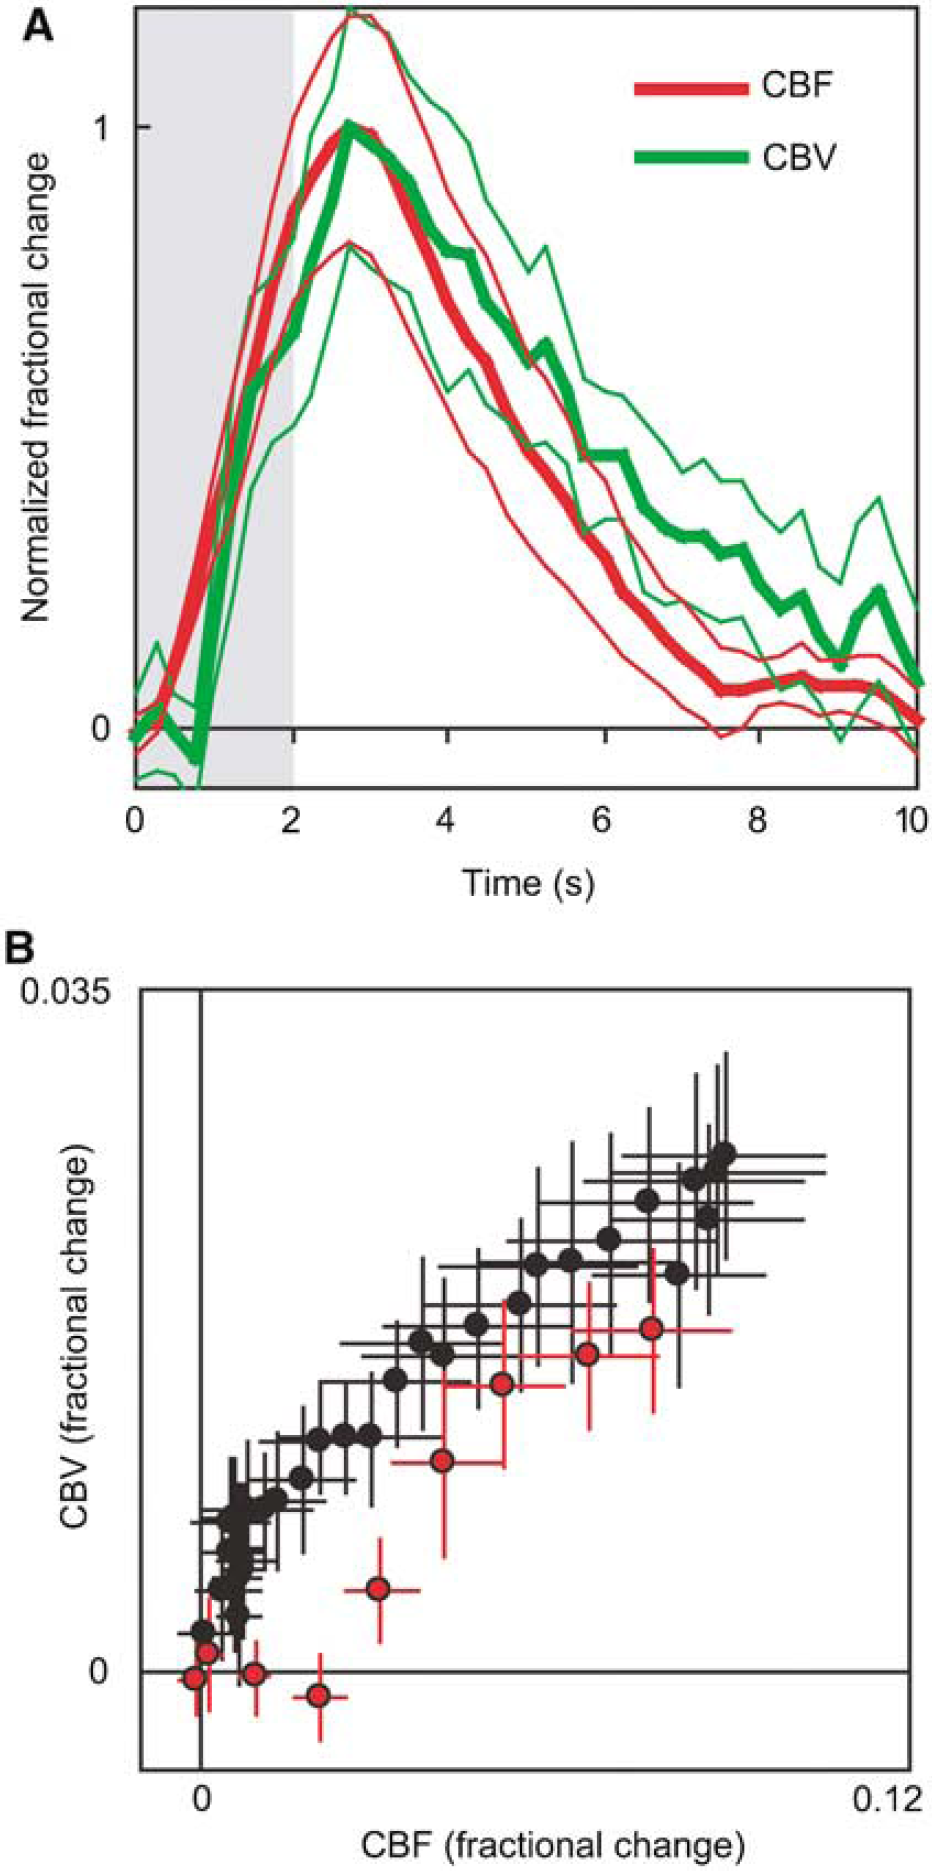
Cerebral blood flow versus volume temporal comparison. (
Acquisition of simultaneous flow and volume data allowed us to calculate the power law coefficient for Grubb's relationship: CBV = CBFφ (Grubb et al, 1974). We determined φ over the entire time course of the response by taking the slope of the log-log plot of the data in Figure 4B. For the data in Figure 4, we obtained a value of φ = 0.26. Including the data from all five stimulation frequencies produced a value of φ = 0.38.
Spatial Extent and Neuronal Activity
To compare the spatial extent of functional HbO2, Hbr, and Hbt responses over all subjects, we calculated a linear measure of the area covered by each response. Figure 5 shows the spatial extent of each hemodynamic response at three time points, t = 1.5, 2.0 secs, and t = peak. As expected, the spatial extent of all responses increases over time, but response size is not uniform across etiology. Functional activation evokes a peak response size of 1.01 ± 0.66 mm for HbO2, 0.55 ± 0.16 mm for Hbr, and 0.68 ± 0.41 mm for Hbt. At the peak time point, the difference between HbO2 and Hbr spatial extent is significantly different (P<0.05, two-tailed t-test). Other comparisons within each time point fail to meet criteria for statistically significant difference. This trend suggests a larger vascular point spread for HbO2 relative to Hbr and Hbt across the temporal evolution of the responses.
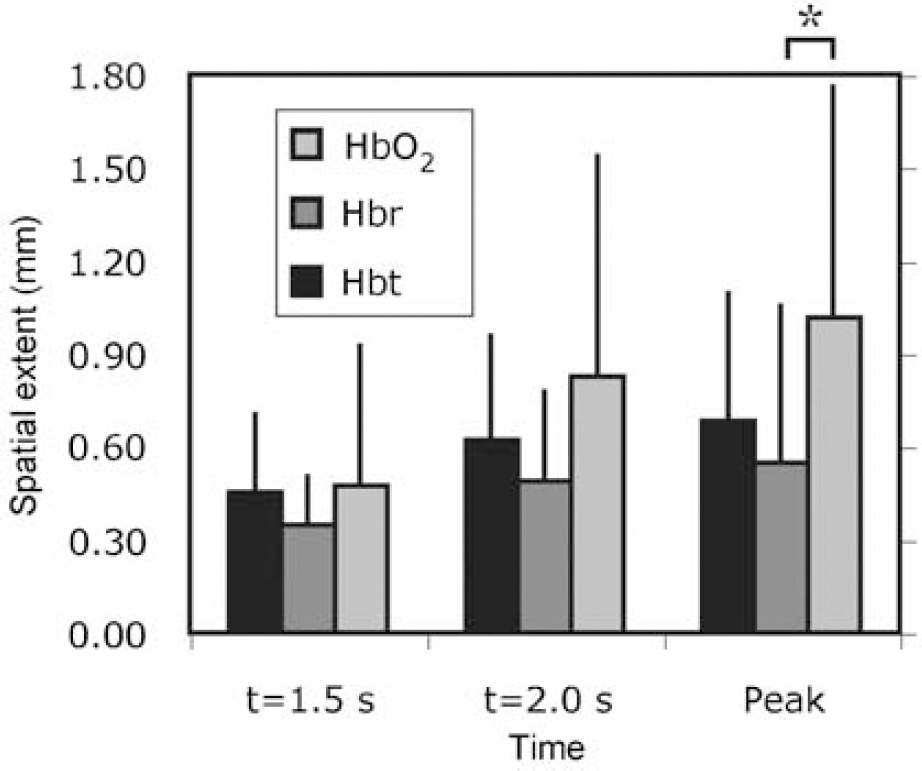
Hemodynamic spatial extent. The spatial extent of hemodynamic responses increased over time, but not uniformly across etiology. The HbO2 response was significantly larger than that of Hbr at the peak time point (*P<0.05), with a similar trend at other times, implying a larger vascular point spread for HbO2 than other hemodynamic parameters. Error bars denote inter-subject standard deviation.
We investigated how the spatial extent of hemodynamic responses scales with graded neuronal activation during varied frequency of stimulation. Decreasing stimulation frequency leads to increased spatial extent of peak responses, which reached a plateau at 2 to 5 Hz (Figure 6A). To determine whether these variations in spatial spread are related to underlying neuronal activity, we recorded field potentials concurrently. Summed field potential (ΣFP) magnitude increases with decreasing stimulation frequency, similar to hemodynamic responses. A correlation analysis of hemodynamic response spatial extent and ΣFP (Figures 6B-6D) suggests a linear relationship between the two for all three responses. These paired data are well fit by a linear model constrained to pass through the origin (HbO2: r2 = 0.93, P<0.01; Hbr: r2 = 0.96, P<0.005; Hbt: r2 = 0.96, P<0.005).
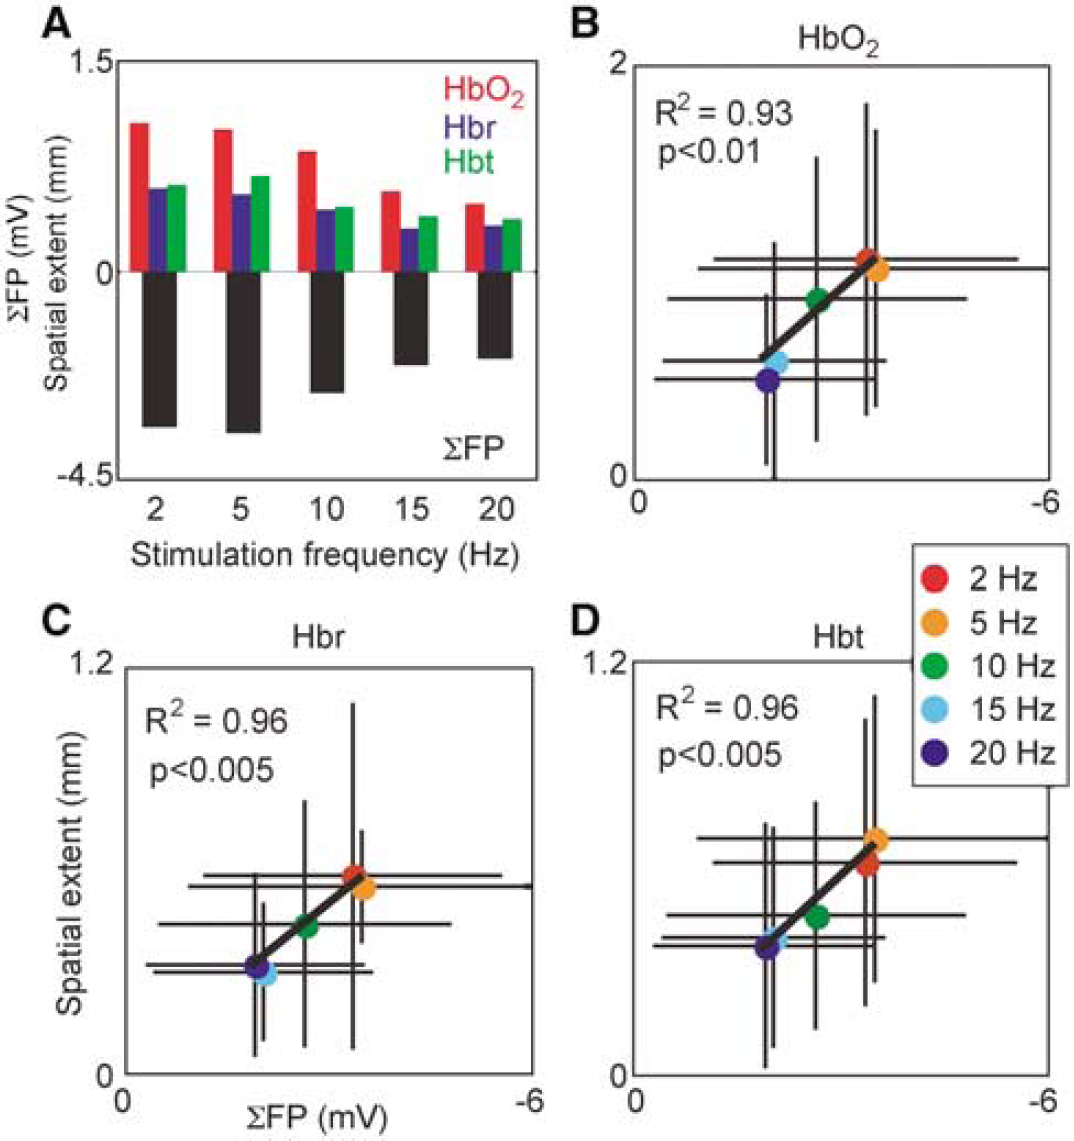
Spatial extent scaling with graded neuronal activity. Spatial extent was measured as the square root of the area covered by significantly activated pixels, and neuronal activity quantified with summed field potentials (SFP). (
Conclusion
The application of spectroscopic analysis to two-dimensional optical imaging data has been used before by us (Sheth et al, 2002) and others (Devor et al, 2003). This report, however, extends previous findings by combining several perfusion-based and electrophysiologic measurements to critically assess spatiotemporal characteristics of hemodynamic responses and their relationship to underlying neuronal activity. Our results suggest that functional hemodynamic changes colocalize during the first few seconds after the onset of neuronal activity. They subsequently evolve with distinct spatial and temporal characteristics, with CBV changes propagating retrograde into feeding arterioles, and oxygenation changes anterograde into draining veins. Changes in the spatial extent correlate with integrated field potentials, suggesting that the mechanisms responsible for hemodynamic spatial spread scale with synaptic activity.
Two-Dimensional Optical Spectroscopic Imaging
Optical intrinsic signal imaging offers the best combination of simultaneous high spatial and temporal resolution for observing functional hemodynamic changes (Pouratian et al, 2003). Single wavelength reflectance changes are mixed signals, however, incorporating a complex contribution of hemodynamic responses. Although isosbestic wavelengths (equal absorption of HbO2 and Hbr; 549, 569, 586 nm) emphasize CBV changes and 600 nm range signals emphasize oxygenation changes (Frostig et al, 1990; Malonek and Grinvald, 1996), these assignments are approximations. In reality, changes in both blood volume and oxygenation affect light reflectance, as does attenuation due to scattering, making isolation of individual hemodynamic processes difficult with single wavelength imaging. Optical intrinsic signal spectroscopy effectively distinguishes between contributions of HbO2, Hbr, and Hbt by fitting reflectance spectra to an appropriate model, but provides at most one dimension of spatial information (Malonek et al, 1997). Thus, spectroscopy alone does not permit investigation of spatial changes and evolution within different vascular compartments.
We combined the advantages of both techniques by analyzing multiwavelength images with a spectroscopic approach. Optical spectroscopic imaging provides changes in physiological parameters over two spatial dimensions. By calculating changes in HbO2, Hbr, and Hbt, we examined the spatiotemporal evolution of functional CBV and oxygenation changes with high resolution across various parenchymal and vascular compartments. The time course of changes in hemodynamic parameters we observed is similar to what others have measured using traditional spectroscopy (Jones et al, 2001; Lindauer et al, 2001; Malonek et al, 1997).
Spatiotemporal Evolution of Functional Hemodynamic Responses
Functional hemodynamic responses originate from a common focus and subsequently propagate over time both anterograde and retrograde through vascular structures. For the first 2 to 3 secs, CBV and oxygenation changes colocalize within the center of activation. This finding provides direct evidence that early functional hemodynamic responses match neuronal activity with high spatial precision. This specificity is consistent with our previous observation of colocalization between hemodynamic signals and individual whisker barrels (Sheth et al, 2004a).
Spatial specificity and colocalization diminish over time as the response evolves. After 5 to 6 secs, perfusion changes propagate from the microvasculature near the active region to larger surrounding vascular structures. We observed CBV increases in pial arterioles lagging slightly behind central changes, consistent with observations of delayed upstream vasodilation (Iadecola et al, 1997). An increase in diameter of upstream vessels would decrease resistance and provide increased downstream flow (Duling et al, 1987; Iadecola et al, 1997). Whether the flow increase is necessary to meet metabolic demand or simply a consequence of neurotransmitter release remains to be determined (Attwell and Iadecola, 2002; Bonvento et al, 2002).
We occasionally observe the initial dip in individual subjects, but under our experimental conditions, it usually does not meet criteria for statistical significance when averaged across subjects (Sheth et al, 2004b). Likewise, we were unable to generate reproducible functional maps based on the dip in this study. Previous studies have been similarly divided over the issue of the reproducibility and physiological significance of the dip (Kim et al, 2000; Logothetis, 2000).
Because the dip likely represents accumulation of Hbr because of increased oxygen metabolism preceding the onset of flow (Thompson et al, 2003; Vanzetta and Grinvald, 1999), its size is intimately related to the size and rapidity of the flow response. In situations promoting a rapid flow response, a local decrease in oxygen saturation would be quickly reversed by the influx of oxygenated blood. If the flow response were slower, however, Hbr could increase significantly before the flow-induced reversal. Support for this hypothesis is provided by comparing our data with those of Jones et al (2001). Their observed flow changes (onset time ~1.0 sec, their Figure 5B) begin approximately 0.6 secs after ours (onset time, 0.40 ± 0.14 secs). Correspondingly, they reliably detect a dip, whereas we do not. Differences in baseline physiologic variables such as arterial pO2 (Kashikura et al, 2001; Matsuura et al, 2001) and pCO2 (Cohen et al, 2002), anesthesia (Ueki et al, 1992), vascular architecture (Harrison et al, 2002), or other effects may influence CBF temporal dynamics and thereby partially explain the observed inconsistencies in size and presence of the dip.
By 4 to 5 secs after stimulation onset, CBV and oxygenation changes are almost completely segregated into arteriolar and venous compartments, respectively. Central response magnitude is smaller than that in vessels, and the spatial profile emphasizes vascular structures more than a millimeter from the central focus. Increases in venous volume and oxygenation are likely a result of passive filling of high compliance vessels (Buxton et al, 1998; Mandeville et al, 1999b). Consistent with this idea, relative response ratios of HbO2 and Hbr suggest that hemodynamic signals ‘overspill’ metabolically active areas into surrounding vasculature.
The temporal comparison between CBV and CBF dynamics demonstrated a slower return to baseline for CBV. This pattern has been observed before and is likely involved in producing the poststimulation BOLD fMRI undershoot (Buxton et al, 2004; Mandeville et al, 1999a). Our value of 0.26 for the power law constant φ in the Grubb relation falls within the range of 0.18 to 0.29 when short stimuli are employed (Jones et al, 2001; Mandeville et al, 1999b; Sheth et al, 2004b). Across all stimulation frequencies, however, the value was 0.38, somewhat outside the range but identical to the original report (Grubb et al, 1974). These results suggest a variable relationship between CBF and CBV that should be considered when converting between the two or modeling the BOLD response.
Neurovascular Coupling
By recording field potentials simultaneously with hemodynamic signals, we obtained a measure of synaptic activity evoked by the stimulation, since field potentials are thought to reflect the weighted sum of postsynaptic currents (Mitzdorf, 1987). The degree to which hemodynamic responses propagate both retrograde and anterograde increases with increasing synaptic activity. Spatial extent scales linearly with field potential magnitude, suggesting that the mechanisms mediating vascular propagation are graded proportionally to synaptic activity.
An important question is whether this vascular spread is simply the result of imprecise flow control or actually reflects underlying neuronal activity. Previous studies have shown that optical intrinsic signal imaging is sensitive to not only suprathreshold but also subthreshold cortical activity (Das and Gilbert, 1995; Toth et al, 1996). Therefore increasing lateral propagation of subthreshold activity could account for the vascular spread. In vivo evidence for horizontal spread of neuronal excitation has recently been provided in rat barrel cortex. Layer IV neurons receiving thalamocortical input project to layer II/III neurons vertically in the same barrel, without horizontal spread. Layer II/III neurons share long-range horizontal connections, allowing excitation propagation laterally within layer II/III. Using whole cell recordings and voltage sensitive dye imaging, Petersen et al (2003) showed that subthreshold activity in layer II/III spreads through horizontal connections in a stimulus strength-dependent manner. In our data, decreasing stimulation frequency led to increasing synaptic activity. This increasing activity in layer IV would be transmitted to layer II/III, resulting in greater horizontal excitation spread. This evidence suggests an electrophysiologic basis for the positive correlation between synaptic activity and vascular spread. It does not, however, rule out the potential additional contribution of passive vascular ‘overspill’ (Malonek et al, 1997; Narayan et al, 1995). The difference in spatial extent of HbO2 versus Hbr and Hbt responses, for example, would be difficult to reconcile with a purely neuronal explanation.
Implications for Functional Brain Imaging
Using perfusion-based imaging techniques to study fine-scale functional brain organization requires using spatially specific aspects of the hemodynamic response. Studies to date have focused on investigating different etiologic aspects of the hemodynamic response to determine which offers the closest localization to active areas of cortex. The spatial specificity of conventional T*2 gradient echo BOLD fMRI is limited to a few millimeters, unless differential imaging is employed (Ugurbil et al, 2003). Differential imaging refers to the process of subtracting from the response to a particular stimulation the response to an orthogonal stimulation (e.g., the response in visual cortex to vertical gratings from the response to horizontal gratings). This technique enhances specificity by removing common response elements and increasing the contrast between active and inactive regions. With the aid of differential imaging several studies have demonstrated submillimeter specificity with T*2 BOLD fMRI (Cheng et al, 2001; Goodyear and Menon, 2001; Menon et al, 1997; Menon and Goodyear, 1999). The disadvantage of differential imaging, however, is its presumption and requirement of orthogonal stimulation conditions, which are often unavailable or unknown a priori.
Further studies have identified other aspects of the hemodynamic response that provide columnar accuracy with single condition maps (i.e., without differential imaging). The putative relationship between the initial dip and oxygen metabolism has led some to suggest that the dip may offer improved spatial specificity (Malonek et al, 1997), and a subsequent fMRI study demonstrated this capability (Kim et al, 2000). Other groups, however, either fail to detect the dip (Mandeville et al, 1998; Marota et al, 1999; Silva et al, 2000), or are unable to generate reproducible maps (this study and Logothetis, 2000), possibly because of its sensitivity to anesthetic level and biologic fluctuations (Buxton, 2001; Cohen et al, 2002; Lindauer et al, 2003). Recent work has also shown that the flow (Duong et al, 2001) and volume (Sheth et al, 2004a) components of the hemodynamic response can provide spatial specificity sufficient to resolve submillimeter functional architecture.
Although response etiology is an important determining factor for spatial specificity, we suggest that response timing is equally influential and should be carefully considered in the experimental design. The most advantageous epoch for mapping can be chosen by taking advantage of the spatiotemporal properties of hemodynamic changes. Our results show that both CBV and oxygenation changes begin colocalized in the response center. Over time, the signals increase not only in size, but also in vascularity, predominating in arterioles and veins distant from active cortex. Thus optimal spatial specificity might be achieved by restricting imaging to early periods (~2 to 3 secs after stimulation onset), whether focusing on oxygenation or volume responses. This advantage has to be balanced against the decreased contrast to noise ratio available from imaging pre-peak signals.
We previously showed that columnar accuracy can be achieved not only during the initial dip, but also during the early part of the hyperoxygenation phase (Sheth et al, 2004a). Our current results extend this finding by directly visualizing the evolution of oxygenation changes with high resolution. Although early oxygenation changes did not reliably include an initial dip under our experimental conditions, early hyperoxygenation changes were still well-localized. Recent BOLD fMRI studies support this concept, showing that ocular dominance columns might be resolved by using the first few seconds of the response, which may include either the initial dip (Duong et al, 2000) or early hyperoxygenation (Menon and Goodyear, 1999).
To investigate the spatiotemporal evolution of functional volume and oxygenation changes with high resolution, we applied spectroscopic analysis techniques to optical images. Two-dimensional optical intrinsic signal spectroscopic imaging revealed an early focus of overlapping hemodynamic responses. With a short lag, volume and oxygenation responses propagate retrograde into feeding arterioles and anterograde into draining veins, respectively, increasing in area proportionally to neuronal activity. These results suggest that early microvascular changes in volume and oxygenation localize to active neural columns, providing a window of opportunity 2 to 3 secs wide within which spatially specific functional brain mapping might be conducted.