
Abstract
Local cerebral blood volume (CBV) and capillary flow changes in regions of depolarizing neurons during K+-induced cortical spreading depression (CSD) in the cerebral cortex of α-chloralose-urethane-anesthetized rats were examined employing a transillumination (550 nm) video system. Capillary flow was calculated as the reciprocal of mean transit times of blood in pixels of 40 μm × 40 μm, each of which contains a few capillaries. Potassium microinjection into the cortex evoked repetitive wave-ring spreads of oligemia at a speed of ca. 2.33±0.48 mm/min. During the spread of CSD, tracer (either saline or carbon black) was injected into the internal carotid artery. Colocated with the oligemic wave, we detected capillary flow stop as evidenced by disappearance of the hemodilution curves. At any location in the region of interest within the cerebral cortex, we observed cyclic changes of capillary flow stop/hyperperfusion in synchrony with oligemia/hyperemia fluctuations. The initial flow stop and oligemia were ascribed to capillary compression by astroglial cell swelling, presumably at the pericapillary endfeet, since the oligemia occurred before larger vessel changes. We conclude that local depolarizing neurons can decrease adjacent capillary flow directly and immediately, most likely via astroglial cell swelling, and that the flow stop triggers upstream arteriolar dilatation for capillary hyperperfusion.
Keywords
Introduction
The relationship between neuronal functional changes and blood flow changes, and the mechanisms involved, remains unknown (Tomita et al, 2002). Cortical spreading depression (CSD) could provide a good experimental model to examine the relationship between neuronal depolarization and flow changes. Although there have been abundant reports on vascular changes and flow changes during CSD in the literature (Back et al, 1994; Dreier et al, 2001; Duckrow, 1993; Dunn et al, 2001; Fabricius et al, 1995; Hansen and Lauritzen, 1984; Leão and Morrison, 1945; Marshall, 1959; Nielsen et al, 2000; Van Harreveld and Stamm, 1952), the findings were rather inconsistent, especially with respect to early local flow changes.
This communication describes a comprehensive examination of capillary flow changes in the cerebral cortex during K+-induced CSD (neuronal depolarization) by employing a new optical method with a high spatial resolution which has recently been developed by us (Schiszler et al, 2000).
Materials and methods
Experiments were performed on 10 Sprague—Dawley rats under α-chloralose-urethane anesthesia. The optical method employed here was as reported elsewhere (Schiszler et al, 2000). A transillumination technique was applied, despite possible damage arising from optical fiber insertion into the brain tissue, because any changes in the light transmission (LT) at λ=550±10 nm, one of the isosbestic points of hemoglobin, are attributable to changes in cerebral blood volume (CBV) (Tomita M et al, 1978). Images of the brain surface in a 2 mm × 2 mm region of interest (ROI) were focused with a Nikon lens and monitored with a silicon intensified target (SIT) camera (Hamamatsu Photonics, Hamamatsu, Japan). The transilluminated cortical images were continuously recorded on videotape at 30 frames/s (30 Hz) or fed into a personal computer through a Scion LG-3 frame grabber card (Scion Corporation, MD, USA) with 5122 pixels at various acquisition rates (0.5 to 15 Hz). The acquired images in the Scion frame grabber card were automatically scaled logarithmically in topographical brightness to 8-bit images, and displayed as pictures on the 256 gray scale. Frame-by-frame subtraction between two pictures at 0.5-sec intervals was performed to visualize clearly the wave-ring image because of the CBV changes and arteriolar diametric changes during CSD.
After a 1-h period to allow for recovery from the stress of optical-fiber insertion, K+ solution (a few μL, 500 mmol/L) was microinjected at a depth of ca. 1 mm into the cortical parenchyma at the center of the ROI through a glass micropipette (originally constructed for intracellular injection). During continuous video-recording of the ROI after CSD induction, 25 μL of saline (a negative blood indicator) in 6 rats and diluted carbon black solution in 2 rats was injected as a spike into the internal carotid artery via a catheter inserted into the external carotid artery. The principle and assumptions underlying the measurements of flow in a ‘pixel’ (100 averaged Scion pixels) were as follows. A pixel of 40 μm × 40 μm should contain only a few capillaries, since average intercapillary distance is 22 μm when calculated from the rat cortical microvasculature moulded in a Mercox cast (MT, unpublished observation). The mean transit time (MTT) calculated from the hemodilution curve represents the reciprocal velocity of blood passing through the capillaries in the pixel. The hemodilution curves for all the individual pixels of a 50 × 50 matrix in the ROI were analyzed with Matlab software (The MathWorks, Inc., Natick, USA) to evaluate the MTTs by employing a customized algorithm of the area/height of hemodilution curves (MTT=∫t ΔLT(t) dt/∫ΔLT(t) dt, where ΔLT is the light transmission change in a pixel). The reciprocal mean transit time (1/MTT) was taken to represent the capillary flow (either transit of red blood cells (RBC) when saline is used or plasma transit when carbon black is used), which was arranged in appropriate coordinates to construct a two-dimensional (2-D) flow map with the aid of our own software, KEIO-IS1. The 2-D flow map so constructed had a resolution of 625 flow values/mm2, which is ca. 500-fold higher spatial resolution than that of conventional laser-Doppler flowmetry. We noticed that near-zero flow values thus calculated were either incorrectly estimated by the software, which automatically included small baseline fluctuations into the height for MTT calculation, or were uncalculated because zero was divided by zero (0(t ΔLT(t))/0(ΔLT(t))) with no build-up of hemodilution curve. In the latter case, the capillary flow must be 0, whereas the computer automatically yielded a certain value based on noise. To avoid further artificial error, no correction was made to the values in Table 1.
Parameters in early flow changes
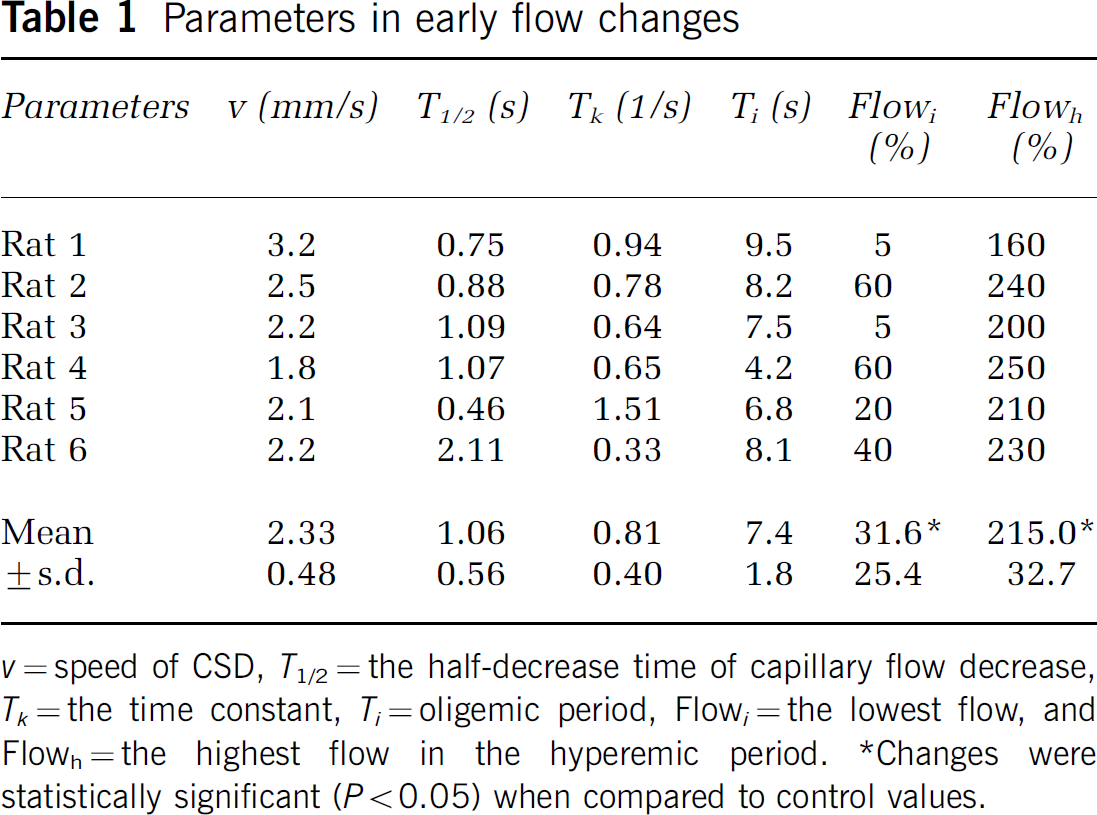
v=speed of CSD, T1/2=the half-decrease time of capillary flow decrease, Tk=the time constant, Ti=oligemic period, Flow i =the lowest flow, and Flowh=the highest flow in the hyperemic period.
Changes were statistically significant (P<0.05) when compared to control values.
Rapid changes in capillary flow at the very beginning of neuronal depolarization were examined as follows. Since a 2-D map during CSD depicts a series of changes from ‘no flow’ to subsequent hyperperfusion in a panoramic view, a plot profile of capillary flow changes along a line passing through the injection site could broadly be concomitant with CSD propagation towards the periphery. The conversion of the distance/time scale was made by using the speed of individual CSDs in mm/sec (CSD velocity (v)). Thus, determined parameters were the time constant of initial flow decrease (T k in 1/s) calculated from the half-decrease time (T1/2 in secs) assuming an exponential decay, the oligemic duration (T i in secs), the relative change in low flow level (F i in %), and the subsequent hyperemic level (Fh in %). These changes were examined for statistical significance using the nonparametric Wilcoxon signed rank test. No correction was made for overestimation of F i due to baseline noise as mentioned above.
Results
General Description of Cortical Spreading Depression
As described in our previous report (Tomita Y et al, 2002), K+ injection into the cerebral cortex produced, after a latency of several minutes, a concentric light wave-ring spread as shown in subtraction pictures (Figures 1A to 1C). The K+ injection immediately created a dark spot of ca. 100 μm in diameter, which was hardly visible to the naked eye, at the site of injection. The spot changed its shape polymorphically with time and sometimes seemed to be ‘boiling’. After a period of several seconds to a couple of minutes, a corona-like white projection at the edge of the dark spot started to appear and fused into a concentric ring of increased LT. As shown, the ring gradually increased in diameter, propagating peripherally, like the ripples evoked by a stone dropped into a pond. This was followed by a wide dark band, forming an expanding doughnut shape. The presence of pial vessels did not influence the wave-ring propagation. A few minutes after the first sequence, a second sequence of wave-ring spreading from the same ‘boiling’ center started. The individual expanding concentric rings were slightly different in width and darkness, but the expansion was concentric with respect to the area stimulated by K+ injection. The dynamic wave-ring spread was repeated at intervals of 2 to 5 mins for more than 30 mins in 3 rats. The spread speed was 2.33±0.48 mm/min (mean±s.d.). Since the cortex was transilluminated by light at a wavelength of 550 nm, the spreading light ring was considered to be due to a blood volume decrease (oligemia), followed by a wide, dark band of blood volume increase (hyperemia). Approximately >5 secs after the CSD induction, there appeared thread-like structures of presumably arteriolar diametric changes (constriction or dilatation) during a period within the 0.5-sec frame interval, as seen in the frame-by-frame subtraction picture B of Figure 1. It should be noted that the arteriolar changes occurred after, not before, the tissue oligemia had started. In three other rats, the spread was abortive: the dark band appeared, but gradually subsided, and finally disappeared. We failed to produce CSD in two rats because of bleeding and inappropriate K+ injection, and to measure MTT in two rats because of failure of catheter insertion into the external carotid artery.
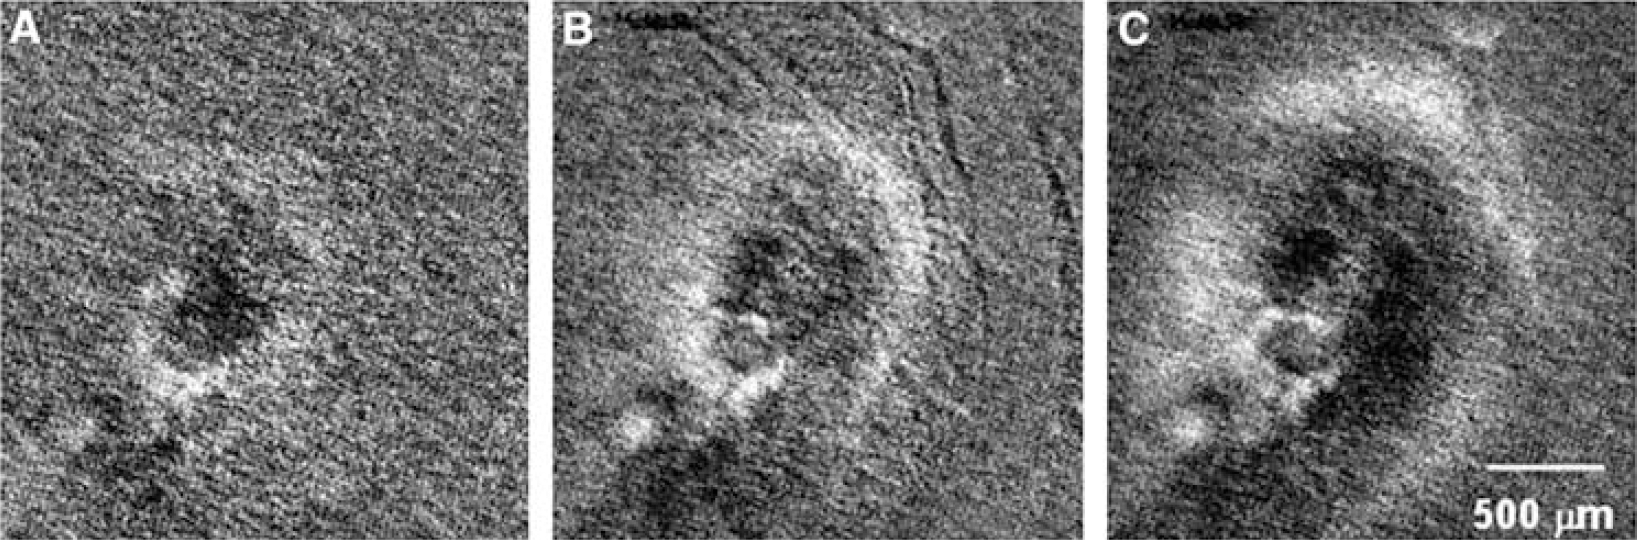
Frame-by-frame subtraction pictures at intervals of 0.5 sec to show wave-ring spread of light transparency (a decrease of CBV) at a speed of 3 mm/min. Vascular diametric changes of small vessels are seen at 8 secs after CSD induction.
During passage of the wave-ring spread, no bulge or dent of the brain surface was observed by employing reflected light.
Capillary Flow Changes with Cortical Spreading Depression
Saline injection into the internal carotid artery yielded 2500 hemodilution curves in the ROI of the rat brain. All hemodilution curves are included in Figure 2, where continuous LT traces (the intensities of the transmitted light through the cortical tissue layer) were recorded from 2500 pixels during the first CSD spread. There were five arrays of sharp waves (hemodilution curves A, B, C, D, and E) induced by the saline injections. The height of the curves reflects the amount of saline and therefore the blood distributed to the area at that moment (Tomita M et al, 1983). The distribution displayed a tremendous variability at different locations and different moments during the CSD spread, contrasting with the rather even distribution under control conditions. At the time points indicated by arrows A and C in Figure 2, the upper part of the traces reveals no buildup of hemodilution curves, implying that blood was not supplied to the area where the light wave with CSD was just passing. This implies that capillary perfusion was halted in the area at that moment. However, at the following moments, for example, at times B, D, and E, the same area began to receive blood supply. Such on-and-off tidal capillary flow changes with CSD in time and space were seen at any spot in the surrounding cerebral cortex. The appearance of hemodilution curves and the level of the baseline brightness were fairly well correlated, except for a certain refractory period. Figure 3 (left) depicts the 2-D capillary flow map, where the wavefront of a low flow ring showing a decrease is mostly colocated at the light ring area of oligemia. The low flow band was followed by a high flow band with a more than two-fold increase in capillary flow with high CBV. Figure 3 (right) shows a 2-D capillary flow map based on carbon black dye dilution curves, which exhibits more clearly a low-flow (dark) ring followed by a high-flow (hyperemic) band. The average flow values in Figure 3 (right) were lower than those of Figure 3 (left) due to the low tissue hematocrit (flow values obtained by using carbon black (plasma indicator) were ca. 66% lower than those obtained by saline (RBC (negative) indicator) (Tomita and Gotoh, 1982).
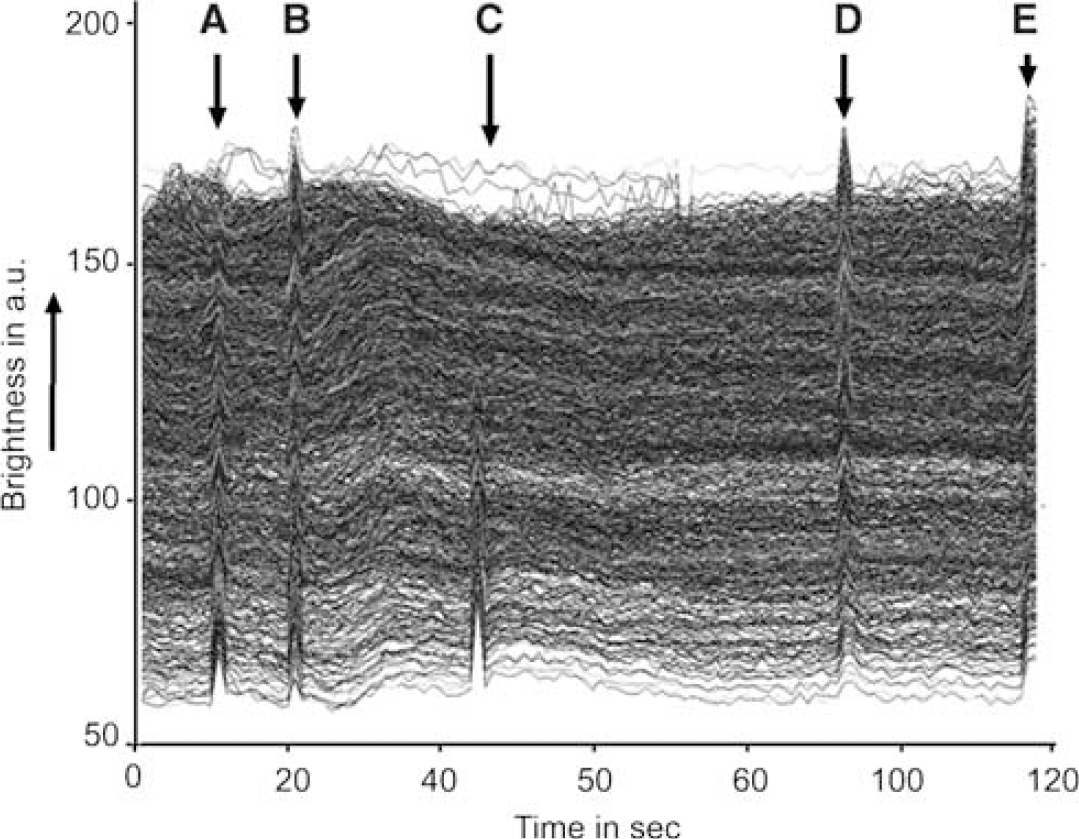
Records of 2500 LT traces at pixels containing a few capillaries in the cerebral cortex for 120 secs. Upward direction is brighter. Baselines fluctuate because of irregular RBC transits. Note that hemodilution curve buildups are not uniform, depending on oligemic wave passage. Intracarotid saline injections were made five times at (
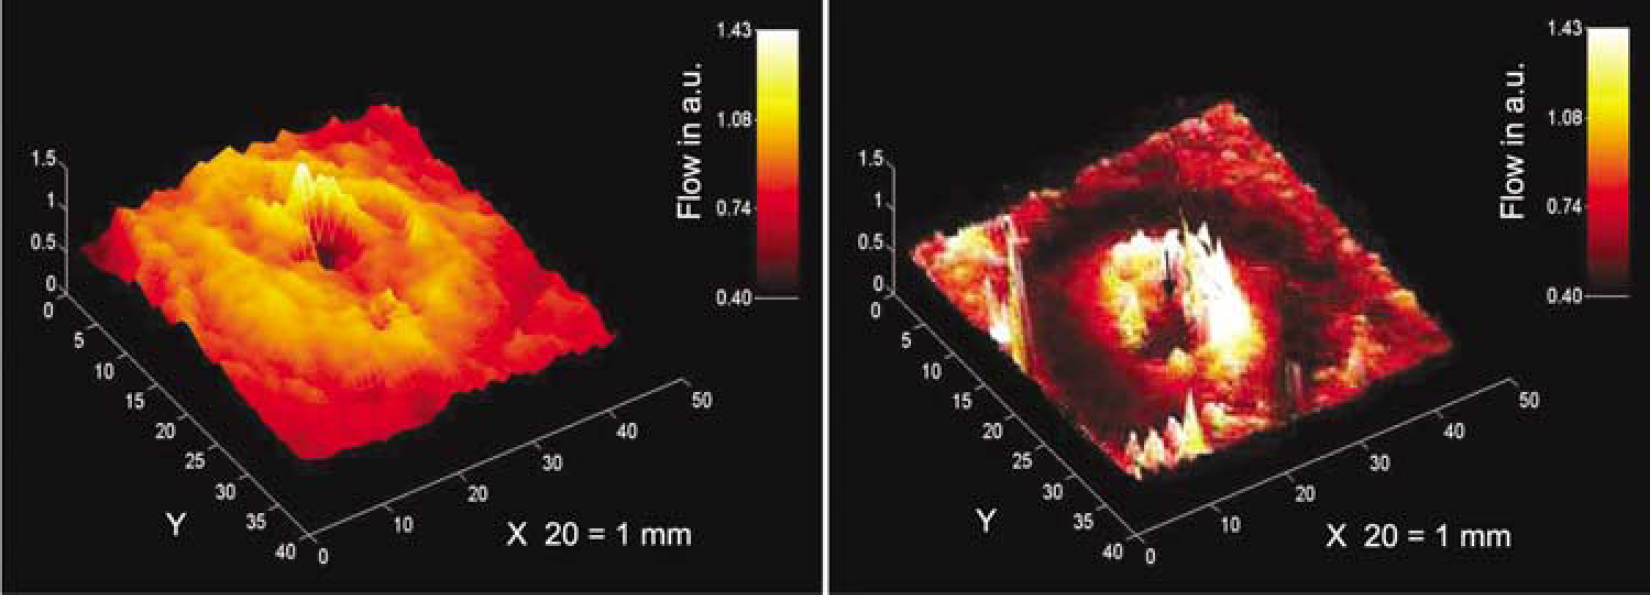
Three-dimensional capillary flow maps in the ROI reconstructed from 2500 capillary flow values (reciprocal MTTs) which were calculated from hemodilution curves after intracarotid saline injection (left) and diluted carbon black injection (right) during CSD. Note the wave-ring shape of capillary flow changes. The ordinate is blood flow in arbitrary units (a.u.). Note that flows obtained from carbon black dilution curves are lower than those from saline because of the slowness of plasma (carbon black) transit compared with RBC (saline; negative indicator of RBC) transit, resulting in a lower tissue hematocrit of ca. 66%.
Plot Profile of Capillary Flow and Other Parameters
Plot profiles of capillary flow varied greatly, not only with 2-D capillary flow maps obtained successively in the same rat, but even with line angles in the same flow map. Figure 4 represents the plot profile (time courses) of capillary flow along a line passing through the injection site obtained from six cases studied with saline injection. Calculated parameters are presented in Table 1. As shown, capillary flow immediately decreased in all six cases (P<0.05). The average change was from the control (100%) to 31.6%±25.4%. Subsequently, capillary flow increased markedly in all six cases (P<0.05) to 215.0%±32.7%. If we consider the fact that no dilution curves built up at the lowest point, the flow values must have reached practically 0% (flow stop), even though the computer yielded higher values.
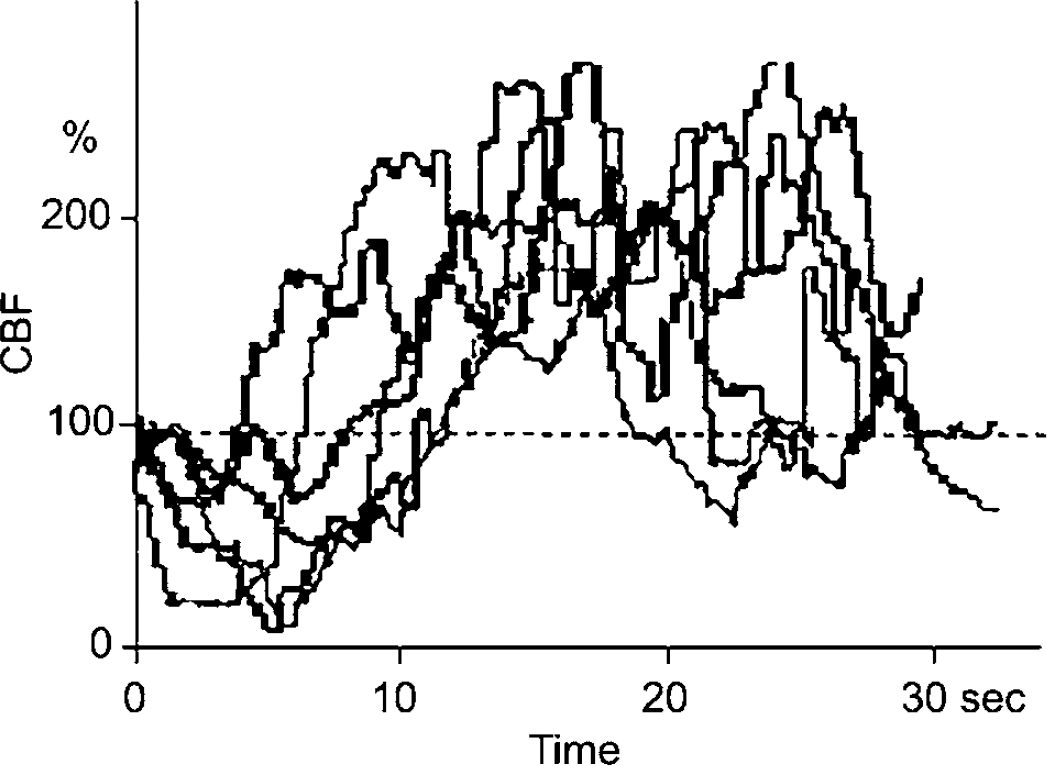
Capillary flow changes on a horizontal line passing through the site of K+-injection are shown. As can be seen, an initial decrease in capillary flow occurred in all six cases (P<0.05), followed by marked hyperperfusion (P<0.05).
Discussion
The essential point of this paper is to show the presence of a moving wave-ring of initial transient oligemic and low (or no) flow in the cerebral cortex during CSD. These oligemic rings appeared to be independent of the locations of arterial arborization or microcirculatory units. Such rapid initial capillary flow changes might have been overlooked in the literature because of the poor spatial resolution of the conventional methods so far employed to study flow. For example, the most commonly used laser Doppler flowmeter, having a probe of 1 mm in diameter, measures only average flow values within the sensitive surface area (one-quarter of the 2-D capillary flow map shown in Figure 3). The laser Doppler flowmeter would miss the subtle local flow changes that we observed, owing to averaging within the area, yielding a variety of changes depending on the location of the probe: an increase, a decrease, or even no change (Tomita M et al, 2001). One may consider that the capillary flow stop could be secondary to upstream arteriolar constriction, as suggested by van Harreveld and Ochs (1957). However, contrary to their proposal of vascular origin, we consider that the oligemic changes were neuronal in origin for the following reasons. (1) Arteriolar changes occurred >5 secs after the onset of tissue oligemia (Figure 1B); (2) the speed of flow decrease to capillary flow stop (time constant of 0.81/s) could not be explained by the upstream arteriolar constriction; (3) the ring distribution of oligemia cannot be explained by arteriolar flow supply; and (4) the oligemic area is narrower than the reported size (500 μm in diameter) of the microcirculatory unit. According to our experience, capillary flow does not stop immediately after arterial occlusion, presumably due to residual vasomotion in the microvascular network. The vasomotion (to-and-fro movements) of RBC in capillaries would persist at least for 20 secs. Our data suggest the change in capillary flow is more directly associated with neuronal inactivation. Among many possibilities, capillary flow redistribution in the microvascular network would occur from time to time due to partial capillary flow resistance changes. We speculate that resistance of individual capillaries in the oligemic region is increased by astroglial swelling coupled with neuronal depolarization. In particular, the pericapillary endfeet processes of astroglial cells would swell and compress embracing capillaries rapidly. Newman (1986) reported that a large fraction of the total cell conductance of astroglial cells for ions is localized at the endfeet processes. This may assist rapid perivascular astroglial swelling. Van Harreveld and Schade (1959) noted that sodium and chloride ions moved from the intercellular space to cellular components during CSD. Van Harreveld (1958) recognized a 30% swelling of apical dendrites of glial cells during CSD. The cell swelling was reported to be explosive when conditions were appropriate, as seen in heart muscle cells (Kloner et al, 1974), as well as in brain cells (Hossmann, 1971) under conditions of severe membrane depolarization and sufficient environmental fluid. Mori et al (2002) recently confirmed that the extracellular space started to decrease at 34 secs after global ischemia and reached half-maximum change at 123 secs. The immediate water shift is due to anomalous osmosis, involving the movement of water into cells coupled with the flow of sodium ions across the cell membrane (Nagasawa et al, 1986; Tomita and Gotoh, 1992; Tomita, 2005, in press). The rapid CBV decrease with ischemia may occur reciprocally with astroglial swelling. When a middle cerebral artery was occluded in cats, we observed a rapid CBV decrease from 6.3 to 5.2 vol% at 20 secs after the occlusion (Tomita et al, 1980), a time which coincides with the time of EEG disappearance (neuronal depolarization). If the astroglial-swelling scenario is correct, the resultant ‘cuff’ compression of capillaries by swollen astroglial endfeet could be so rapid that RBC flow through the capillaries would be virtually halted. The slightest decrease of the capillary lumen would be sufficient to increase flow resistance steeply owing to the inverse Fåhraeus Lindqvist effect (Chien, 1972). Flowing RBC would start to escape the resistant channels toward nearby less-resistant channels in the capillary networks. This might be called a kind of ‘steal’ event from capillaries with higher resistance to surrounding capillaries with lower resistance. Nevertheless, the possibilities of direct contraction of vascular endothelial cells constituting capillaries (Inoue et al, 2003) in response to a rapid signal from depolarizing neurons, and hemorheological events of ‘plasma skimming’ at capillary branches remain to be excluded.
After the oligemic period of approximately 5 to 8 secs, the local tissue underwent hyperemia and hyperperfusion due to arteriolar dilatation, in agreement with previous reports. Many regulatory mechanisms due to arteriolar responses to tissue oligemia through multimodal feedback routes would begin to operate at this point.
Footnotes
Acknowledgments
We thank Professor William I Rosenblum and Professor Konstantin-Alexander Hossmann for their critical reading of the manuscript and helpful suggestions.