
Abstract
An intravital microscopy imaging method was developed to visualize active cerebral thrombus and blood–brain barrier (BBB) disruption using Near Infrared Fluorescent (NIRF) probes. A circular craniotomy was made in CD-1 mice. Thrombi were formed by applying 10%-FeCl3 to the entire exposed superior sagittal sinus (SSS, 5 mm), or to the posterior 2.5 mm of the SSS for 5 mins. Control animals were pretreated with heparin (50 U/kg) before thrombus induction. Three hours after thrombus formation, a FXIIIa-targeted NIRF imaging probe (A15) was intravenously injected, and the SSS was imaged by intravital microscopy. This was followed by injection of indocyanine green (ICG) to assess BBB permeability. The A15 optical probe bound to thrombus, and the fluorescent signal emitted by the bound agent corresponded well with histologically confirmed thrombus. A15 initially remained intravascular, followed by excretion and subsequent decrease in all tissues except for thrombus, where it was retained. The subsequent ICG was also intravascular immediately after injection, but then began to leak into the cerebral parenchyma at 3 to 5 mins. The sites of leakage were adjacent to thrombosed areas. Heparin pretreatment prevented thrombus formation and reduced ICG leakage significantly. This demonstrates the feasibility of simultaneous in vivo monitoring of thrombus and BBB permeability in an animal model of cerebral venous thrombosis.
Keywords
Introduction
Activated factor XIII (FXIIIa), a thrombin-activated tetrameric transglutaminase, crosslinks fibrin strands in clots, and thus mediates fibrinolytic resistance. Activity of this enzyme is a hallmark of newly formed thrombi (Muszbek et al, 1999, Robinson et al, 2000). Recently, we have developed a near-infrared fluorescent probe (A15) that is recognized by activated FXIII (Tung et al, 2003). It covalently binds to fibrin, providing unique specificity and the means to image the activity of the enzyme as well as to visualize thrombus in vivo (Jaffer et al, 2004a).
In this study, we investigated the feasibility and potential use of the FXIIIa probe in the study of cerebral venous thrombosis (CVT). Cerebral venous thrombosis is an underestimated cause of stroke with a reported mortality of 8% at major centers (Ferro et al, 2004). Venous obstruction leads to cerebral edema and parenchymal dysfunction, and can be complicated by infarction and/or hemorrhage (Allroggen and Abbott, 2000). CVT has a wide clinical spectrum of presentation with fluctuating symptoms and an unpredictable outcome (Renowden, 2004), complicating the clinical assessment and treatment of these patients. Therapy is directed at reducing clot burden, and can be complex, ranging from several available anticoagulant pharmacotherapies, to invasive neurointerventional catheter thrombolysis (Bousser, 1999; Frey et al, 1999; Witham et al, 1999; Terborg et al, 2004). Extensive thrombosis and severe cerebral edema are known to be poor prognostic factors (Benamer and Bone, 2000).
Vasogenic edema, which closely follows early cytotoxic edema, is the predominating type of edema in CVT (Rother et al, 1996; Keller et al, 1999; Ducreux et al, 2001). It is the consequence of increased venous pressure and disrupted blood–brain barrier (BBB). An imaging method to assess the BBB dysfunction that induces vasogenic cerebral edema as well as the process of cerebral venous thrombosis itself could be valuable in better understanding the disease process.
Indocyanine green (ICG), a water-soluble tricarbocyanine fluorescent compound (Fox et al, 1957), has been used for more than 30 years in tests of cardiac and hepatic function, with a high level of safety (Hope-Ross et al, 1994). It is widely used in clinic for retinal angiography where the extent of retinal edema and vascular damage in exudative chorioretinopathies such as retinal vein occlusion is indicated by ICG leakage and extravasation (Teschner et al, 2003). Indocyanine green is known to bind primarily (95%) to albumin of the vascular space (Cherrick et al, 1960), and thus does not cross the BBB unless it is disrupted (Desmettre et al, 2000). Therefore, ICG was chosen to study the leakage of the damaged BBB.
The current study was aimed to answer specifically: (a) if a fluorescent probe targeted FXIIIa could be used to identify and quantify thrombosis in an animal model of CVT, (b) if this probe would be able to assess the effects of therapeutic interventions such as heparin, and (c) if we could simultaneously visualize the BBB dysfunction because of CVT.
Materials and methods
Animal Model and Study Design
Twelve female CD-1 mice (25 g, Charles River Laboratories, Cambridge, MA, USA) were used in this study. All animal studies were conducted according to institutional guidelines. A cranial window (Christie et al, 2001) and intravascular thrombosis (Jaffer et al, 2002) were created as described previously, with some modifications. Mice were anesthetized with an intraperitoneal injection of ketamine 100 mg/kg and xylazine 10 mg/kg. When further anesthesia was required, half or a quarter of the initial dose was administered. Respiration was regularly checked through the experiment to monitor the viability of the animals. A circular craniotomy (5 mm diameter; from 1.5 mm anterior to 3.5 mm posterior to the bregma) was performed using a high-speed micro-drill with a small steel burr (Fine Science Tools Inc, North Vancouver, Canada), while the animal was immobilized with a stereotaxic frame (David Kopf Instruments, Tujunga, CA, USA). Strips of filter paper measuring 1 × 5 mm2 (Whatman Inc., Clifton, NJ, USA) soaked in 10% FeCl3 were applied to the SSS for 5 mins (full-length thrombosis group, n=4), or a 1 × 2.5 mm2 strip was applied to the posterior part of the SSS (localized thrombosis group, n=4). A glass coverslip (Warner Instruments Inc., CT, USA) was used to cover the craniotomy. Additional animals were pretreated with heparin (50 U/kg intravenously and subcutaneously) right before thrombosis induction as controls (heparin pretreatment group, n=4).
Synthesis of the Factor XIIIa Near-Infrared Fluorescent Imaging Probe (A15)
The chemical synthesis of the FXIIIa-targeted NIRF imaging agent A15 has been described in detail (Tung et al, 2003). Briefly, a well-characterized FXIIIa affinity peptide, Ac-GN13QEQVSPLTLLK24WC, based on the N-terminus of alph-2-antiplasmin (a2AP) was synthesized by solid-phase peptide synthesis and then labeled with a NIR fluorochrome (Alexa Fluor 680C2 maleimide, Molecular Probes, Eugene, OR, USA) via its cysteine side chain. The product was purified using high-performance liquid chromatography, resulting in the final compound A15. The excitation and emission wavelengths of A15 were 679 and 702 nm, respectively.
Intravital Fluorescence Microscopy (IVFM): Imaging Cerebral Thrombus and Blood–Brain Barrier Disruption
At 3 hours after the FeCl3 application, the mouse was placed onto an inverted epifluorescence microscope (Zeiss Axiovert, Thornwood, NY, USA) with a cooled CCD camera (Sensys Phtotometrics, Tuscon, AZ, USA) interfaced to a Macintosh computer. Cerebral vessels were viewed in phase-contrast or NIRF mode (a 660- to 680-nm excitation filter and a 700-nm longpass emission filter, Omega Optical, Brattleboro, VT, USA). After the intravenous injection of A15 imaging agent (5 nmol/150 μL), light (exposure time 1 sec) and serial fluorescence digital 16-bit images (exposure time 3 secs) were obtained at 0, 1, 3, 5, 10, 15, 20, and 25 mins. Then, nine (three in each group) out of the 12 mice received an intracardiac injection of 2% ICG (100 μL, 2 mg). Light (exposure time 1sec) and serial fluorescence images (exposure time 3 secs, a 730- to 750-nm excitation filter and a 780-nm longpass emission filter, Omega Optical) were obtained at 0, 1, 3, 5, 10, 15, 20, and 25 mins.
Tissue Processing
At the completion of the experiment, all except for one that had had respiratory arrest recovered from the anesthesia. They were re-anesthetized and perfused with heparinized saline and 4% cold paraformaldehyde. Brains were harvested and stored in 30% sucrose in PBS at 4°C overnight, immersed in Tissue-Tek OCT compound and frozen on dry ice. Transaxial sections of 30-μm thickness (3.0 mm anterior to 3.0 mm posterior of the bregma) were collected using a cryostat. Sections were stained with hematoxylin and eosin (H&E) to identify intravascular thrombi.
Quantitative Analysis of IVFM Image
IVFM images were analyzed using custom-written software CMIR_Image. The A15 NIRF signal was measured in ROIs placed over the SSS, at the sites where FeCl3 was applied, and their adjacent perivascular background. The NIRF signal intensity was measured in every image of each animal using the same ROIs of thrombus and background. The contrast-to-noise ratio (CNR) was defined as: 100% × (thrombus NIR signal – adjacent background NIR signal)/(adjacent background NIR signal). In each animal, the CNRs were normalized by adjusting the value of the first image at 1 min to 100% and the values at the other time points by the relative ratios.
For the quantification of the signals from ICG leaked out of the cerebral vessels, vascular trees were manually outlined based on the ICG angiogram image at 1 min, before parenchymal extravasation. The area within the outline of vascular trees was masked over each animal's images, and a background ROI (5000 pixels) in the parenchymal area that did not have ICG-leakage signals was defined. Each image was subtracted from the corresponding background ROI. An automatic intensity contour procedure was used to identify all the pixels that have the ICG-leakage signals with intensities greater than the background. The sum of signal intensities of the identified pixels was calculated for every image at each time point in the full-length thrombosis group (n=3) and the heparin pretreated group (n=3).
Statistical Analyses
Data are presented as mean±s.d. Repeated-measures ANOVA was used to compare means acquired at multiple time points in different groups. The Student's t-test was used to compare the mean length of the SSS showing A15 fluorescent signal between localized and full-length thrombosis groups. A value of P<0.05 was considered statistically significant.
Results
Locating Cerebral Thrombus by A15 NIRF probe
To confirm the fluorescence signal of A15 correlated with cerebral thrombus, histopathologic sections of the thrombosed area were carefully prepared, guided by the intravital fluorescence imaging. The coordinates in the intravital images, which were calculated regarding bregma, allowed precise localization of corresponding histopathologic sections. It was found that A15 NIRF signals corresponded very closely with the thrombus within the SSS in the corresponding H&E histology sections (Figure 1).
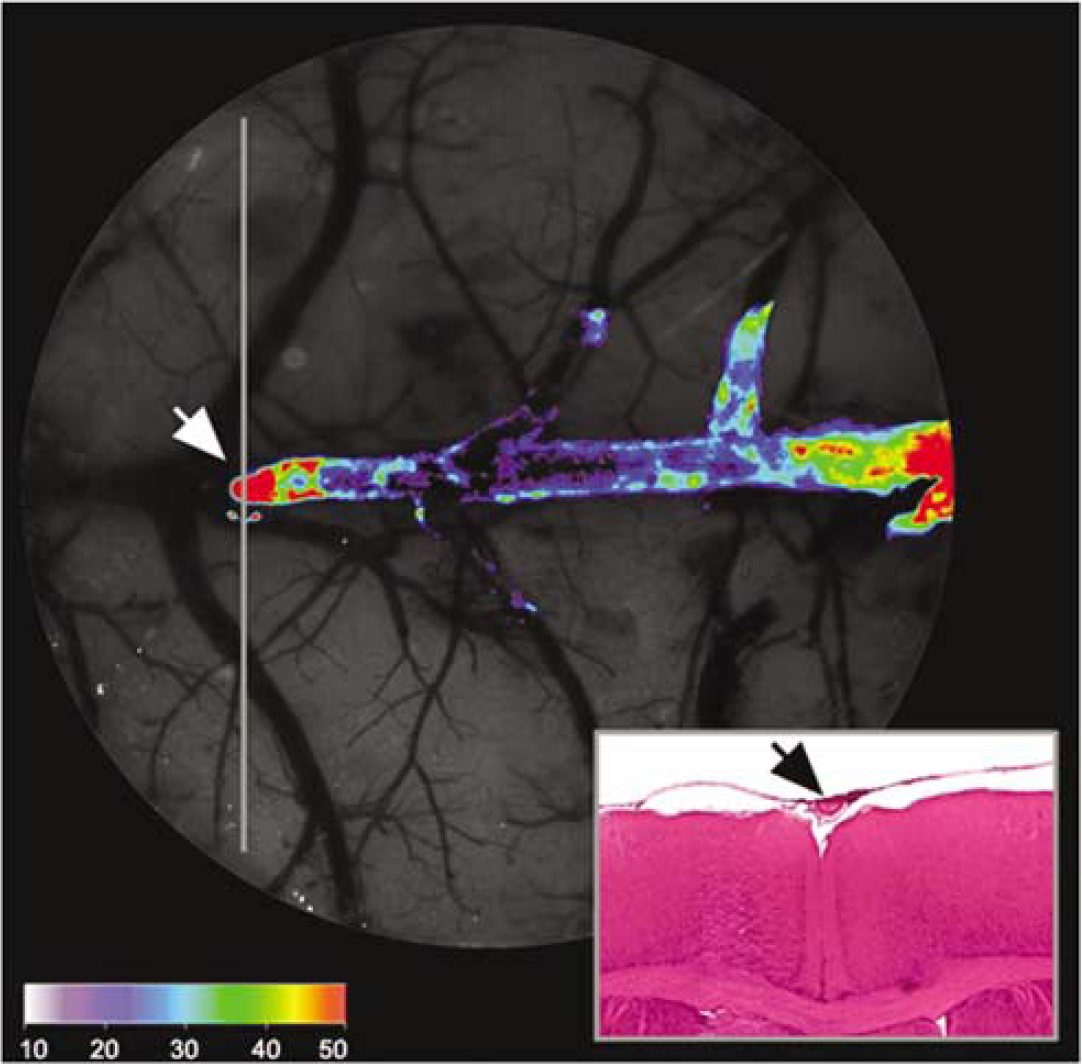
Colocalization of A15 NIRF signals and SSS thrombus. Intense fluorescence signal observed in the intravital fluorescence microscopy image (diameter=5 mm) 25 mins after A15 injection was illustrated in a color map (arbitrary units to represent the pixel intensity range of the overlay fluorescence imaging superimposed on a white light image). The representative H&E stained (inlet) axial section (vertical gray line) of the superficial brain at the location of the frontal tip of the thrombus signal (white arrow) shows corresponding thrombus filling the dural venous sinus (black arrow). In addition to the main body of the thrombus within the superior sagittal sinus, several scattered thrombi are observed in the adjacent vessels.
The animals exposed to FeCl3 at the posterior 2.5-mm portion of the SSS showed fluorescence signal largely limited to this same area of the SSS (Figure 2B), with some anterior extension. By contrast, the other animals, whose entire 5-mm SSS within the craniotomy had been exposed to FeCl3, had the NIR signal in the entire SSS and nearby branching vessels (Figure 2F). Under the original magnification × 2.5, the mid-3-mm portion out of the 5-mm exposed SSS could be covered by the CCD camera of the microscopy system (Field of View; 1316 × 1035 pixels). The mean length of the SSS showing A15 signal was significantly longer in the full-length thrombosis group (2.8±0.3) than in the localized thrombosis group (1.8±0.5, P<0.05, Student's t-test). The fluorescence contrast of the thrombus was similar in both groups (Table 1).
Length and intensity of the thrombus signal in the mid-3 mm of the superior sagittal sinus
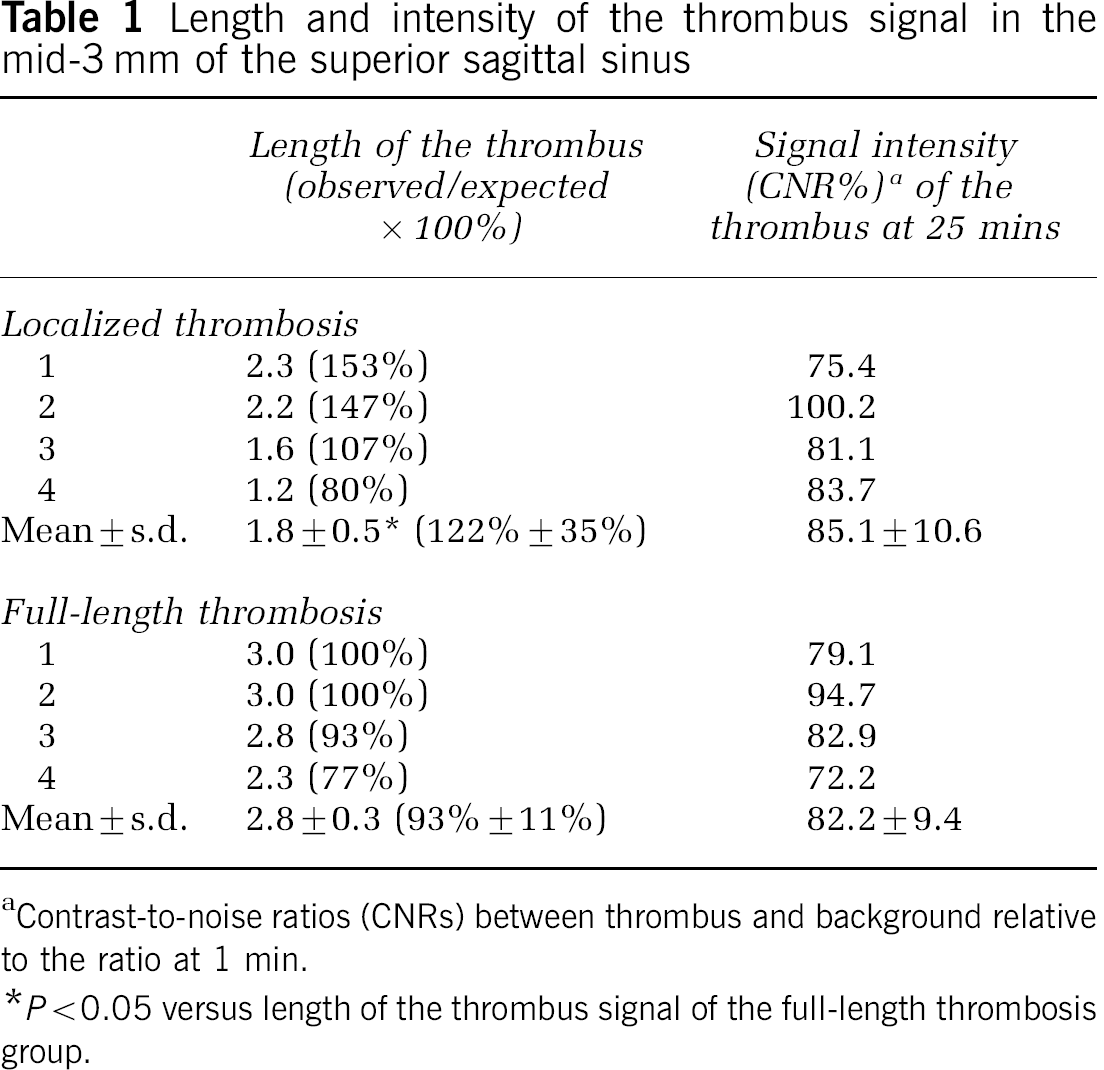
Contrast-to-noise ratios (CNRs) between thrombus and background relative to the ratio at 1 min.
P<0.05 versus length of the thrombus signal of the full-length thrombosis group.
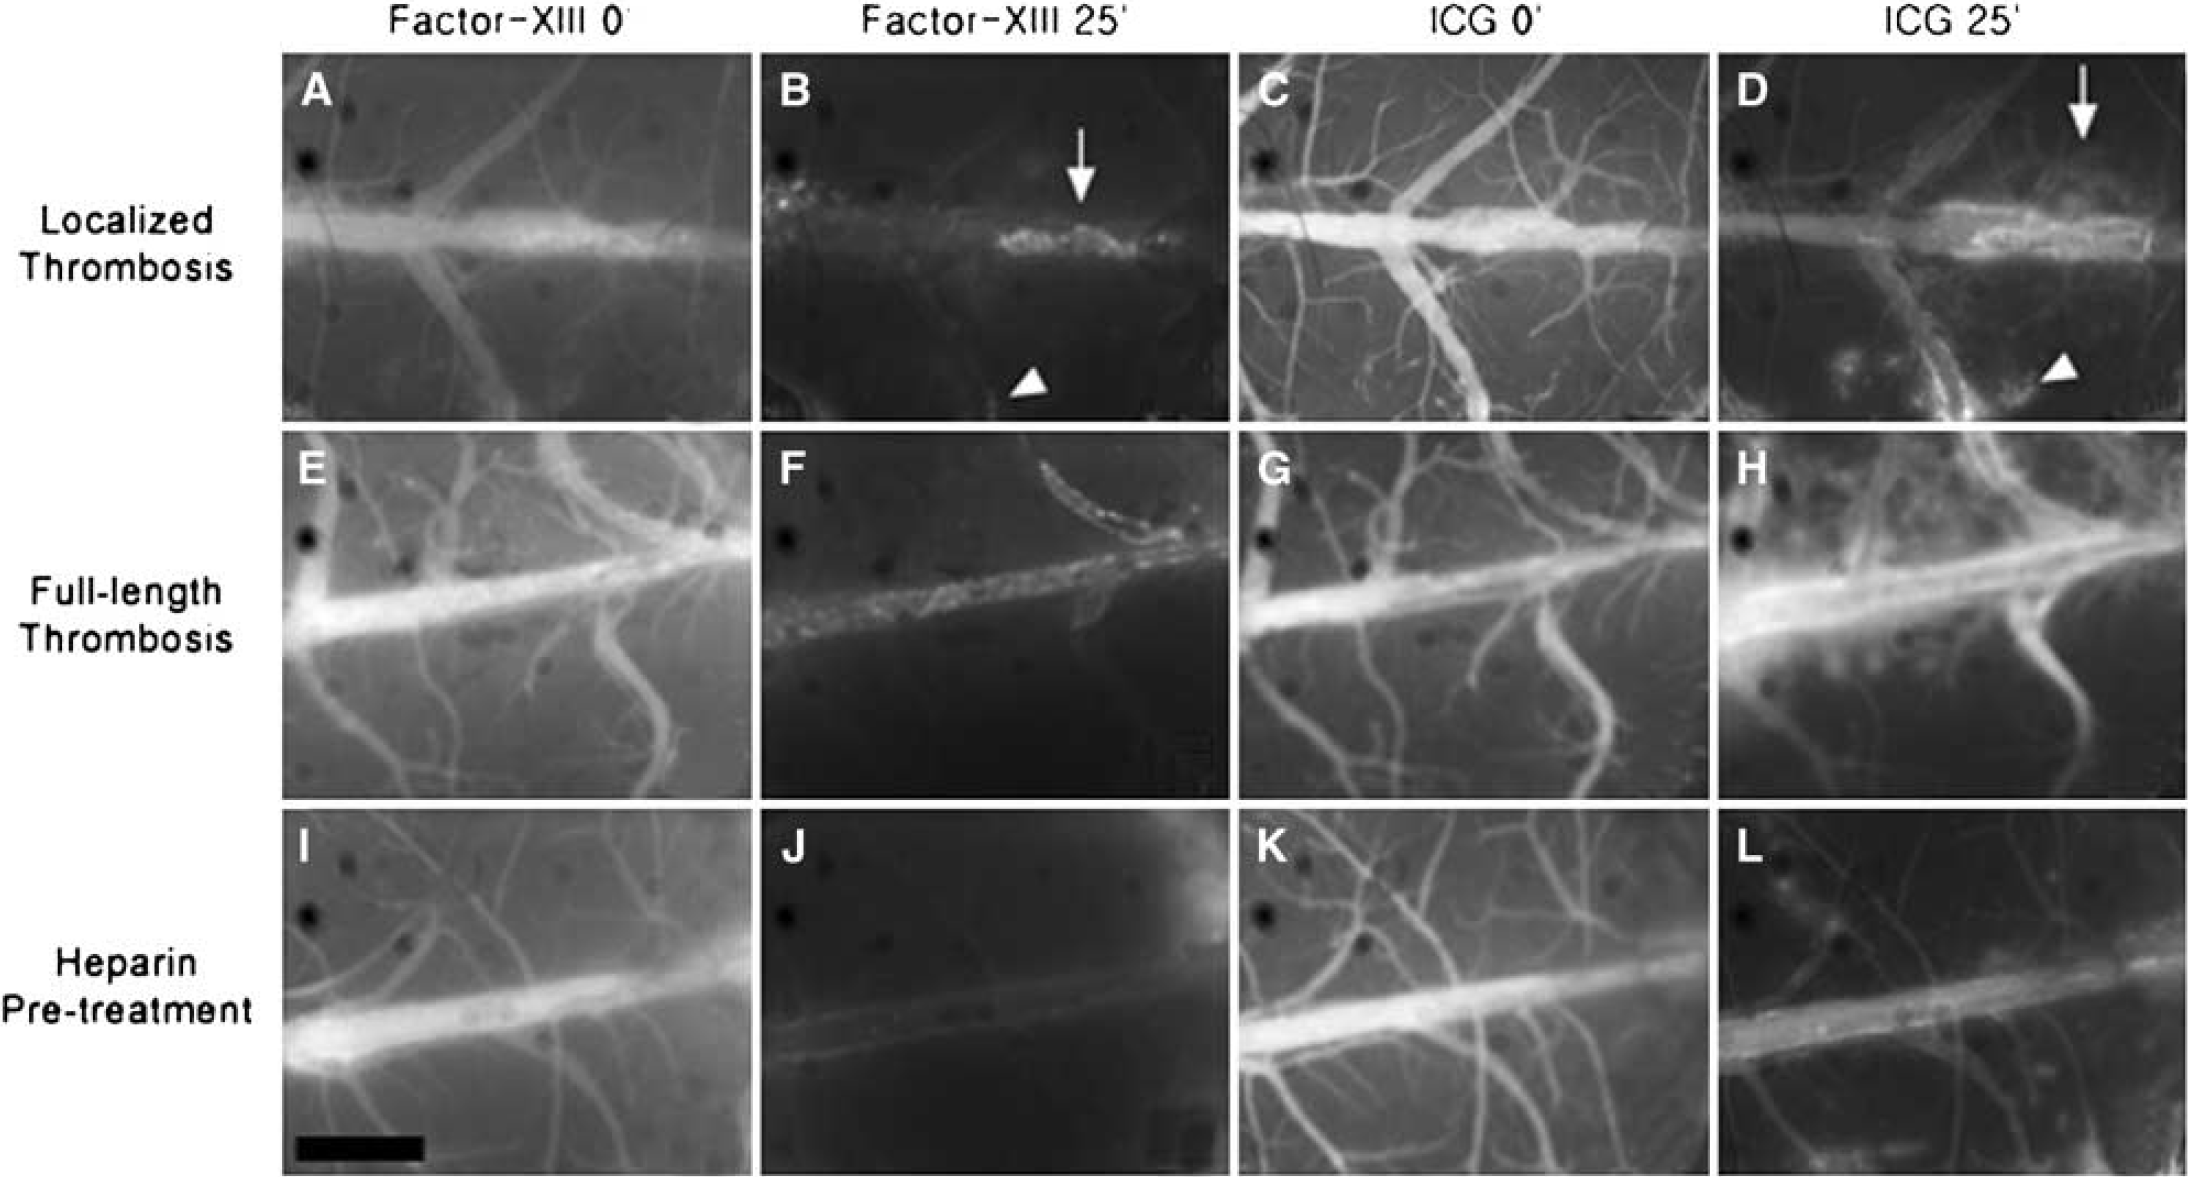
Fluorescence images of A15 and ICG signal in the localized thrombosis group, full-length thrombosis group and heparin pretreated group. Images are from animals that received the A15 followed by ICG at 3 and 3.5 hours after thrombosis induction, respectively, in the localized (
After the intravenous injection, A15 initially remained intravascular, producing a cerebral angiogram. Thereafter, the A15 NIR signal was washed out quickly in all but thrombosed areas, which resulted in progressively improved target-to-background signal and thrombus conspicuity in all animals. Together with decreasing signal intensities in the nonthrombosed vascular areas, the background fluorescent signal in the brain parenchyma also markedly decreased over time, all of which led to a relative absence of signal in all but thrombus on the final images. Thrombosed areas could be identified by 5 to 10 mins, with improved visualization at further time points after the injection of A15 (Figure 2). In a separate experiment, thrombus signals were shown to persist for longer than 2 days (data not shown).
A15 Thrombus Images Reflect Treatment Effects
To study the effect of heparin in CVT, heparin was administered right before the thrombosis induction, and A15 was then injected 3 hours later. Significantly different A15 signal patterns were found in the heparin pretreated groups. Ten mins after A15 injection, the mean NIR signals in the vascular area where FeCl3 was applied were significantly lower in the heparin pretreated group than in the nontreated groups (P<0.05, repeated-measures ANOVA and Dunnet's post hoc test) (Figures 2 and 3). Setting the signal intensities of the FeCl3-applied vascular areas at 1 min to be 100%, the mean relative intensities at 25 mins were 85.1%±10.7% (localized thrombosis group) and 82.2%±9.4% (full-length thrombosis group) in the nontreated animals; whereas it was 47.9%±13.6% in the heparin pretreated group.
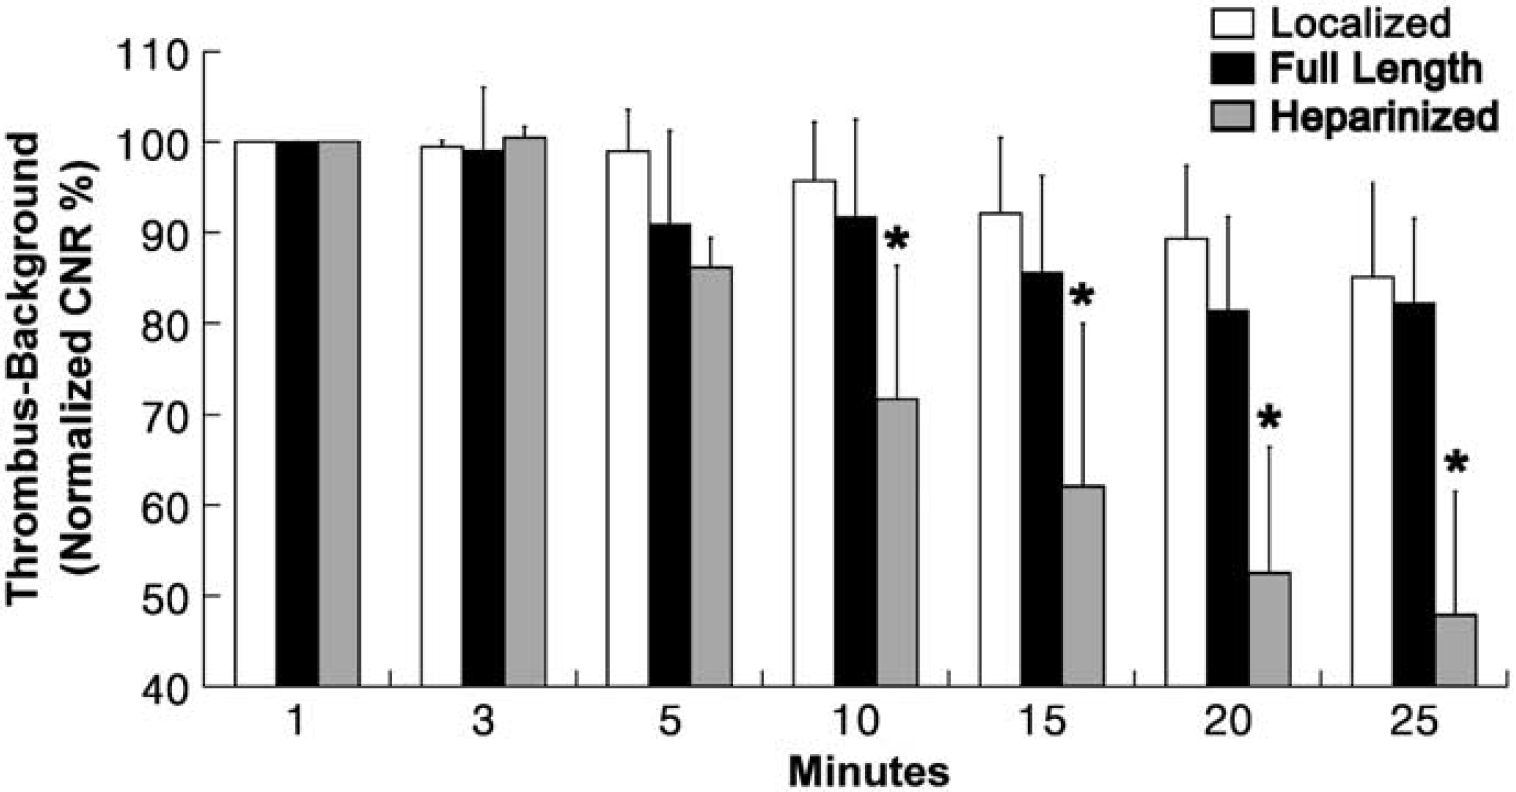
Serial changes in the relative signal of the thrombus–background ratio (CNR%) in the superior sagittal sinus after the injection of A15 imaging agents. The bar graph with standard deviation of mean (n=4 in each group) shows serial changes in the CNRs between thrombus and background relative to the ratio at 1 min (normalized CNR%), in animals from localized (white-bars) or full-length (black bars) thrombosis groups or heparin pretreatment group (gray-bars). In contrast to the other two groups, 10 mins after A15 injection, the heparin pretreatment group has significantly lower near infrared signals in the vascular area (∗P<0.05, repeated-measures ANOVA and Dunnet's post hoc test).
Visualizing Blood–Brain Barrier Disruption with Indocyanine Green
Indocyanine green, a NIR fluorochrome clinically used in the assessment of cardiac output, hepatic function (Mordon et al, 1998), and for retinal angiography/thermotherapy, having a spectrum (Ex/Em=805/835 nm) distinct from it of A15 was used to monitor BBB permeability. Indocyanine green initially remained intravascular, producing a cerebral angiogram, and then began to leak out of the SSS and bridging cortical vessels at 3 to 5 mins, causing parenchymal staining which increased over time (Figures 2 and 4). The ICG signals because of disrupted BBB in the full-length thrombosis group were located bilaterally, but asymmetrically (Connor and Jarosz, 2002), in and around the midline area along the occluded SSS and bridging vessels (Figures 2H and 4). Two animals in the localized thrombosis group showed that ICG-leakage sites correlated with the thrombosed portion of the SSS and its bridging vessels (Figure 2D). The third animal in this group stopped breathing immediately after the intracardiac injection of ICG. During the respiratory arrest, continued cardiac activity was observed for 15 mins. Indocyanine green dye in this animal symmetrically and diffusely leaked out of all the cerebral vessels that had been initially filled with the dye (Figure 4B), which was not observed in other animals without respiratory arrest (Figure 4A).
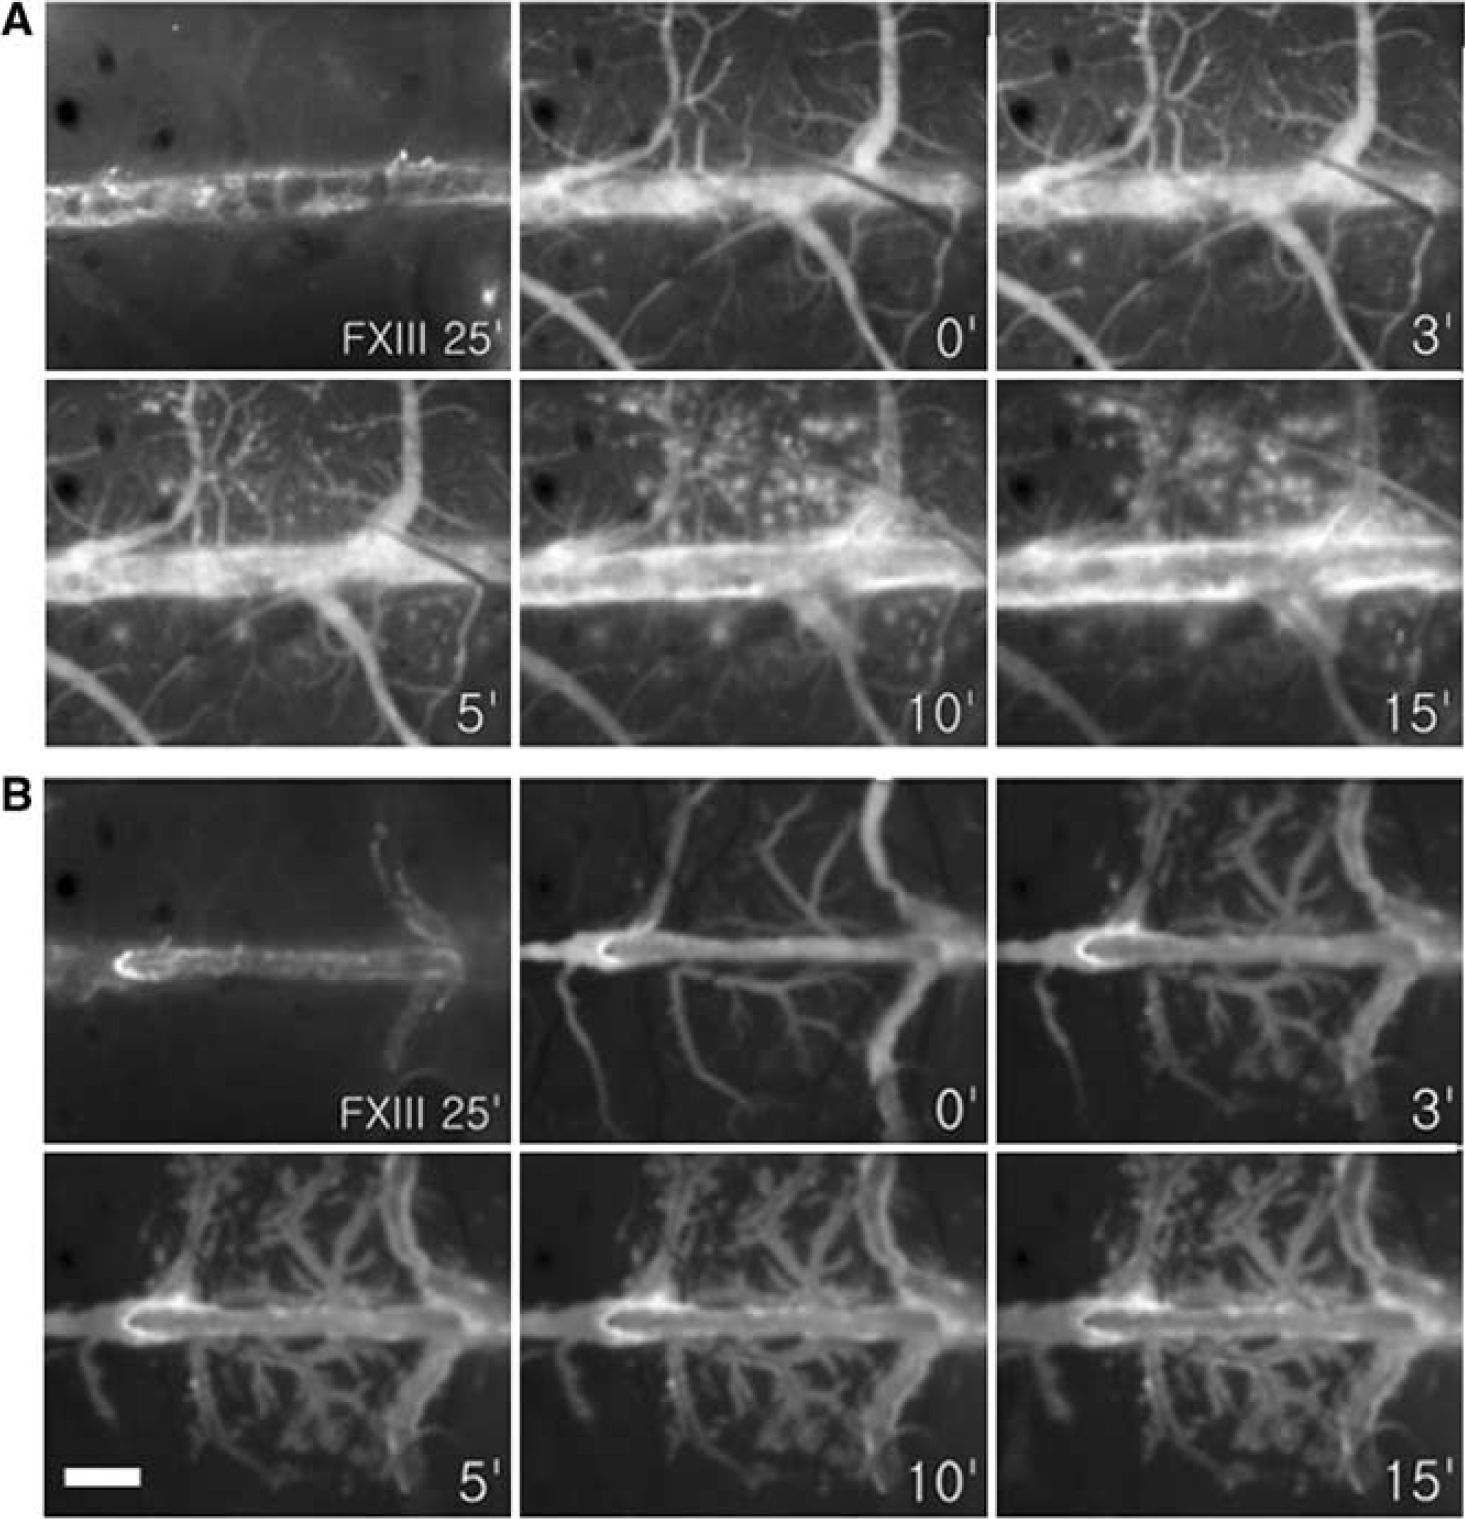
Serial ICG fluorescent images of (
One min after the ICG injection in the full-length thrombosis group, mean fluorescent signal intensities due to ICG leakage were 72±7.3 (× 105 AU), which increased to 224±85 (× 105 AU) at 25 mins (Figure 5). Heparin prevented BBB disruption, which was reflected by significantly less ICG leakage in the heparin pretreatment group, with 50±9.5 (× 105 AU) at 1 min and 94±52 (× 105 AU) at 25 mins (P<0.05, repeated-measures ANOVA).
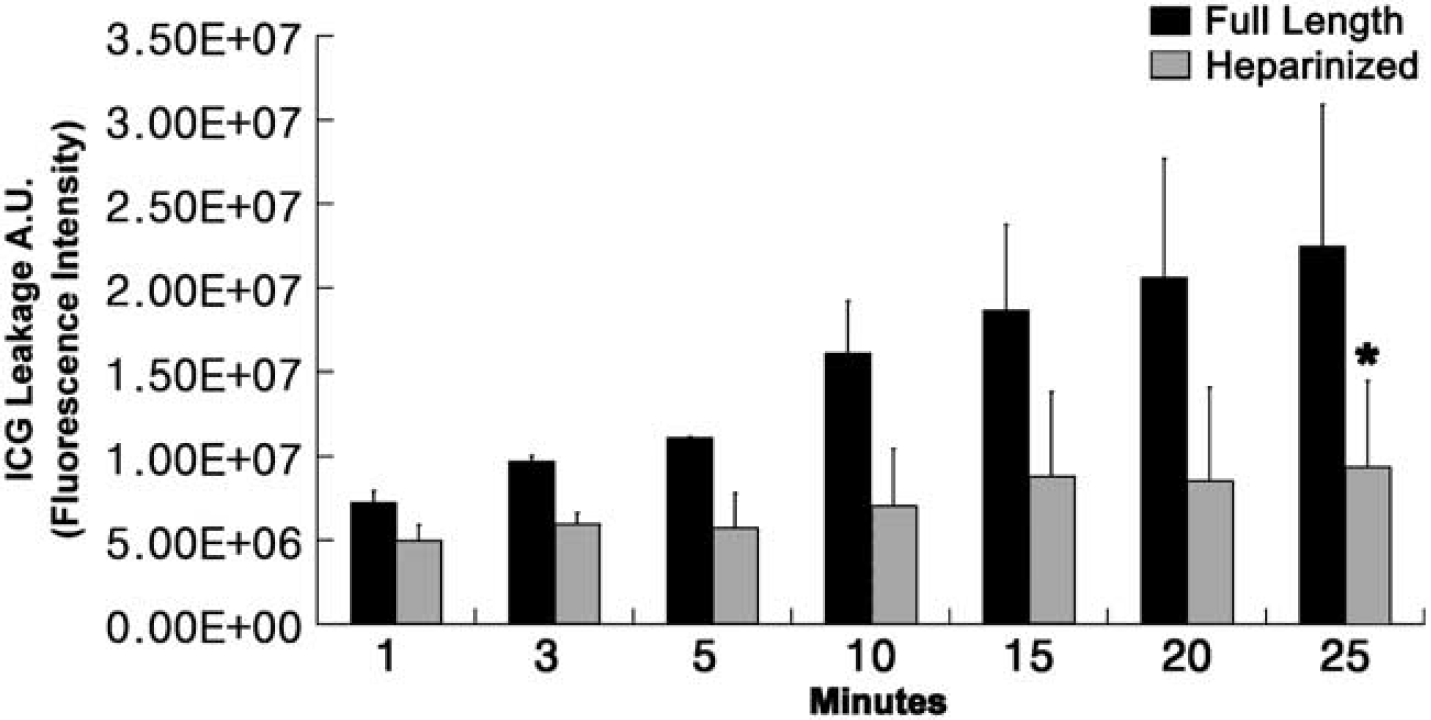
Serial changes in fluorescent signal intensity due to ICG leakage in the full-length thrombosis group and heparin pretreated group. The mean (with standard deviation) fluorescent signal intensity (AU) caused by ICG leakage increased rapidly over time in the full-length thrombosis group (black-bars, n=3). In contrast, the heparin pretreatment group (gray-bars, n=3) in which thrombosis was prevented was associated with significantly less ICG leakage (∗P<0.05, repeated-measures ANOVA).
Discussion
We report a unique optical probe (A15), capable of demonstrating the function of FXIIIa in vivo, and its use in an experimental animal model of cerebral venous thrombosis. In addition, we explore the use of a clinically used intravascular fluorescent probe, ICG, to simultaneously visualize CVT-induced BBB disruption.
The NIRF probe A15 is based on the aminoterminus of alpha-2 antiplasmin, and is covalently integrated into thrombi by means of the transglutamase activity of FXIIIa (Tung et al, 2003; Jaffer et al. 2004a). Factor XIIIa augments thrombus stability by crosslinking fibrin γ-chains and α-chains, and by covalently binding alpha-2 antiplasmin (Muszbek et al, 1999). A15 is imaged by means of a NIR fluorochrome interrogated by light as its excitation wavelength (679 nm) and read out by its fluorescence in the near-infrared window, at which tissue attenuation is favorable to the transmission of photons. The ICG probe mainly binds to albumin and does not traverse the BBB under normal conditions (Desmettre et al, 2000). Therefore, its leakage from the intravascular compartment reflects a BBB rendered abnormally permeable by the thrombotic disease process. It should be recognized that cerebral surgery in and of itself causes a small amount of damage to the BBB independent of the presence of thrombosis, but with clear differences between control animals and animals with thrombosis (Figure 5). We have shown: (a) FXIIIa-mediated probe retention in clot, with colocalization of probe and clot, (b) the impact of heparin pretreatment on clot formation and A15 probe integration, and (c) cerebral parenchymal staining by ICG due to thrombosis-induced venous hypertension and BBB disruption.
CVT is a complex disease, and is an increasingly recognized cause of stroke because of developments of noninvasive imaging techniques (Allroggen and Abbott, 2000; Connor and Jarosz, 2002; Renowden, 2004). The clinical diagnosis of cerebral venous sinus thrombosis is difficult, with most symptoms and signs being nonspecific. Anatomically based imaging modalities such as CT venography, MR/MR venography, or conventional angiography currently represent the diagnostic gold standard, but the image interpretation can be challenging also, with multimodality imaging often required to establish the diagnosis. None of the currently used diagnostic tests with localizing value are functionally based. In other words, information regarding chronicity or activity is not readily available without serial anatomic testing over time.
Optical imaging with an FXIIIa probe such as A15 represents a potential additional tool in the diagnostic evaluation of this condition. Activated factor XIII rapidly crosslinks α2AP into thrombi with a catalytic half-life of ∼20 mins in vivo, and is therefore a marker of biologically acute thrombi (Robinson et al, 2000). Thus, imaging FXIIIa activity yields a fundamentally different type of information, not currently available with anatomically based imaging modalities on a functional chemical state, that of the activity of the enzyme FXIIIa. Hypothetically, this may be useful to stage thrombotic disease to appropriate therapy, and can clarify the diagnosis of acute versus chronic disease, which is difficult to achieve with anatomic imaging only. Therapeutic response to various treatment regimens could be monitored, likely in near real time. The activity of an enzyme such as FXIIIa would be expected to change far more rapidly than clot volume, and may serve as an early predictor of the success or failure of a therapeutic regimen. Early triage to higher risk regimens, such as catheter-mediated neurointerventional thrombolysis (Frey et al, 1999; Witham et al, 1999; Terborg et al, 2004), could potentially be justified by such knowledge. The A15 agent could be expected to have applicability—molecular diagnosis to guide therapy with fibrinolytic or anti-FXIIIa agents, direct or indirect thrombin inhibitors, or other drugs (Jaffer et al, 2004a)—in diseases other than CVT, given the role of FXIIIa and biologically active thrombi in acute thrombo-occlusive diseases such as arterial ischemic stroke or myocardial infarction. Despite the encouraging possibilities, it should be stressed that future studies are required to prove clinical benefit of the A15 NIRF imaging system.
Venous obstruction is the primary pathology in CVT, leading to vascular engorgement, reduced capillary perfusion pressure, edema and BBB disruption, increased intracranial pressure, hemorrhage and parenchymal dysfunction (Allroggen and Abbott, 2000). Extensive thrombosis and severe cerebral edema are known to be poor prognosis factors in clinical CVT (Benamer and Bone, 2000). Indocyanine green has been in regular clinical use for retinal angiography the last 30 years, and is known to be highly plasma protein binding and not to traverse the BBB (molecular mass 775 Da) (Desmettre et al, 2000). Therefore, its leakage from the intravascular compartment reflects altered vascular endothelial permeability that could cause vasogenic cerebral edema. In the present study, ICG staining of the parenchyma was noted to be within close proximity to sites of thrombosis, as would be expected from the pathophysiology of BBB disruption. Similar to A15, ICG could be used in research and clinical settings to provide near real-time information on the altered BBB permeability causing CVT-induced vasogenic edema, and may also yield information on therapeutic response. It is interesting to note that ICG diffusely passed a leaky BBB due to another superimposed cause, hypoxia, during the course of our work (Figure 4), pointing to broader applicability.
Optical imaging is currently an emerging imaging modality, with many technical limitations in currently available hardware. This necessitates the use of in vivo windows and invasive monitoring for those interested in imaging cerebral thrombotic disease and other entities. But there is much hope that future improvements in equipment will allow us to do such studies in intact animals as well as humans. NIRF intraoperative (Taggart et al, 2003) and tomographic (Ntziachristos et al, 2002) optical imaging systems, and vascular catheter NIRF imaging systems are under development for patient use (Jaffer and Weissleder, 2004b). In addition, near-infrared imaging techniques could allow patients to be examined in comparatively ‘natural’ environments including at the bedside (Obrig and Villringer, 2003). In fact, near-infrared spectroscopy was introduced in the bedside assessments of cerebral perfusion status in stroke patients (Terborg et al, 2004). Catheter-based NIR spectroscopy is expected to determine the vulnerability of a plaque with the help of A15 that could sense active thrombus nidus in an early-stage, as well as other plaque-imaging techniques (Fayad and Fuster, 2001).
In summary, we have shown in an animal model that optical imaging of CVT with an FXIIIa probe (A15) and an intravascular fluorescent probe (ICG) provides unique, near real-time information about the disease process, useful for assessing and potentially guiding therapeutic interventions.
Footnotes
Acknowledgements
We like to thank Dr Nan-Hui Ho for preparing the fluorescence probe. We thank Dr Edward Graves for the development of our custom software package, CMIR-Image. This research was supported by NIH P50-CA86355 and RO1 CA 99385. Dr Schellingerhout was supported in part by grants from the NIH 2PO1CA6924605, 1-R24-CA92782-01, the Radiologic Society of North America and the American Brain Tumor Association.