The in situ mouse brain perfusion method for measuring blood—brain barrier permeability was adapted to assess transport of solutes at the blood—brain and blood—eye barriers. The procedure was checked with radiolabeled markers in oxygenated bicarbonate-buffered fluid infused for 30 to 120 secs via a carotid artery. Vascular flow estimated with diazepam was 2.2-fold lower in the eye than in the brain. The vascular volume and the integrity markers sucrose and inulin indicated that a perfusion flow rate of 2.5 mL/min preserved the physical integrity of these organs. However, the brain vasculature integrity was more sensitive to acute perfusion pressure than the eye vasculature. The functional capacities of blood barriers were assessed with d-glucose; its transport followed Michaelis—Menten kinetics with an apparent Km of 7.6 mmol/L and a Vmax of 23 μmol/sec per g in the brain, and a Km of 22.9 mmol/L and a Vmax of 40 μmol/sec per g in the eye. The transport of cholesterol to the brain and eye was significantly enhanced by adding the Abca1 inhibitor probucol, suggesting an Abca1-mediated efflux at the mouse brain and eye blood barriers. Thus in situ carotid perfusion is suitable for elucidating transport processes at the blood—brain and blood-eye barriers.
The brain environment is protected from the blood by two barriers, which control the movement of solute molecules between the blood and brain milieu. The endothelia of brain capillaries and the choroid plexus epithelium form the blood—brain barrier (BBB) and the blood—cerebrospinal fluid barrier, respectively. They have the complex tight junctions and specific transporters needed to strictly regulate molecular transport (Ohtsuki and Terasaki, 2007). The neural visual tissue of the retina (posterior segment of the eye) and the transparent acellular aqueous tissues forming the aqueous and vitreous humors also have regulated environments (Cunha-vaz, 2004). The humors provide for most of the metabolic needs of the avascular tissues of the eye, including the lens and the cornea.
Some eye epithelia and endothelia have tight junctions, forming the so-called blood—ocular barrier (BOB). The two blood-aqueous barriers (BABs) in the anterior segment of the eye are formed by tight junctions between the blood and unpigmented epithelial cells of the ciliary body and the iridial endothelial cells; they maintain humor homeostasis (Cunha-vaz, 2004; Hosoya and Tomi, 2005). Similarly, there are two vascular networks and two blood—retinal barriers (BRBs) in the posterior part of the eye. The inner BRB (BRBi) is formed by tight junctions between the endothelial cells of the retinal blood microvessels within the neural tissue. Peripheral to the neural retina, the retinal pigmented epithelial cells (RPE) forms a monolayer of tightly linked cells (outer BRB; BRBo) at the back of the vertebrate eye. The apical side of the RPE microvilli separates the posterior surface of the neural photo-receptors, and at its basolateral side, the second vascular network, a fenestrated endothelium, the choriocapillaris. The structure of the BRBo is similar to that of the blood—cerebrospinal fluid barrier, whereas the BRBi structure is similar to that of the BBB.
The polarized endothelial and epithelial cells forming the blood—brain and blood—ocular barriers both contain specific carrier-mediated transport proteins. Several common transporters (the d-glucose transporter (GLUT1), monocarboxylate transporters, and ABC proteins such as P-glycoprotein (P-gp; Abcb1)) are involved in the transport of substances and xenobiotics. Therefore, it is essential to understand the details of transport mechanism across the BBB and BOB, including uptake and efflux mechanism, for targeting and delivering drugs and solutes. Although we have learned considerably more about transport at the BBB over the last 2 decades, we know relatively little about the function and transporters at the BOB despite their pathophysiological significance. The anterior segment of the eye can be affected by disorders such as cataract and glaucoma, whereas the posterior segment can be affected by diabetic retinopathy, infections, malignancies, and macular degeneration (Patton et al, 2005). The pathologic alterations that particularly affect the eye vasculature in diabetic retinopathy and lipid deposits make the study of glucose and cholesterol transport essential.
The recent development of BRBi, BRBo, and BAB cell culture models has provided new insights into ocular transport (Hornof et al, 2005; Hosoya and Tomi, 2005). However, we still know relatively little about how these barriers function in vivo, despite the similarity between the brain and eye vasculatures. In situ brain perfusion is a sensitive method for studying BBB transport; it takes over the circulation by infusion of a controlled perfusate (bicarbonate buffer, plasma, or blood) via the carotid (Takasato et al, 1984). In situ perfusion not only maintains the organ in its physiologic state and position, but it also avoids binding or metabolism of the injected test solutes by plasma and peripheral organs, effects of endogenous compounds in the blood and uncontrollable changes in blood flow. As with in vitro studies, the nature and composition of the perfusion fluid can be set and controlled according to the needs of the experiment. The flow rate and composition of the perfusate (ion, protein, and test solute concentrations) are varied more easily than is possible in a conventional in vivo studies and the range can be greater. Hence, in situ perfusion studies can be used to examine mechanisms and kinetically assess the effect of parameters such as drug concentrations, transport modulators, ionic factors, and protein binding on the distribution of a drug (Smith, 1996).
This technique was adapted for transport studies on the rat eye by Gratton et al (1993), and most of the few published experiments are by Alberghina et al (1994) who studied fatty acid uptake by the brain and retina. The availability of genetically engineered mice having defects in receptors, enzymes, and drug transporters, and the emerging role of transporters in ocular kinetics prompted us to assess in situ perfusion for studying transport in the mouse eye. We adapted the in situ mouse brain perfusion system to measure, simultaneously, the transport across both the BBB and the BOB. We measured the transport of the vascular and integrity marker sucrose, the flow indicator diazepam, and two essential substances that could be involved in vision impairment, cholesterol and glucose, in the mouse eye and brain.
Materials and methods
Animals
Male OF1 mice, 30 to 40 g, 7- to 9-week old and male C57/BL6 mice, 35 to 45 g, 11- to 13-week old were obtained from Charles River (L'Arbresle, France) and Charles River (Saint Constant, Québec, Canada), respectively. They were housed in a controlled environment (22°C ± 3°C; 55 ± 10% relative humidity), with a 12-h dark/light cycle and had access to food and tap water ad libitum. All experiments complied with the ethical rules of the French Ministry of Agriculture for experimentation with laboratory animals (law no. 87–848) and consent for the protocol (no. 05–066) was obtained from the University Animal Care Committee.
In Situ Eye and Brain Perfusion
Mice were anesthetized by intraperitoneal injection of ketamine—xylazine (140–8 mg/kg). The surgical procedure described by Dagenais et al (2000) was used, in which the pterygopalatine artery (PTa), which gives rise to the ophthalmic artery, remains open. The right external carotid was ligated rostral to the occipital artery at the bifurcation of the common carotid. The right common carotid was ligated and a catheter (polyethylene (PE) tubing 0.30 mm i.d. (inner diameter) × 0.70 mm o.d (outer diameter)) inserted above the ligation. The carotid was then perfused within 2 to 3 mins. The syringe containing the perfusion liquid was placed in an infusion pump (PHD2000, Harvard Apparatus, Holliston, MA, USA) and connected to the catheter (usual perfusion rate: 2.5 mL/min). The thorax was opened, the heart cut, and perfusion started immediately. The perfusion fluid was bicarbonate-buffered physiologic saline containing (in mmol/L) 128 NaCl, 24 NAHCO3, 4.2 KCl, 2.4 NaH2PO4, 1.5 CaCl2, 0.9 MgCl2, and 9 d-glucose, unless specified otherwise. The solution was gassed with 95% O2/5% CO2 for pH control (7.4) and warmed to 37°C. Each mouse was perfused for 30, 60, 90, or 120 secs, with [14C]sucrose (~0.3 μCi/mL) and/or [3H]inulin (~1 μCi/mL), with or without [14C]d-glucose, [3H]diazepam, or [3H]cholesterol to obtain a 3H/14C ratio of ≥ 3 in the perfusion liquid and the tissue. Unlabeled d-glucose, phloretin (0.5 mmol/L), albumin (40 g/L), cholesterol (1 μmol/L or 2.5 mmol/L), or probucol (5 μmol/L) were added to the perfusion fluid when required.
A four-way valve connected to the dual syringe pump and to the carotid catheter was used to switch between two syringes as required. Washout (WO) experiments included the perfusion of tracer-free bicarbonate buffer for 30 secs after the perfusion of radiolabeled [3H]diazepam or [14C]sucrose. The radioactive compounds were removed from the vascular bed under these conditions; an inverse concentration gradient was imposed in the second perfusion step, as the Krebs perfusion liquid contained no extra organic molecules. In other experiments, a tracer-free bicarbonate buffer containing cold d-glucose was first perfused for 30 secs, followed by perfusion for 30 secs with the same fluid containing [14C]d-glucose and [3H]inulin.
The mouse was always decapitated at the end of the perfusion. The right eye and brain were immediately removed and dissected out on ice. The right cerebral hemisphere, the right eye (without the optic nerve), and aliquots of perfusion fluid taken from the end of the catheter after it had been removed from the artery lumen were placed in tared vials and weighed. The eye was dissected out and samples taken in some experiments. Samples of aqueous humor were obtained directly with a syringe. The anterior and posterior segments of the eye and the lens attached to the vitreous humor were dissected out. Samples were digested in 2 mL Solvable (Perkin Elmer, Rungis, France) at 50°C, cooled, and mixed with 9 mL Ultima gold XR (Perkin Elmer). Dual label counting was performed in a Packard Tri-Carb 1900TR (Perkin Elmer).
Apparent Brain and Eye Distributional Volume (Vd), Initial Transport (Kin), and Flux (Jin) Parameters
All the calculations have been described by Smith (1996). The tissue ‘vascular’ volume was assessed with radiolabeled sucrose or inulin. In perfusion experiments, [14C] sucrose and/or [3H]inulin were used to estimate the tissue vascular volume (Vv; μL/g) as
where X* (d.p.m./g) is the amount of [14C]sucrose or [3H]inulin in the right brain hemisphere or the right eye and Cperf* (d.p.m./μL) the concentration of [14C]sucrose or [3H]inulin in the perfusion fluid.
The apparent tissue distribution volume (Vd) was calculated from the amount of radioactivity in the right brain hemisphere or the right eye using
where Xtissue (d.p.m./g) is the calculated amount of [3H] or [14C] test compound in the right cerebral or the eye parenchyma and Cperf (d.p.m./μL) the radiolabeled test compound concentration in the perfusion fluid.
Tissue total radioactivity was corrected for ‘vascular’ contamination with
where Xtot (d.p.m./g) represents the total quantity of labeled compound within the tissue parenchyma and the ‘vascular’ compartment. Vv is measured with sucrose or insulin. Subtraction of the sucrose or inulin Vv from the total amount for the compound of interest yields the amount outside the ‘vascular’ space and thus present in the parenchyma.
Initial brain transport is expressed as a Kin (μL/sec per g) and calculated from
where T is the perfusion time (secs).
Extraction of the tissue (E; %) is calculated with F (μL/sec per g) the perfusion liquid flow measured with [3H]diazepam as
The rate of drug uptake or flux into the brain or eye (Jin; μmol/sec per g) is given by
or
where Ctot is the total concentration of the test compound, PA (permeability-surface area product; μmol/sec per g) was calculated from Kin using the Crone—Renkin equation as
Equation (5) can be reduced for a flow-independent solute (Kin/F < 0.3; Smith, 1996) which gives equation (6).
For saturable transport, flux takes the form of a Michaelis—Menten equation
where Vmax (μmol/sec per g) is the maximal transport velocity and Km (mmol/L) the concentration at half-maximal velocity.
Materials
[14C]d-Glucose (260 Ci/mol), [14C]sucrose (600 Ci/mol), [3H]inulin (13 Ci/mmol), [3H]diazepam (88 Ci/mmol), and [3H]cholesterol (51 Ci/mmol) were purchased from Perkin Elmer Life Sciences (Boston, MA, USA). d-Glucose (mixed anomers, 99.5% purity) and phloretin were from Sigma (St Quentin, France). Probucol and cholesterol were purchased from Cedarlane (Hornby, ON, Canada). All other chemicals and reagents were analytical grade.
Data Analysis
All values are means ± s.d. of 3 to 8 mice, unless otherwise specified. Student's unpaired t-test was used to identify significant differences between groups when appropriate. All the tests were two-tailed and statistical significance was set at P < 0.05. The d-glucose transport parameters (Km and Vmax) were estimated by fitting a Michaelis—Menten equation to the mean d-glucose tissue flux versus glucose concentration data using a nonlinear regression with WinNonlin® software (Pharsight, Mountain View, CA, USA). The errors associated with the kinetic parameters are asymptotic standard errors returned by the nonlinear regression routine and are a measure of the best-fit value.
Results
Determination of Eye and Brain Flow Rate
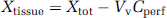
Diazepam transport is flow limited; it is commonly used to estimate vascular tissue flow when the vascular perfusion fluid contains no proteins or blood cells (Takasato et al, 1984). The [3H]diazepam apparent Vd in the mouse brain and eye were measured simultaneously after 30, 60, 90, and 120 secs of carotid perfusion at 2.5 mL/min (Figure 1). These multiple time plots of diazepam Vd in the mouse eye and brain against the perfusion time were linear (Figure 1). The slopes give the vascular flows (F) in the brain (42.3 ± 5.4 μL/sec per g) and eye (19.2 ± 3.4 μL/sec per g). The linearity of the tissue distribution over time for compounds is usually checked before in situ carotid perfusion for single or multiple times transport measurements, as it insures that the drug transport parameters measured reflect only the kinetic process at the cell membrane separating the vascular compartment from nonvascular compartment (e.g., luminal membrane for endothelia and albuminal membrane for epithelia) and/or passive back flux is insignificant.
Time course of [3H]diazepam uptake by the right brain hemisphere (▲; dotted line) and the right eye (●; solid line) of OF1 mice expressed as apparent distribution volume (Vd, μL/g) determined by in situ carotid perfusion. Regression analyses of the individual data give r2 = 0.964 for the brain and r2 = 0.935 for the eye. Data are means ± s.d. of 4 to 5 animals.
[3H]Diazepam and [14C]sucrose were perfused for 30 secs and samples taken immediately to explore the tissue distribution in the eye. The accumulation of [3H]diazepam, in the aqueous and vitreous humors corrected by the [14C]sucrose space, was below the quantification limit as compared to that of [14C]sucrose. The remaining anterior part of the eye separated from the humors accounted for 21.0 ± 5.1% (n = 4) of the [3H]diazepam accumulated, corrected for the [14C]sucrose space, whereas the remaining posterior segment of the eye accounted for 77.5 ± 4.0% (n = 4) of the sucrose-corrected [3H]diazepam accumulated in the whole eye. The distribution space in the posterior segment, measured with the [14C]sucrose, was 2.8-fold greater than in the anterior eye segment, suggesting a higher vascular density and/or sucrose diffusible space in the posterior eye segment than in the anterior segment.
We obtained more information on the kinetics by perfusing [3H]diazepam for 90 secs, followed by WO with [3H]diazepam-free bicarbonate buffer for 30 secs. The [3H]diazepam Vd in the brain (3.2 ± 0.3 mL/g; n = 4) and eye (1.9 ± 0.4 mL/g; n = 4) with the WO procedure was similar to the control Vd measured without WO (brain: 3.6 ± 0.2 mL/g; n = 4; eye: 1.8 ± 0.3 mL/g; n = 4).
Physical Integrity of the Ocular—Blood and Brain—Blood Barriers
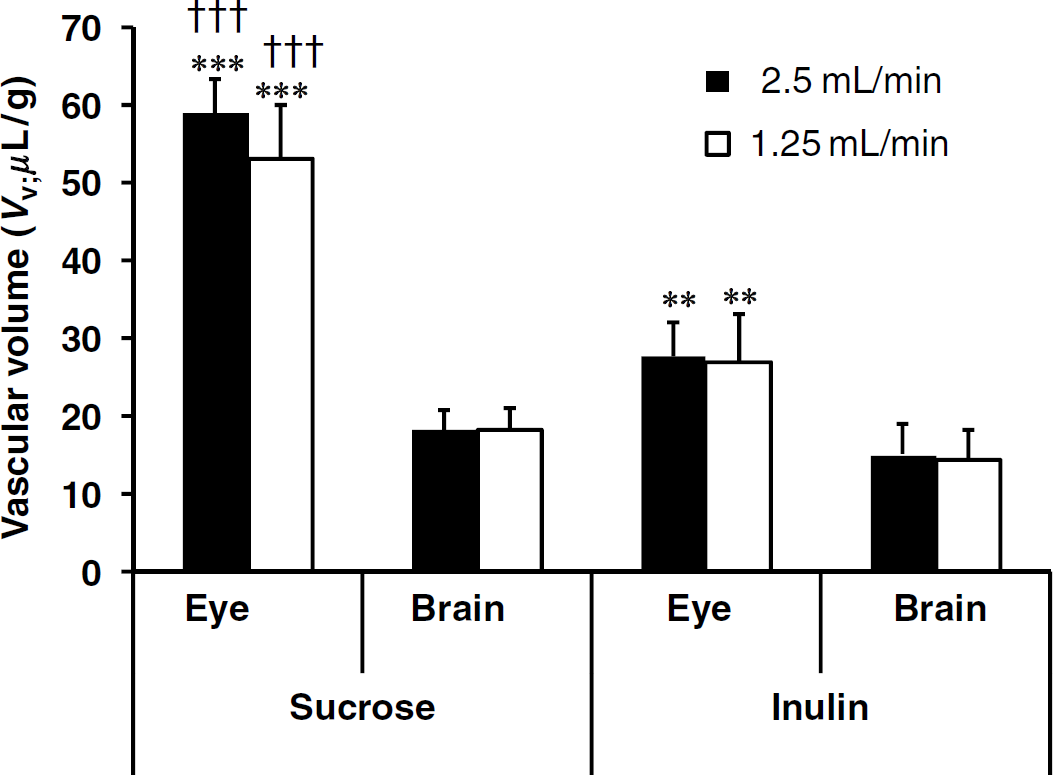
Sucrose and inulin were used as markers of vascular space and integrity because they do not cross significantly intact plasma membranes during short exposure. Their Vd were measured after perfusion for 120 secs at 2.5 mL/min and at 1.25 mL/min. The brain and eye Vv of sucrose and inulin measured with a flow rate of 1.25 mL/min were similar to those measured with 2.5 mL/min (Figure 2). The eye [3H]inulin Vv was significantly (1.8-fold) greater than the brain inulin Vv (Figure 2). The eye sucrose Vv was about 3.2-fold greater than the brain sucrose Vv (Figure 2). Although the brain sucrose Vv was 1.2-fold greater than the inulin Vv, the difference was not statistically significant (Figure 2). But the eye Vv measured with sucrose was ~2.1-fold greater than that measured with inulin (Figure 2).
Brain and eye vascular volumes (Vv; μL/g) of OF1 mice measured by in situ carotid perfusion with bicarbonate buffer containing both [14C]sucrose and [3H]inulin perfused for 120 secs at 2.5 mL/min (solid columns) or 1.25 mL/min (open columns). Data are means ± s.d. of 4 to 6 animals. **P < 0.01, ***P < 0.001 comparing the Vv for the eye and brain obtained with the same labeled compound. †‡P < 0.001 comparing the Vv obtained in each tissue using [14C]sucrose versus [3H]inulin. The Vv measured in the eye or in the brain with the same tracer at flow rates of 2.5 and 1.25 mL/min were not significantly different.
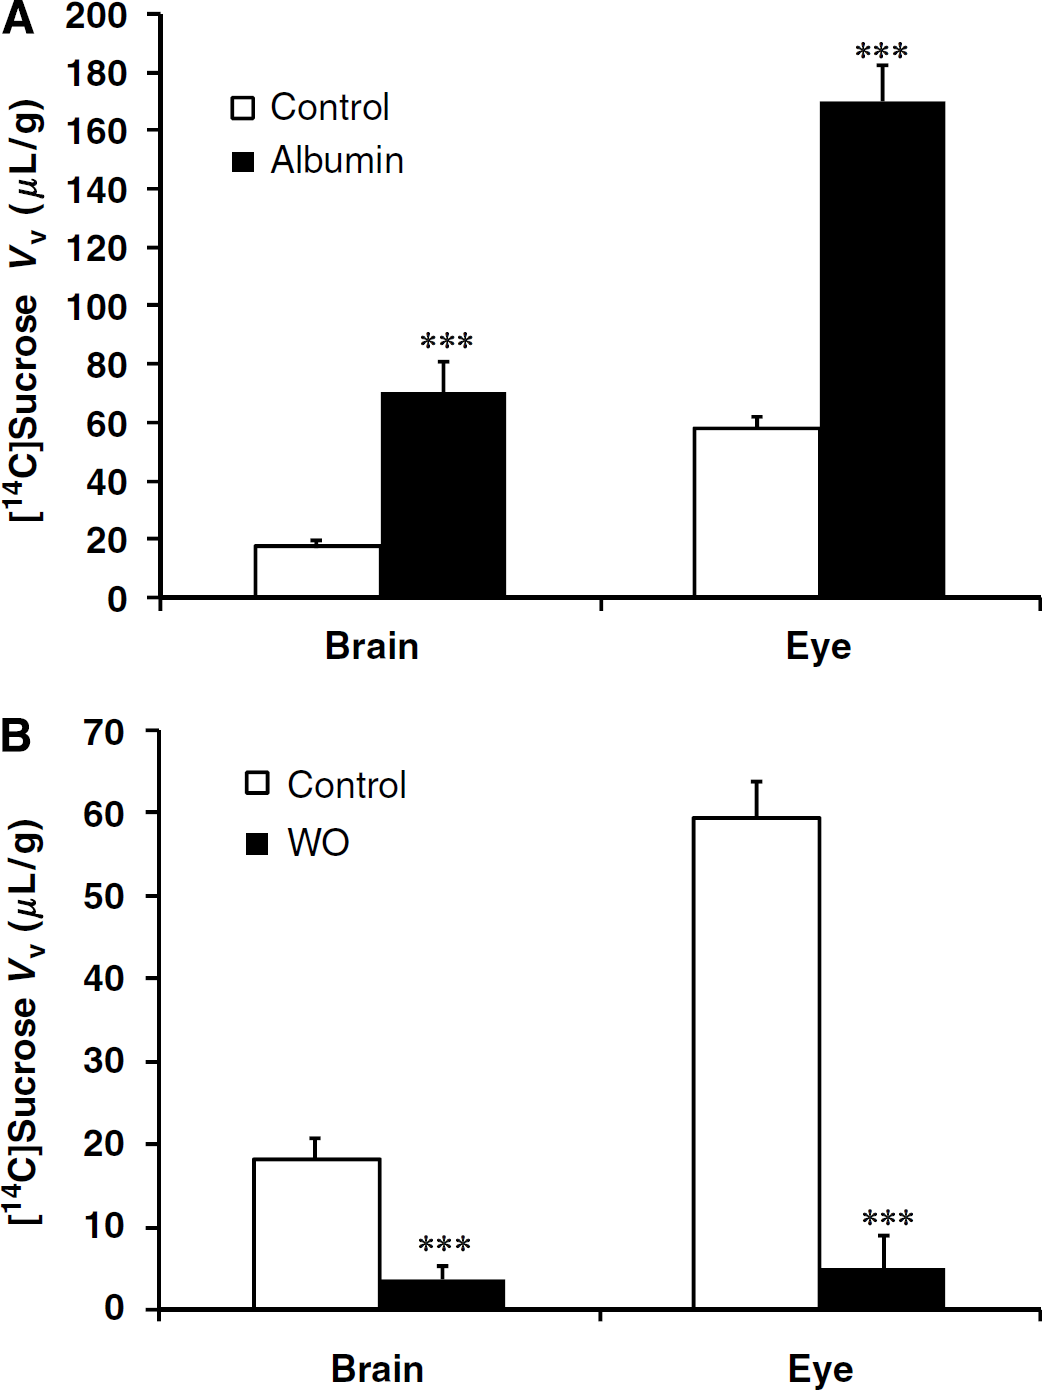
Fluid viscosity and vascular pressure are increased by adding albumin to the saline perfusion fluid; this requires a slower perfusion rate to keep the vascular pressure appropriate and to preserve the BBB integrity (Takasato et al, 1984). The [14C]sucrose brain and eye Vv were measured with a bicarbonate buffer containing a physiologic concentration of albumin (40 g/L) and a flow rate of 2.5 mL/min for 90 secs. The [14C]sucrose brain and eye Vd under these conditions were 4.0-fold (brain) and 2.9-fold (eye) greater than those measured with albumin-free bicarbonate (Figure 3A).
[14C]Sucrose distribution volumes in the brain and eye of OF1 mice were measured (A) with albumin-free-bicarbonate buffer (control; open bars) and with the same buffer containing 40 g/L albumin (filled bars) delivered at 2.5 mL/min for 90 secs, and (B) with bicarbonate buffer delivered at 2.5 mL/min for 120 secs and followed (or not; control) by a 30-sec washout (WO) with tracer-free bicarbonate buffer at 2.5 mL/min. Data are means ± s.d. of four animals. ***P < 0.001 comparing the treated group and the corresponding control group.
In other experiments, [14C]sucrose was perfused for 120 secs, followed by a WO with tracer-free perfusion fluid for an additional 30 secs to check the reversibility of its distribution. The WO significantly reduced the sucrose space about 80% in the brain and 92% in the eye (Figure 3B).
Glucose Eye and Brain Transport
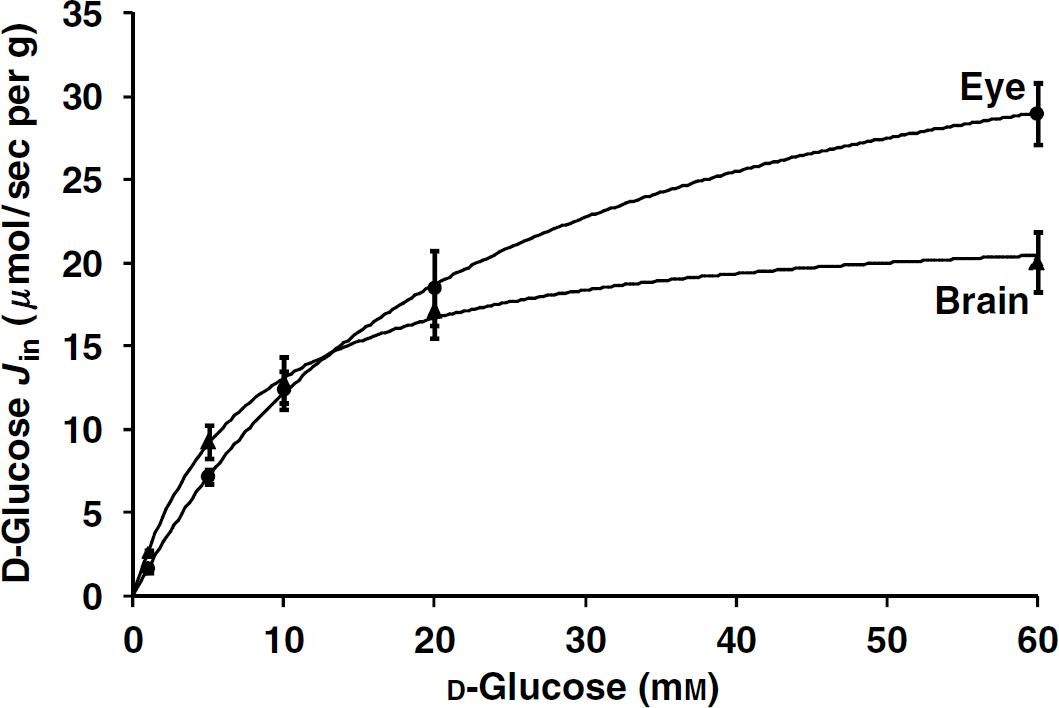
[14C]D-glucose transport was measured no more than 30 secs to decrease the risk of forming [14C]metabolites. Mice were first perfused for 30 secs with a fluid containing only cold d-glucose (0 to 60 mmol/L) to re-equilibrate and minimize the trans-stimulation transport from the various physiologic cell glucose amounts. They were then perfused, using a four-way valve, with the same fluid containing [14C]d-glucose for 30 secs. The apparent brain and eye fluxes of d-glucose (Jin; μmol/sec per g) as a function of the perfusate d-glucose concentration were fitted to a Michaelis-Menten equation. l-Glucose was sometimes used to determine the passive glucose component because its transport is not carrier-mediated (Kumagai, 1999; Puchowicz et al, 2004). We have corrected our d-glucose calculations for Kin and Jinusing the permeability of inulin. The brain permeabilities of l-glucose and inulin were the same (Lucchesi and Gosselin, 1990), and similar to the brain and eye permeabilities for sucrose measured by the tissue uptake index method (Alm and Törnquist, 1981). Therefore, we added no extra passive component to the d-glucose regression analysis. The passive eye and brain glucose components were also low (Puchowicz et al, 2004), and correction for glucose passive flux did not appreciably improve the Km and Vmax determinations (Bachelard et al, 1973). This plot of the glucose flux against the total d-glucose concentration gave an apparent Km of 7.64 ± 2.62 mmol/L and a Vmax 23.05 ± 1.58 μmol/sec per g for the brain and a Km of 22.92 ± 2.68 mmol/L and a Vmax of 40.05 ± 1.85 μmol/sec per g for the eye (Figure 4).
d-Glucose fluxes (Jin; μmol/sec per g) were measured simultaneously in the right brain hemisphere (▲) and eye (●) and fitted as a function of d-glucose perfusate concentration delivered at 2.5 mL/min in OF1 mice. Animals were first perfused with a prewash for 30 secs containing bicarbonate buffer plus cold glucose at the chosen concentration. This was followed by a liquid containing the same fixed concentration of unlabeled d-glucose plus [14C]d-glucose for an additional 30 secs. Data are means ± s.d. of 5 to 6 animals. The solid line is the data fitted to the Michaelis—Menten equation by nonlinear least-square regression. Parameters estimates for the brain were Km = 7.64 ± 2.62 mmol/L and Vmax = 23.05 ± 1.58 μmol/sec per g; and for the eye were Km = 22.92 ± 2.68 mmol/L and Vmax = 40.05 ± 1.85 μmol/sec per g.
We also measured the transport of [14C]d-glucose with unlabeled d-glucose (5 mmol/L) and with or without phloretin (0.5 mmol/L; dimethyl sulfoxide 0.25% v/v) in the perfusion fluid. Phloretin reduced the [14C]d-glucose transport by 87 ± 7% (P < 0.001; n = 5) at the brain and by 65 ± 11% (P < 0.001; n = 5) at the eye. Thus, there is a phloretin-sensitive [14C]d-glucose transport at the brain-blood and eye-blood barriers.
Cholesterol Eye and Brain Transport
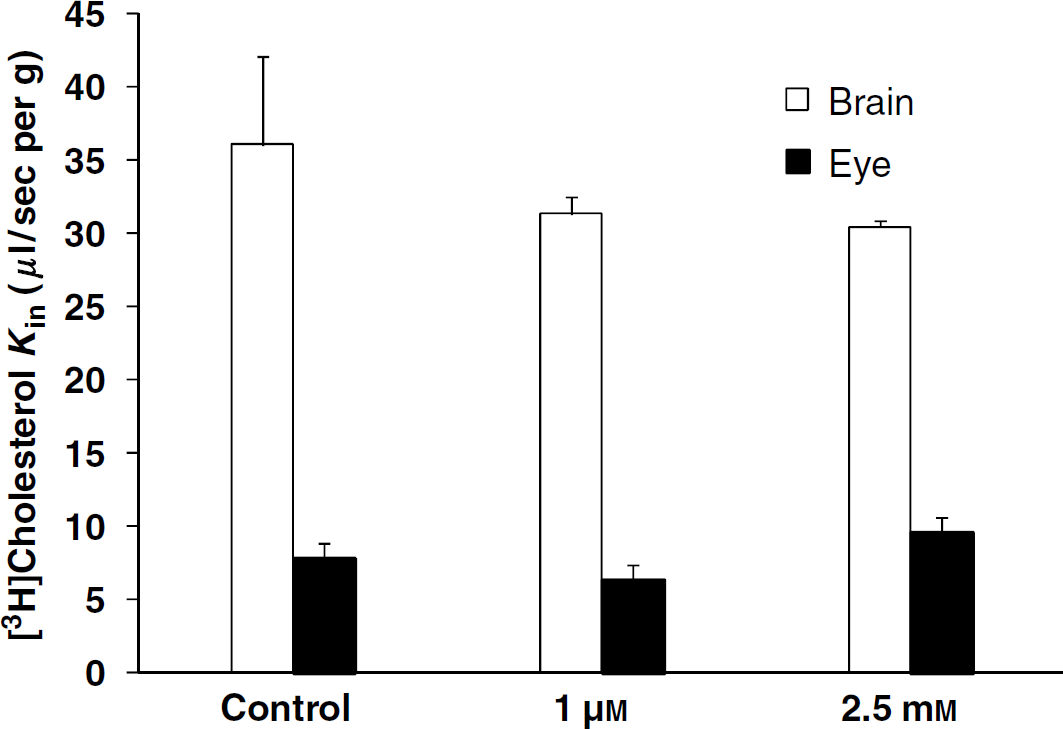
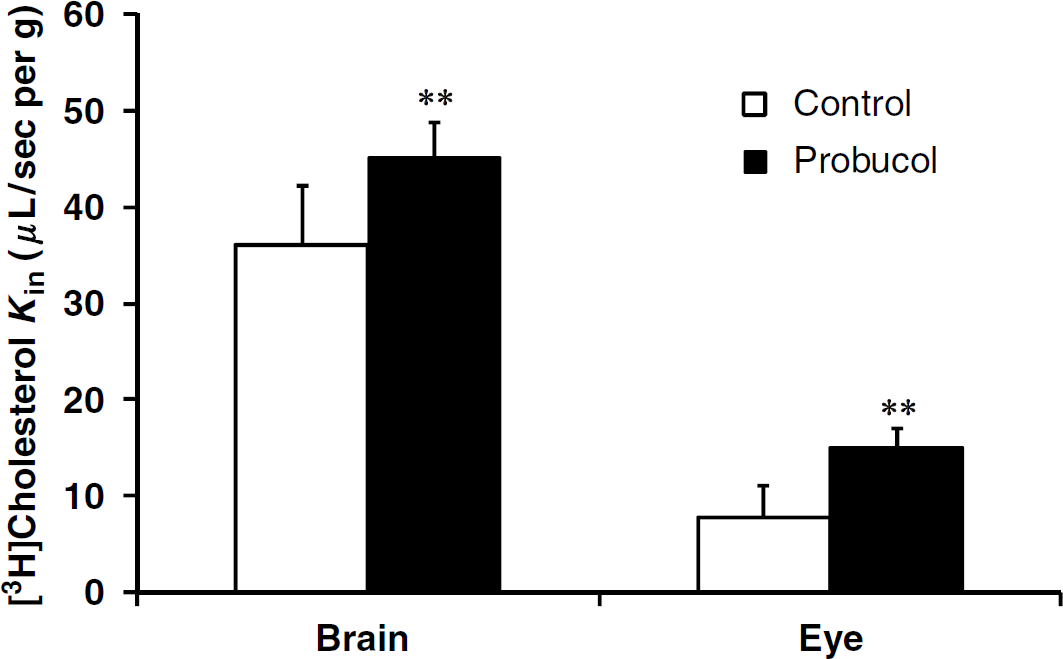
The transport (Kin) for [3H]cholesterol (3 nmol/L) was 7.8 ± 3.2 μL/sec per g (n = 7) for the eye and 36.1 ± 6.0 μL/sec per g (n = 8) for the brain. Thus, the extraction coefficient (E) of cholesterol by the eye was 40.9 ± 16.6% and that for the brain was 85.3 ± 14.3%. Perfusion of cholesterol 1 μmol/L or 2.5 mmol/L plus [3H]cholesterol (3 nmol/L) did not significantly modify the transport Kin for the eye or the brain from the control Kin values obtained with [3H]cholesterol (3 nmol/L) alone (Figure 5). Perfusing with [3H]cholesterol (3 nmol/L), the Abca1 inhibitor probucol (5 μmol/L; Favari et al, 2004) led significantly more [3H]cholesterol transport into the eye and brain (Figure 6); the eye extracted 78.8 ± 9.7% [3H]cholesterol and the brain 106.8 ± 8.5%.
[3H]Cholesterol transport (Kin; μL/sec per g) in the brains and the eyes of C57/BL6 mice was measured simultaneously by in situ carotid perfusion for 60 secs at 2.5 mL/min. The bicarbonate buffer containing [3H]cholesterol (3 nmol/L) was perfused with (or without; controls) added unlabeled cholesterol (1 μmol/L or 2.5 mmol/L). Data are means ± s.d. of 3 to 8 animals. No statistically significant differences were found between the appropriate controls and the brain or eye (1 μmol/L or 2.5 mmol/L).
[3H]Cholesterol transport (Kin; μL/sec per g) in the brains and the eyes of C57/BL6 mice was measured simultaneously by an in situ carotid perfusion for 60 secs at 2.5 mL/min. The bicarbonate buffer solution containing [3H]cholesterol (3 nmol/L) was perfused with (or without; controls) probucol (5 μmol/L). Data are means ± s.d. of 6 to 7 animals. ***P < 0.01 comparing the probucol group and appropriate controls.
Discussion
In situ brain perfusion was originally developed in rats to measure brain transport with a simple oxygenated bicarbonate solution perfused for short time (Takasato et al, 1984). This initial technique involved ligation of the PTa, but recent changes in surgery and flow rate compensation have allowed it to be left open in both rats and mice techniques (Dagenais et al, 2000; Smith, 1996). The internal carotid gives rise to the PTa before it becomes incorporated into the circle of Willis and the PTa gives rise to the ophthalmic artery during its course. Unilateral ligation of the common carotid has no significant acute influences on the ipsilateral cerebral hemisphere, as there is vascular compensation via the circle of Willis. Similarly, there is reverse perfusion of the internal carotid, and then the PTa, via the circle of Willis when one common carotid is blocked (Davidson et al, 2000; Salter et al, 1998). However, we perfused the carotid as soon after ligation of the arteries as possible to limit any eye injuries. This study assesses the conditions required to measure the brain and eye transport simultaneously using the established in situ mouse brain perfusion model.
The bicarbonate fluid flow rate was that used to measure mouse brain transport by in situ perfusion: 2.5 mL/min (Dagenais et al, 2000). Short perfusions (< 3 mins) at this flow rate of protein-free bicarbonate buffer gave adequate continuous perfusion of the ipsilateral cerebral hemisphere at normal systolic pressure (~120 mm Hg) and a diazepam cerebral flow in mice similar to that of a rat brain perfused at 10 mL/min (Dagenais et al, 2000; Smith, 1996). The mouse brain vascular flow measured with diazepam (42.3 μL/sec per g) was similar to those obtained previously in mice and rats (Dagenais et al, 2000; Rousselle et al, 1998). The ocular flow was 2.2-fold lower than the brain flow. A study on rats using [14C]butanol as flow marker found that the retinal blood flow was 2- to 3-fold lower than in the cortex (Puchowicz et al, 2004), whereas another study using radiolabeled microspheres found that the flow in the whole rat eye was 3.7-fold lower than in the cerebrum (Salter et al, 1998). However, others found that the flow in the retina measured with diazepam by in situ rat carotid perfusion was significantly greater (1.2-fold) than in the frontal cortex (Gratton et al, 1993). These differences could result from comparing different brain and/or eye regions. The flow rate in the rat parietal cortex is one of the highest when measured with this technique (Rousselle et al, 1998). Thus, comparing the flow rates in the retina estimated with diazepam by in situ rat brain perfusion (Gratton et al, 1993) with the flow rate in the parietal cortex (Rousselle et al, 1998) instead of the frontal cortex results in an inversed situation, with a slightly lower retinal flow rate.
Like most in situ brain perfusion experiments, the [3H]diazepam accumulation was performed in a trans-influx zero state and was linear for at least 120 secs. This indicates that the process had a constant net kinetic rate throughout this period, which could be the result of an ‘influx’ component (simple and/or facilitated diffusion) with or without a protein-mediated efflux, as for some P-gp substrates (Cisternino et al, 2001). But whatever the kinetic process(es) occurring at this initial time, each individual kinetic component involved in the net transport occurs at the same constant rate throughout this initial linear accumulation. Diazepam transport is governed only by simple diffusion allowing its use as a flow marker. Diazepam uptake for at least the first 120 secs of exposure corresponds to the initial influx of the kinetic process before any significant equilibrium is reached. The distribution will show as a break in linear drug accumulation if equilibrium is achieved, attributed to a back-flux or postequilibrium efflux. The WO after diazepam accumulation for 120 secs produces an inverted concentration gradient or trans-efflux zero process at the vascular compartment. However, this inversed gradient did not significantly reduce the diazepam in the tissues. As it has not yet reached equilibrium under our conditions, the diazepam tends to continue its tissue distribution over the endothelial or epithelial cells monolayers separating the blood compartment. This diazepam may not be available for exchange with the vascular space, thus no significant vascular clear out or back flux may occur despite the trans-efflux zero imposed by the WO. Although diazepam certainly penetrates deeper than the endothelium and epithelium facing the blood compartments, neither the vitreous nor the aqueous humor contained significant radioactivity, suggesting that there are no significant extra molecular blood pathways by which it could gain direct access to these aqueous tissues other than via the BOB. The short diazepam perfusion time probably prevented or delayed its penetration into deeper parts of the eye, which confirms what is already known about ocular penetration routes of solutes given systematically that must cross at least one BOB cell layer (Cunha-Vaz, 2004; Hornof et al, 2005).
A prerequisite for studies on blood-tissue exchanges is that the vascular wall must remain intact. Our sucrose and inulin brain volumes agree with previously reported values indicating that the BBB is not damaged at a flow rate of 2.5 mL/min (Dagenais et al, 2000). We also find a slightly higher sucrose space than inulin space, which confirms previous reports (Dagenais et al, 2000; Ziya Ziylan et al, 1983). These authors initially attributed this difference to the higher molecular weight of inulin and to its poorer transcellular and paracellular diffusion than sucrose. Reducing the flow rate by 50% further reduces vascular pressure and hence barrier stress. We find that the vascular volumes measured with sucrose or inulin were the same with flow rates of 1.25 and 2.5 mL/min, suggesting that the BBB and BOB remain physically intact at 2.5 mL/min. The presence of tight junctions makes the blood barriers relatively impermeable to most of the hydrophilic solutes in blood as well as to the plasma proteins. As a consequence, the Starling's forces acting on fluid movement in the cerebral capillaries are mainly osmotic forces rather than oncotic pressure (Gratton et al, 1993; Smith, 1996). This makes it possible to use protein-free bicarbonate buffer for short-term in situ carotid perfusion, thus avoiding the need for correction for drug binding to protein in the kinetic modeling. But, we would need to know the unbound fraction in the blood to scale up the in situ perfusion data to the in vivo situation if the free concentrations were different from the total plasma concentrations. We added 4% albumin (physiologic concentration) to the perfusion bicarbonate buffer fluid. This not only restored the oncotic pressure in capillaries although this was not essential for their integrity during the short perfusion used, but it also raised the fluid viscosity and hence the vascular pressure. So, the perfusion flow rate should be reduced by about half to maintain integrity (Takasato et al, 1984). However, we kept the flow rate at 2.5 mL/min despite the added albumin, which raised the vascular pressure (Rapoport, 1976; Takasato et al, 1984). The sucrose eye space was then increased 2.9-fold whereas the brain sucrose increased 4.0-fold, suggesting a breakdown of the blood compartments walls in both the eye and brain. The sucrose space values reflect the degree of damage (Bhattacharjee et al, 2001; Ennis and Betz, 1986; Smith, 1996), and the brain suffered more injury than the eye, as shown by Ennis and Betz (1986) using osmotic opening by arabinose perfusion. This difference in the damage to the brain and retina vasculature after an acute insult has been attributed to the greater pericyte coverage in the retina than in cerebral capillaries, which the authors believe to be responsible for the greater stability and resistance of the eye vasculature (Frank et al, 1990; Laties et al, 1979; Martin et al, 2005).
Perfusion with bicarbonate buffer at 2.5 mL/min preserved the physical integrity of the blood barriers. But, the distribution volumes of sucrose in the eye were larger than those in the brain. Conflicting finding for the sucrose distribution in the rat brain and eye has been reported. The sucrose permeability of the rat eye retina was shown to be ~4-fold higher greater than that of the rat brain (Ennis et al, 1982; Ennis and Betz, 1986), whereas another study found that the retinal sucrose space was similar to that of the rat occipital cortex (Lightman et al, 1987). A recent study using intravenous taurine found that the extrapolated vascular space in the rat eye was ~8.8-fold greater than that in the brain (Tomi et al, 2007). Differences in vascular volume could be related to comparisons of specific brain regions, as mentioned above for diazepam. Differences in tissue anatomy and histology must also be taken into account. The eye also contains a vascular bed, the choroid, formed by leaky fenestrated endothelia, like some regions of the brain (circumventricular and choroid plexus). However, the difference in the abundance of the unfenestrated and fenestrated capillary networks is greater in the eye than in the whole brain (Smith et al, 2002). These anatomic characteristics could give a greater vascular space, fenestrated vessels are more prominent in the eye, and/or reflect a higher vascular density than the brain tissue. The vascularization within the eye is not uniform, as confirmed by our finding of a 2.8-fold greater sucrose space in the posterior eye than in the anterior part of the eye. This could also indirectly reflect the greater need of the retina for nutrition. The sucrose and inulin spaces reflect the intravascular bed space as well as for the fenestrated vessels, the interstitial fluid compartment, or the choroid interstitium surrounding the leaky capillaries and facing RPE at the BRBo, and the unpigmented epithelium of the ciliary arteries from the BAB. However, the sucrose space of the eye was 3.2 times greater than that of the brain, whereas the inulin space was 1.8-fold higher. The eye sucrose space was larger (2.1-fold) than the eye inulin space, which could be due to inulin not accessing all the same compartments as sucrose, as suggested for the brain. The paracellular diffusion of inulin should theoretically be hampered because it is larger (molecular radii 15 Å) and heavier (Mw = ~5,500 Da) than sucrose (5Å; Mw = 340 Da). It should thus be less able to reach the interstitial fluid via endothelium fenestration than sucrose, which might explain why the eye Vv measured with inulin is lower than the Vv measured with sucrose. However, molecules with a radius of 110 Å cannot pass through the fenestrations in the eye, whereas molecules of Mw ~3,000 Da and a radius of 12 Å can move from the choriocapillaris into the interstitial fluid (Federman, 1982; Rabkin et al, 1977). There is a positive link between the metabolic activity of the retina and the number of fenestrations in the choriocapillaris, which leads to the uneven distribution of fenestrations (Federman, 1982; Mancini et al, 1986). However, the paracellular permeability of solutes and the molecular interactions at the basal lamina of the eye choroid need further study. Other features of the retina, such as the small diameter and tortuous nature of the capillaries (Patton et al, 2005), could hinder the distribution of inulin in the eye vasculature. However, [14C]sucrose gets distributed and its accumulation in the eye or brain during a short perfusion is rapid and reversible as shown by the WO procedure. Its distribution is probably restricted to the extracellular compartments such as vascular beds and interstitial fluid (Ennis and Betz, 1986). However, we still detected a residual sucrose volume of 5 ± 4 μL/g (8%) in the eye after the WO, which may suggest some intracellular distribution. However, this residual sucrose volume does not explain why the sucrose volume is ~2-fold greater than that of inulin in the eye. As the blood compartments walls remained intact, further exploration of the functional properties of these barriers remains possible.
The carrier GLUT1 supports carrier-mediated saturable stereospecific and phloretin sensitive of d-glucose uptake through the endothelial and epithelial cells forming the BOB, as in the BBB, and permits uptake to exceed the metabolic demand of the tissue (Kumagai, 1999). The d-glucose Km at the BBB is between 2 and 11 mmol/L (Puchowicz et al, 2004), which agrees with our finding. However, a previous in situ mouse brain perfusion study found a higher Km (~17 mmol/L) (Dagenais et al, 2000). This difference could be due to our study design, which included a prewash of the vasculature to equilibrate and minimize trans-stimulation of the transport by the various physiologic amounts of glucose already present in the endothelial/epithelial cells forming the blood barriers. Few in vivo studies have measured d-glucose transport in the retina with a test reference injected together by a carotid bolus method: the retinal uptake index (Alm et al, 1981; Ennis et al, 1982). Ennis et al (1982) use a 10-min carotid prewash perfusion at a fixed glucose concentration, whereas we used a 30-sec prewash. These authors then injected via the carotid 800 μL containing [3H]water and [14C]d-glucose. The retina was dissected 10 secs after the bolus injection (Ennis et al, 1982). They showed that the rat eye retained its electrical activity despite the very low glucose concentrations perfused (less than 1 mmol/L) for 10 mins and that the Km for [14C]d-glucose uptake by the retina had both low-affinity (0.24 mmol/L) and high-affinity (7.81 mmol/L) components as determined by an Eadie-Hofstee plot (Ennis et al, 1982). However, this kinetic approach gave no Vmax of the transport process. We find that the Km for d-glucose entering the eye is higher (~23 mmol/L) than for the brain, and a Vmax of ~40, μmol/sec per g, which was ~2-fold higher than the brain Vmax. Some studies suggest that the eye Vmax is higher than that for the brain because there is more GLUT1 in the rat retinal capillaries than in the rat brain capillaries (Badr et al, 2000). An in vivo rat study that measured glucose influx into both the brain and retina using a blood glucose concentration of 2 to 32 mmol/L, confirms that the glucose influx obeys Michaelis—Menten kinetics at the brain but not at the retina (Puchowicz et al, 2004). This observation for the retina agrees with our finding, because the glucose influx rate is proportional and linear when the glucose concentration is below or close to the Km value. The fact that diabetes is involved in the pathogenesis of retinopathies suggests that there should be differences between glucose transport in the brain and in the eye. They could involve specific biochemical features of the eye, such as GLUT1 downregulation, loss of pericytes, and neovascularization (Kumagai, 1999).
The age-related accumulation of cholesterol at the BRBo is apparently unique in its potential impact on fluid and nutrient exchange, unlike that which occurs in other connective tissues such as cornea, sclera, and arterial intima. The accumulation of lipid particles, including esterified and unesterified cholesterol, eventually leads to a confluent lipid wall that can isolate the retina from its blood supply (Ruberti et al, 2003). The production of ABCA1 by cells promotes the efflux of both free cholesterol and phospholipids to extracellular lipid-free or lipid-poor acceptors such as apolipoprotein A-I (apoA-I). Abca1 mRNA has be found in porcine, rat, and human brain capillaries (Akanuma et al, 2008; Ohtsuki et al, 2004) and in the monkey RPE (Tserentsoodol et al, 2006). Our results suggest that there is a probucol-sensitive-mediated cholesterol efflux, probably Abca1 transport, acting at the luminal membrane of the BBB and the BOB. There is much debate about whether the mechanisms of ABCA1-mediated lipid efflux is direct or indirect (Smith et al, 2004). Our findings support a cholesterol efflux without any need for a cholesterol acceptor such as apoA-I. In previous studies, it was shown that binding to apoA-I and lipid flux could be dissociated and that free cholesterol is exported with or without the binding of apoA-I to ABCA1. But, the binding of apoA-I to ABCA1 stimulates the mediated cholesterol efflux (Duong et al, 2008; Mukhamedova et al, 2007; Smith et al, 2004). A free cholesterol concentration of 2.5 mmol/L (~100 mg/dL) did not modulate its transport, which suggests a high transport capacity as for some ABCB1 substrates (Cisternino et al, 2004). Moreover, the higher than usual (~130 mg/dL) plasma total cholesterol concentrations (> 1,000 mg/dL) did not alter the brain cholesterol concentration, suggesting that a no-linear ‘zero’ order rate kinetic resulting from saturation of the transport system at the BBB is unlikely, as the brain concentration is still controlled (Elder et al, 2007).
The mechanisms of the transport taking place at the diverse BOB should be examined separately.
Although nonalbino rodent can be used to distinguish the RPE from the neural retina by visual inspection, so that they can be dissected out separately (Smith et al, 2002), sampling the neural retina cannot be used to distinguish a compound that enters via the BRBi and/or the BRBo. The two BRBs both control the direct access of molecules to the neural tissue, and cannot be distinguished by in vivo experiments unlike the BBB and blood—cerebrospinal fluid barrier. In vitro models could help distinguish between these selective functional properties. However, these models need further validation (Hosoya and Tomi, 2005) and checking with in vivo data. The in vivo limitation to identifying transport through each retinal or aqueous barrier could also be an advantage, as it permits the simultaneous evaluation of neural retina and/or aqueous access in a single experiment.
Conclusion
The in situ perfusion of the mouse carotid does not threaten vascular integrity and permits the simultaneous measurement of transport across the blood barriers of the brain and the eye. Although the anterior and posterior retinal segments could be dissected out to measure the net transport, each component forming the BABs and the BRBs cannot yet be treated individually. The great advantage of in situ mouse brain perfusion is that it can assess the transport parameters of solutes in vivo at both the BBB and BOB in transgenic strains of mice and in a variety of pathophysiological states.
Footnotes
The authors state no conflict of interest.
References
1.
AkanumaSIHoriSOhtsukiSFujiyoshiMTerasakiT (2008) Expression of nuclear receptor mRNA and liver X receptor-mediated regulation of ABC transporter A1 at rat blood—brain barrier. Neurochem Int52:669–74.
2.
AlberghinaMInfarinatoSAnfusoCDLupoG (1994) 1-Acyl-2-lysophosphatidylcholine transport across the blood-retina and blood—brain barrier. FEBS Lett351:181–5.
3.
AlmATörnquistP (1981) The uptake index method applied to studies on the blood-retinal barrier. A methodology study. Acta Physiol Scand113:73–9.
4.
AlmATörnquistPMäepeaO (1981) The uptake index method applied to studies on the blood—retinal barrier. Transport of several hexoses by a common carrier. Acta Physiol Scand113:81–4.
5.
BachelardHSDanielPMLoveERPrattOE (1973) The transport of glucose into the brain of the rat in vivo. Proc R Soc Lond B Biol Sci183:71–82.
6.
BadrGATangJIsmail-BeigiFKernTS (2000) Diabetes downregulates GLUT1 expression in the retina and its microvessels but not in the cerebral cortex or its microvessels. Diabetes49:1016–21.
7.
BhattacharjeeAKNagashimaTKondhoTTamakiN (2001) Quantification of early blood—brain barrier disruption by in situ brain perfusion technique. Brain Res Brain Res Protoc8:126–31.
8.
CisterninoSRousselleCDagenaisCScherrmannJM (2001) Screening of multidrug-resistance sensitive drugs by in situ brain perfusion in P-glycoprotein-deficient mice. Pharm Res18:183–90.
9.
CisterninoSRousselleCDebrayMScherrmannJM (2004) In situ transport of vinblastine and selected P-glycoprotein substrates: implications for drug-drug interactions at the mouse blood—brain barrier. Pharm Res21:1382–9.
10.
Cunha-VazJG (2004) The blood-retinal barriers system. Basic concepts and clinical evaluation. Exp Eye Res78:714–21.
11.
DagenaisCRousselleCPollackGMScherrmannJM (2000) Development of an in situ mouse brain perfusion and its application to mdr1a P-glycoprotein-deficient mice. J Cereb Blood Flow Met20:381–6.
12.
DavidsonCMPappasBAStevensWDFortinTBennettSA (2000) Chronic cerebral hypoperfusion: loss of pupillary reflex, visual impairment and retinal neurodegeneration. Brain Res859:96–103.
13.
DuongPTWeibelGLLund-KatzSRothblatGHPhillipsMC (2008) Characterization and properties of prebeta-HDL particles formed by ABCA1-mediated cellular lipid efflux to ApoA-I. J Lipid Res (in press).
14.
ElderGAChoJYEnglishDFFranciosiSSchmeidlerJSosaMAGasperiRDFisherEAMathewsPMHaroutunianVBuxbaumJD (2007) Elevated plasma cholesterol does not affect brain Abeta in mice lacking the low-density lipoprotein receptor. J Neurochem102:1220–31.
15.
EnnisSRBetzL (1986) Sucrose permeability of the blood-retinal and blood—brain barriers. Effects of diabetes, hypertonicity and iodate. Invest Ophthalmol Vis Sci27:1095–102.
16.
EnnisSRJohnsonJEPautlerEL (1982) In situ kinetics of glucose transport across the blood-retinal barrier in normal rats and rats with streptozocin-induced diabetes. Invest Ophthalmol Vis Sci23:447–56.
17.
FavariELeeMCalabresiLFranceschiniGZimettiFBerniniFKovanenPT (2004) Depletion of prebeta-high density lipoprotein by human chymase impairs ATP-binding cassette transporter A1- but not scavenger receptor class B type I-mediated lipid efflux to high density lipoprotein. J Biol Chem279:9930–6.
18.
FedermanMD (1982) The fenestrations of the choriocapillaris in the presence of choroidal melanoma. Trans Am Ophthalmol Soc80:498–516.
19.
FrankRNTurczynTJDasA (1990) Pericyte coverage of retinal and cerebral capillaries. Invest Ophthalmol Vis Sci31:999–1007.
20.
GrattonJALightmanSLBradburyMW (1993) Transport into retina measured by short vascular perfusion in the rat. J Physiol470:651–63.
21.
HornofMToropainenEUrttiA (2005) Cell culture models of the ocular barriers. Eur J Pharm Biopharm60:207–25.
22.
HosoyaKITomiM (2005) Advances in the cell biology of transport via the inner blood-retinal barrier: establishment of cell lines and transport functions. Biol Pharm Bull28:1–8.
23.
KumagaiAK (1999) Glucose transport in brain and retina: implications in the management and complication of diabetes. Diabetes Metab Res Rev15:261–73.
24.
LatiesAMRapoportSIMcGlinnA (1979) Hypertensive breakdown of cerebral but not of retinal blood vessels in rhesus monkey. Arch Ophthalmol97:1511–4.
25.
LightmanSLPalestineAGRapoportISRechthandE (1987) Quantitative assessment of the permeability of the rat blood-retinal barrier to small water-soluble non-electrolytes. J Physiol389:483–90.
26.
LucchesiKJGosselinRE (1990) Mechanism of l-glucose, raffinose, and inulin transport across intact blood—brain barriers. Am J Physiol258:H695–705.
27.
ManciniMAFrankRNKeirnRJKennedyAKhouryJK (1986) Does the retinal pigment epithelium polarize the choriocapillaris?Invest Ophthalmol Vis Sci27:336–45.
28.
MartinSLAHoffmanWHMarcusDMPassmoreGGDaltonRR (2005) Retinal vascular integrity following correction of ketoacidosis in children and adolescents. J Diabetes Complicat19:233–7.
29.
MukhamedovaNFuYBukrinskyMRemaleyATSviridovD (2007) The role of different regions of ATP-binding cassette transporter A1 in cholesterol efflux. Biochemistry46:9388–98.
30.
OhtsukiSTerasakiT (2007) Contribution of carrier-mediated transport systems to the blood—brain barrier as a supporting and protecting interface for the brain; importance for CNS drug discovery and development. Pharm Res24:1749–58.
31.
OhtsukiSWatanabeYHoriSSuzukiHBhongsatiernJFujiyoshiMKamoiMKamiyaNTakanagaHTerasakiT (2004) mRNA expression of the ATP-binding cassette transporter subfamily A (ABCA) in rat and human brain capillary endothelial cells. Biol Pharm Bull27:1437–40.
32.
PattonNAslamTMacGillivrayTPattieADearyIJDhillonB (2005) Retinal vascular image analysis as a potential screening tool for cerebrovascular disease: a rationale based on homology between cerebral and retinal microvasculatures. J Anat206:319–48.
33.
PuchowiczMAXuKMagnessDMillerCLustWDKernTSLaMannaJC (2004) Comparison of glucose influx and blood flow in retina and brain of diabetic rats. J Cereb Blood Flow Met24:449–57.
34.
RabkinMDBellhornMBBellhornRW (1977) Selected molecular weight dextrans for in vivo permeability studies of rat retinal vascular disease. Exp Eye Res24:607–12.
35.
RapoportSI (1976) Opening of the blood—brain barrier by acute hypertension. Exp Neurol52:467–79.
36.
RousselleCLefauconnierJMAllenDD (1998) Evaluation of anesthetic effects on parameters for the in situ rat brain perfusion technique. Neurosci Lett257: 139–42.
37.
RubertiJWCurcioCAMillicanCLMencoBPHuangJDJohnsonM (2003) Quick-freeze/deep-etch visualization of age-related lipid accumulation in Bruch's membrane. Invest Ophthalmol Vis Sci44:1753–9.
38.
SalterJMCassoneVMWilkersonMKDelpMD (1998) Ocular and regional cerebral blood flow in aging Fischer-344 rats. J Appl Physiol85:1024–9.
39.
SmithJDLe GoffWSettleMBrubakerGWaeldeCHorwitzAOdaMN (2004) ABCA1 mediates concurrent cholesterol and phospholipid efflux to apolipoprotein A-I. J Lipid Res45:635–44.
40.
SmithQR (1996) Brain perfusion systems for studies of drug uptake and metabolism in the central nervous system. In: Models for assessing drug absorption and metabolism (BorchardtRTSmithPLWilsonG, eds), Plenum Press: New York, vol 8:285–307.
41.
SmithRS, co-editors: JohnSWMNishinaPMSundbergJP (2002) Systemic evaluation of the mouse eye: anatomy, pathology and biomethods. CRC Press LLC: Boca Raton, FA.
42.
TakasatoYRapoportSISmithQR (1984) An in situ brain perfusion technique to study cerebrovascular transport in the rat. Am J Physiol247:H484–93.
43.
TomiMTerayamaTIsobeTEgamiFMoritoAKurachiMOhtsukiSKangYSTerasakiTHosoyaK (2007) Function and regulation of taurine transport at the inner blood-retinal barrier. Microvasc Res73:100–6.
44.
TserentsoodolNGordiyenkoNVPascualILeeJWFlieslerSJRodriguezIR (2006) Intraretinal lipid transport is dependent on high density lipoprotein-like particles and class B scavenger receptors. Mol Vis12:1319–33.
45.
Ziya ZiylanYRobinsonPJRapoportSI (1983) Differential blood—brain barrier permeabilities to [14C] sucrose and [3H]inulin after osmotic opening in the rat. Exp Neurology79:845–57.