
Abstract
Monitoring the progression of the vascular structure and cerebral blood flow (CBF) after brain injury is vital to understand the neurovascular recovery process. Multiexposure speckle imaging (MESI) provides a quantitatively accurate technique for chronically measuring the postocclusion CBF perfusion of the infarct and peri-infarct regions in rodent stroke models, while multiphoton microscopy offers direct visualization of the microvascular structure. In this paper, we present imaging outcomes extending 35 days after photo-thrombotic occlusion, tracking the progression of the vasculature throughout this period. We compare MESI flow estimates within the unresolvable parenchyma with subsurface microvascular volume fractions taken with two-photon microscopy in the same regions to assess how the vascular density influences the surface-integrated MESI flow values. The MESI flow measurements and volume fractions are shown to have high correlations (r=0.90) within areas of recovering vasculature in the peri-infarct region. We also observe vascular reorientation occurring within the microvascular structure throughout the 35-day postocclusion period. With the combination of a chronic mouse model and relatively noninvasive optical imaging techniques, we present an imaging protocol for monitoring long-term vascular progression after photo-thrombotic occlusion with the potential to test the efficacy of rehabilitation and pharmacological therapies.
Keywords
INTRODUCTION
Postocclusion microvascular blood flow has been shown to be an important indicator of overall tissue outcome.1,2 Many patients experience a partial recovery after stroke onset without treatment during a short period of plasticity occurring within the region of tissue surrounding the occlusion known as the penumbra. 3 This period of neuroplasticity is the beginning of the remodeling process, resulting in neovascularization and reperfusion of the existing vascular structure within the penumbra regions and continuing on into the ischemic core. 4 Residual tissue perfusion and vascular reperfusion have important roles in the overall poststroke recovery outcomes, giving rise to a need for noninvasive, quantitatively accurate imaging techniques capable of repeatedly measuring tissue perfusion during the stroke recovery process over an experimental period of weeks to months.
Traditional optical techniques used in vascular imaging rely either on the tracking of contrast agents, such as red blood cells or exogenous dyes in laser scanning microscopy,5–8 or on dynamic light scattering, as seen in laser doppler flowmetry
9
and laser speckle contrast imaging (LSCI).10–14 Recent advances in LSCI termed multiexposure speckle imaging (MESI) have allowed for the technique to move from primarily acute experiments to chronic studies through improvements in its quantitative accuracy of blood flow measurements.
15
By using multiple camera exposures spanning almost three decades in duration and improved mathematical models, MESI is able to more precisely sample and map the flow distributions prevalent in the rodent vasculature.
16
Studies have shown MESI to accurately estimate a wide range of flows
Multiexposure speckle imaging provides high quantitative accuracy of cerebral blood flow (CBF) dynamics and provides reliable spatial perfusion indices that help to characterize vascular progression after ischemic stroke, but remains a depth-integrated imaging technique. Two-photon laser scanning microscopy provides a depth-resolved technique with the ability to monitor the degree and time scale of poststroke vascular structure in three dimensions. Direct visualization of the vessel organization of vessels using two-photon microscopy is necessary for understanding the physiologic origin of the MESI measurements within the unresolvable subsurface microvasculature. By utilizing this combination of techniques, we present a protocol with the ability to chronically track postocclusion neurovascular outcomes at and below the surface of the mouse cortex.
MATERIALS AND METHODS
Animal Preparation
Mice (CD-1, male, 30 g, Charles River, Wilmington, MA, USA) were anesthetized with isoflurane (2.0%) via a nose-cone. Body temperature was maintained at 37°C throughout sterile surgery and imaging using a feedback temperature control system (FHC, Bowdoin, ME, USA). Vitals, including heart rate, breath rate, and arterial oxygen saturation, were monitored with a pulse oximeter (MouseOX, Starr Life Sciences Corp., Oakmont, PA, USA). After induction, mice were placed in a stereotaxic frame (Narishige Scientific Instrument Lab, Tokyo, Japan) and administered injections of carprofen (5 mg/kg, subcutaneous) and dexamethasone (2 mg/kg, intramuscular) to reduce inflammation of the brain after skull removal during the craniotomy. A 4 × 3 mm portion of skull was removed via dental drill (Ideal Microdrill, 0.5 mm burr; Fine Science Tools, Foster City, CA, USA) with constant perfusion of sterile artificial cerebral spinal fluid (buffered pH 7.4). A thin layer of cyanoacrylate (Vetbond, 3 M, St Paul, MN, USA) was applied to the areas of exposed skull to facilitate the adhesion of dental cement in a following step. A 5- to 8-mm round coverglass (#1.5, World Precision Instruments, Sarasota, FL, USA) was placed on the brain with a layer of artificial cerebral spinal fluid separating the two. While applying gentle pressure to the coverglass, a dental cement mixture was wicked around the perimeter of the coverglass and sealed to skull. This process ensured a sterile airtight seal around the craniotomy and restored intracranial pressure. A second layer of cyanoacrylate was then applied over the dental cement mixture to further seal the cranial window. Animals were allowed to recover from anesthesia and were monitored for cranial window integrity and behavior normality for 4 to 6 weeks before imaging.
Imaging Techniques
This study used two optical imaging techniques in MESI and two-photon fluorescence microscopy, chosen to combine and compare measurements from a global, depth-integrated, field of view with a local, depth-resolved field of view.
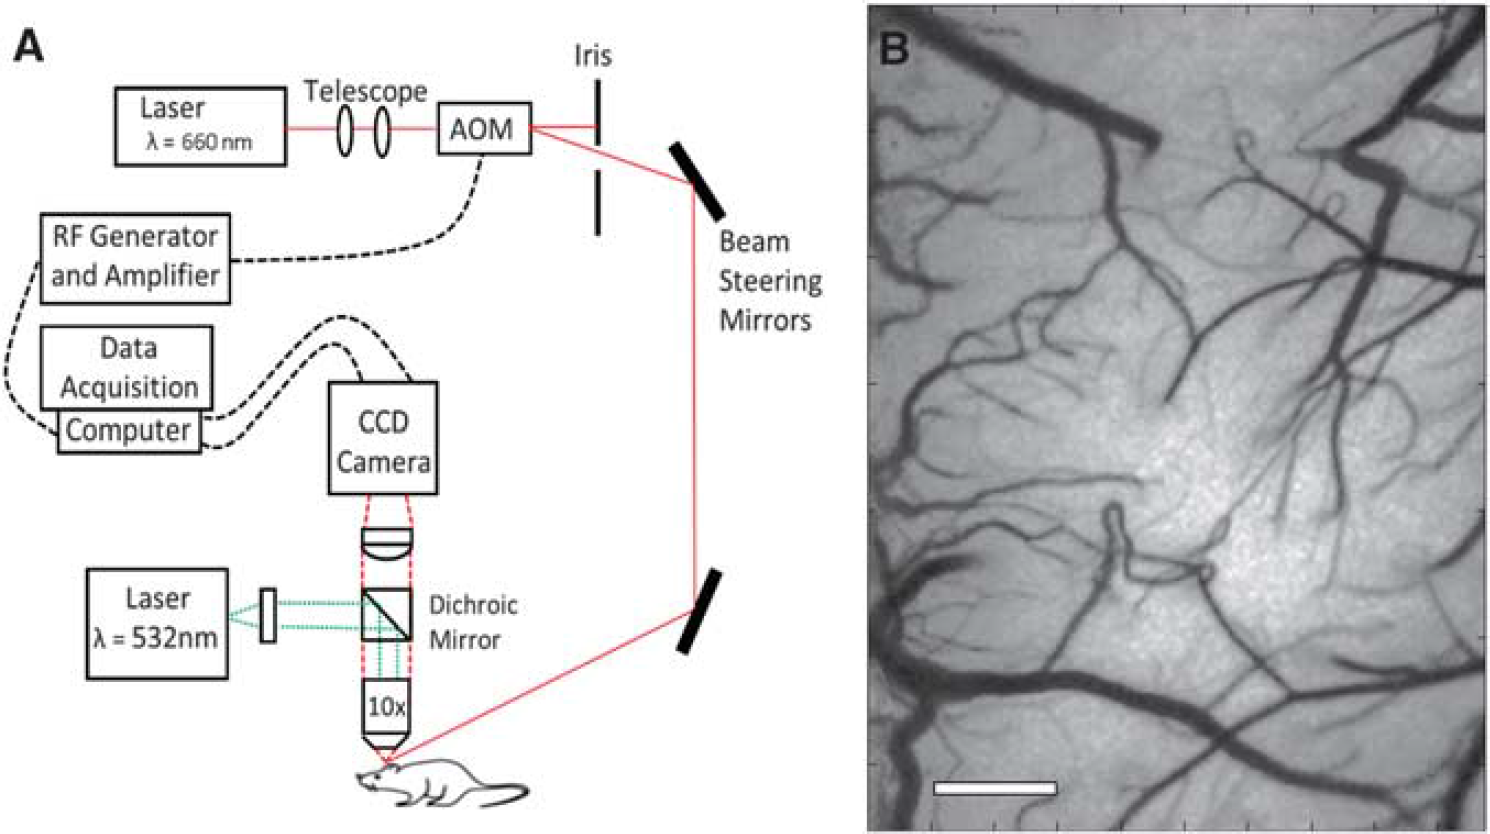
Multiexposure speckle imaging was performed as reported in previous publications,16,17 by illuminating the cranial window with a laser diode (λ = 660 nm, Micro Laser Systems, Garden Grove, CA, USA). The exposure and amplitude of the illumination were controlled by an acousto-optic modulator, while a camera (A602f: Basler Vision Technologies, Ahrensburg, Germany) was simultaneously triggered over 15 exposure durations ranging from 0.05 ms to 80 ms. The backscattered light from cranial window was collected by a × 10 objective (Figure 1A) and imaged onto a CCD camera. To generate speckle contrast images from the raw data, a 5 × 5 pixel window was used to determine each speckle contrast value, defined as the ratio of the standard deviation (σs) to the mean of the recorded intensity (˂I˃). 19 Each of the 15 exposure durations generated a single-exposure speckle contrast image, and together corresponded to one MESI computed frame (Figure 1B).
(
The MESI model maps the dependence of the speckle contrast value on the exposure duration of the camera to obtain an estimate of the correlation time of the speckles, τ
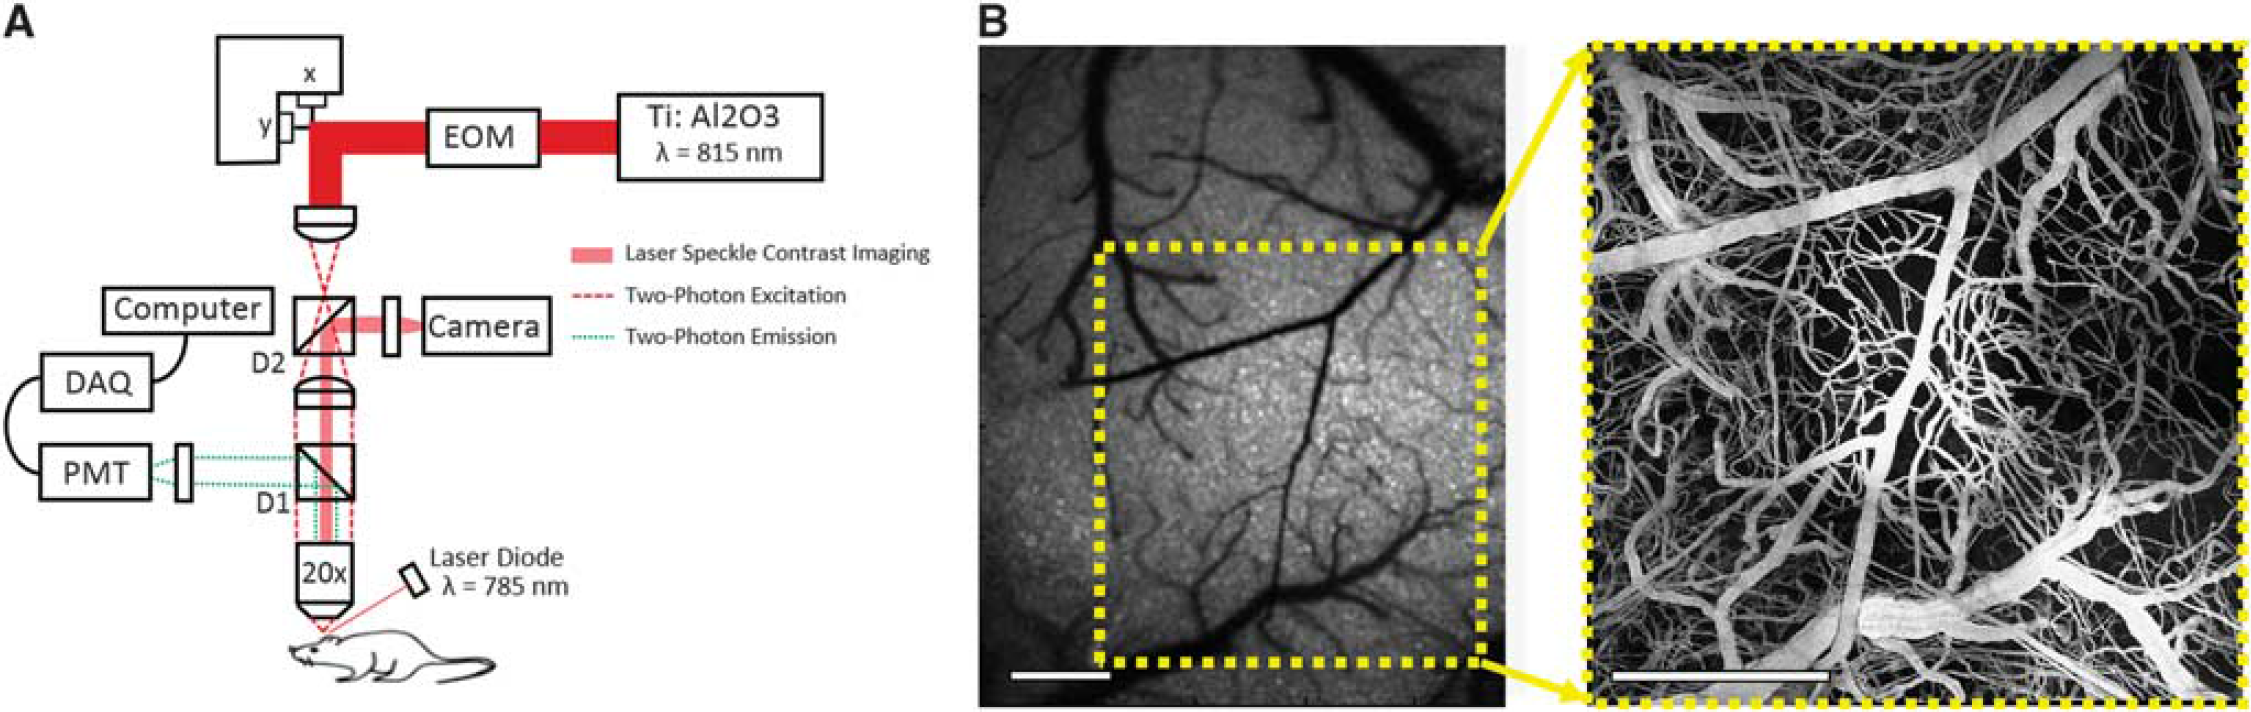
Two-photon fluorescence microscopy was performed using a custom-built system that also integrates LSCI (Figure 2A). The system uses a large back-aperture objective (NA = 0.95) with a long working distance, two-inch collection optics, and uncooled, unhoused photon-counting PMTs (H10770PB-40, Hamamatsu Photonics, Hamamatsu, Japan) to optimize collection efficiency. 22 A Ti:sapphire femtosecond excitation laser (Mira 900 f, 140 fs, 76 MHz, λo = 815 nm, Coherent Inc., Santa Clara, CA, USA) was tuned to optimize acquisition of signal from the fluorescent vascular label, FITC-dextran (0.1 mL, 5% w-v, Sigma, St. Louis, MO, USA). Laser intensity was controlled with an electro-optical modulator, and a dichroic mirror, D1, was to separate excitation and emission light. Laser speckle imaging was used to identify and target vascular regions imaged in previous MESI sessions (Figure 2B).
(
Vascular Occlusion Via Photo-Thrombosis
To study the poststroke vascular progression in the mouse cortex, photo-thrombotic occlusions were administered. Rose Bengal (0.2 mL, 15 mg/mL, intraperitoneal), a fast clearing photothrombotic agent,23–25 was injected and a green laser (532 nm, Aixiz, Houston, TX, USA) was focused on the targeted descending arterioles (0.6 mm diameter focal spot, 20 mW), with a goal of disrupting oxygen delivery to the local area, as descending arterioles have been shown to serve as bottlenecks in the cortical oxygen supply. 26 Laser speckle contrast imaging was performed in real time to monitor clot formation in the region of interest and control the extent of the occlusion.
Experiment Protocol
Animals with clear and healthy cranial windows after 4 to 6 weeks of recovery postsurgery were anesthetized with 70% N2/O2 vaporized isoflurane via nose-cone and affixed to a stereotaxic frame. Vitals were recorded via pulse oximetry and temperature was maintained by feedback as described previously. Multiexposure speckle imaging was performed over a 2.7 × 2.0 mm field of view centered on the region of interest by collecting 300 frames at each exposure. Animals were then carted to a combined two-photon fluorescence and LSCI system, with FITC-dextran (0.1 mL, 5% w-v, Sigma) administered retro-orbitally to label the blood plasma. A vascular image stack was taken by scanning 600 μm × 600 μm images of the vascular structure every 2 μm in depth down to 300μm. Each animal underwent imaging of a 2 × 2 or 3 × 3 grid of vascular image stacks centered on the infarct area, resulting in 1 × 1 mm to 1.5 × 1.5 mm fields of view, respectively.
Multi-exposure speckle imaging experiments were conducted twice weekly, with 2 weeks of baseline sessions and 5 weeks of poststroke measurements. Targeted occlusions were delivered immediately after the final baseline imaging session. Postocclusion imaging sessions were performed twice weekly until 21 days after occlusion, then weekly until an end point of 35 days. Two-photon imaging was performed over the same experimental period with one baseline session and seven poststroke measurements starting at Days 0 and 3, then weekly until the 35-day end point. All experiments were approved by the Institutional Animal Care and Use Committee (IACUC) at The University of Texas at Austin under guidelines and regulations consistent with the Guide for the Care and Use of Laboratory Animals, the Public Health Service Policy on Humane Care and Use of Laboratory Animals (PHS Policy), and the Animal Welfare Act and Animal Welfare Regulations.
Image Processing for Data Analysis
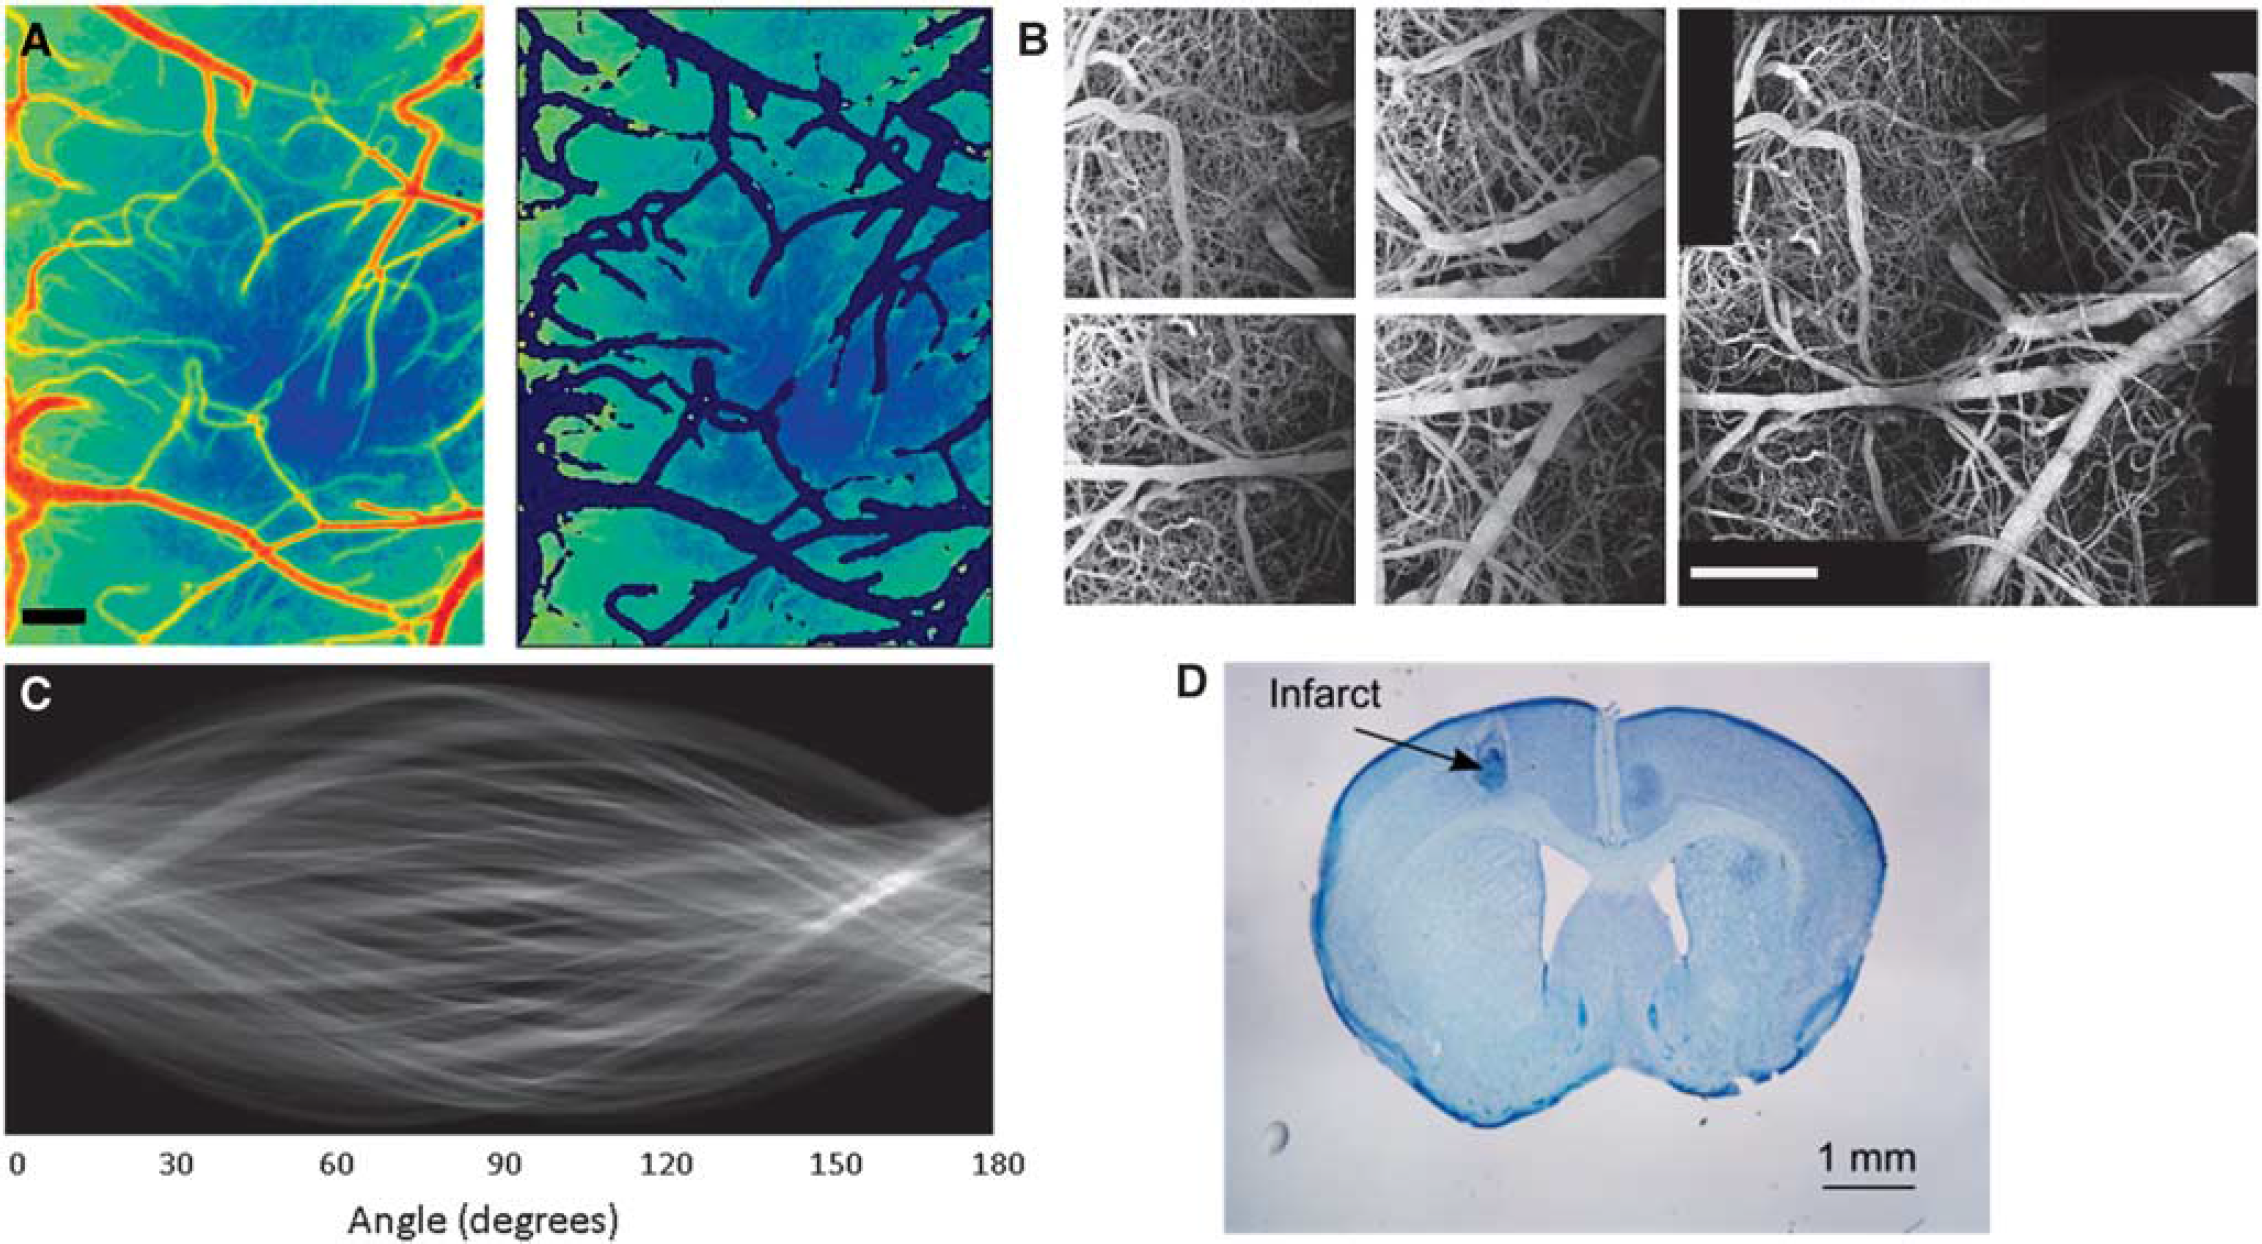
Images of ICT measurements taken with MESI were processed in MATLAB (Mathworks, Natick, MA, USA). To reduce variability between animals and focus on signal attributed to unresolved microvasculature, an image processing script to remove surface vessels from ICT maps was developed, leaving only ICT measurements taken within the parenchyma (Figure 3A). These parenchymal ICT maps were used in comparisons with subsurface measurements of volume fractions from two-photon imaging.
(
To increase the field of view without sacrificing spatial resolution of the two-photon images, vascular stacks were taken around the region of interest and stitched together in postprocessing (Figure 3B). This process was performed in ImageJ with an algorithm developed by Preibisch
Binary images of the subsurface vascular structure were read into MATLAB to analyze the distribution of orientation angles seen in these vessels. This analysis used the Radon transform,29,30 which takes line integrals at different tangents along the image. A sinogram (Figure 3C) of the Radon transform was generated to calculate the variance at each angle, σ 2 (θ). This variance measurement describes the distribution of angles seen by the Radon transform. 31 By comparing the variances between angles, the distribution of the angular orientations of vessels within the binary stack can be measured.
Histology and Statistical Analysis
After the final imaging sessions at the Day 35 postocclusion time point, histologic assessments of the mouse brain were taken to study the lesion size and location (Figure 3D). Nissl staining of a 30-μm coronal section with toluidine blue was used. This stain is selective for Nissl bodies found predominantly in polyribosomal structures in the soma and processes of neurons and glia, and the absence of the stain is indicative of an absence of cells.
To determine whether baseline prestroke MESI ICT values were statistically different from postocclusion measurements, two-tailed paired
RESULTS
Cerebral Blood Flow Progression
Measurements of the prestroke and poststroke CBF dynamics of each animal (
(
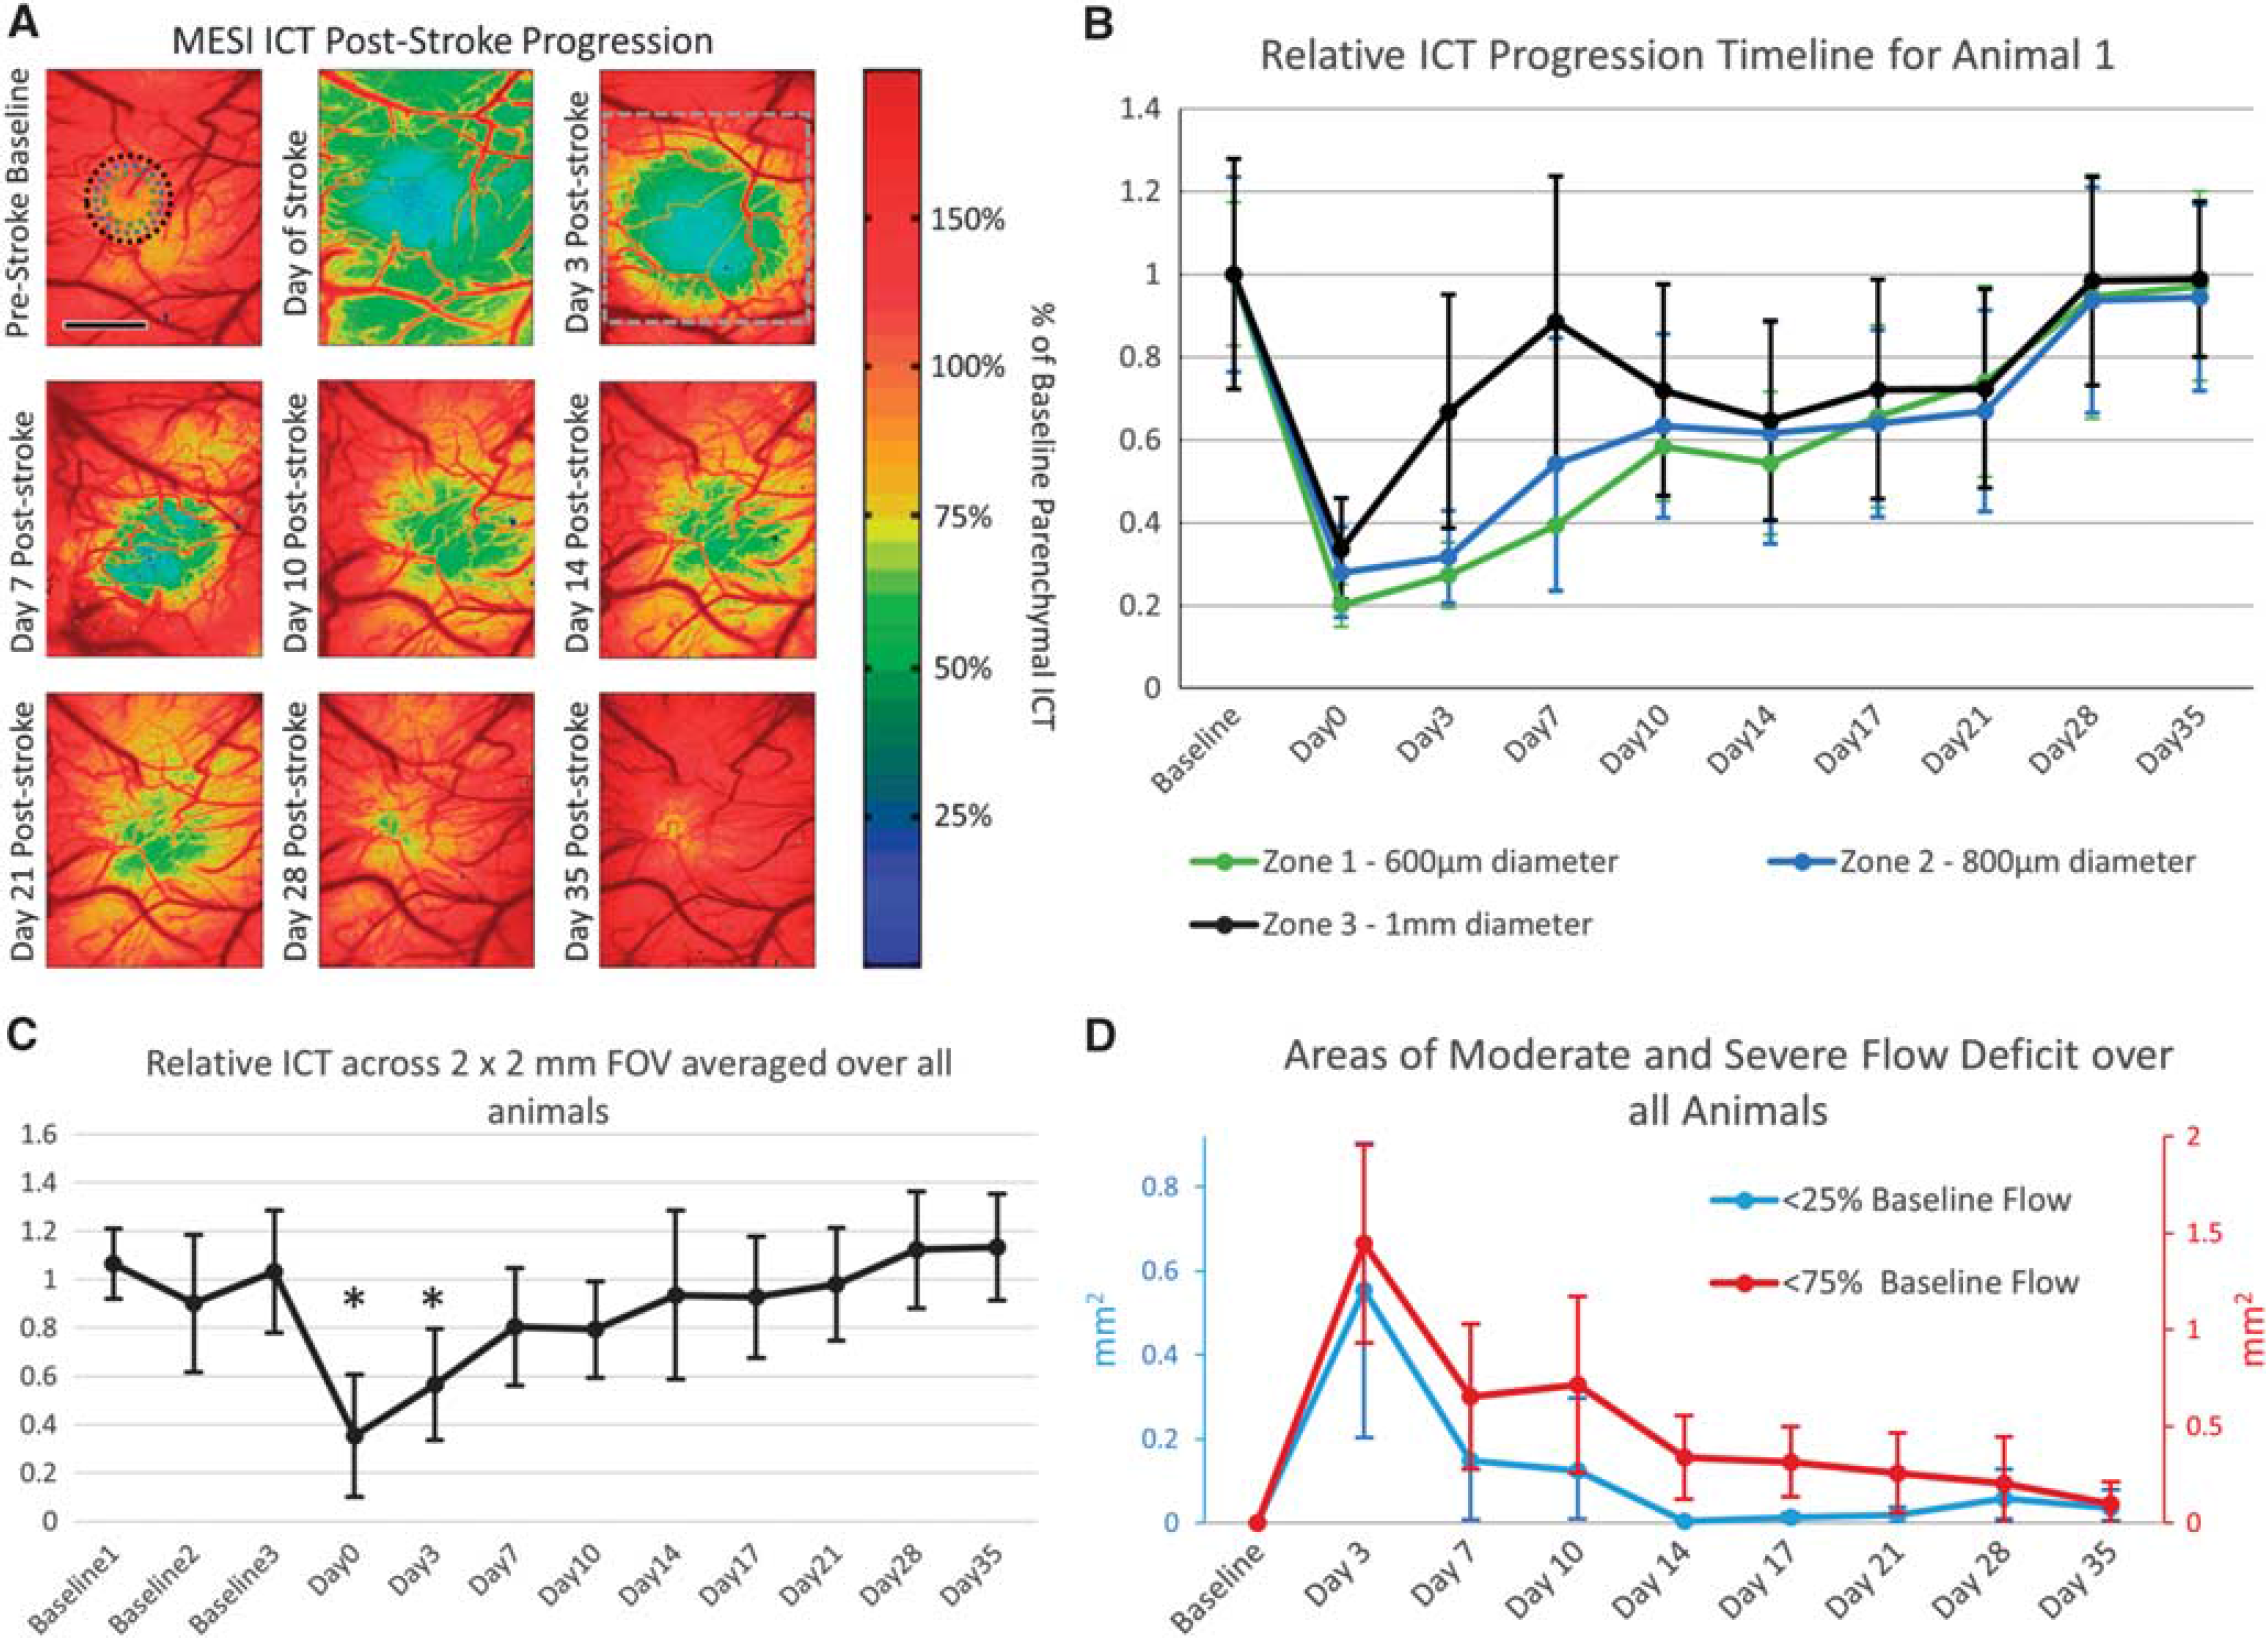
After a period of 10 to 14 days, substantial flow (>50%) returned to the center of the occlusion site (Zone 1), with a severe flow deficit area of < 1% of that seen in Day 3 (Figures 4A and 4B).
This trend of perfusion of the severe flow deficit area by Day 14 was consistently observed over all animals (Figure 4D). Though there did not appear to be reperfusion of the vessel targeted during occlusion over the duration of the experiment with MESI, regional perfusion values throughout the peri-infarct region (Zones 2 and 3) were > 50% of baseline measurements by Day 21 after stroke (Figures 4A and 4B). As very few surface vessels were observed within areas of severe flow deficit, these ICT measurements suggest that increased flow is occurring within the subsurface microvasculature. By Day 28, the average area of moderate flow deficit over all animals was reduced to < 5% of the area seen in Day 3, suggesting that the vasculature had fully perfused the occlusion area within this time frame (Figure 4D).
Global progression of ICT values averaged over a 2 × 2 mm field of view centered on the occlusion site for all animals (Figure 4C) was normalized by the average of the three baseline values. Measurements of ICT across the 2 × 2 mm field of view (Figure 4A) showed significant changes in blood flow from the averaged baseline flow were seen for Days 0 and 3 (
Structural Progression of Vasculature
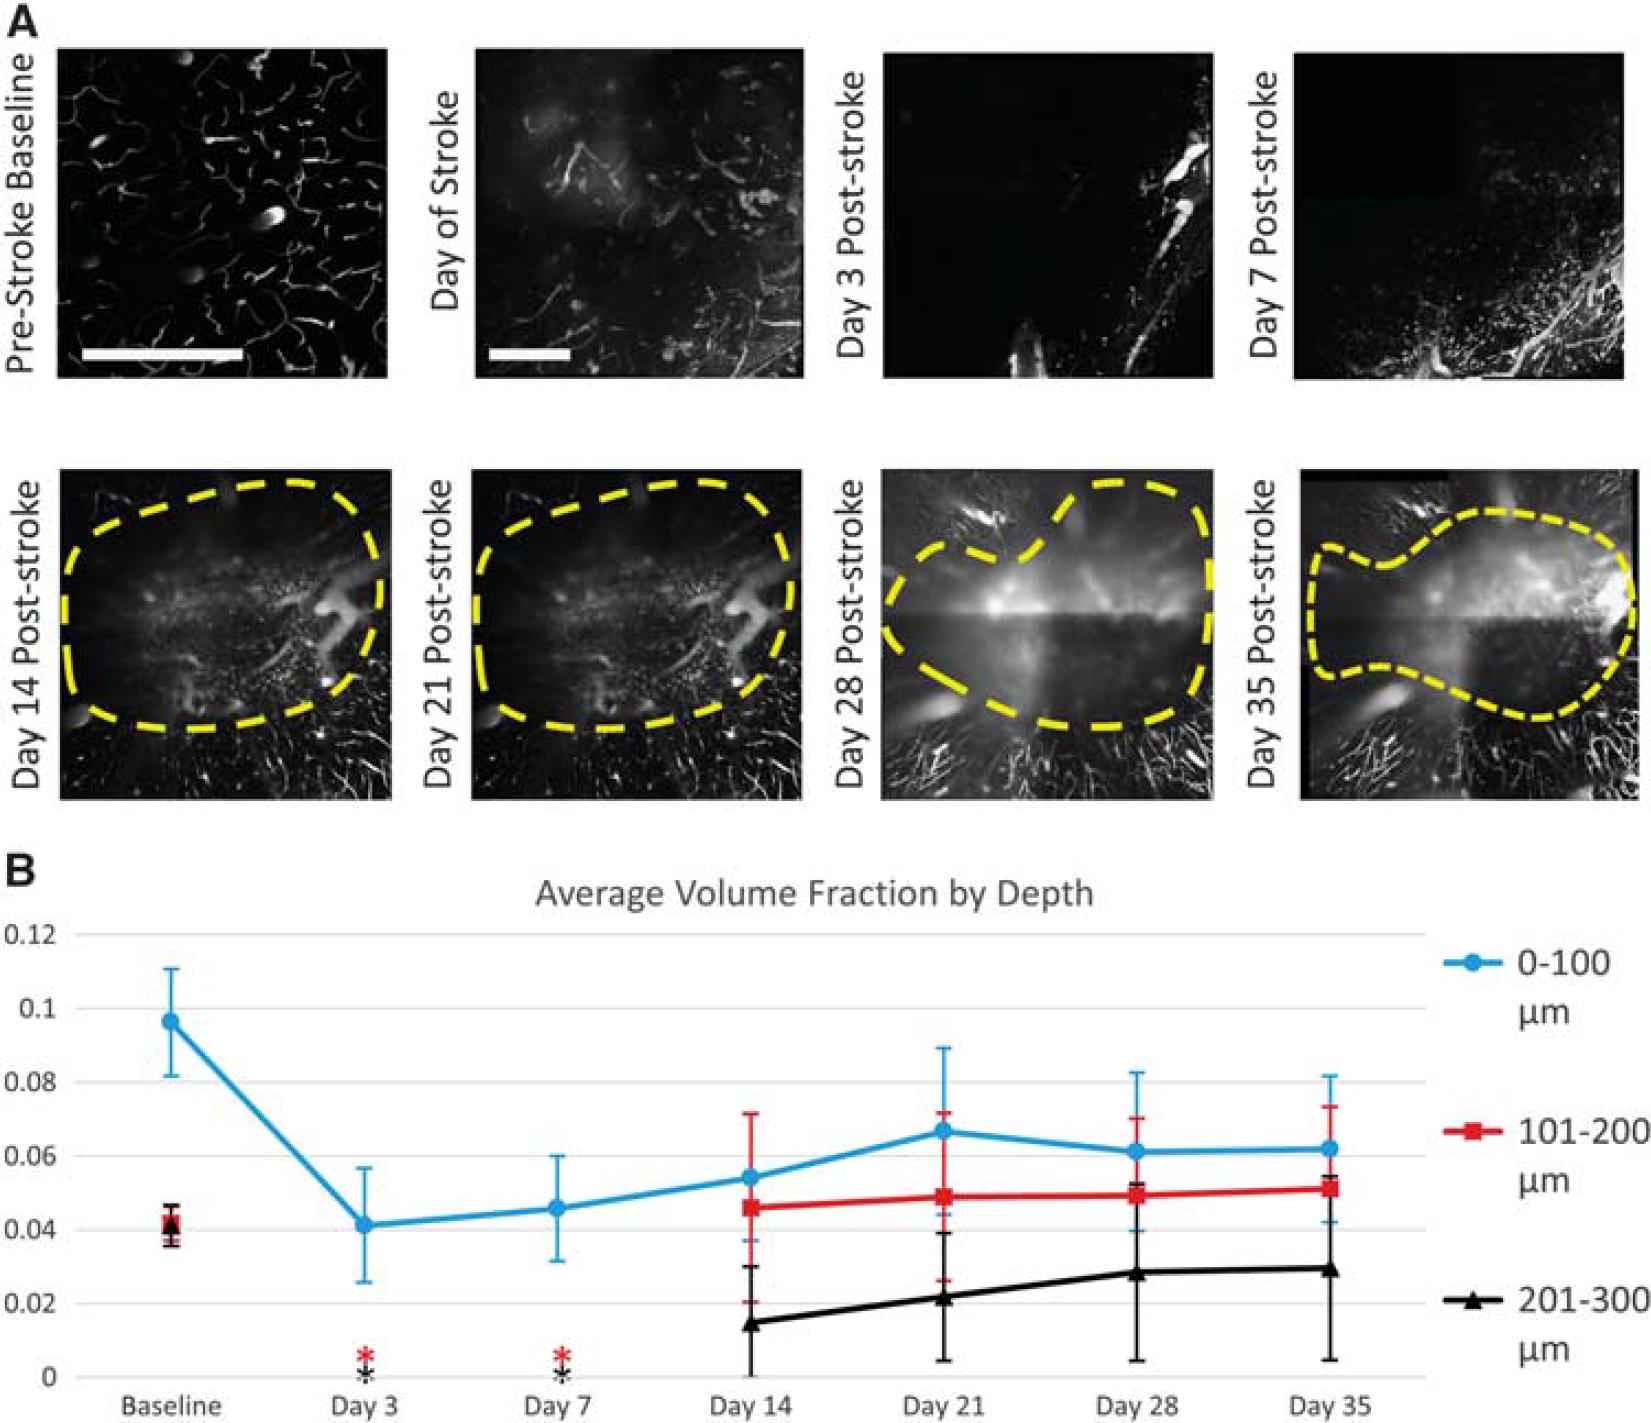
Two-photon microscopy projections of vasculature in a 1 × 1 mm field of view at depths from 150 to 180 μm are presented with damaged infarct areas highlighted to show the progression of the capillary vessel wall recovery over the poststroke time course (Figure 5A). These images correspond to the ICT maps of the animal shown previously (Figure 4A). Baseline measurements were taken a minimum of 35 days after placement of cranial windows to ensure recovery from the surgery, with photo-thrombotic occlusion delivery around 50 days after surgery. Images taken immediately after photo-thrombotic occlusion showed extravasation of the fluorescent dye throughout the vasculature, as well as a darker halo within the center of the image with the same diameter of the 532-nm occlusion laser (Figure 5A). By Day 3, no subsurface microvasculature was visible in four of the six animals, as the combination of cortical damage and dye leakage from the vasculature at the surface prevented any possible imaging of the subsurface microvasculature for this time point (Figure 5A). This leaked dye was seen before injection of fresh fluorescent dye on Day 3, suggesting it was not cleared from the area between Days 0 and 3, with the same occurrence between Days 3 and 7. Images taken at Day 7 again showed no subsurface vasculature in the field of view (Figure 5A).
(
The initial perfusion of the microvasculature into the field of view began on Day 14, allowing for a line to be drawn denoting the damaged area (Figure 5A). The marked region was determined by observing the leading edge of the microvascular perfusion within subsurface depths of 100 to 300 μm. Blurry areas appearing as vasculature within the marked infarct region originated from shadows of surface vessels as well as signal arising from the leakage of dye within the damaged vessels found in areas of severe flow deficit (Figure 5A). The photo-thrombotic occlusion also created a slight cratering affect within the vasculature, causing some of the initial surface vessels to descend in depth within the infarct area (Figure 5A). With each step of the progression, the area within the denoted shrinking infarct region had a higher contrast, suggesting that fresh dye was being delivered by blood flow to this area, though it leaked out of the damaged vessels (Figure 5A).
Volume fraction analysis was performed by sectioning the stitched vascular stacks into layers of 100 μm in depth, giving volumes of 1 mmx1 mm × 100 μm. Baseline volume fraction for the surface layer (0 to 100 μm) averaged over all animals was 9.6%, with averages of 4.2% and 4.1% for the following 101 to 200 and 201 to 300, respectively (Figure 5B). Due to the extent of dye leakage immediately post-stroke, volume fraction for Day 0 could not be measured. A significant drop in volume fraction of > 50% was seen in Day 3 measurements for the surface vasculature (Figure 5B), though many of these larger vessels remained imageable with largely reduced flows. Volume fractions of the sub-surface microvasculature within the field of view were measured at 0% for Days 3 and 7 of the post-stroke period. As these measurements of zero (
During the period from Days 14 to 35, the cratering effect of the stroke delivery seemed to lessen and recover, causing the surface vasculature to migrate back up into the 0 to 100 μm section. During this same period, capillaries perfused the peri-infarct area of the 101 to 200 μm section, serving to balance out the total volume fraction within the section. Due to this lessening of the cortical concavity, a constant volume fraction for the 101 to 200 μm section was measured after Day 14 (Figure 5B), though a distinct progression of the microvascular perfusion within images taken within the section was observed (Figure 5A).
Histologic assessments of the animals after Day 35 imaging sessions showed the lesion still remained below the surface of the cortex. The average lesion size shown with Nissl staining over all animals was 400 μm in lateral diameter and extended from 300 um in depth to 1.1 mm. This lateral size was fairly close to the focal spot size of the 532-nm laser used for photo-thrombosis.
Vascular Reorientation
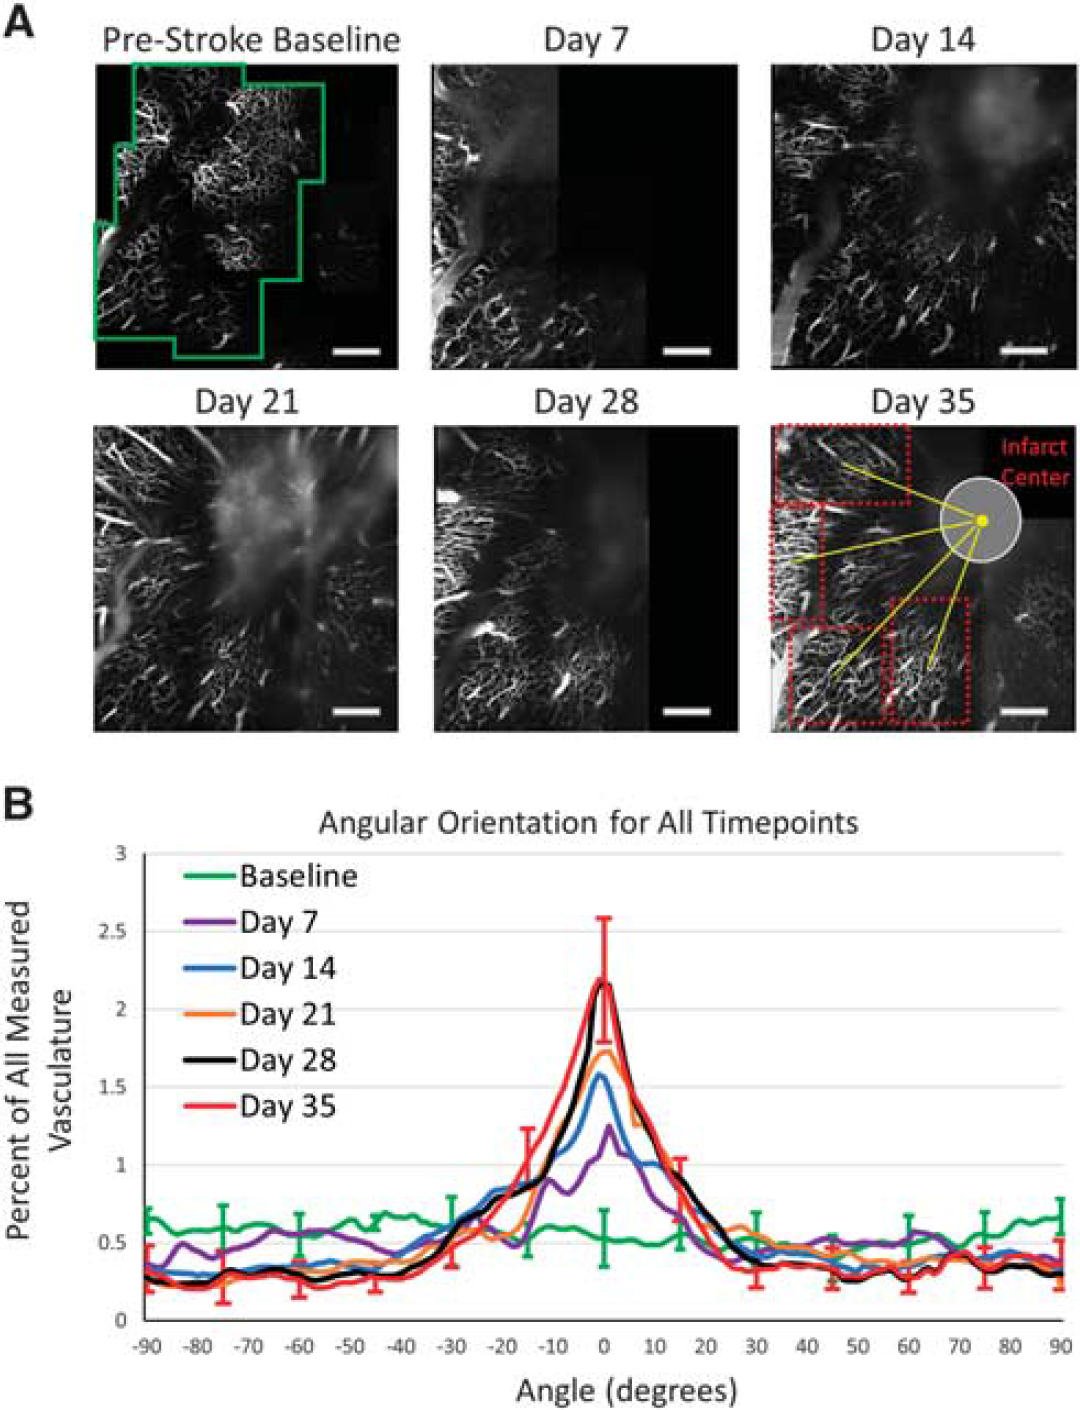
As the subsurface microvasculature underwent recovery in the integrity of their vessel walls while progressing toward the occlusion site, a significant reorientation was observed in the orientation of the vessels. Subsurface sections of the baseline vascular stack (Figure 6A) were taken every 50 μm in depth and converted into binary projections showing the microvascular distribution for each animal at different depths. This process was repeated for the each of the postocclusion vascular stacks, and regions of perfusing microvasculature were chosen for analysis, with the angle between the centers of the vascular regions and infarct areas defined as 0° (Figure 6A). The Radon Transform analysis described previously was performed for each of the binary projections throughout each point on the time line. The distribution of angles from regions at each time point were then summed together by lining them up along their 0° angle. The subsurface regions were from one of four depths including 100 to 150 μm, 151 to 200 μm, 201 to 250 μm, or 251 to 300 μm, with each depth contributing to the overall distribution at each time point. Though projections in Figure 6A only display projections from the 151- to 200-um section, Figure 6B incorporates distribution measurements from all four depths. The measurement process resulted in a progression of the distribution of orientation angles toward the infarct center from baseline measurements to Day 35 measurements (Figure 6). While the baseline vasculature showed a fairly uniform distribution of angle orientations, each postocclusion time point shows the vasculature orienting toward the infarct center, with the Day 35 distribution displaying a large peak near 0°, the direction of infarct center (Figure 6B). Almost 40% of the vascular distribution for Day 35 falls between angles of −10° and +10° with respect to the center of the infarct, an increase from 11% measured in the baseline images, demonstrating a significant reorientation process over this postocclusion period (
(
Quantitative Comparison of Subsurface Microvascular
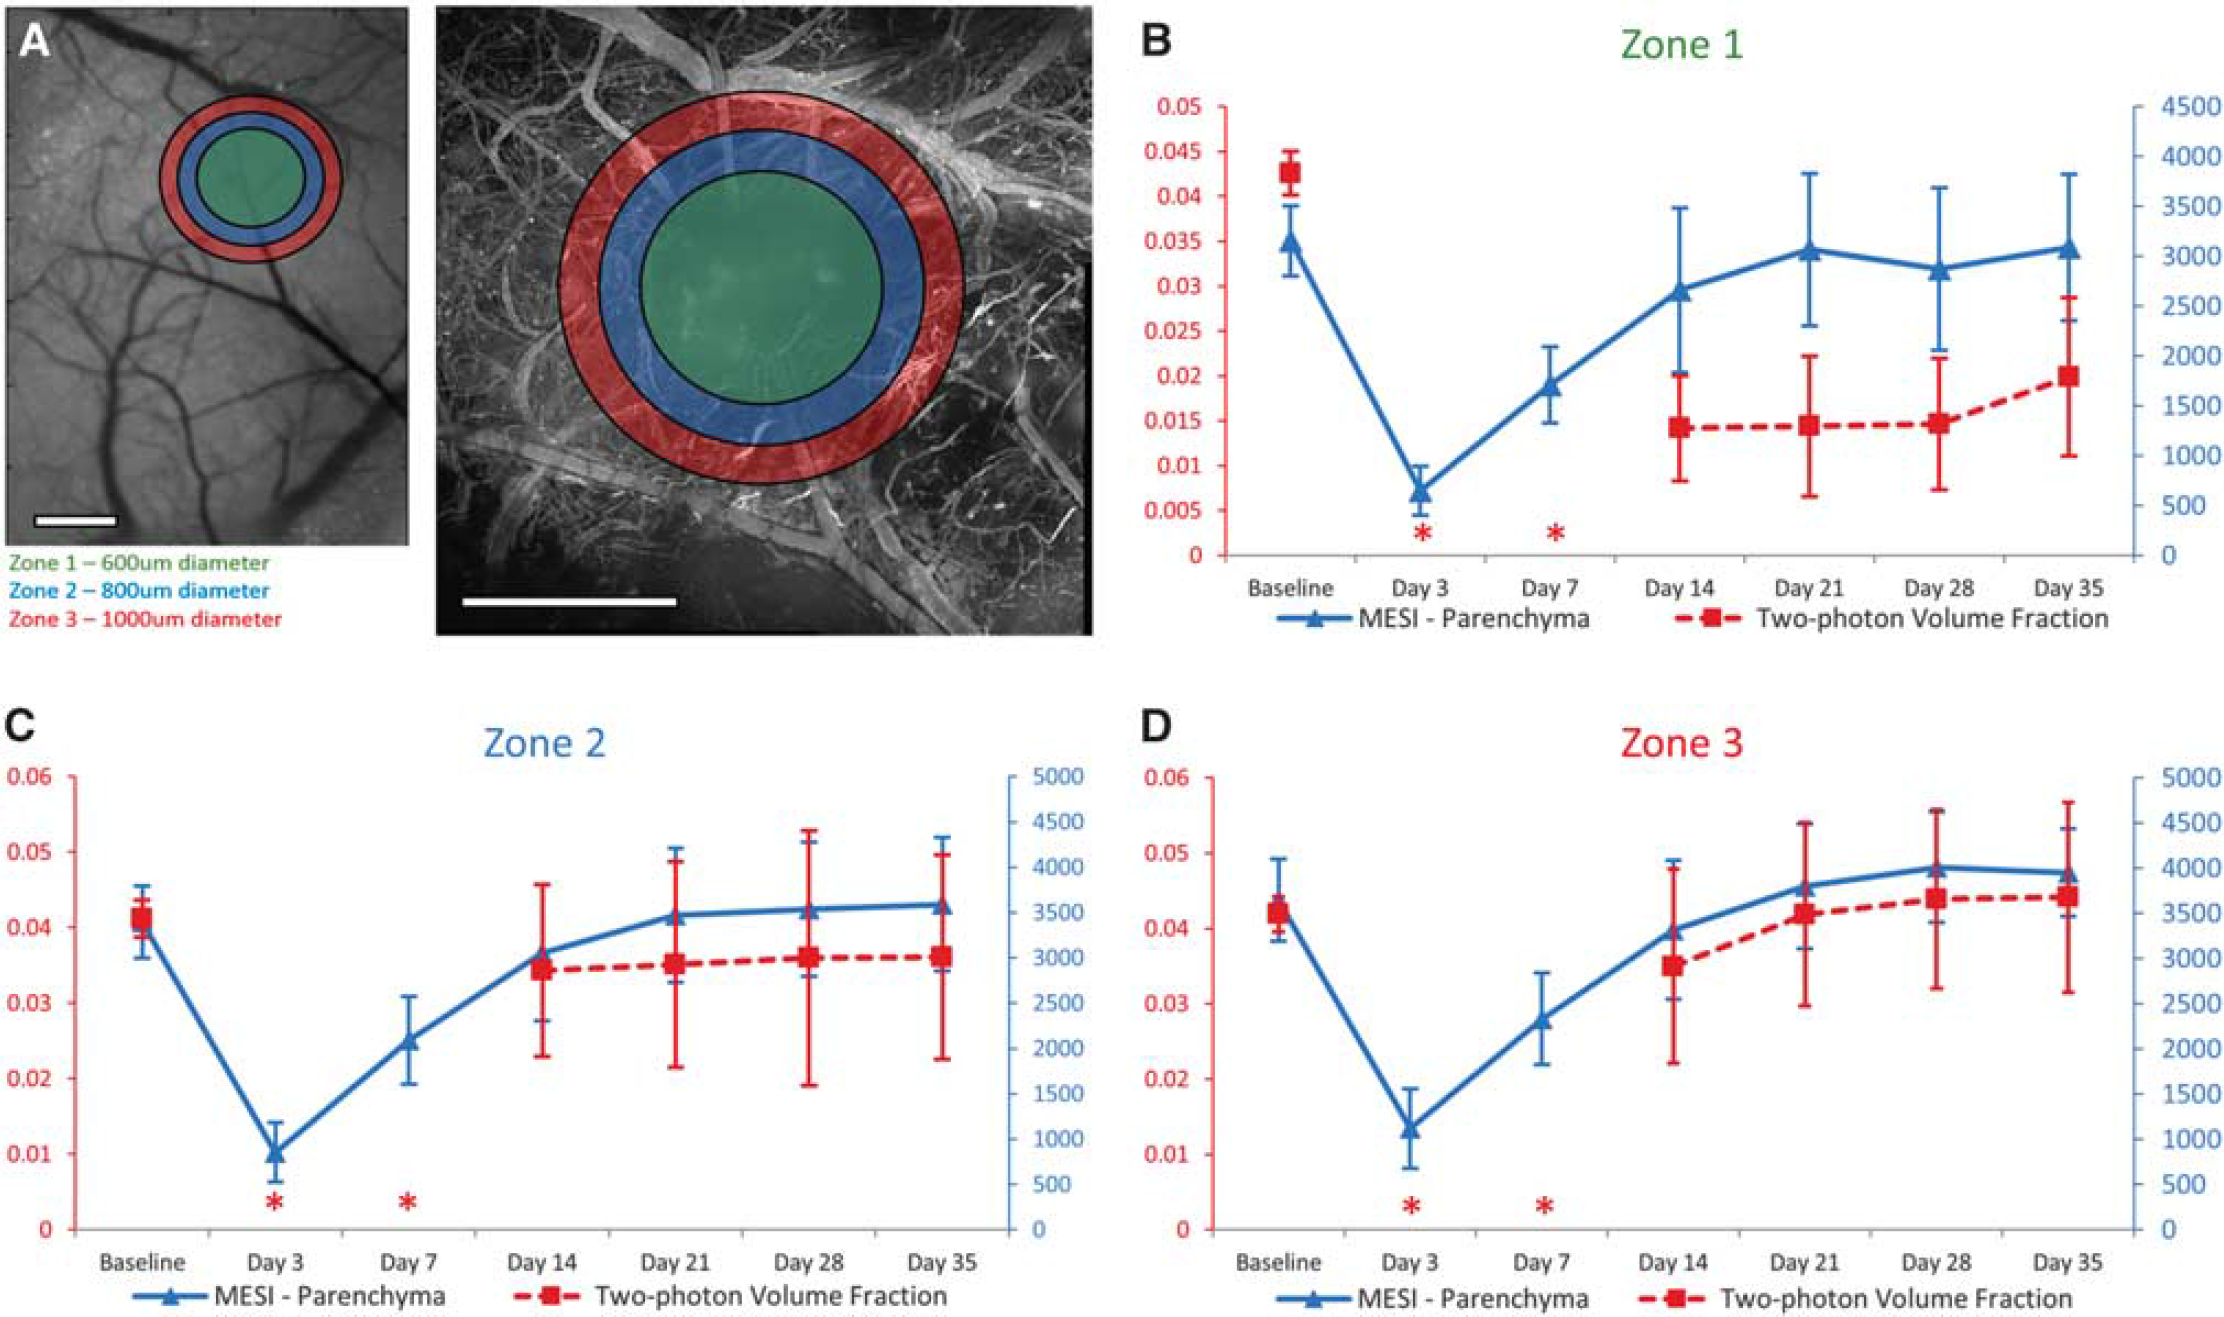
Progression To compare outcomes measured with MESI with those measured by two-photon microscopy, images were centered on the targeted arteriole and three annular rings of interest were overlaid on the infarct and peri-infarct regions (Figure 7A), termed Zone 1, (600 μm diameter circle, matching focal spot of occlusion laser), Zone 2 (800 um diameter, with inner diameter of 600 um), and Zone 3 (1000 μm diameter, with inner diameter of 800 um). These regions were chosen to quantitatively show the perfusion dynamics from the healthy vasculature around the peri-infarct regions (Zones 2 and 3) toward the impacted infarct region (Zone 1). Maps of ICT values from MESI were processed to remove surface to better isolate contributions from the parenchyma (Figure 3A), and were compared with subsurface volume fractions (100 to 300 μm in depth) taken within the corresponding regions of interest.
(
Results of this analysis (Figures 7B to 7D) showed that while two-photon microscopy volume fractions were not able to be calculated for this first week of poststroke imaging, MESI ICT values show a distinct period of microvascular progression for this first week. Though we know through MESI analysis that some residual flow remained at the occlusion site immediately after stroke, the leakiness of the damaged surface vasculature inhibited light penetration to the deeper vascular structures, making the subsurface vasculature to be unresolvable for Days 3 and 7 after stroke. This resulted in a methodological volume fraction result of zero for these two time points, and was not included for comparisons. By Day 14, when the microvasculature began perfusing into these annular rings of interest (Figure 5A), the volume fractions seen within the peri-infarct regions trended similarly to parenchymal ICT values (Figures 7C and 7D). We did not see the same similarities in measurements taken in Zone 1 (Figure 7B) due to the leakage of dye apparent in the images creating difficulty when taking volume fractions (Figure 5A). In Zone 1, parenchymal ICT values showed an increase to 97% of baseline at Day 21, reaching a maximum of 98% of baseline ICT at Day 35 (Figure 7B). Volume fractions within this same region showed a large increase between Days 7 and 14, reaching 47% of their baseline by Day 35 (Figure 7B). Very little progression in the volume fractions of the infarct region was evident between Days 14 and 28 (Figure 7B), as the majority of regional vasculature remained leaky in nature over this period. Within Zone 2 (Figure 7C) and Zone 3 (Figure 7D) regions, parenchymal ICT values reached or surpassed their baseline measurements by Day 35 of the poststroke period. Day 35 volume fraction measurements within Zone 2 measured 87% of their baseline values (Figure 7C), with an increase to 105% of baseline observed in Zone 3 (Figure 7D). In these regions surrounding the occlusion site, where the vasculature was able to recover from its leaky postocclusion phase, the results measured by MESI correlated well to two-photon volume fraction outcomes (Figures 7C and 7D). This correlation was not seen in the leaky Zone 1 (Figure 7B).
The comparison between average parenchymal ICT measurements and subsurface microvascular volume fractions (Figure 7) showed high correlations within Zone 3 (r =0.91) and Zone 2 (r =0.88). It was within these same peri-infarct regions where vasculature appeared healthy that accurate volume fractions were able to be measured, particularly for Days 14 through 35. Zone 1 had a much lower correlation (
DISCUSSION AND CONCLUSION
The data presented shows that a long-term
The MESI outcomes from this small-scale photo-thrombotic occlusion show that the most at-risk tissue within areas of severe flow deficit saw gains in perfusion past 50% of their baseline on an average of 14 days after stroke. This suggests that though the available flow still perfusing the peri-infarct area is reduced from baseline, the first priority of the brain appears to be return flow to the severe flow deficit region. For this stroke model, MESI allows for quickly distinguishing the progression of the vasculature by illustrating the perfusion boundaries separating the healthy and flow deficit regions, as well as marking the extent of flow deficit within the damaged regions. The ICT maps for each animal showed the largest areas of moderate and severe flow deficit at Day 3, with the most significant perfusion of these regions happening in the immediate 4 days thereafter. This small temporal window may be of critical importance to the overall outcome of the animal, and serves as a prime target for future pharmacological stroke studies using a similar small-scale photo-thrombotic stroke model.
The correlation between parenchymal ICT values and measurable volume fractions shows that although MESI is a surface integrated technique, it can be used as a tool for measuring chronic subsurface microvascular perfusion. The correlation shown in Zones 2 and 3 suggests that the MESI ICT values within parenchymal regions are partially indicative of the volume fractions of the subsurface microvasculature. The MESI measurements are a convolution of two physiologic parameters, the amount scattering occurring within the vasculature and the flow dynamics. The choice of volume fractions as a metric for describing the vascular structure over large areas limits measurements to only one of the two parameters and only for certain sections of the vasculature which are not leaking dye. The combination of how these parameters affect MESI ICT measurements warrants future study, though results suggest subsurface volume fraction as an important component. Measuring subsurface outcomes with MESI presents several advantages for a chronic stroke study, the most significant being the ability to take measurements within the first week of stroke progression, a period that exhibited both substantial increases in ICT value (Figure 4C) and decreases in the size of areas with moderate and severe flow deficits (Figure 4D). This important portion of the time line was not able to be captured with two-photon microscopy in this study due to the damage inhibiting delivery of the fluorescent dye through the occluded and leaky vasculature. As the vasculature progresses toward the infarct center after the occlusion, the possibility exists that MESI ICT measurements within what appears as parenchymal regions are being affected by nearby surface vasculature, leading to overestimation of the subsurface flows. Monte Carlo simulations have shown that measurements within parenchymal regions are still sensitive to lateral surface vessels. 18 This could be a secondary reason for the poor correlation between MESI ICT and two-photon microscopy volume fraction measurements in Zone 1.
The potential exists for eliminating the need for exogenous contrast agents in the presented two-photon microscopy protocol by introducing transgenic mice with endothelial cells expressing fluorescent proteins along their vascular walls and tight junctions, 32 allowing for chronic tracking of vascular structure without exogenous contrast agents. While use of transgenic animals would remove imaging problems associated with the leakiness of the vasculature after stroke, we would be unable to monitor the blood flow, necessitating the development of a metric to differentiate healthy, perfused vasculature from damaged vessels. Optical coherence tomography offers a potential solution to the problem of measuring both flows and three-dimensional structure within the cortex.33–35
The benefits of a depth-resolved imaging technique such as two-photon microscopy are apparent when monitoring the reorientation of the subsurface vascular structure after occlusion (Figure 6). The damage caused by the stroke appears to elicit the brain to modify the vascular architecture in response to the new challenges presented. Microvascular reorientation was observed progressing from the healthier outer regions into the peri-infarct area, with vessels angled toward the infarct center (Figure 6). The lack of increased regional volume fractions in these regions of healthy, perfused vasculature compared with baseline (Figure 7) suggests that these vessels are not angiogenic in nature but rather vasculature with altered orientation that has regained its vessel wall integrity, consistent with results from other groups performing longitudinal two-photon studies.36,37 Other studies have noted similar changes in orientation of both vessels and dendritic spines. 38 This suggests the mouse cortex to be highly malleable when responding to damage such as stroke, though the driving force in this reorientation process is unknown. One suggested candidate that warrants investigation is the molecular oxygen concentrations in these regions, with particular emphasis on the concentration gradient along these vessels oriented toward the infarct center. 6 The distribution of angular orientations of the resolvable vasculature at each time point after Day 7 progresses toward a larger peak at 0° (Figure 6B). To document this reorientation phenomena, future studies should include a minimum of two imaging sessions (baseline and postocclusion) with an imaging technique that measures vascular structure, such as two-photon microscopy or OCT. Lengthened future studies can continue to track vascular orientation to observe whether the reoriented distribution remains or progresses back toward a uniform baseline when perfused.
After 35 days of imaging, the average remaining area of moderate flow deficit remained at 5% of the size of Day 3 areas, suggesting that more time was necessary for full perfusion of the area to baseline values to occur. The end point at 35 days after stroke was chosen to ensure the cranial window was clear and healthy for the full experimental duration, though there is potential for longer duration experiments with some of the cranial windows staying imageable past 70 days. Future studies may benefit from protocols that either incorporate processes to modulate or probe recovery such as rehabilitation and pharmacological agents, induce smaller scale strokes, or extend experiment durations past 35 days.
With experimental periods lasting weeks to months, keeping the imaging and anesthesia exposure time as short as possible is of vital importance when considering the impact on the health of the animal and the progression outcomes. Studies have shown neuroprotective properties of isoflurane39,40 that must be accounted for by minimizing anesthesia exposure when possible. Though we have the ability to measure the vascular structure of the cortex with high spatial resolution three-dimensionally using two-photon imaging, this modality greatly extends experimental durations, with experimental periods in the presented study averaging 10 minutes for MESI sessions and 90 minutes for two-photon microscopy. Due to the size of the presented photo-thrombotic stroke, it was necessary to take several vascular stacks around the occlusion site to capture the vascular architecture throughout the recovering region with high spatial resolution. With the ability to use surface-weighted measurements of perfusion from MESI to predict subsurface vascular outcomes, such as vascular perfusion within the parenchyma, experimental times can be greatly reduced.
A long-term stroke study using a photo-thrombotic occlusion was used to evaluate an optical imaging protocol for monitoring chronic microvascular perfusion on and below the surface of the mouse cortex over experimental time lines extending to 5 weeks after occlusion. After photo-thrombotic occlusion, regional perfusion boundaries around the infarct were identified using MESI, and the areas containing severe flow deficit were shown to be reperfused above 50% of baseline flow within 14 days after stroke while areas of moderate flow deficit showed a 95% reduction in area over a 35-day period. Blood flow in a 2 × 2 mm field of view centered on the infarct measured with MESI was shown to reach baseline values after 3 weeks of poststroke imaging, overshooting baseline measurements in the 4th and 5th weeks. Vascular reorientation within the subsurface microvasculature was shown with two-photon microscopy to occur over a time period of 1 to 5 weeks after occlusion, with vessels showing a substantial change in their angular orientation by lining up with the most significantly damaged area of the stroke. Chronic two-photon microscopy measurements of volume fraction in peri-infarct regions surrounding the occlusion site containing vasculature with repaired vessel walls showed high correlation with MESI perfusion values in the same regions over the poststroke period. With a nominally low experimental duration and wide field of view, MESI provides a standalone or complimentary imaging platform for studies requiring characterization of ischemic progression.
DISCLOSURE/CONFLICT OF INTEREST
The authors declare no conflict of interest.