
Abstract
Little is known about the hemodynamic disturbances induced by the cerebral aneurysms in the parent artery and the effect of flow diverter stents (FDS) on these latter. A better understanding of the aneurysm-parent vessel complex relationship may aid our understanding of this disease and to optimize its treatment. The ability of volumetric flow rate (VFR) waveform to reflect the arterial compliance modifications is well known. By analyzing the VFR waveform and the pulsatility in the parent vessel, this study aimed to test the hypotheses that (1) intracranial aneurysms might disrupt the blood flow of the parent vessel and (2) the treatment by FDS might have measurable corrective effect on these changes. Ten patients followed for unruptured intracranial aneurysms treated by FDS and ten healthy volunteers as control group were included in this study. Two-dimensional quantitative phase-contrast magnetic resonance imaging (MRI) was performed on each patient on the ICA artery upstream and downstream to the aneurysm, and on each volunteer at similar locations. The aneurysms altered significantly the parent vessel pulsatility and this effect was correlated to their volume. The aneurysms treatment by FDS allowed for the restoration of a normally modulated flow and pulsatility correction in the parent vessel.
Keywords
INTRODUCTION
Hemodynamic factors are considered to have an important role in progression, rupture, and endovascular treatment (EVT) efficacy of intracranial aneurysms.1,2–4 The commonly admitted ultimate treatment goal is the vessel reconstruction and the correction of the hemodynamic disturbances in both the aneurysm sac and the parent vessel. While new generation devices acting on the parent vessel's hemodynamic are in development, such as flow diverter stents (FDS) that aim to induce the intra aneurysmal thrombosis,5,6 little is known about the hemodynamic disturbances induced by the aneurysms in the parent arteries. Similarly, the effects of FDS on parent vessel hemodynamic changes due to the aneurysms are still poorly reported in the literature.
Previous studies on this area (i.e., aneurysmal disease) present two main limitations. (1) They are mainly based on numerical models, which require prior knowledge of reliable input functions. These latters are difficult to be measured
The ability of arterial compliance modifications, which is related to the status of the vasculature, to alter the volumetric flow rate (VFR) waveforms over the cardiac cycle is well known.
8
This may be of important interest for characterization of pathologic conditions. Some authors have proposed to assess the changes in VFR waveforms as a marker of diseases.9,10 According to them, the evaluation of the VFR waveform of parent vessel (i.e., internal carotid artery (ICA)) could be of important value for the understanding of many diseases, such as intracranial aneurysms. Since phase-contrast magnetic resonance imaging (pc-MRI) is recognized to be an accurate and reliable non-invasive technique for velocity quantification in intracranial vessels,11,12 several authors has suggested the production of archetypal VFR waveforms in ICA tree using this technique.
13
Using quantitative flow MRI, Gwilliam
MATERIALS AND METHODS
Patients and Control Group
Ten patients with unruptured intracranial aneurysm selected for FDS implantation were prospectively recruited from April 2012 to December 2013. The indication for FDS implantation was posed after a multidisciplinary meeting in our institution for all patients. Of these, seven were women. The range of patient's age was 32 to 87 years resulting in a median age of 66 years with an interquartile range of 55 to 73 years. Aneurysms were located on ICA from the carotid siphon to its termination. Ten healthy volunteers were also enrolled as a control group. Of these, five were women. The range of healthy volunteers age was 22 to 55 years resulting in a median age of 29 years with an interquartile range of 25 to 39 years. Local ethics committee guidelines were followed for this study (DGRI CCTIRS MG/CP 2012.528; Comité d'Ethique du CHU de Lyon; Lyon/France). The informed consent was obtained from all patients and volunteers. Image data from those two groups were used for analysis. Five patients with no medical history were symptomatic because of aneurysm's mass effect at cavernous portion of ICA. They presented with a cavernous sinus syndrome associating headaches, ipsilateral ptosis, and ophtalmoplegia due to third, fourth, or sixth nerves palsy, without any visual acuity decreasing or pupillary abnormality. Two patients presented headaches without any obvious relationship with their aneurysms. One asymptomatic patient presented a medical history of high blood pressure, cigarette smoking, and hypercholesterolemia. One healthy volunteer presented a medical history of cigarette smoking. All other patients and control subjects did not present any symptoms or medical history, and specially, any vascular steno-occlusive lesion of the supra aortic trunks or intracranial arteries.
Aneurysms Treatment
All patients were treated under general anesthesia by using a biplane angiographic system (ALLURA, Philips, Best, The Netherlands) after a preparation according to our institutional protocol (loading dose of 300 mg of clopidogrel administrated one day before the EVT; systemic heparinization during the endovascular procedure, stopped at the end of the treatment; double antiplatelet therapy initiated for 6 months at day 1 after the treatment, with 75 mg of acetylsalicylic acid and 75 mg of clopidogrel/day). A 3D rotational angiography of the aneurysm and parent vessel was performed before the endovascular treatment (EVT) allowing for 3D reconstructions and the treatment planning. One or more FDS were deployed in one session according to aneurysm's neck size (PIPELINE, ev3-COVIDIEN, Irvine, CA, USA).
Aneurysm's Geometries
3D aneurysms and parent vessel geometries were segmented and reconstructed from the performed 3D angiographic acquisitions (spatial resolution 0.48×0.48 mm2) by using a new active contour method dedicated to the near real-time segmentation of 3D objects based on the level-set method. 15 It allowed the calculation of the maximal diameter (mm), depth (mm), neck size (mm), volume (i.e., volume of the patent intrasaccular lumen; mm3), and aspect ratio values of all aneurysms using dedicated software (ITK-SNAP, Penn Image Computed and Science Laboratory, University of Pennsylvania, USA).
Magnetic Resonance Imaging Examinations
All patients underwent MRI examinations using a clinical system operating at 3 Tesla with 32-Channel Array Head-Neck coil before and within the 3 days after the EVT according to the MR scan availability in our institution (3 Tesla, 45 mT/m, 200 T/m/s, Skyra, SIEMENS, Erlangen, Germany). After 1 month, an additional follow-up MRI examination was performed. To visualize the circle of Willis, a 3D time-of-flight MRA (3D TOF-MRA) was performed (149 slices; repetition time/echo time 21/3.4 ms; 18° flip angle; 0.6 mm section thickness; in-plane resolution 0.27×0.26 mm2). Maximum intensity projections derived from the resultant 3D TOF-MRA data set were used to define the placement of each two-dimensional slice to be used for quantitative flow estimation. Two dimensional phase-contrast MRI (2D pc-MRI) scan slices were performed at target points in the ICA upstream (extracranial) and downstream (intracranial) to the aneurysm, respectively (one slice; repetition time/echo time 180.5/10.5 ms; 7.5° flip angle; 3.1 mm section thickness; 0.31×0.31 mm2 interpolated in-plane resolution; 37.6 to 41.2 ms temporal resolution). The phase-contrast sequence consisted of a K-space segmented 2D radio frequency—spoiled gradient echo sequence with prospective ECG gating (283 phase encoding steps; 1 views per segment). It resulted in 283 cardiac cycles acquired for one phase-contrast measurement. Data acquisition resulted in a series of 2D slices representing 2D blood flow through the slice of acquisition in consecutive timeframes within the cardiac cycle. Thereby, the number of frames varied with the patient's individual heart rate. The number of measurement points over the cardiac cycle varied from 20 to 32 with a temporal resolution of 37.6 to 41.2 ms (temporal resolution was defined as following = RR interval/number of frames). Special care was taken to reduce the angulation error risk of the scan planes regarding to the axis of blood flow by ensuring that the 2D pc-MRI slices were placed orthogonal to the long axis of the vessel of interest and therefore to the direction of blood flow. Thus, upstream and downstream scan planes were placed (1) at the sub- or intra-petrous level of the ICA and at its intracranial terminal level, respectively, (2) on relatively long and straight segments, and (3) before the posterior communicating artery, as illustrated in Figure 1. The part of the blood flow for ophtalmic artery and small branches of carotid siphon was considered as negligible given their size compared with that of the ICA. Similarly, in the control group, the scan planes were placed as previously described at comparable locations on the ICA. An appropriate velocity-encoding factor was chosen by the operator based on previous experience and defined as to result in images with significant contrast between the stationary tissue and flowing blood with the lowest wrap-around artifacts. Typical settings were 80 cm/s for the upstream measurements and 110 cm/s for the downstream measurements. The same couple neuroradiologist and technologist imaged all patients and volunteers to minimize the scan set-up variability. The reproducibility of the measurements (especially the positionning of the 2D phase contrast acquisition plans) was ensured by taking anatomic criteria spotted on the 3D time of flight acquisition as reference (i.e., the intrapetrous segment of the ICA). The 2D phase-contrast MRI slices post-EVT and at follow-up were placed as close as possible to the slices plane of the pre-EVT MRI. To be bearable by the patient, the table occupancy was kept within 20 minutes, including the 3D TOF-MRA and the two 2D pc-MRI acquisitions.
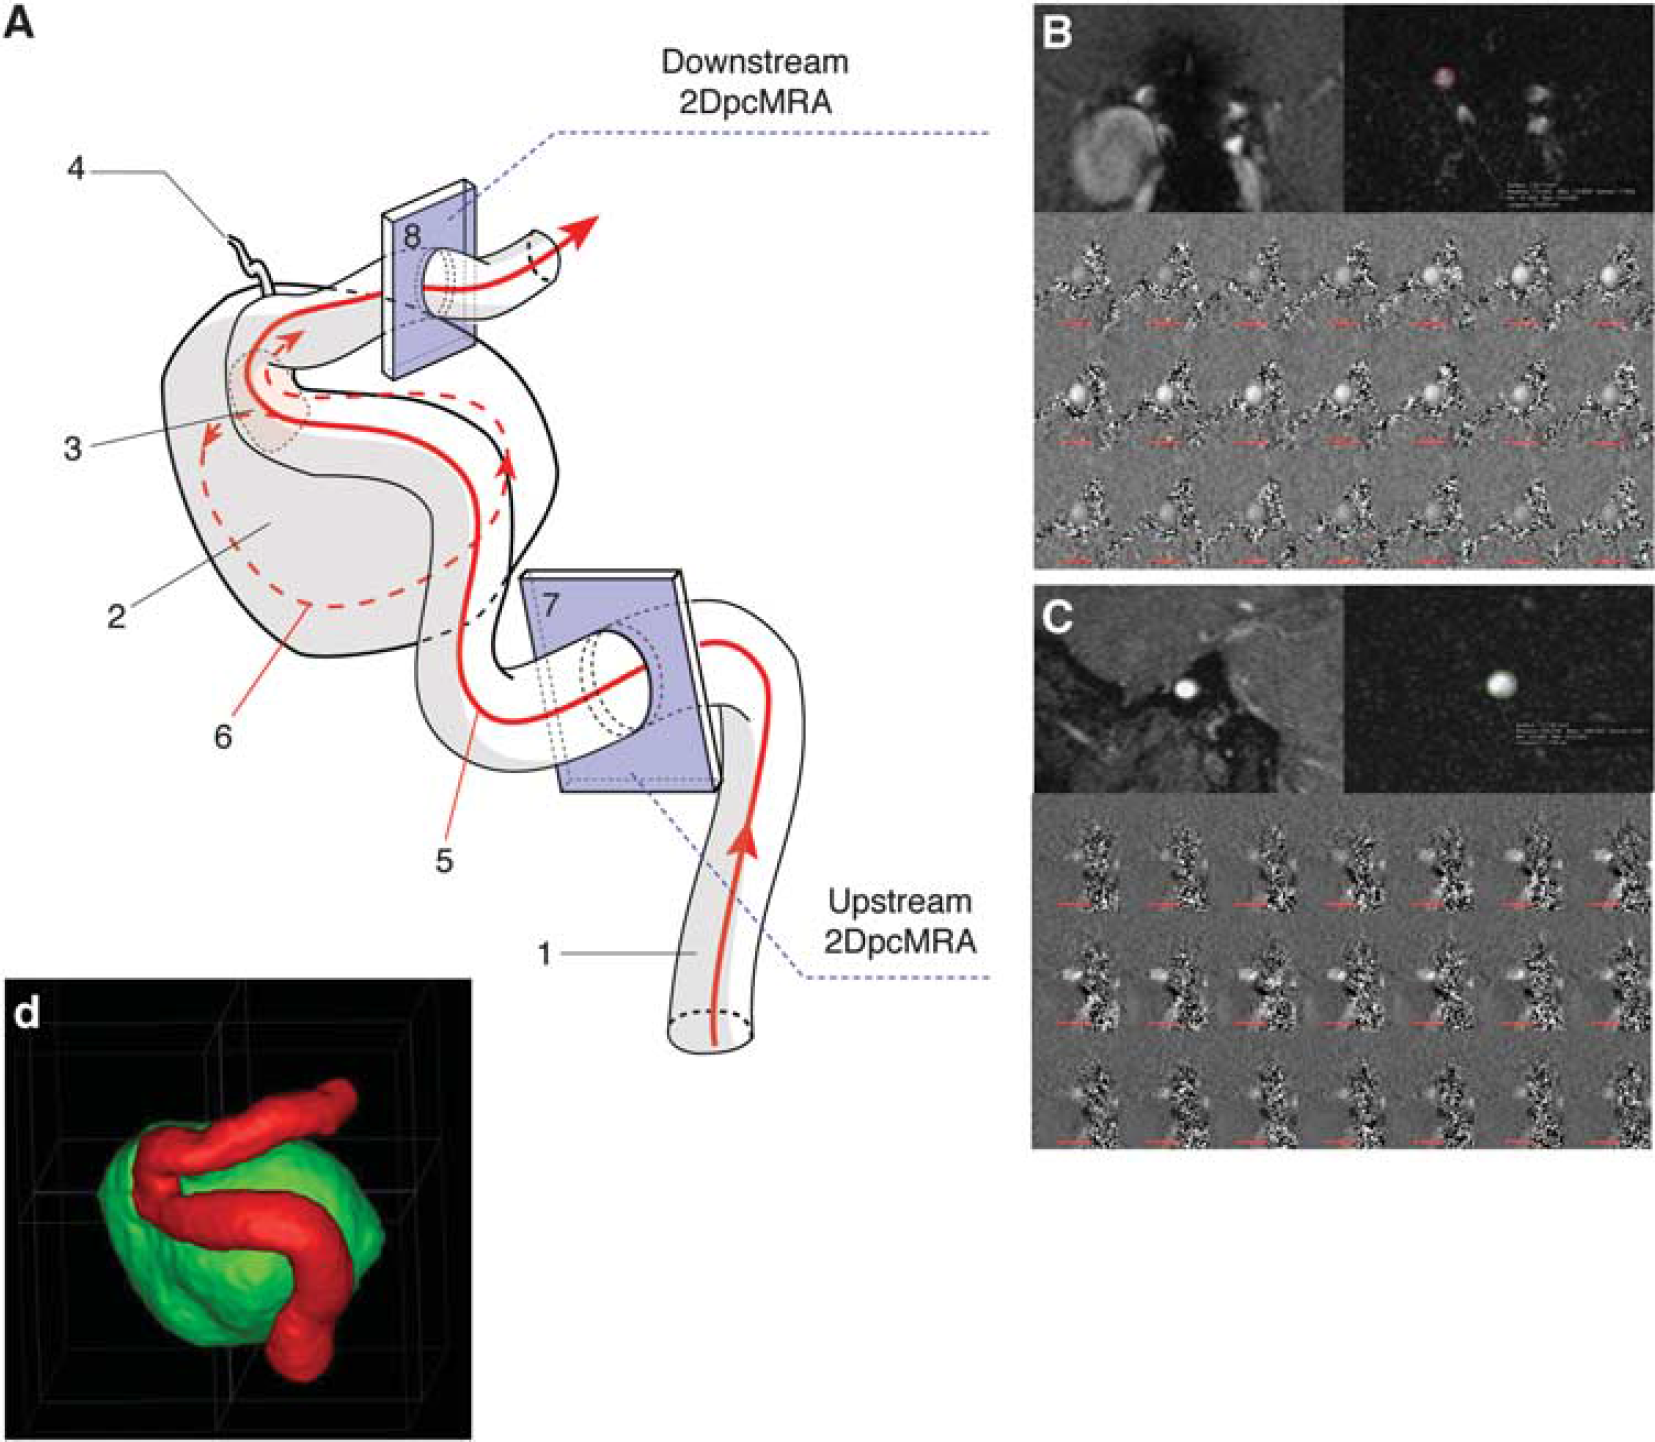
2D phase-contrast magnetic resonance imaging of the parent vessel. (
2D Phase-Contrast Magnetic Resonance Imaging Postprocessing
Data of quantitative flow MRI were analyzed with a home-developed postprocessing tool specifically developed for this study with MATLAB software (R2014a Student version 8.3.0.532, The MathWorks, Natick, MA, USA). Blood velocities were extracted by a region-of-interest analysis from the phase difference images of the flow measurements. The arterial lumen boundaries were semi-automatically segmented from the surrounding stationary tissue by using an Active Contour Algorithm allowing segmentation without applied edge on all images during the cardiac cycle. 16 In case of vessel motion through the 2D pc-MRI slice, due to superadded motion of the circle of Willis at intracranial level, a manual segmentation of the arterial lumen over the cardiac cycle was performed by an experienced neuroradiologist. The software allowed an automated extraction of mean blood velocities (cm/s), vessel area (mm2) within the analyzed slice of the vessel for each timepoint over a cardiac cycle. Volumetric flow rates (VFR, mm3/s) and its waveforms were computed by integrating over time mean blood velocities within the region of interest that enclosed the vessel lumen closely.
Volumetric Flow Rate Waveform Feature Extraction
The method of feature extraction and normalization mirrors that of Gwilliam
Statistical Analysis
The Mann-Whitney-Wilcoxon's Rank test was used to compare the ages of the two analyzed groups. A Chi-Square test with a correction of Yates was used to compare both groups regarding the cardiovascular risk factors. A quantitative assessment of the waveforms was performed through the computation of a PI adapted from the index used in Doppler ultrasound for the characterization of velocity waveforms.
17


Results are expressed as median (25% to 75% interquartile). The PI-ratio values in both patient and control groups, and within patient group before the EVT, after the EVT and at follow-up were assessed using a Student's
RESULTS
The mean ages were of 63.8 ± 16 years old in patient group and of 32.6±11 years old in control group, with a significant difference (
Aneurysms Characteristics and Treatment Details
Table 1 summarizes the morphologic characteristics of the aneurysms and the number of implanted FDS.
Morphologic characteristics of the aneurysms in patient group
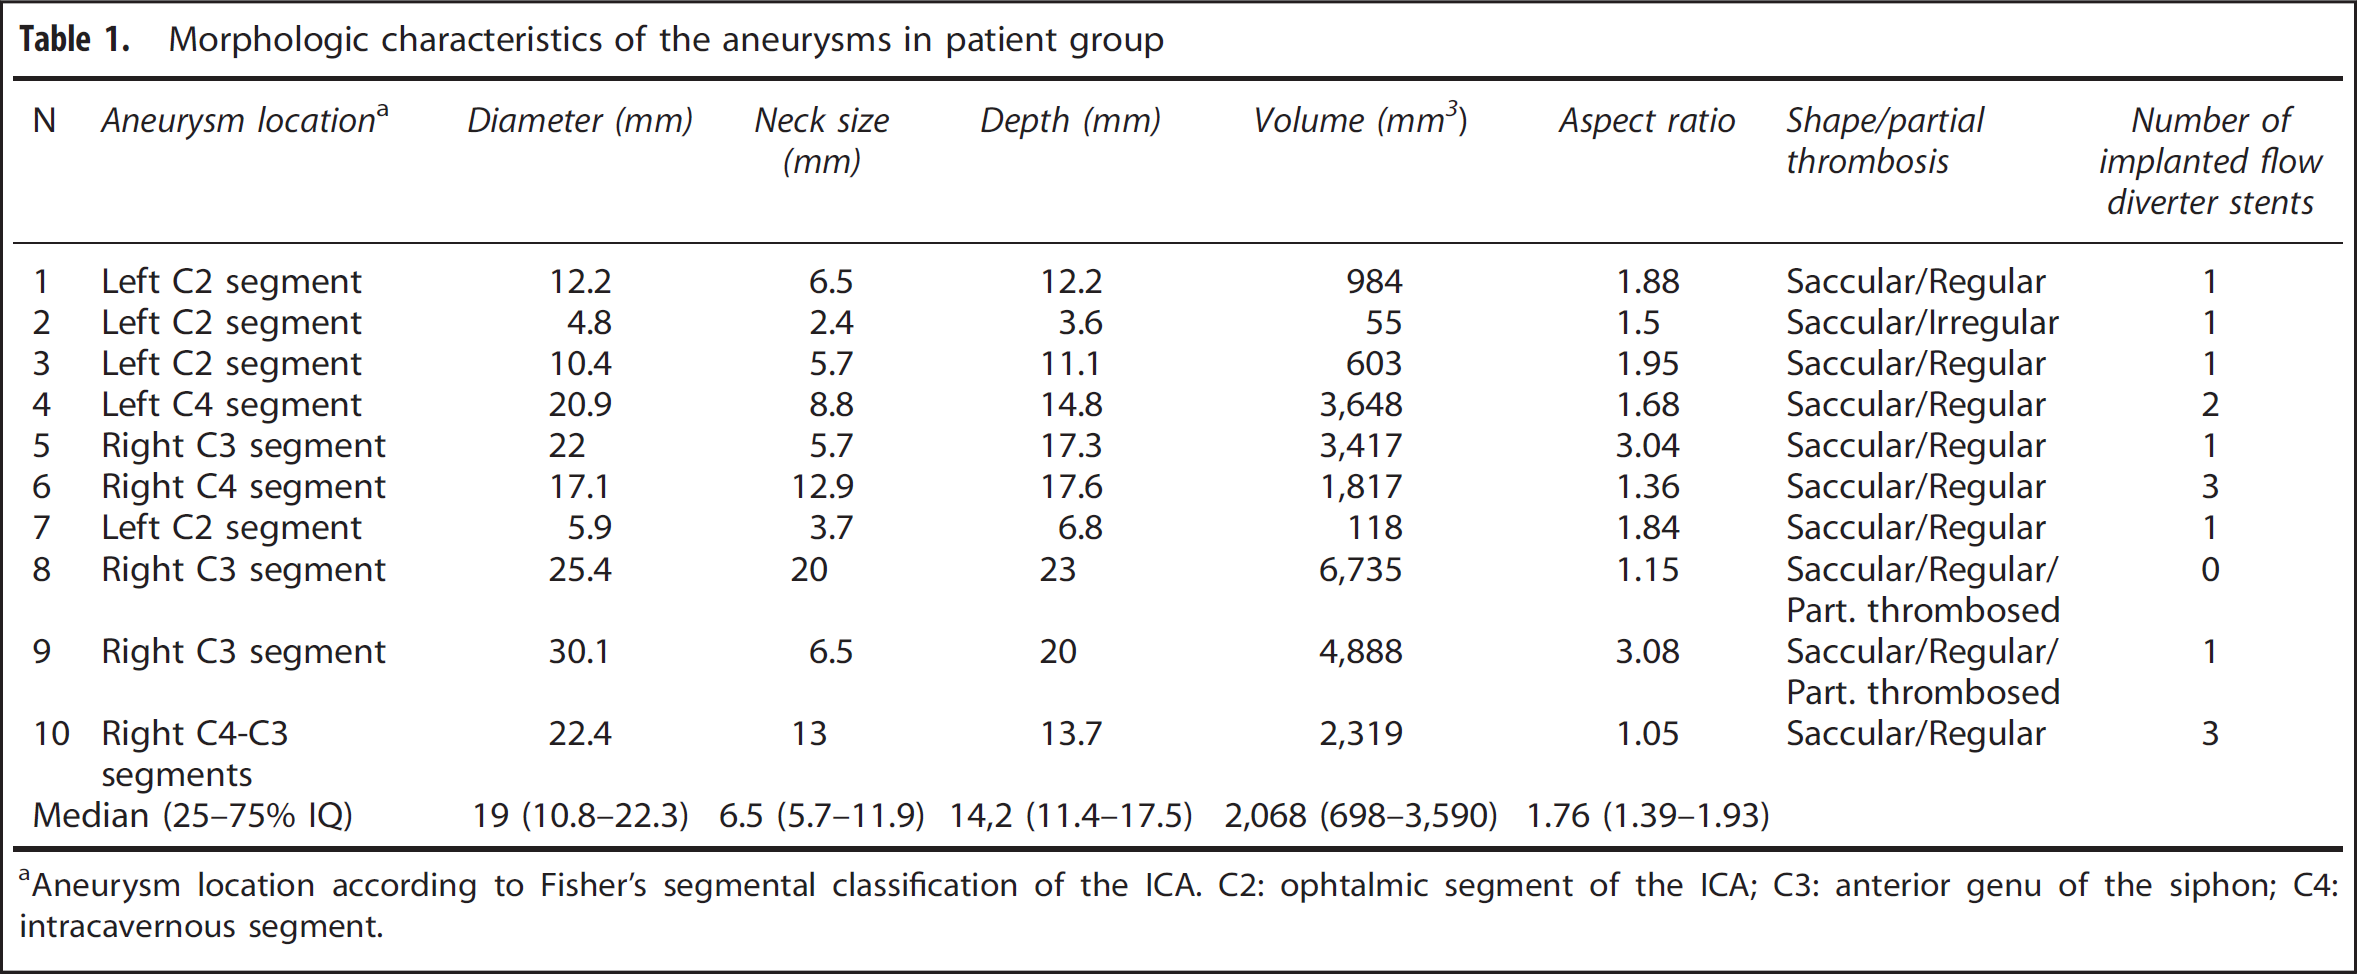
Aneurysm location according to Fisher's segmental classification of the ICA. C2: ophtalmic segment of the ICA; C3: anterior genu of the siphon; C4: intracavernous segment.
2D Phase-Contrast Magnetic Resonance Imaging
Before EVT, the 2D pc-MRI studies were successfully performed for all volunteers and patients (40/40; 100%). After the EVT, 2D pc-MRI was successfully performed in 17/18 acquisitions (94%) for the nine treated patients, at 6 hours (
Pulsatility Indexes Ratio
The PI and PI-ratio values in control group and in patient group before the EVT, after the EVT, and at follow-up are reported in Table 2. The circle of Willis configurations, the upstream and downstream computationed volumetric blood flow rates (VBFR) before the EVT, after the EVT, and at follow-up are reported in Table 3. The measured velocities upstream and downstream to the aneurysm at each timepoint are reported in Supplementary Data (Supplementary Tables 1). The results of the statistical tests comparing the patient group and subgroups (
Pulsatility index and pulsatility indexes ratio values before EVT, after EVT, and at follow-up
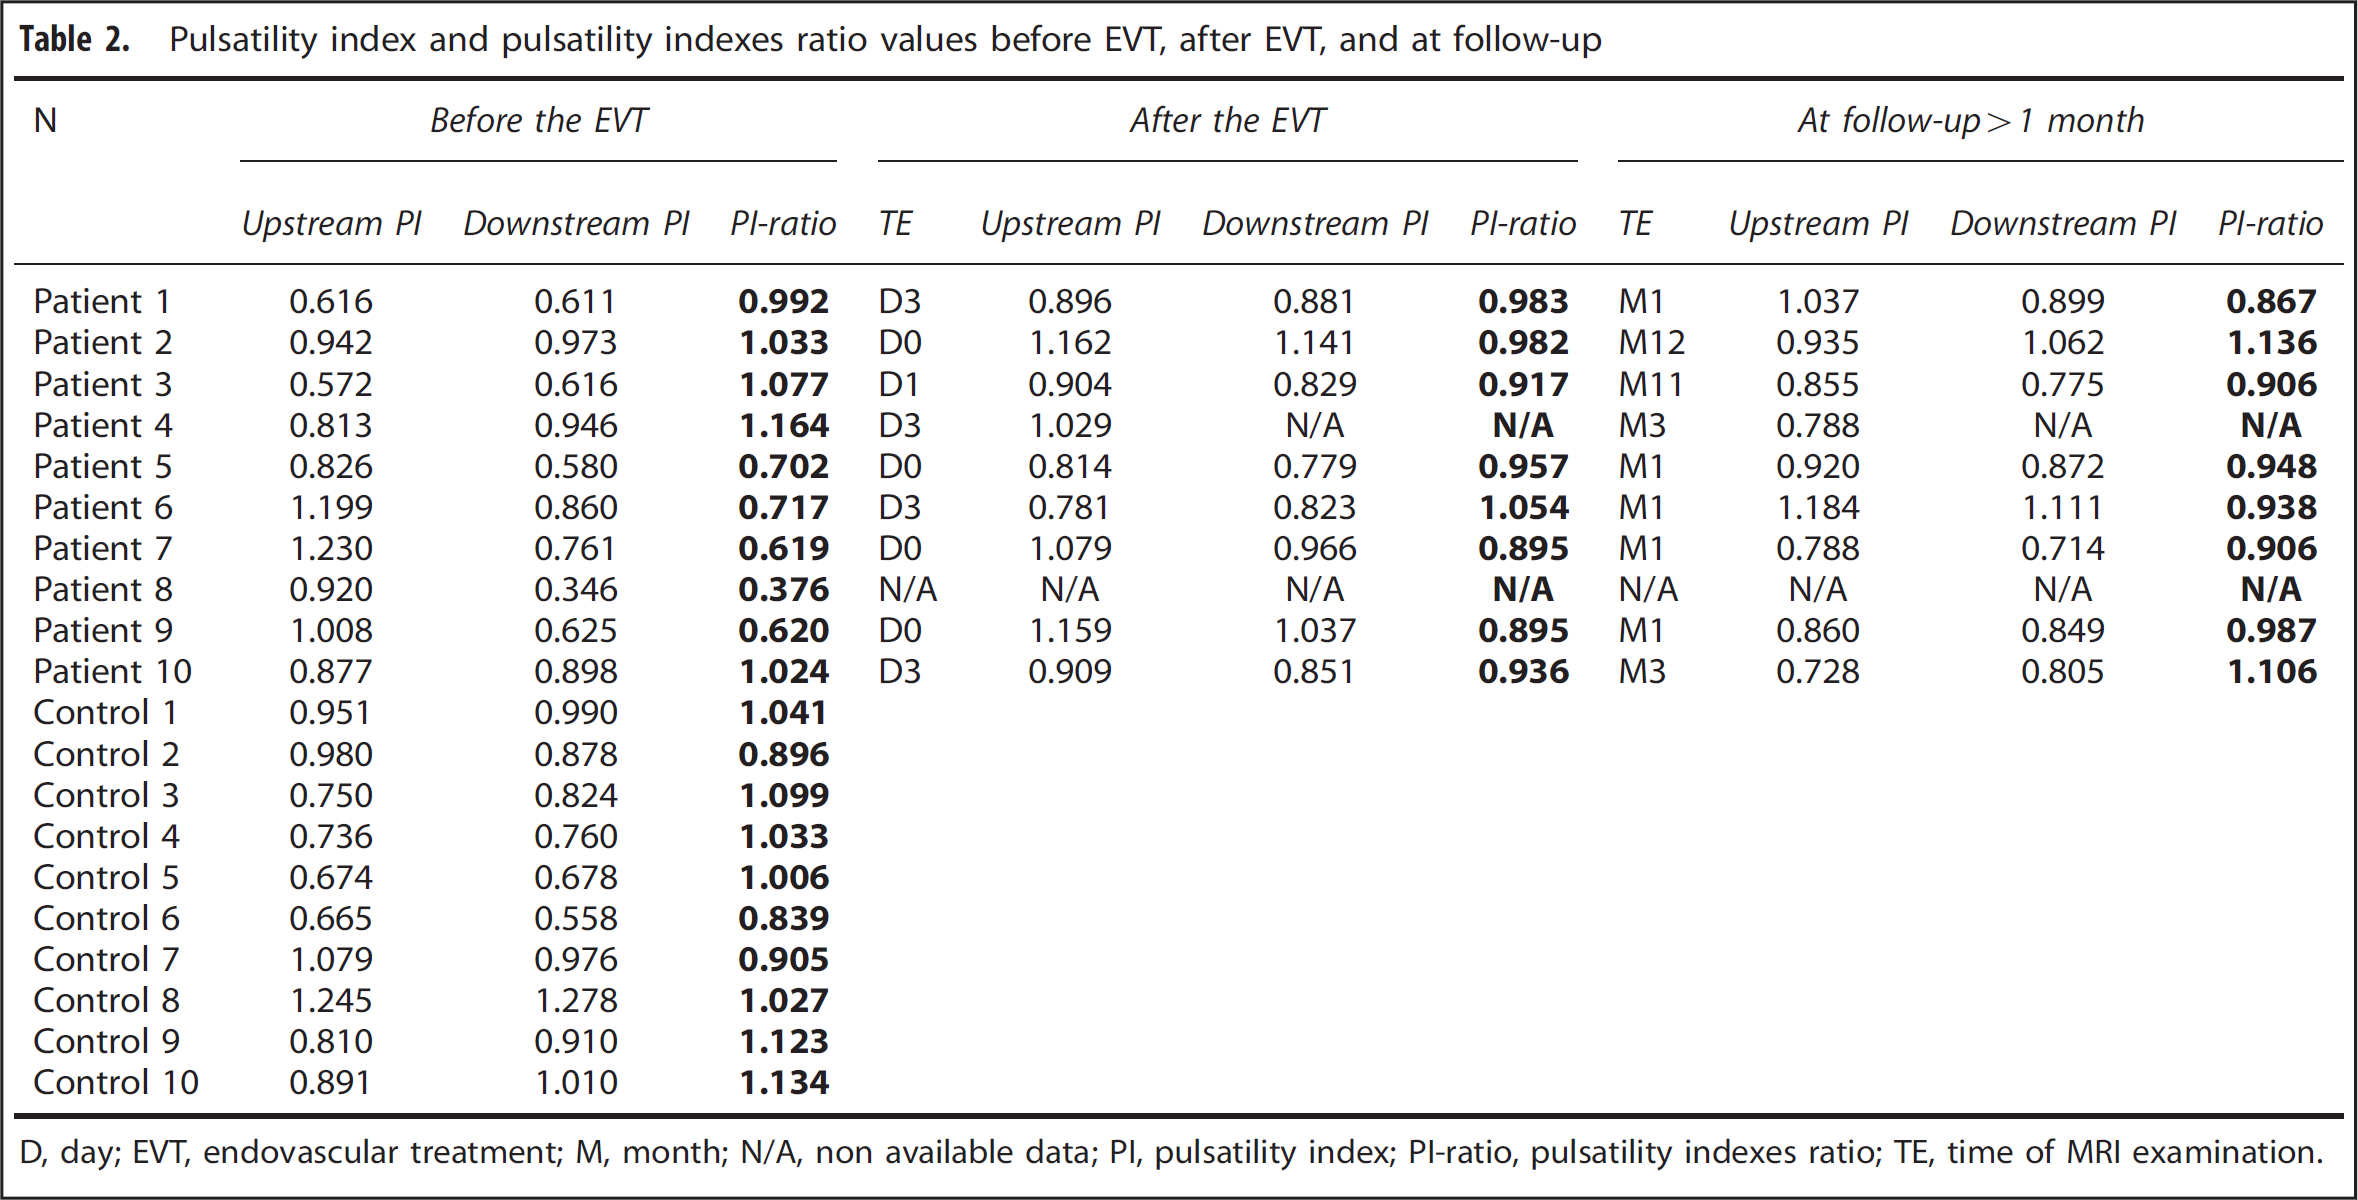
D, day; EVT, endovascular treatment; M, month; N/A, non available data; PI, pulsatility index; PI-ratio, pulsatility indexes ratio; TE, time of MRI examination.
Configuration of circle of Willis and mean blood flow rates
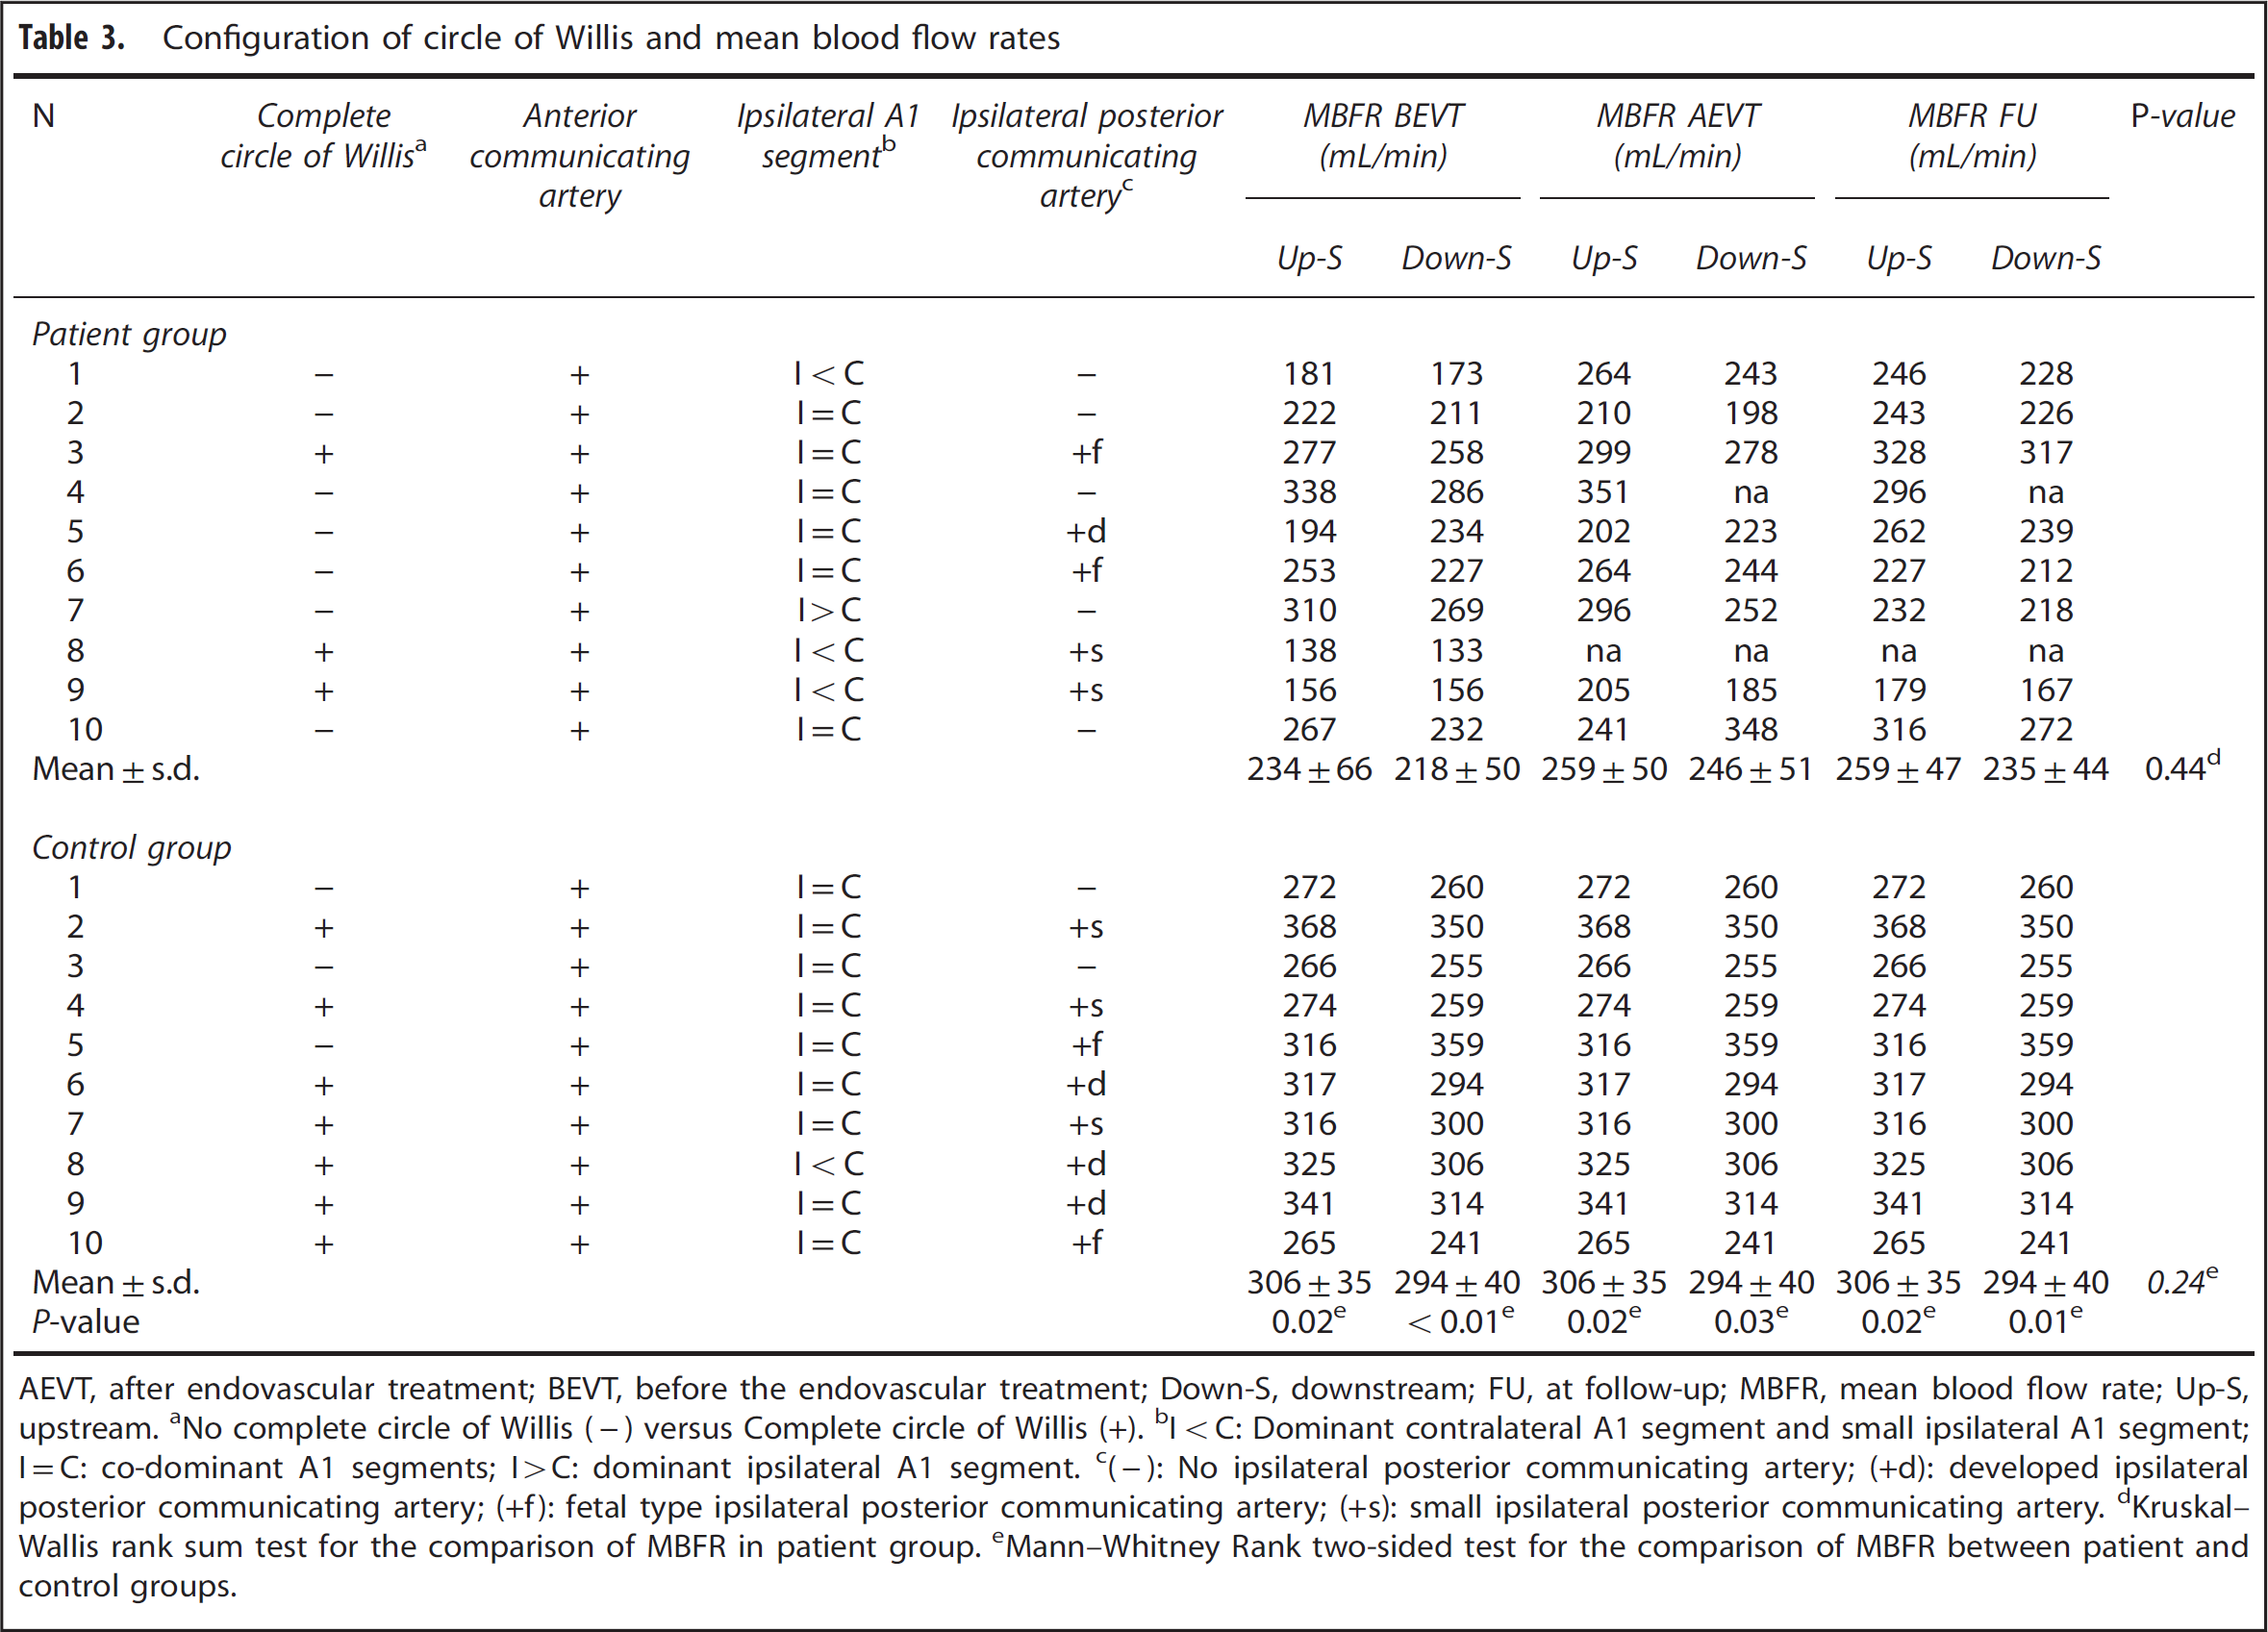
AEVT, after endovascular treatment; BEVT, before the endovascular treatment; Down-S, downstream; FU, at follow-up; MBFR, mean blood flow rate; Up-S, upstream. aNo complete circle of Willis (-) versus Complete circle of Willis (+). bI < C: Dominant contralateral A1 segment and small ipsilateral A1 segment; I = C: co-dominant A1 segments; I > C: dominant ipsilateral A1 segment. c(-): No ipsilateral posterior communicating artery; (+d): developed ipsilateral posterior communicating artery; (+f): fetal type ipsilateral posterior communicating artery; (+s): small ipsilateral posterior communicating artery. dKruskal–Wallis rank sum test for the comparison of MBFR in patient group. eMann–Whitney Rank two-sided test for the comparison of MBFR between patient and control groups.
The distribution of the PI-ratio values fulfilled the normality test (Kolmogorov–Smirnov normality test). Therefore, the PI-ratio values are expressed as mean±s.d. In control group, the mean PI-ratio value was 1.01 ±0.10. In patient group, the mean PI-ratio values were 0.83 ±0.26 before the EVT, 0.95 ±0.05 after the EVT, and 0.97±0.10 at follow-up without any significant difference (
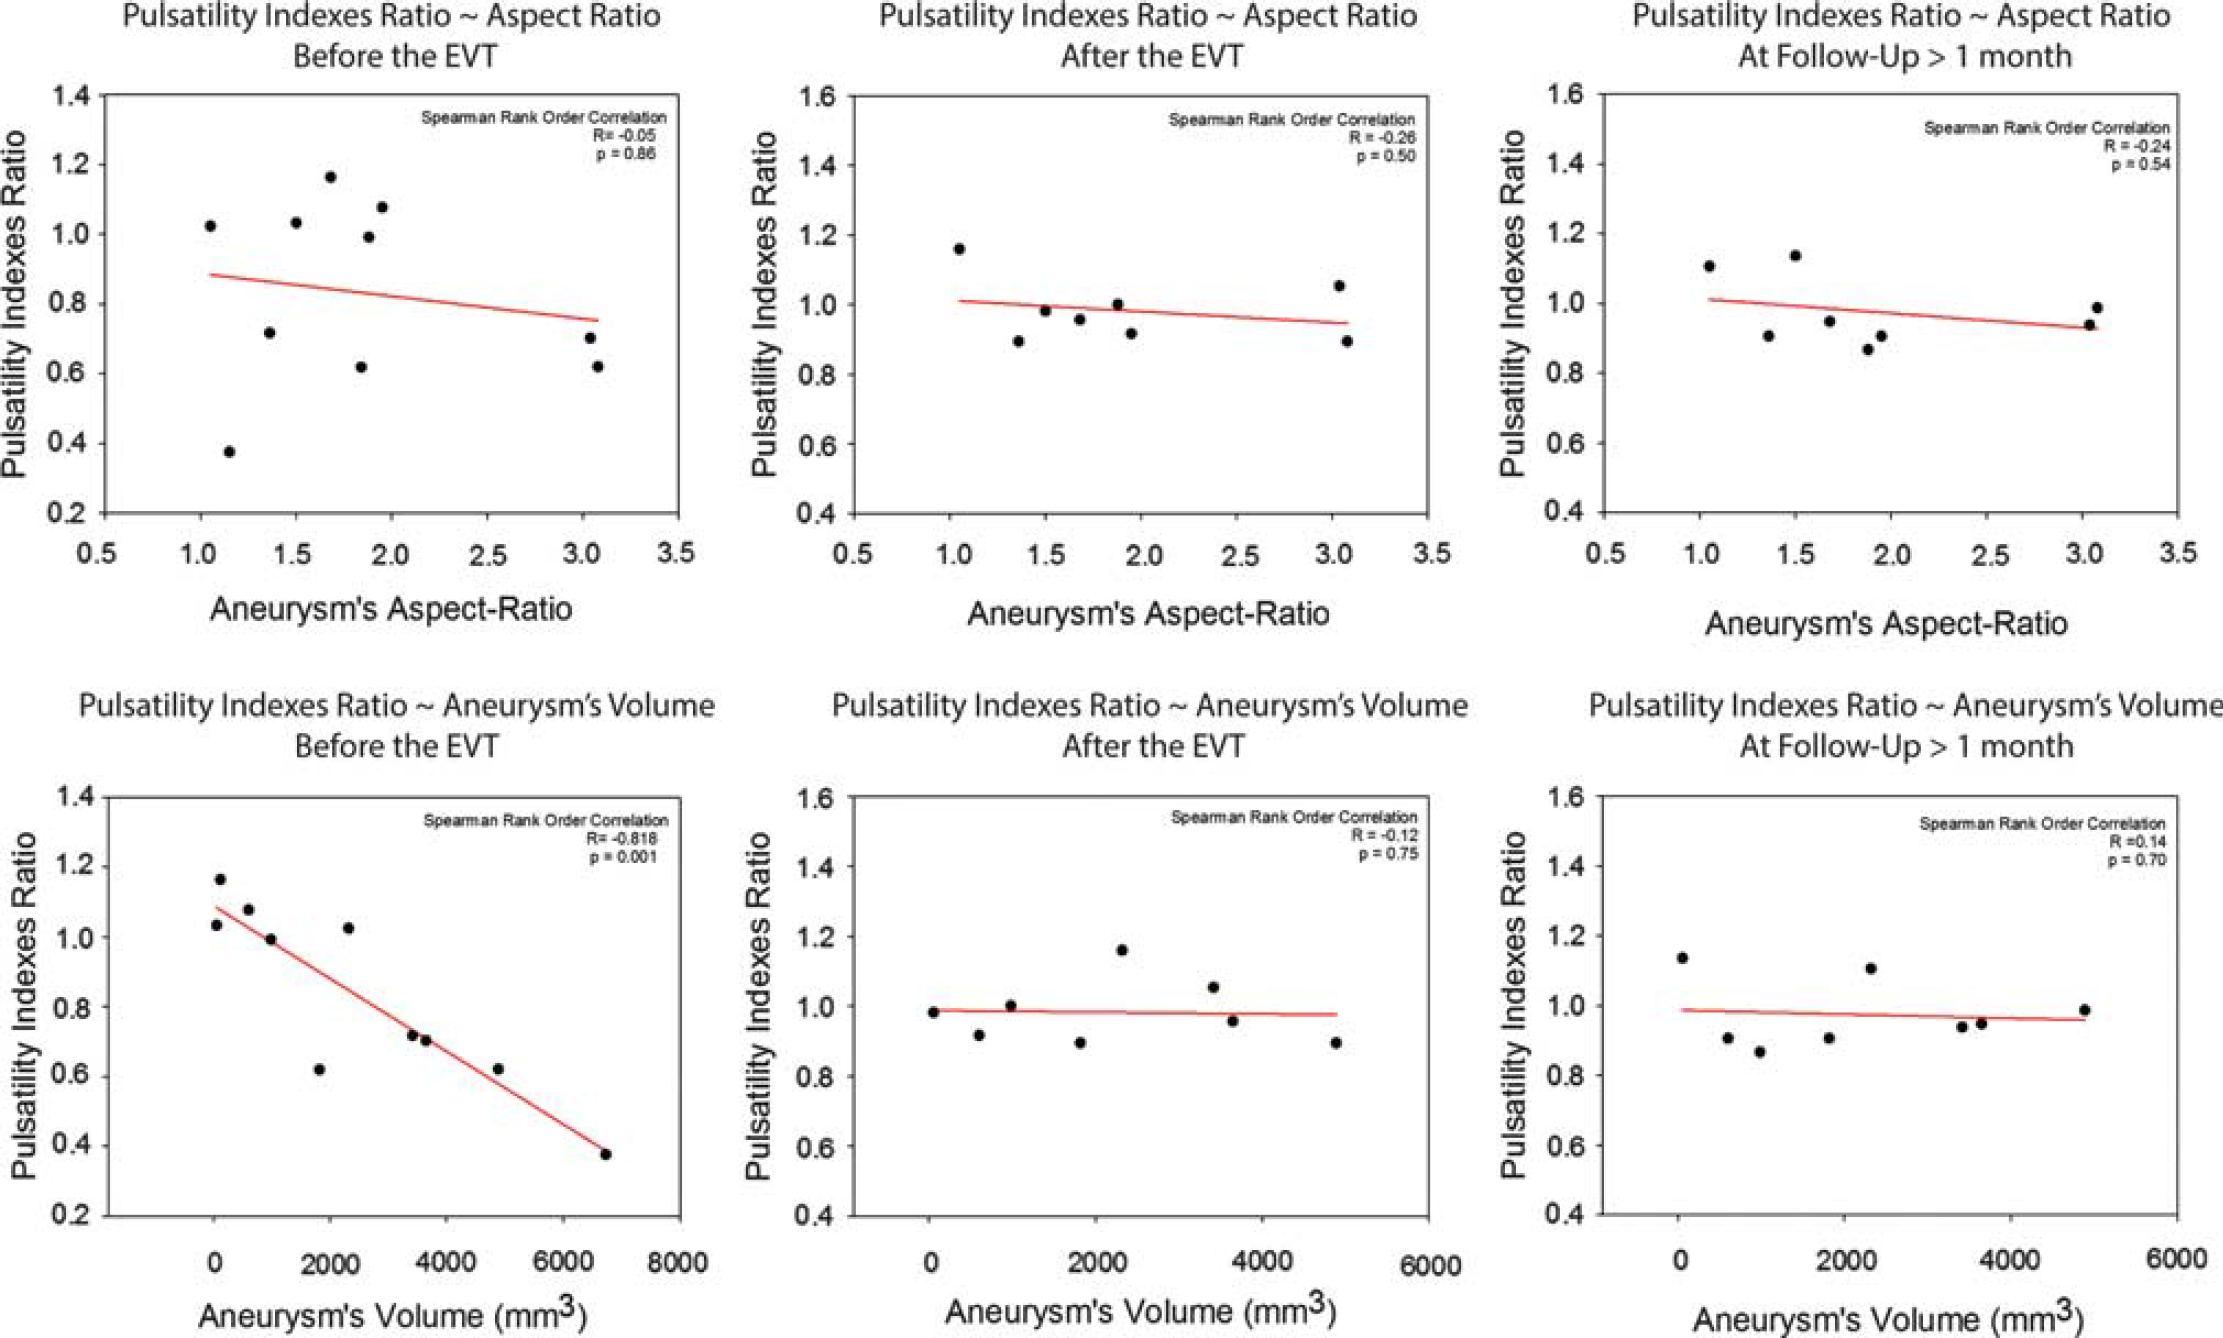
Distribution of the pulsatility indexes ratio (PI-ratio) values in patient group according to the aneurysm's aspect-ratio values and volumes before the endovascular treatment (EVT), after the EVT and at the follow-up. The PI-ratio values before the EVT were significantly inversely correlated to the aneurysm's volumes (
By analyzing retrospectively the PI-ratio values for each patient before EVT, two subgroups of patients could be identified according to whether their PI-ratio values before the EVT was significantly decreased or not compared with those of the control group.
Five patients (subgroup A; mean age of 64.4±11.4 years old) presented a mean PI-ratio value of 1.06 ±0.07 before the EVT, which was not statistically different from that in the control group (
A second group of five patients (subgroup B; mean age of 63.2 ±21 years old) presented a mean PI-ratio value of 0.61 ±0.14 before the EVT, which was significantly decreased compared with that in the control group (
The two subgroups presented PI-ratio values significantly different before the EVT (
Mean Blood Flow Rates
In patient group, the MBFRs at upstream and downstream locations were 244±66 mL/min and 218±50 mL/min before the EVT, 259±50 mL/min and 246±51 mL/min after the EVT, and 259±47 mL/min and 235±44 mL/min at follow-up. No significant differences were observed between the upstream and downstream MBFR at each timepoint (
Volumetric Flow Rate Waveforms
The normalized VFR waveforms in control group and in patient group before EVT are shown in Figure 3. The normalized VFR waveforms for patients in subgroup A and subgroup B before EVT, after EVT, and at follow-up are shown in Figure 4. The analysis of the VFR waveforms showed moderate modifications of the flow modulation at downstream measurement point in patient group before the EVT compared with the normal modulation in the control group. These modifications did not seem to affect the upstream segment of ICA. They were mainly characterized by a moderate increase of diastolic velocities (+14% of mean flow from P3 to D4 plate) associated with a slight decrease in systolic peak (-5% at P1) compared with the upstream VFR waveform. These modifications were more pronounced in the average VFR waveform of subgroup B before the EVT, with a clear increase in the diastolic velocities (+25%), a decreased (-10%) and moderately delayed (+6% of proportion of cardiac cycle) systolic peak with attenuation of the M1 and M2 minima. The average upstream and downstream VFR waveforms after the EVT and at follow-up were comparable to those of the control group. The subgroup A presented modulated VFR waveforms before the EVT, after the EVT, and at follow-up similar to those of the control group.
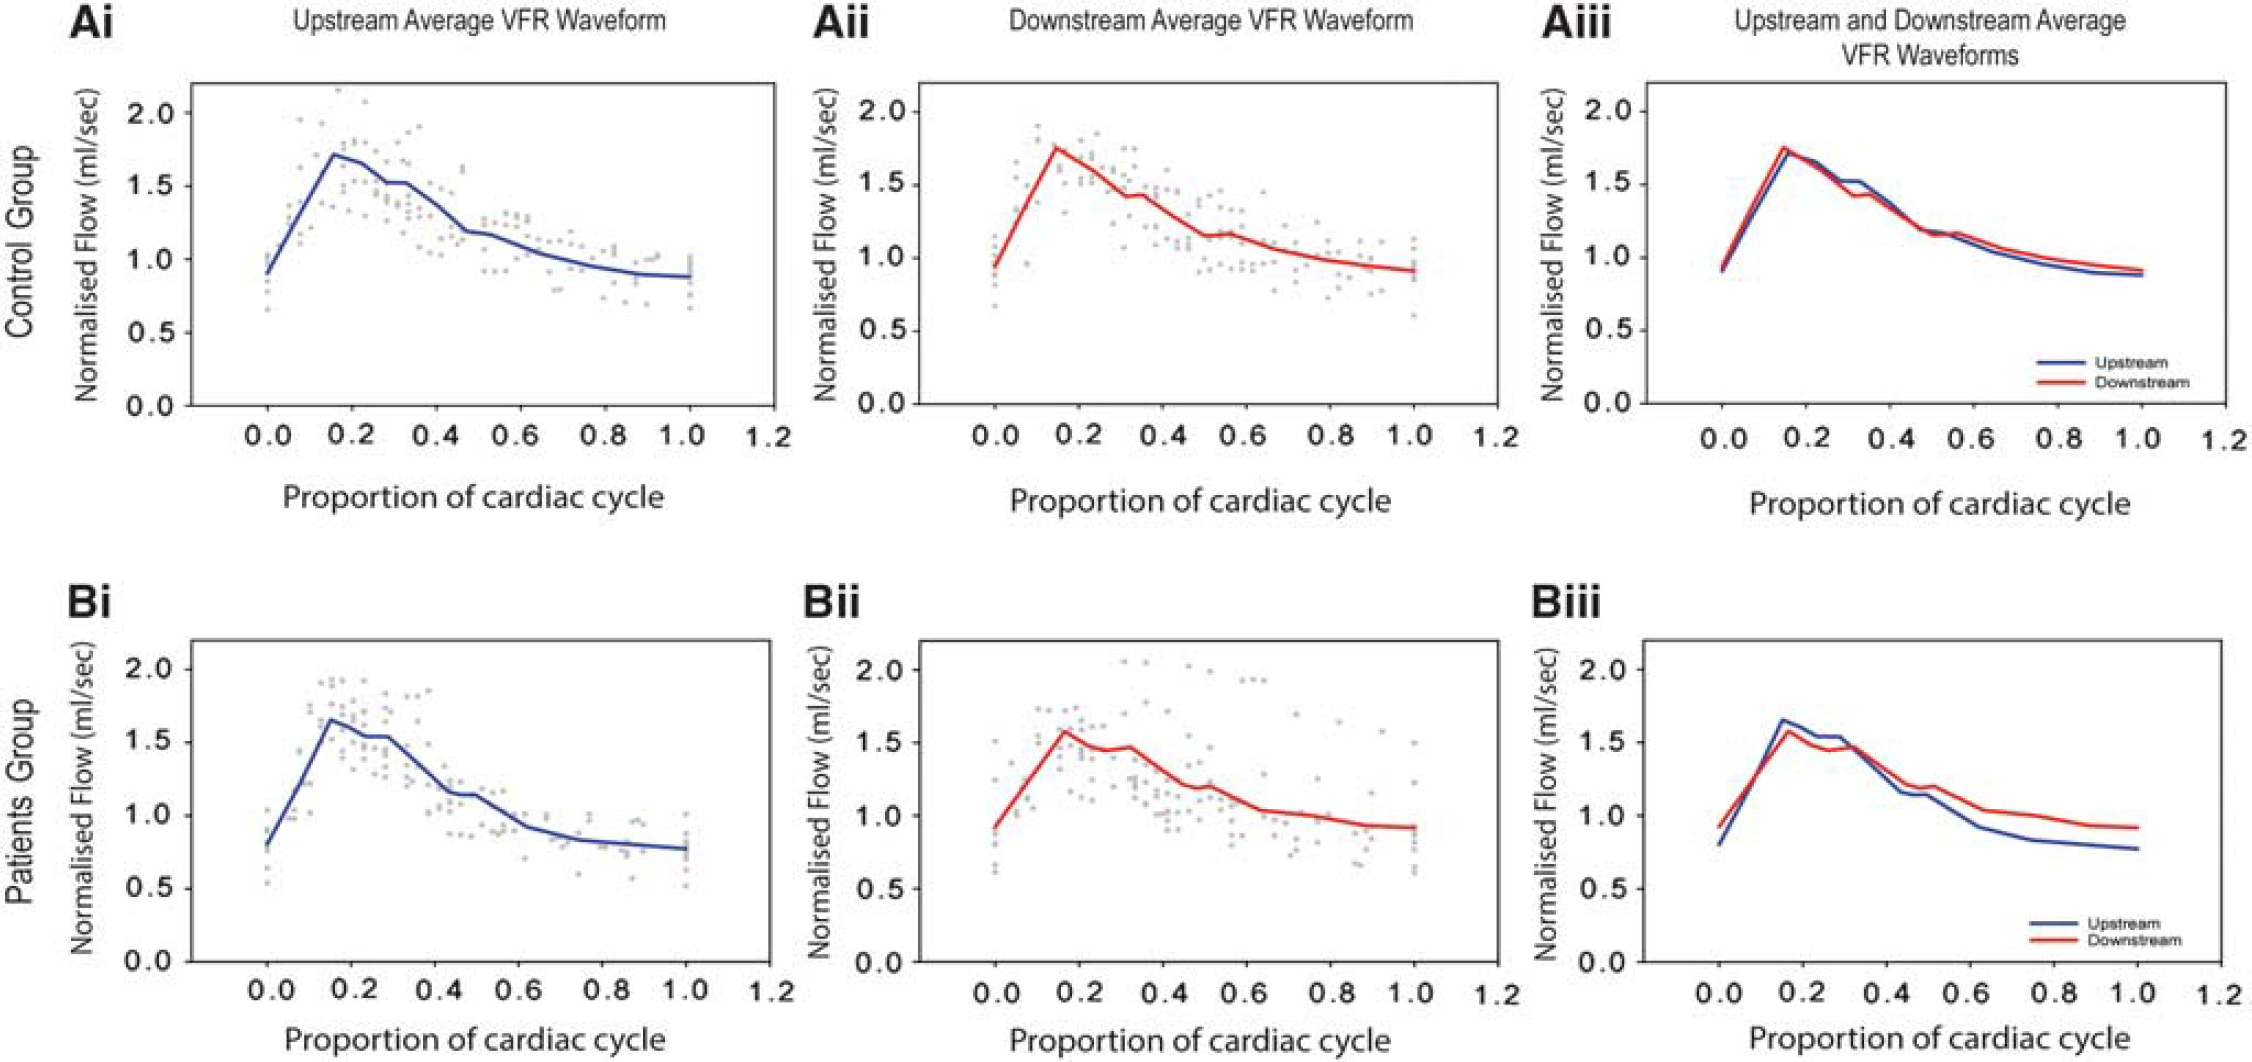
Normalized volumetric flow rate (VFR) waveforms in control group and patient group before the endovascular treatment (EVT). Mean normalized VFR waveforms at upstream (i), downstream (ii) and both upstream and downstream (iii) segments of the internal carotid artery in control group (
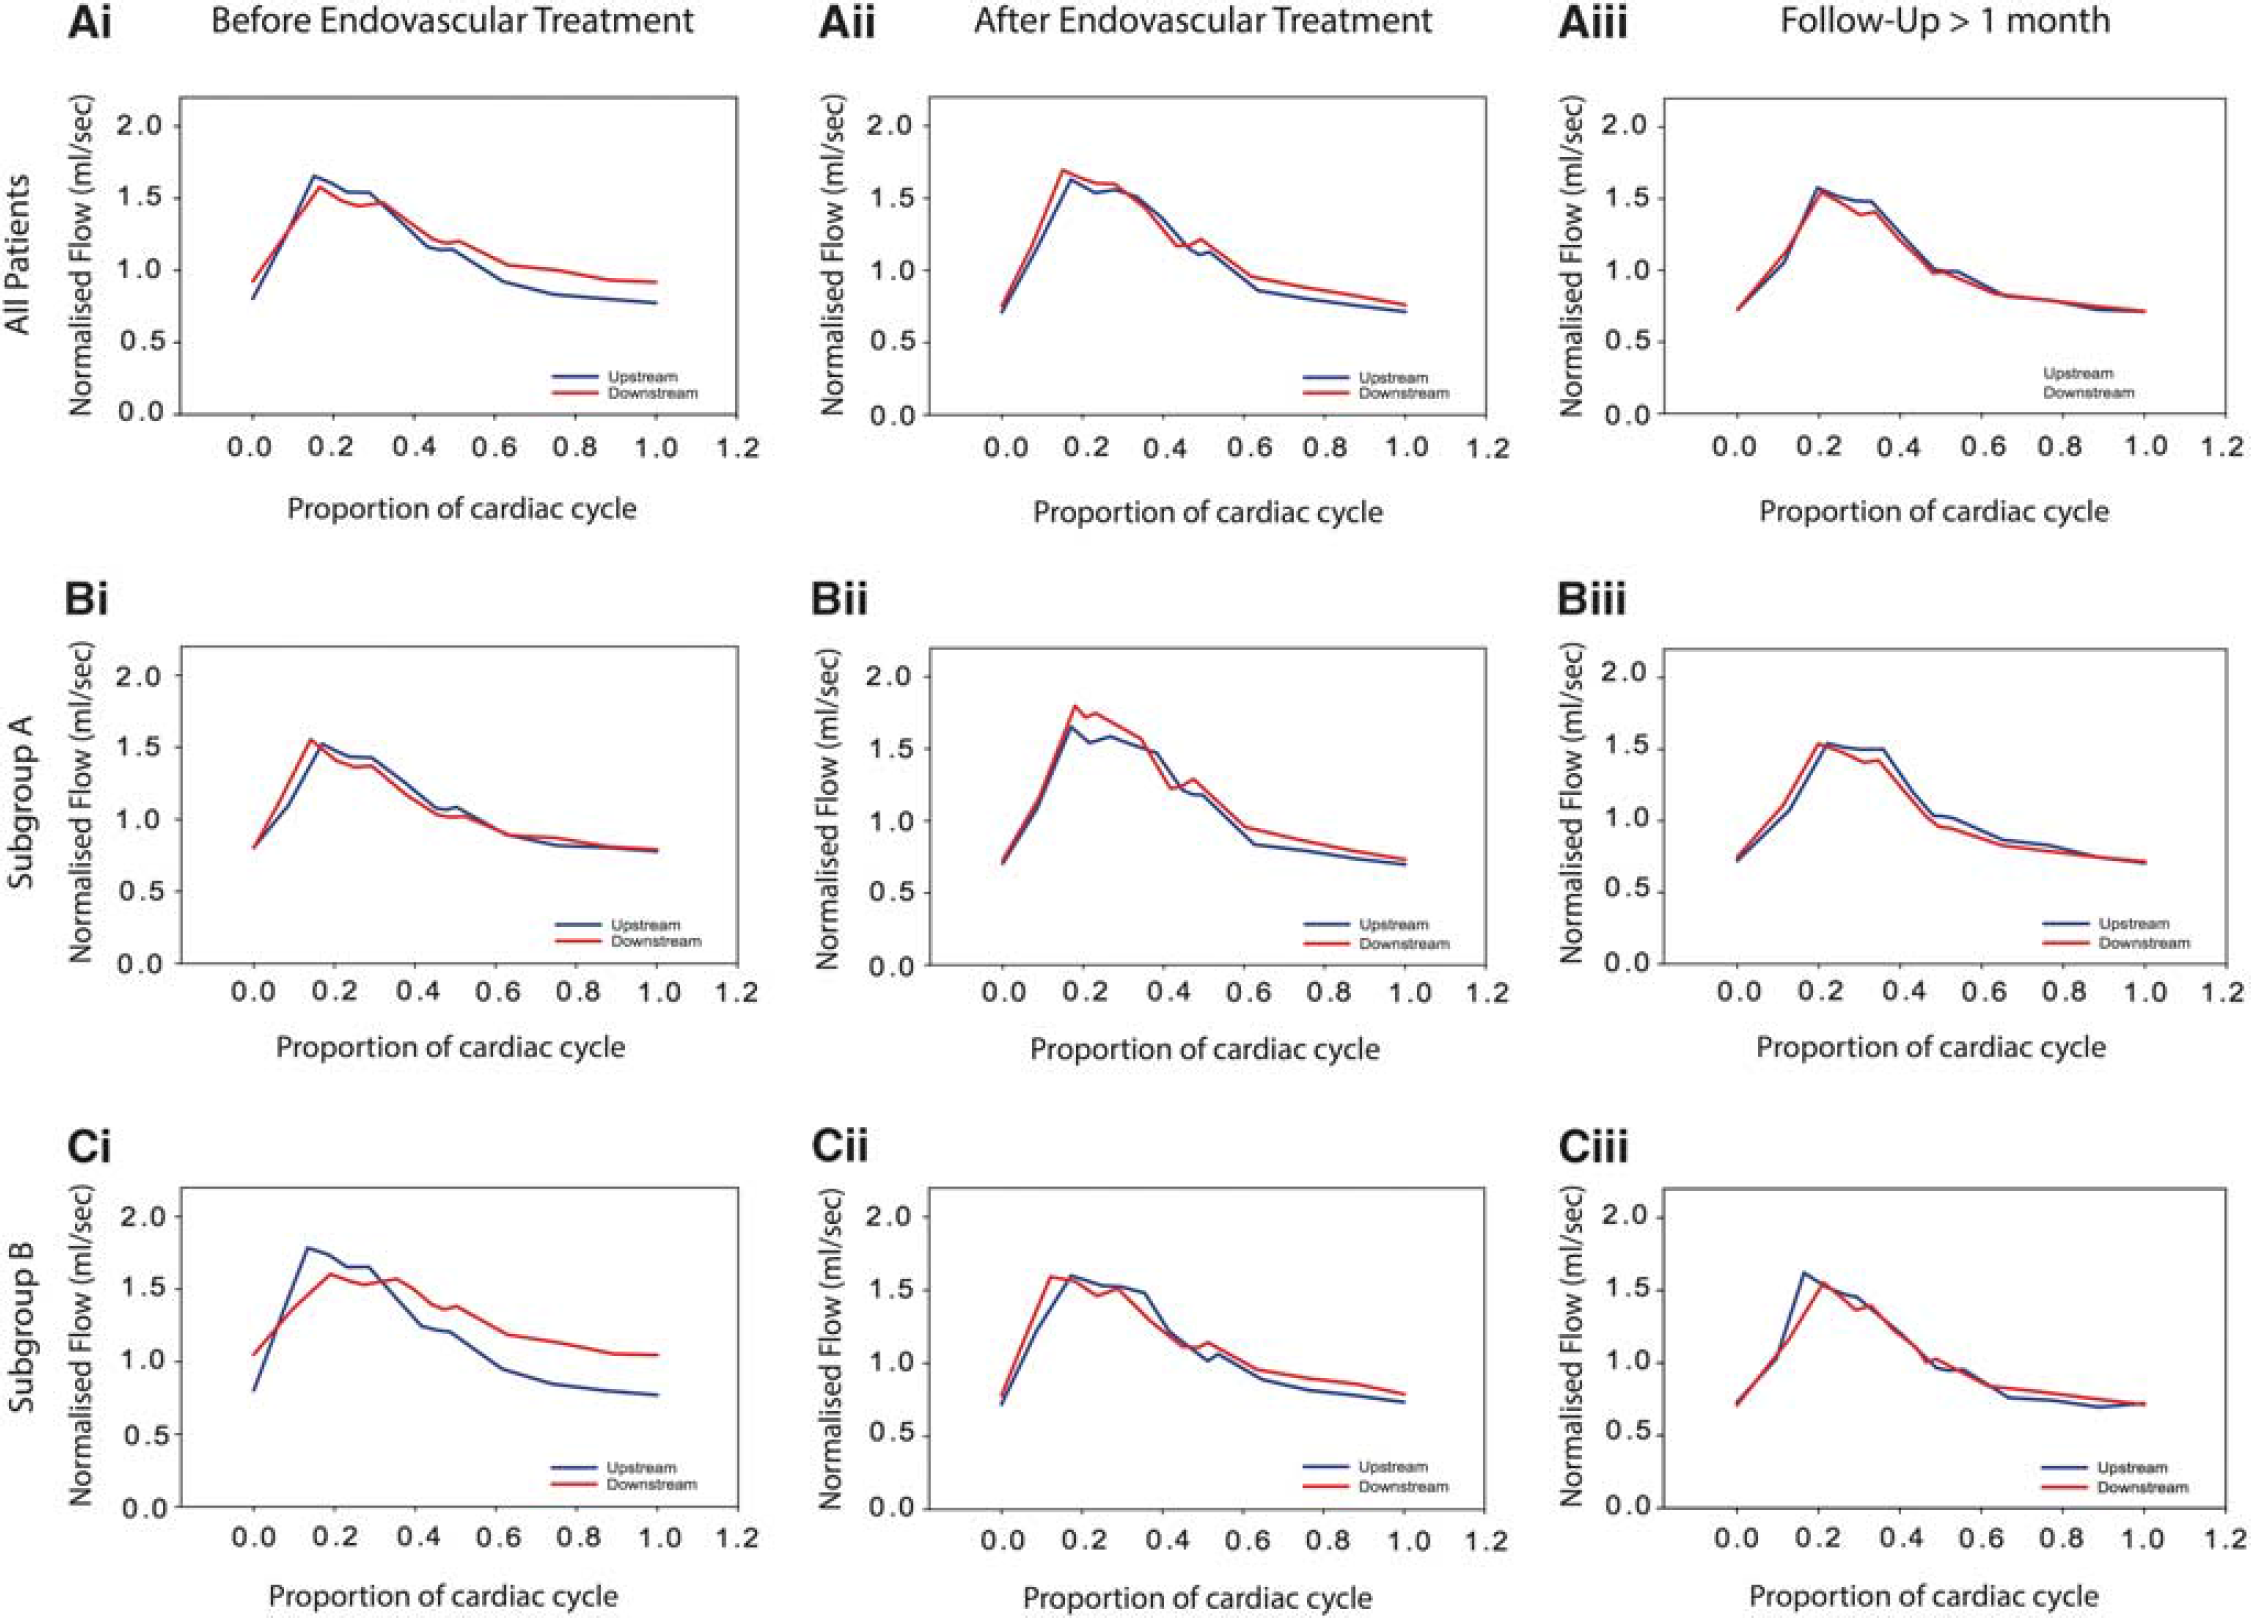
Normalized volumetric flow rate waveforms in patient group, subgroup A and subgroup B before the endovascular treatment (EVT), after the EVT, and at follow-up. Mean normalized waveforms at upstream and downstream segments of the internal carotid artery in patient group (
DISCUSSION
The parent artery geometry and the position of the aneurysm with respect to it are known to impact on the intra aneurysmal flow and the FDS efficiency.1,20 In this study, we highlighted two main findings: (1) the intracranial aneurysms induce some hemodynamic disturbances in parent vessels. This effect of the aneurysms was strongly correlated to their volumes. (2) The FDS have a measurable corrective effect on these flow modifications in the parent vessel for large aneurysms. To our knowledge, this is the first work quantifying the hemodynamic impact of the intracranial aneurysms on the parent vessel and its correction by FDS. Our results are in good agreement with previous data of Gwilliam
As hypothesized by Gwilliam
The FDS for the treatment of unruptured intracranial has already shown a great promise by allowing the ‘morphologic reconstruction’ of the diseased arterial segment.5,24 We observed and quantified a ‘hemodynamic reconstruction’ of the parent vessel treated by FDS. This ‘hemodynamic reconstruction’ was observable only for large aneurysms (subgroup B) immediately after the EVT and was characterized by an increase in the PI-ratio values reflecting the increase in PI values downstream to the aneurysm. It showed the restoration of a normally modulated flow pattern distal to the aneurysm, which remained unchanged at follow-up examination. Regarding the MBFR in upstream and downstream segments of the parent artery, they were comparable and seemed not modified by the presence of the aneurysm, which is consistent with the law of conservation of mass. It suggests that large aneurysms affect the PIs (i.e., the flow pattern) rather than the MBFR in the downstream segment of parent vessel, as shown by the graphical representation of the volumetric flow waveforms. This result suggests that the changes in the downstream vessels after the EVT, and thereby more distally in the vascular bed within the brain parenchyma, are more related to the acute PI correction than to the MBFR modifications, which should not be significant according to the law of conservation of mass.
Interestingly, all the symptomatic patients had the lower PI-ratio values before the EVT, which were associated with the larger volumes. Whereas all the asymptomatic patients had PI-ratio values comparable to those in control group. This analysis is biased by the aneurym's volume, which can be considered as a confounding factor responsible for both the symptoms and the PI-ratio values decrease.
These findings provide new insights on the complex relationship between aneurysms and the parent vessel hemodynamic. We believe that the hemodynamic changes in both the parent vessel and the aneurysmal sac are indissociable for a better comprehension of the intracranial aneurysmal disease. From a clinical point of view, it allows us to make assumptions about some complications reported after treatment of large aneurysms. One can reasonably assume that the sudden increase in the PI in a probably long-standing downstream dampened blood flow (i.e., with a decreased PI) within the ipsilateral hemisphere could have a role in intraparenchymal hemorrhage or in hyperperfusion syndromes that have been previously reported after the treatment of large aneurysms either by clipping or by endovascular techniques.6,25,26 The knowledge of this eventual effect for large aneurysms could be taken into account for the treatment decision and the postoperative management of the patients. We did not observe such complications in our series of patients.
Different methods have been described to measure flow boundary conditions in aneurysmal disease. Levitt
Limitations
This study had several limitations. Since only aneurysms of the intracranial ICA treated by FDS were included in this feasibility study, the number of patients was limited. Only ICA aneurysms were included to simplify the analysis and to limit the velocity measurements on relatively large and straight arterial segments for which no underestimation in flow and velocity measurements is expected with 2D pc-MRA. 18 Only two partially thrombosed aneurysms were analyzed. Therefore, the effect of the intrasaccular thrombosis on the flow waveform could not be assessed. Thus, the significance of PI-ratio values regarding intrasaccular thrombosis was not evaluated. Larger prospective studies could be considered to investigate this point. But, the large range of aneurysm's volumes (from 55 to 6,735 mm3) enabled the demonstration of a significant correlation between the aneurysm's volume and its impact on the parent vessel hemodynamic. Control and patient groups were not matched for age because of the limited size of our series. The mean age of control group was significantly lower than the mean age of patient group. The effect of age on the PI of large arteries, such as the ICA, has already been reported in the literature.18,19 Since we analyzed the PI-ratio values between the upstream and downstream segments of the parent vessel relative to the aneurysm's location instead of the PI alone, our methodology should overcome the effect of age. Furthermore, the PI-ratio values in subgroup A at each timepoint, the PI-ratio values in subgroup B after the EVT and at follow-up, and those in the control group, as well, were comparable and not significantly different. These latter results highlight the robustness of the PI-ratio value analysis in time regarding the potential effects of age. The effect of arterial normal stiffening associated with the age affecting the arterial compliance was not observed in our limited cohort, either in patient or in control groups. However, the significant age difference between patient and control group had an impact on the computationed MBFR. The MBFR was higher in the control group compared with the patient group before the EVT, after the EVT, and at follow-up. This result is in good agreement with previous studies that had shown an inverse correlation between the age and the MBFR.18,19
CONCLUSION
The intracranial aneurysms induce some flow modifications in the parent vessel which are measurable by 2D pc-MRI technique, through a pulsatility indexes ratio computation and VFR waveform analysis. This impact of aneurysms on parent hemodynamic is strongly correlated to their volumes and corrected by FDS for large aneurysms. This approach could help to better understand the complexity of aneurysm-parent vessel hemodynamic interactions. Further studies on a larger number of patients with different aneurysmal localizations and geometries will be needed to confirm our results and to clarify the significance of the computed PI-ratio values regarding the interaction between the aneurysm and parent vessel hemodynamics, and also the long-term efficiency of the FDS.
Footnotes
OFE contributed to study conception and design, acquisition of data, statistical analysis and interpretation, drafting of manuscript, critical revision of the article, and final approval of the article. KZB contributed to study conception and design, statistical analysis and interpretation, critical revision of the article, and final approval of the article. RACJ contributed to acquisition of data, critical revision of the article, and final approval of the article. ELB and MS contributed to critical revision of the article and final approval of the article. AB, VC, and GC contributed to study conception and design, critical revision of the article, and final approval of the article. GC contributed to study conception and design, critical revision of the article, final approval of the article, and obtained funding.
The authors declare no conflict of interest.
ACKNOWLEDGMENTS
The authors thank Carlos Riquelme, Marinette Moynier, Christian Mosca, Thierry Chaptal, Yann Pigeyre, Patrick Estruche, Nadia Oubihi, Assya El Gouche, Jérémy Deverdun and the department of Interventional Neuroradiology of Gui de Chauliac Hospital, Montpellier, France, for their technical support
References
Supplementary Material
Please find the following supplemental material available below.
For Open Access articles published under a Creative Commons License, all supplemental material carries the same license as the article it is associated with.
For non-Open Access articles published, all supplemental material carries a non-exclusive license, and permission requests for re-use of supplemental material or any part of supplemental material shall be sent directly to the copyright owner as specified in the copyright notice associated with the article.