
Abstract
We previously reported that pathologic measures of arteriosclerosis (AS), cerebral infarction, and Alzheimer’s disease (AD) are independently correlated with cortical gray matter (CGM) atrophy measured by in vivo magnetic resonance imaging (MRI). Here, we use path analyses to model the associations between these three pathology measures and cognitive impairment, as mediated by CGM atrophy, after controlling for age and education. In this sample of 116 elderly persons followed longitudinally to autopsy (ischemic vascular disease (IVD) program project), differential patterns were observed between AS and atrophy/cognition versus AD and atrophy/cognition. The total effect of AD pathology on global cognition (β = −0.61, s.e. = 0.06) was four times stronger than that of AS (β = −0.15, s.e. = 0.08). The effect of AS on cognition appears to occur through cerebral infarction and CGM atrophy (β = −0.13, s.e. = 0.04). In contrast, the effects of AD pathology on global cognition (β = −0.50, s.e. = 0.07) occur through a direct pathway that is five times stronger than the indirect pathway acting through CGM atrophy (β = −0.09, s.e. = 0.03). The strength of this direct AD pathway was not significantly mitigated by adding hippocampal volume to the model. AD pathology affects cognition not only through brain atrophy, but also via an unmeasured pathway that could be related to synaptic dysfunction before the development of cortical atrophy.
Introduction
Community-based clinical-pathologic cohort studies frequently reveal a mixture of Alzheimer’s disease (AD) and vascular disease among persons who experience dementia in late life.1,2,3 Among 804 community-dwelling elderly persons from the Religious Orders Study (n = 456) and Rush Memory and Aging Project (n = 348), 20.2% (162) had evidence of AD plus at least one cerebral infarct at autopsy. 3 The proportion of mixed pathology almost doubled in the oldest old (age ≥90) compared with other older adults (age 65 to 89) (27.6% versus 15.7%, respectively).
While AD pathology and infarcts are highly prevalent autopsy findings in elderly persons, it is not clear how these lesions are related quantitatively and mechanistically to cortical atrophy and cognition. Pathologic studies consistently show stronger associations between severity of cognitive impairment and AD pathology than infarct scores.4,5 Among features of AD pathology, neurofibrillary tangles are more strongly correlated with cognitive impairment than senile plaques. 6 Among features of vascular brain injury, microinfarcts are more strongly associated with cognitive impairment than large or small infarcts.5,7
Clinical practice relies heavily on structural magnetic resonance imaging (MRI) for the diagnosis of AD and vascular cognitive impairment. Structural MRI findings of large and small infarcts, white-matter hyperintensities, and microbleeds provide evidence of vascular brain injury of varying etiologies. Atrophy of the hippocampus and posterior cingulate/precuneus is an early finding in AD. 8 Generalized brain atrophy, however, is nonspecific and occurs with both vascular disease and AD.9,10,11 Relatively few reports have combined neuropsychological, volumetric imaging, and pathologic measures to elucidate the differential pathways leading from arteriosclerosis (AS) and AD to cognitive decline, via MRI endophenotypes. 9
We conducted a prospective longitudinal study designed to elucidate the contribution of subcortical ischemic vascular disease (SIVD) and AD to cognitive impairment. In previous clinical-imaging reports from this project, among typical structural MRI measures, cortical gray matter (CGM) correlated most strongly with measures of global cognition. 12 In addition, we previously reported among 93 autopsy cases that AD pathology, AS, and subcortical infarcts were independently correlated with CGM. 13 In this report, we added an additional 23 cases (n = 116) and cognitive outcome measures. In addition to multiple regression analysis, we applied path analyses to determine the relative strengths of associations between these pathologic lesions and cognitive impairment, mediated by CGM. We hypothesized that AS and AD pathologies would relate via different pathways to infarcts, brain atrophy, and cognition.
Materials and methods
Participants
The sample comprises 116 autopsy cases drawn from a longitudinal study of elderly subjects with SIVD, AD, and no cognitive impairment (IVD Program Project, May 2014 neuropathology database). Among the first consecutive 208 subjects coming to autopsy, 1 case with fronto-temporal lobar degeneration, 12 cases with dementia with Lewy bodies (DLB score ≥3), 59 cases without complete MRI and neuropsychological test data, and 20 cases with last MRI greater than 9 years before death were excluded from this analysis. The 208 autopsy cases were drawn from a total sample of 736 subjects. The research project was approved by the institutional review boards at the University of Southern California, University of California Davis, University of California San Francisco, and Rancho Los Amigos National Rehabilitation Center. Written informed consent was obtained from all subjects or surrogate decision makers following institutional review board approval at each institution. 14
Recruitment
Subjects with cognitive impairment and dementia were primarily recruited from university-affiliated memory clinics; cognitively normal subjects were recruited from the community. The sample was enriched for subjects with evidence of SIVD, defined by the presence in proton density MRI of discrete gray-matter and white-matter hyperintensities >2 mm in diameter, which were operationally defined as lacunes. Frank cerebral hemorrhage or cortical infarcts were exclusionary criteria at the time of subject enrollment; new occurrences were allowed during subsequent longitudinal follow-up.
Clinical Evaluation
The comprehensive research evaluation has been described previously, 14 and included medical history, activities of daily living, physical and neurologic examination, mini-mental state examination, laboratory testing, serial neuropsychological testing, 15 and quantitative MRI measures. 16 Apolipoprotein E (ApoE) genotype was obtained in 116 autopsy cases by PCR, followed by standard restriction isotyping. The presence or absence of hypertension, hyperlipidemia, diabetes, heart disease, transient ischemic attack, and stroke was assessed initially and at each annual follow-up. For this analysis, a vascular risk factor was considered to be ‘present’ if noted on any of the annual assessments.
Cognitive Assessment
A battery of standardized neuropsychological tests was administered every other year for participants younger than 80 years old and every year for participants older than 80 years. Measures of global cognition (GLOB), verbal memory (MEM), and executive function (EXEC) were created using item response theory.17,18 Scale development used 400 elderly individuals with cognitive function ranging from normal to demented. Donor items for GLOB came from the first two learning trials of the Memory Assessment Scale List Learning Test, Wechsler Memory Scale-Revised Digit Span total raw score, letter fluency, and animal category fluency. The MEM scale combined short delayed free recall, short delayed cued recall, and immediate recall on learning trials 1 and 3 of the Memory Assessment Scale List Learning Test. Donor items for EXEC were the Initiation-Perseveration subscale of the Mattis Dementia Rating Scale, letter fluency, Digit Span backward, and Spatial Span backward. Each scale was transformed to a mean of 100 and a standard deviation of 15.
MRI Image Acquisition and Analysis
The MRI measures of interest were volumetric measures of CGM and hippocampal volume (HV). The segmentation process consisted of stripping the skull from the images, coregistering the T1-weighted images to the spin-echo images. Very conservative samples of cerebrospinal fluid, white matter, and gray matter were chosen as seeds for a K-Means cluster analysis to segment the entire brain into these tissue compartments. 16 Magnetic resonance double spin-echo and volumetric T1 (magnetization-prepared rapid gradient echo or spoiled gradient echo recalled) sequences were obtained on 1.5-Tesla MR systems (either Siemens Vision, Erlangen, Germany or General Electric Signa, Milwaukee, WI, USA) with a quadrature head coil. A computerized segmentation algorithm was used to classify brain MRI pixels into CGM, subcortical gray matter, white matter, WMH, and cerebrospinal fluid. The HVs were obtained from 1.4 mm slices from the first visible anterior portion of the hippocampal head through the most posterior aspect of the hippocampus at the point of the separation of the crus of the fornix from the fimbria of the hippocampus. An interrater reliability test (n = 18) using scans from normal controls (NC) yielded an r of 0.81 for total HV. Total intracranial volume was computed by summing over all pixels within the intracranial vault. 12 The key volumetric measures CGM and HV were normalized to the total intracranial volume (ICV).
Neuropathology Tissue Protocol
After death, the brains for all subjects were removed, weighed, and fixed in 10% neutral buffered formalin for at least 2 weeks. After removal of the brainstem, each cerebral hemisphere was sectioned coronally at 5 mm thickness using a rotary slicer. The slices were photographed on a black background with labels, rulers, and color bars in-frame using a high-resolution digital camera (Kodak DC260, 1,536 by 1,024 resolution) and stored in digital format for MRI coregistration. 19 All macroscopic infarcts were measured, photographed, and blocked for microscopic examination. Tissue was obtained from 12 standardized regions in one cerebral hemisphere according to a standardized protocol. 14 Tissue blocks were dehydrated through graded alcohols, embedded in paraffin, sectioned at 10 micron thickness, and stained with hematoxylin-eosin, cresyl violet, Congo red, and Bielschowsky silver. At the pathologist’s discretion, cases were also immuno-labeled using antibodies against alpha-synuclein, ubiquitin, glial fibrillary acidic protein, phosphorylated tau, and beta-amyloid. The range of observed neuropathologic lesions has been described. 20
Pathologic Evaluation
Each case was reviewed at Consensus Neuropathology Conferences, which included two Board-certified neuropathologists blinded to clinical diagnosis and apoE genotype. Severity of atherosclerosis and arteriolosclerosis was each rated on a 4-point scale (0 to 3 points, 0 = none, 1 = mild, 2 = moderate, 3 = severe). Large arterial vessels were defined as vessels with diameter ≥1.5 mm (i.e., the anterior, middle, and posterior cerebral arteries of the circle of Willis); small arterial vessels were defined as those with diameter in the range of 0.2 to 1.5 mm. Cerebral amyloid angiopathy was assessed using the modified Vonsattel scale of 0 to 4; 21 Large cystic infarcts were >1 cm in greatest dimension. Lacunar infarcts were visible grossly and were <1 cm in greatest dimension. Microinfarcts were only visible upon microscropic examination; while they were almost always visualized on routine hematoxylin and eosin-stained sections, microinfarcts were sometimes highlighted using immunohistochemistry using primary antibodies to glial fibrillary acidic protein and CD68, astrocytic and microglial markers, respectively.
For each autopsy case, Braak & Braak Stage (B&B; 0 to VI), 22 CERAD-neuritic plaque score (0 to 3), 23 and Lewy body score (0 to 10) were recorded. We did not include a rating for diffuse plaques. The severity of cerebrovascular ischemic brain injury was rated using a cerebrovascular disease parenchymal score (CVDPS) system developed within this project, and described in a previous publication. 14 Subscores for cystic infarcts, lacunar infarcts, and microinfarcts were created by summing the individual scores assessed across all brain regions and normalizing to a scale of 0 to 100. The three subscores were then summed to give a total CVDPS (0 to 300). Acute infarcts or hemorrhages near the time of death were noted, but were not included in the CVDPS.
Pathologic Diagnoses
Demographic data by pathologic diagnosis (N = 116).
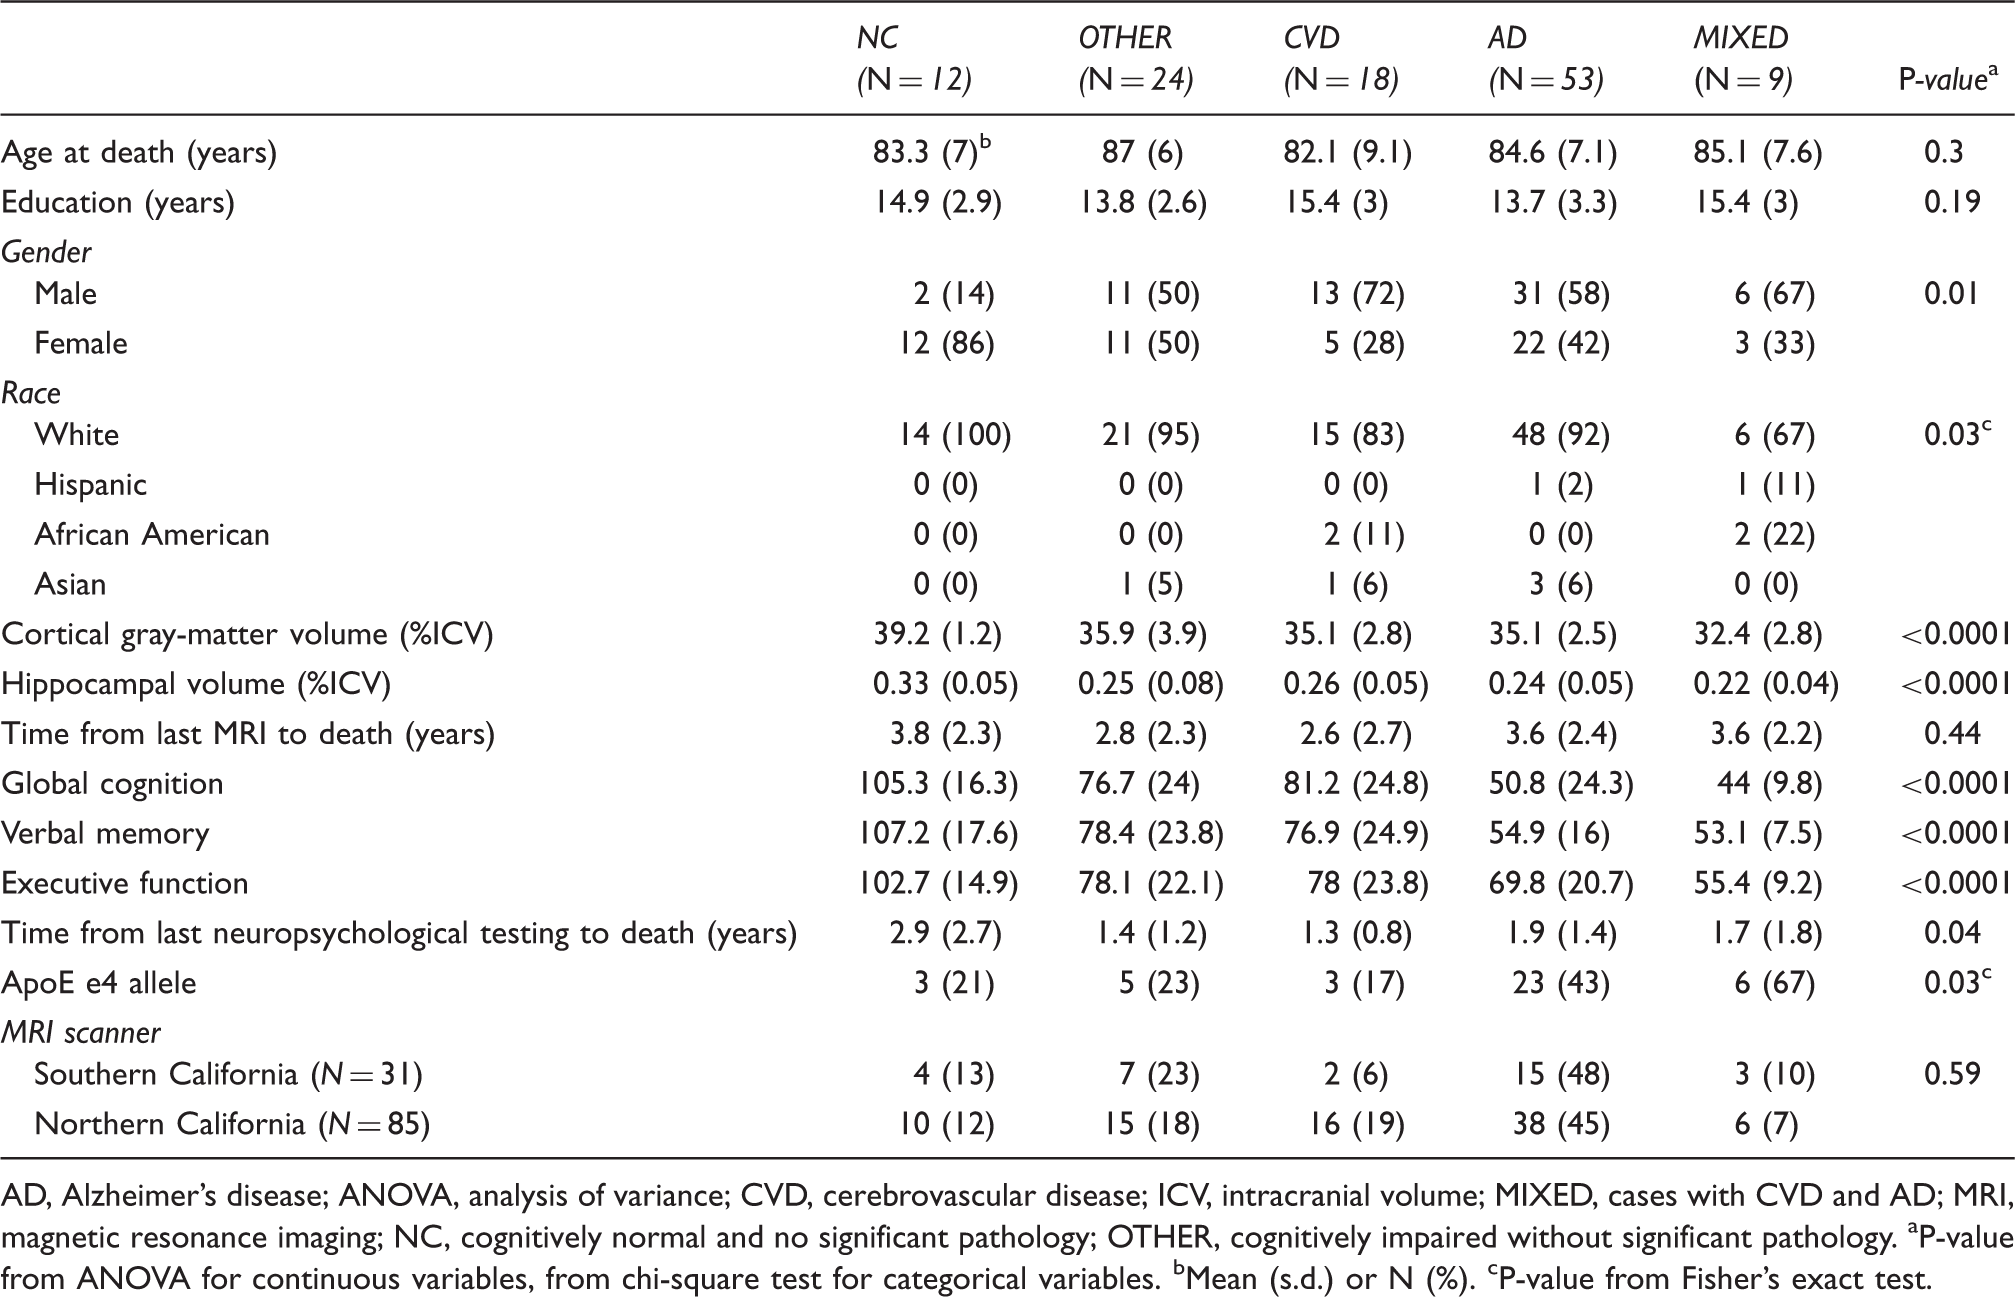
AD, Alzheimer’s disease; ANOVA, analysis of variance; CVD, cerebrovascular disease; ICV, intracranial volume; MIXED, cases with CVD and AD; MRI, magnetic resonance imaging; NC, cognitively normal and no significant pathology; OTHER, cognitively impaired without significant pathology.
P-value from ANOVA for continuous variables, from chi-square test for categorical variables.
Mean (s.d.) or N (%).
P-value from Fisher’s exact test.
Statistical Analysis
Sample characteristics were compared among the five pathologic diagnosis groups using analysis of variance for continuous variables and chi-square tests for categorical variables. Our major hypotheses examined the associations of pathologic measures of blood vessel abnormalities, ischemic brain injury, and AD pathology with CGM atrophy. Because colinearity was observed for atherosclerosis and arteriolosclerosis (Spearman r = 0.70, P < 0.0001) and for B&B and CERAD scores (Spearman r = 0.80, P < 0.0001), combined scores were generated: AD-PATH (defined as (CERAD + Braak score/2)) and AS (defined as atherosclerosis + arteriolosclerosis) (AS).
Our analysis addressed two research questions: (1) what are the independent pathologic correlates of CGM; (2) how are these pathologic variables related to cognition (GLOB, MEM, and EXEC), and to what extent are the associations with cognition mediated through CGM? Multivariate linear regression models were employed for the first objective. The dependent variable, volume of CGM, was normalized to the total intracranial volume. We confirmed in this larger sample the previously reported independent associations of AS and ADPATH with CGM. 13 Subsequently, cortical cystic infarcts, cortical microinfarcts, subcortical cystic infarcts, and subcortical microinfarcts were modeled separately with adjustment for AD-PATH and AS. Additional adjustment for age at death, gender, race/ethnicity, and years of education was explored but excluded from the final multivariate model as none of these variables were confounders or statistically significantly associated with CGM. Plots of model residuals versus explanatory variables and versus dependent variables were used to examine model assumptions. The results of multivariate linear regression models are presented as beta coefficients and standard errors for each independent variable. The estimated coefficients are interpreted as the changes in CGM (%ICV) per unit change of the independent variable.
For the second objective, path analysis was performed after controlling for age at death and years of education. Path analysis was used to simultaneously consider the direct, indirect, and total effects of independent pathologic correlates of CGM on cognition through mediators. Different units of measurements were used to assess AD pathology, AS, and infarcts. 25 Multiple regression analysis does not provide a direct comparison of the relative strengths of these associations. In contrast, path analysis yields standardized path coefficients that enable direct comparisons among different pathways. In a path diagram, the standardized beta (standard error) accompanying each single-headed arrow represents a path coefficient for direct effect in the designated direction; the standardized beta (standard error) by each double-headed straight arrow represents a standardized correlation coefficient without direction. A black line denotes a direct effect path. A blue line denotes an indirect effect path. Linearity assumptions of path models were examined and met. AS, subcortical cystic infarcts, and AD-PATH were modeled as exogenous variables. Cortical gray matter, HV and each composite cognitive score were modeled as endogenous variables. Age at death and year of education were added in PARTIAL statements to control for their effects on cognition. Fit indices were computed for each model. All path models presented have standardized root mean square residual less than 0.05, and Bentler comparative fit indices greater than 0.90. All statistical testing was performed at a 5% level of significance using SAS version 9.3 (SAS Institute, Inc., Cary, NC, USA).
Results
Sample Characteristics
The autopsy sample comprised 53 cases with AD, 18 cases with CVD, 9 cases with MIXED AD/CVD pathology, 24 OTHER, and 12 NC (Table 1). The pathologic groups did not differ on age at death or years of education. Higher proportions of females were seen in the NC group compared with the other pathologic groups. Ethnic minorities were more frequently represented in the CVD and MIXED groups. Cognitive impairment, as assessed by global cognition, was more severe in the AD and MIXED groups. Cortical gray matter and HV were greater in the NC group. An ApoE4 allele was more frequent in the AD and MIXED groups. The distribution of AD-PATH, AS, and infarcts for the total sample is shown in Figure 1. We observed a broad spectrum of B&B staging, CERAD score, AS, and infarcts. In our sample, two MRI scanner sequences were used (n = 31 for scanner 1, n = 85 for scanner 2). The mean AS or ADPATH did not differ between these two groups (2.6 ± 1.7 versus 2.7 ± 1.6, P = 0.77; 3.1 ± 2.3 versus 3.5 ± 2.2, P = 0.41, respectively).
Distribution of Alzheimer’s disease (AD) pathology, arteriosclerosis, and cerebral infarct measures (N = 116).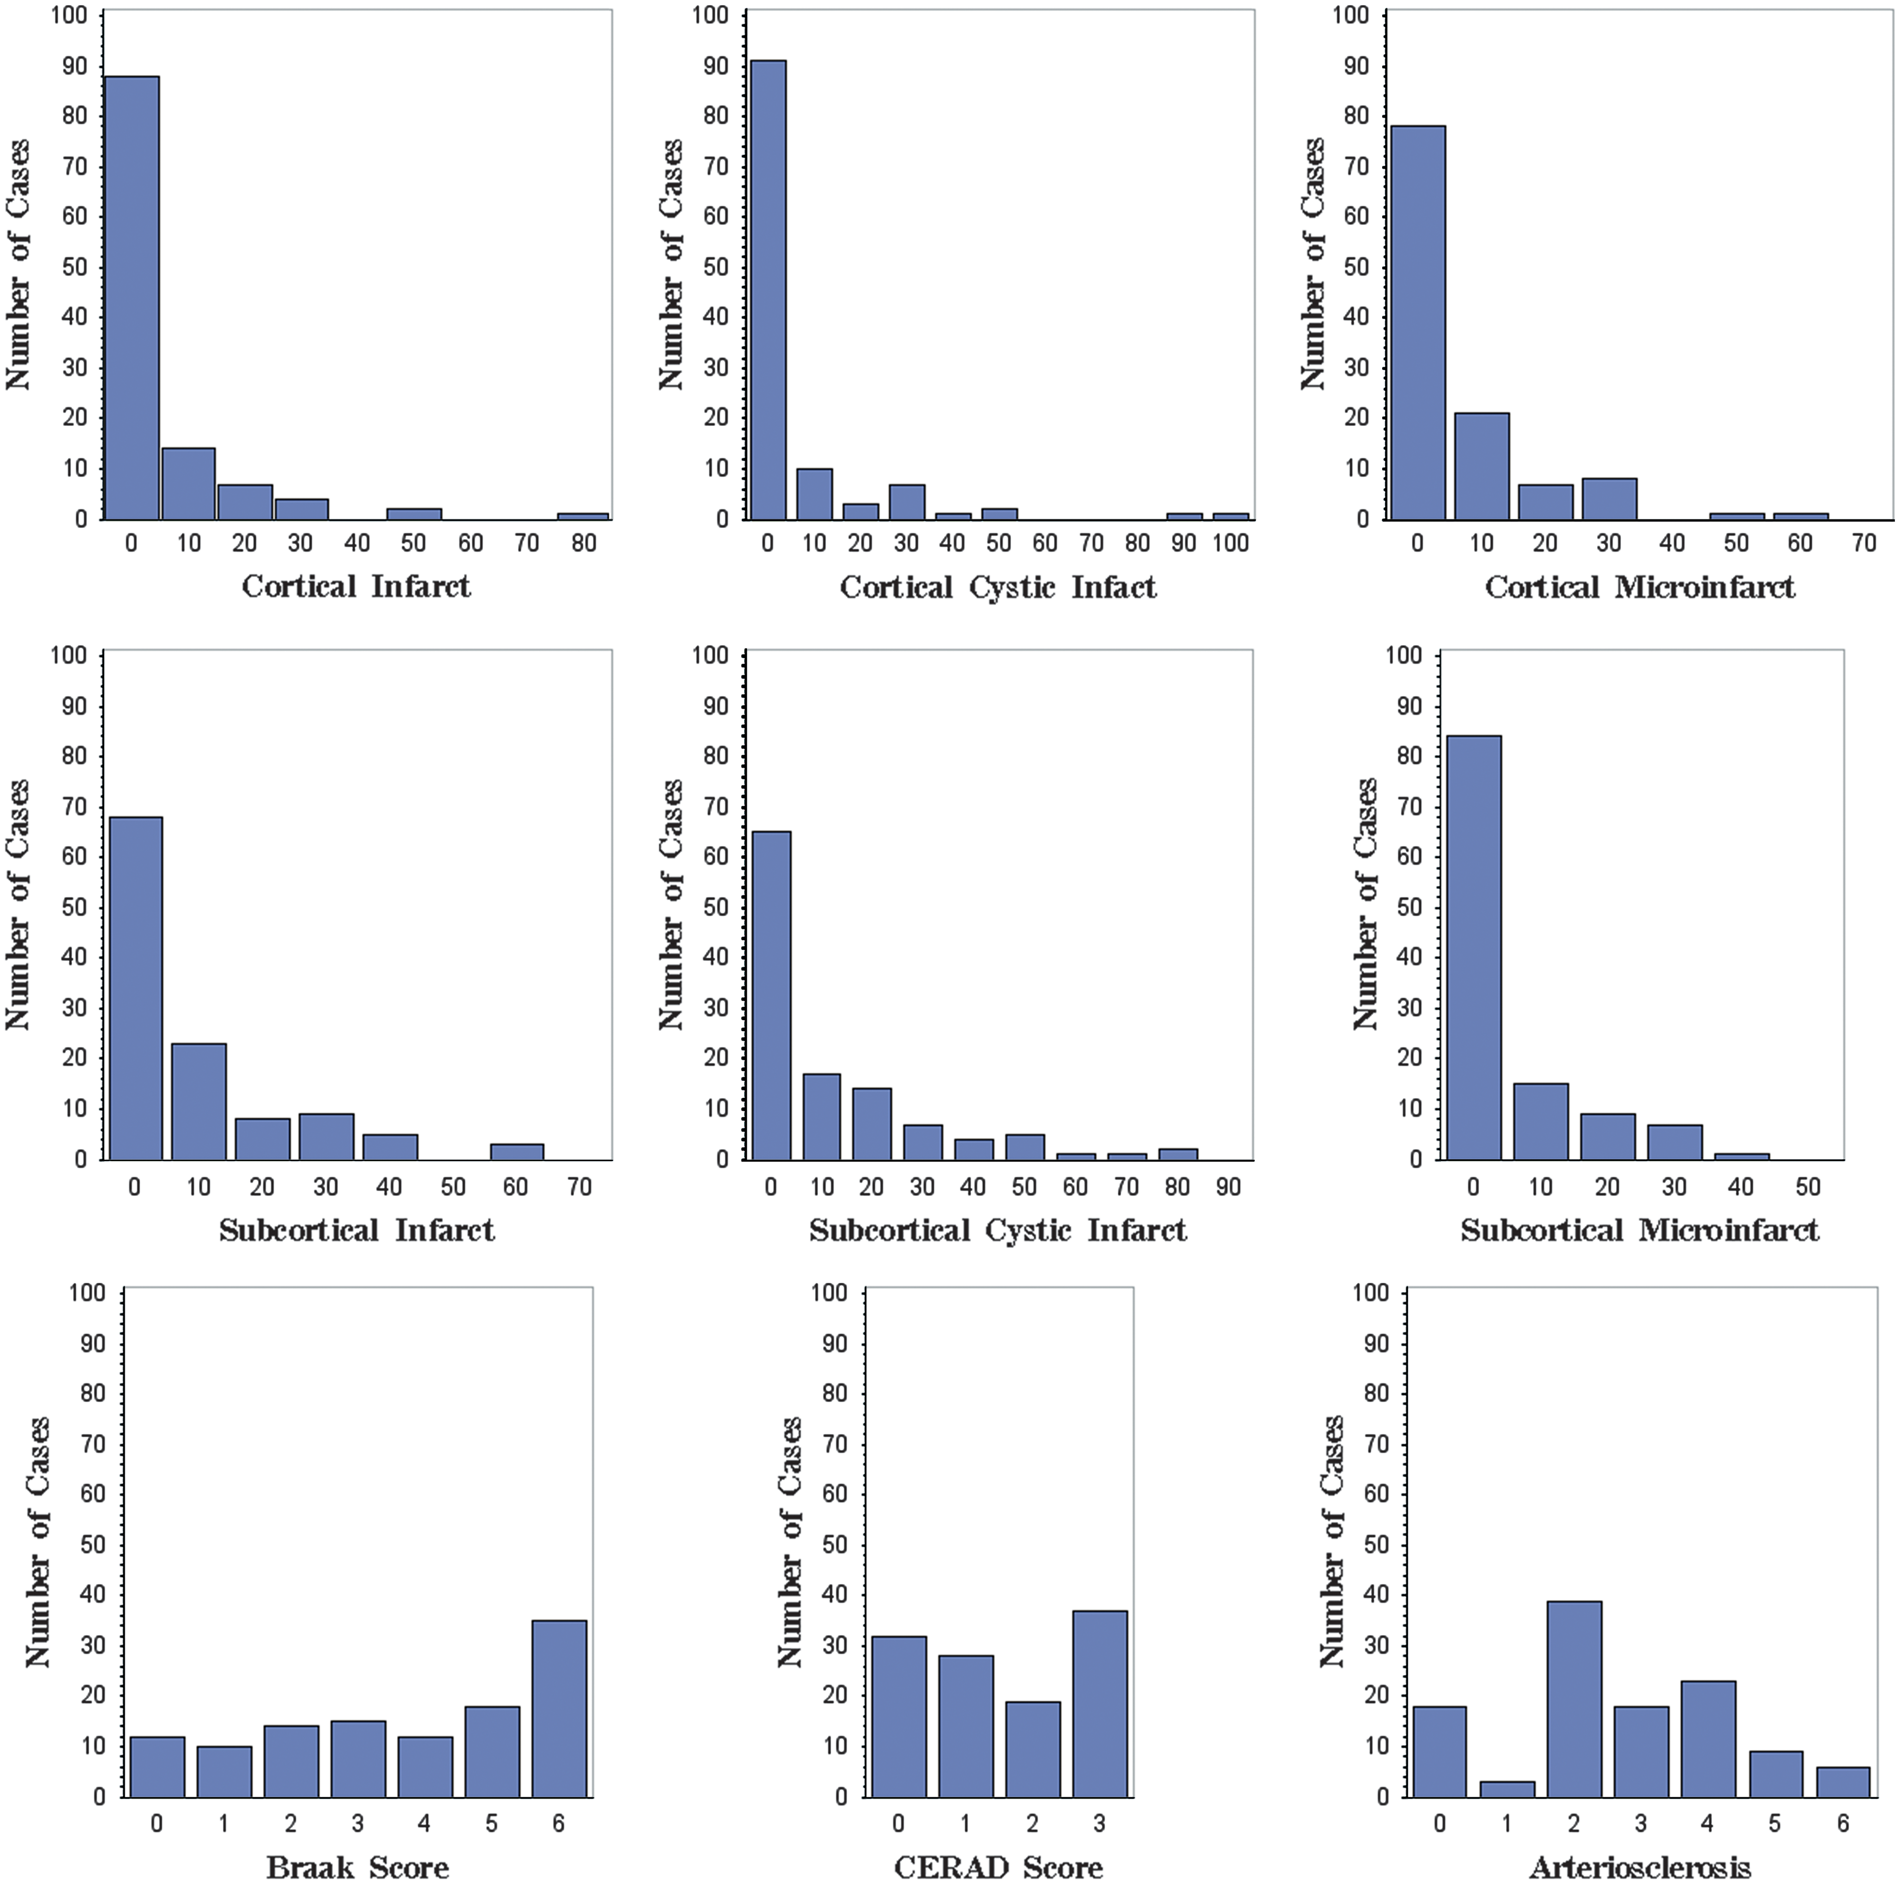
Correlations of Cerebral Infarcts with Cortical Gray Matter Volume
Multivariate linear regression models evaluating the association between cerebral infarcts and cortical gray matter volume (n = 116).
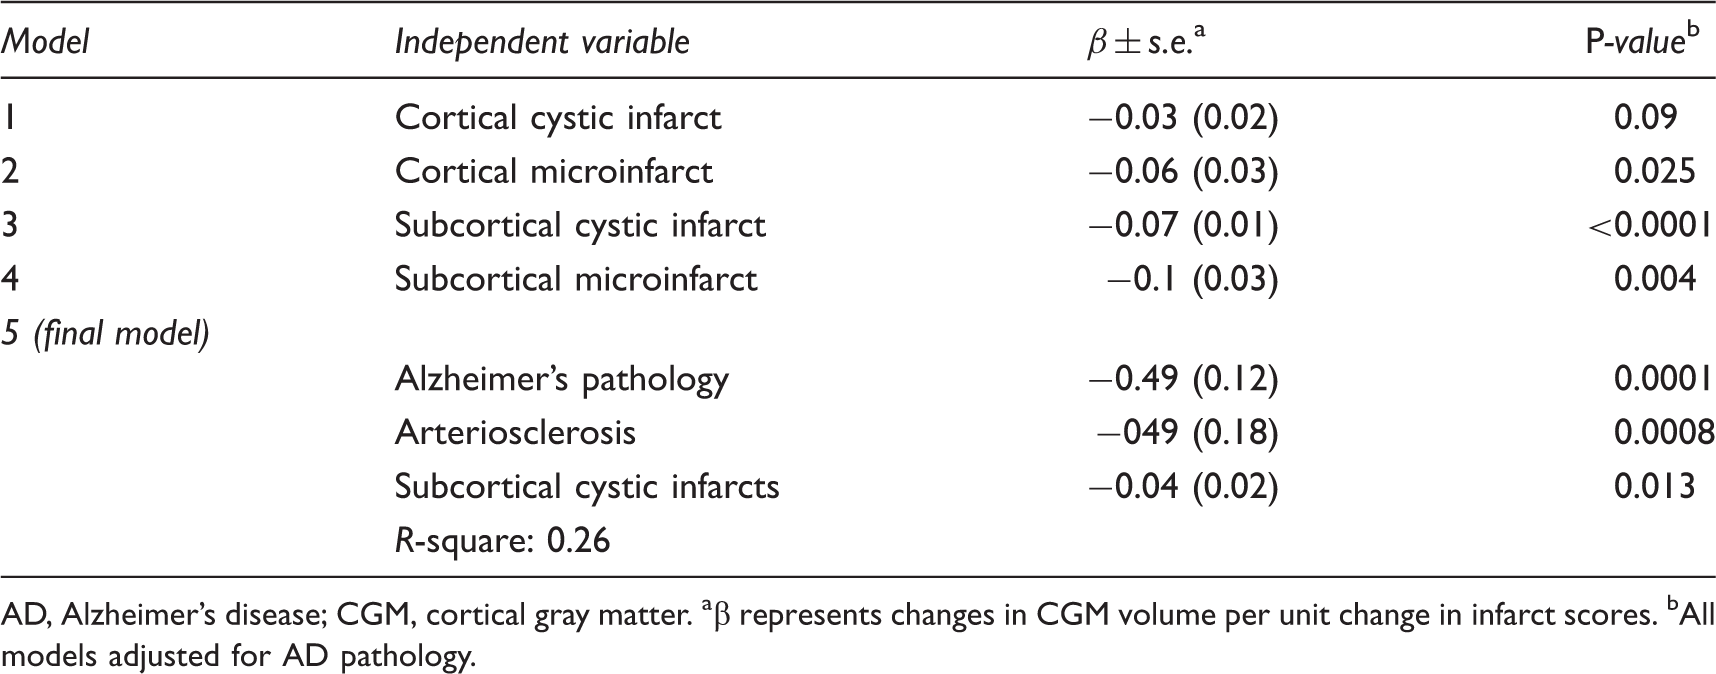
AD, Alzheimer’s disease; CGM, cortical gray matter.
β represents changes in CGM volume per unit change in infarct scores.
All models adjusted for AD pathology.
The severity of AS was strongly inversely associated with CGM (Spearman r = −0.29, P = 0.001). In the final multivariate model (Table 2), AD-PATH, AS, and subcortical cystic infarcts were independently inversely correlated with CGM atrophy and explained 26% of the variance in CGM. Addition of cerebral amyloid angiopathy and apoE genotype to the multivariate model did not alter these findings (data not shown). To illustrate this further, a sequential modeling approach showing the incremental explanatory power added by each variable is presented in Figure 2.
Percent of variance explained in sequential modeling approach (N = 116). AD, Alzheimer’s disease.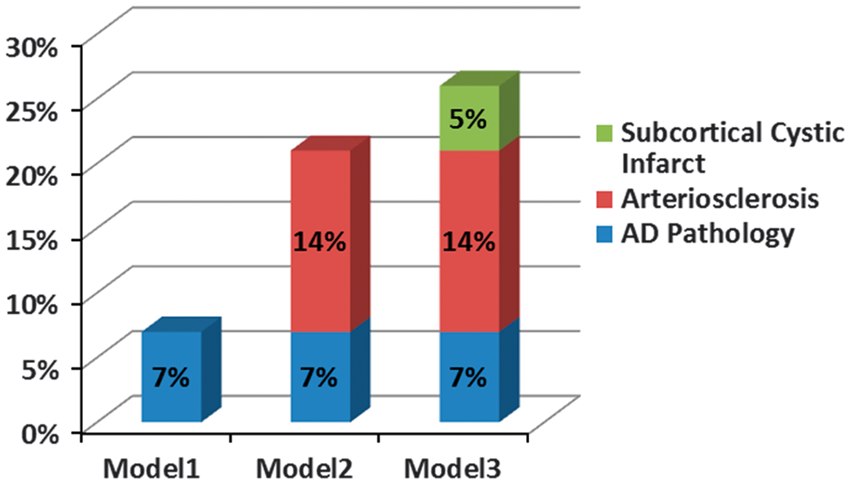
Path Analyses Between Pathologic Measures of Cerebrovascular Disease and Alzheimer’s Disease, Cortical Gray Matter and Hippocampal Volume, and Global Cognition
Figure 3 illustrates the correlations between pathologic measures and GLOB and to what extent these associations were mediated through CGM, after controlling for age at death and years of education. The sample size in path analysis was smaller than 116 due to missing cognitive scores in some subjects. The standardized beta by each single-headed arrow represents a path coefficient for a direct effect in a particular direction; the standardized beta by each double-headed arrow represents a standardized correlation coefficient without direction. Arteriosclerosis and AD-PATH were not correlated (standardized β = −0.04, s.e. = 0.10, P = 0.69). Subcortical cystic infarcts were positively correlated with AS (β = 0.53, s.e. = 0.07, P < 0.0001), and inversely correlated with AD-PATH (β = −0.21, s.e. = 0.09, P = 0.02).
Path analysis between pathologic measures of cerebrovascular disease (CVD) and Alzheimer’s disease (AD), cortical gray matter (CGM) and hippocampal volume (HV), and global cognition (GLOB) (N = 110). The standardized beta (standard error) by each single-headed arrow represents a path coefficient for a direct effect in the designated direction; the standardized beta (standard error) by each double-headed arrow represents a standardized correlation coefficient without direction. A black line denotes a direct effect path. A blue line denotes an indirect effect path. In (a), the total effect of AD-PATH on GLOB (β = −0.57, s.e. = 0.06, P < 0.0001) was stronger than that of arteriosclerosis (AS) (β = −0.20, s.e. = 0.09, P = 0.03). The total effect of subcortical cystic infarcts on GLOB (β = −0.03, s.e. = 0.09, P = 0.74) was not significant and was much smaller in magnitude. In (b), the total effect of AD-PATH on GLOB (β = −0.62, s.e. = 0.06, P < 0.0001) was stronger than that of AS (β = −0.11, s.e. = 0.09, P = 0.21). The total effect of subcortical cystic infarcts on GLOB (β = −0.02, s.e. = 0.09, P = 0.81) was not significant and was much smaller in magnitude. *P < 0.05; **P < 0.01; ***P < 0.0001.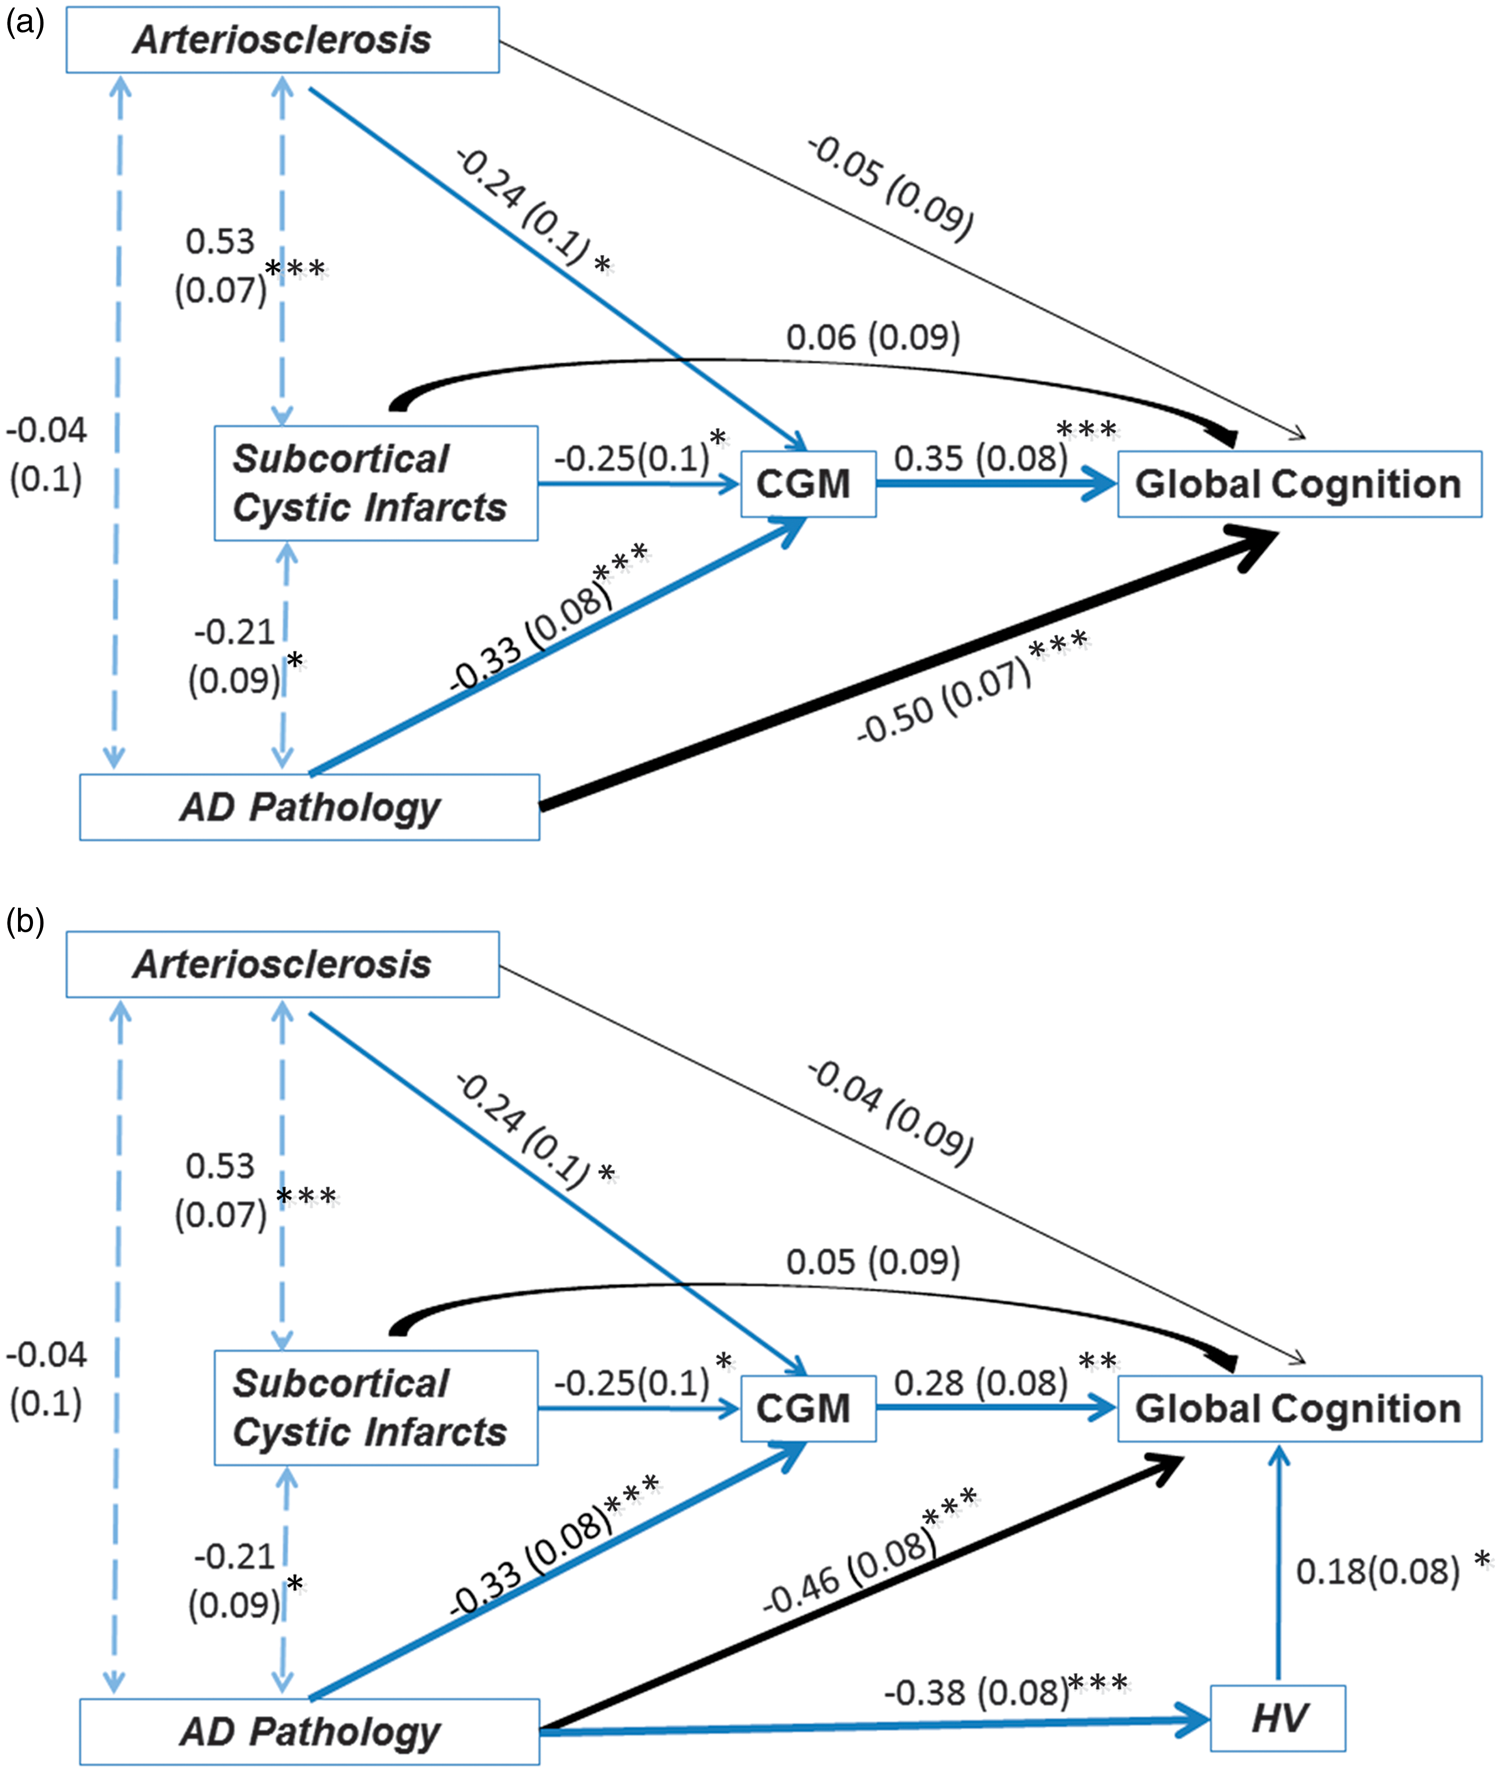
The indirect effect of AS on GLOB via CGM volume (β = −0.13, s.e. = 0.04, P = 0.002) was 2.6 times that of the direct effect (β = −0.05, s.e. = 0.09, P = 0.58). Whereas the indirect effect of AD-PATH on GLOB via CGM volume was about one-fifth that of the direct effect; both path coefficients were statistically significant (β = −0.09, s.e. = 0.03, P = 0.007 and β = −0.51, s.e. = 0.07, P < 0.0001, respectively). The total effect of AD-PATH on GLOB (β = −0.61, s.e. = 0.06, P < 0.0001) was four times stronger than that of AS (β = −0.15, s.e. = 0.08, P = 0.048). The total effect of subcortical cystic infarcts on GLOB (β = −0.03, s.e. = 0.09, P = 0.73) was not significant and was much smaller in magnitude. These results were not altered significantly after adding HV in the path model. The direct effect of AD-PATH on GLOB remained statistically significant (β = −0.46, s.e. = 0.08, P < 0.0001).
Path Analyses Between Pathologic Measures of Cerebrovascular Disease and Alzheimer’s Disease, Cortical Gray Matter and Hippocampal Volume, and Verbal Memory
The indirect effect of AS on MEM via CGM volume (β = −0.06, s.e. = 0.04, P = 0.11) was similar in magnitude to the direct effect (β = −0.08, s.e. = 0.11, P = 0.44) (Figure 4A). The indirect effect of AD-PATH on MEM via CGM volume (β = −0.06, s.e. = 0.03, P = 0.07) was about one-ninth that of the direct effect (β = −0.53, s.e. = 0.08, P < 0.0001). The total effect of AD-PATH on MEM (β = −0.60, s.e. = 0.07, P < 0.0001) was stronger than that of AS (β = −0.14, s.e. = 0.11, P = 0.19) and subcortical cystic infarcts (β = −0.09, s.e. = 0.11, P = 0.40). After adding HV in the path model above, the indirect path via CGM was no longer significant (from β = 0.22, s.e. = 0.10, P = 0.03 to β = 0.06, s.e. = 0.09, P = 0.50) (Figure 4B). The direct effect of AD-PATH on MEM remained statistically significant (β = −0.43, s.e. = 0.08, P < 0.0001) even though HV was positively correlated with MEM as expected (β = −0.41, s.e. = 0.08, P < 0.0001).
Path analysis between pathologic measures of cerebrovascular disease (CVD) and Alzheimer’s disease (AD), cortical gray matter (CGM) and hippocampal volume (HV), and verbal memory (MEM) (N = 86). In (a), the total effect of AD-PATH on MEM (β = −0.57, s.e. = 0.07, P < 0.0001) was stronger than that of arteriosclerosis (AS) (β = −0.17, s.e. = 0.09, P = 0.04). The total effect of subcortical cystic infarcts on MEM (β = −0.08, s.e. = 0.11, P = 0.49) was not significant and was smaller in magnitude. In (b), the total effect of AD-PATH on MEM (β = −0.60, s.e. = 0.07, P < 0.0001) was stronger than that of AS (β = −0.07, s.e. = 0.09, P = 0.44). The total effect of subcortical cystic infarcts on MEM (β = −0.05, s.e. = 0.10, P = 0.59) was not significant and was smaller in magnitude (see Figure 3 for complete legend).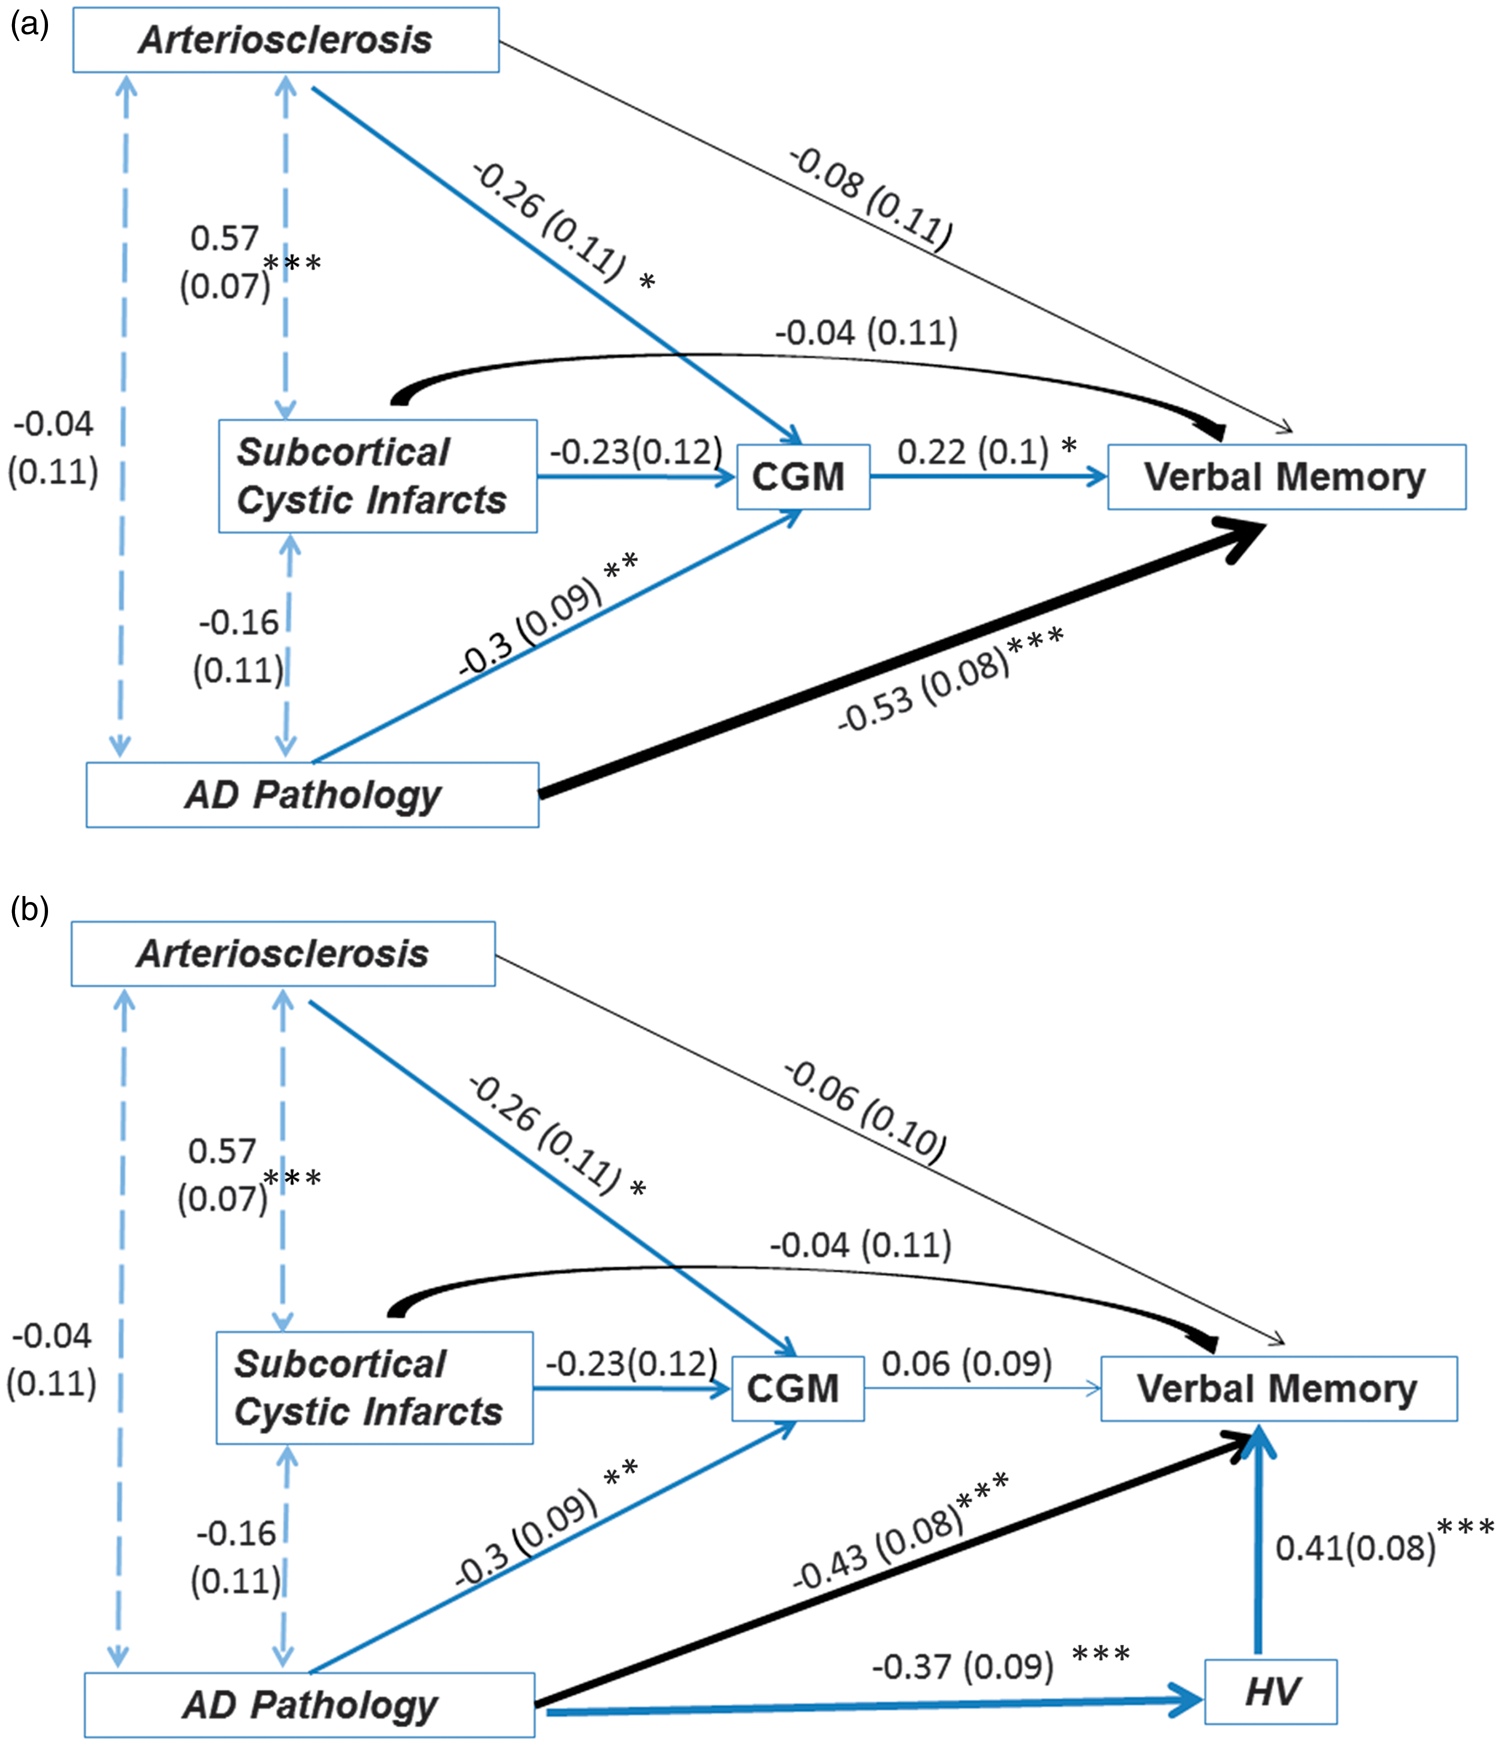
Path Analyses Between Pathological Measures of Cerebrovascular Disease and Alzheimer’s Disease, Cortical Gray Matter and Hippocampal Volume, and Executive Function
The indirect effect of AS on EXEC via CGM volume (β = −0.10, s.e. = 0.05, P = 0.05) was similar as the direct effect (β = −0.08, s.e. = 0.12, P = 0.52) (Figure 5). The indirect effect of AD-PATH on EXEC via CGM volume was about one-third that of the direct effect and both path coefficients were statistically significant (β = −0.09, s.e. = 0.04, P = 0.03 and β = −0.29, s.e. = 10, P = 0.003, respectively). The total effect of AD-PATH on EXEC (β = −0.38, s.e. = 0.10, P < 0.0001) was stronger than that of AS (β = −0.18, s.e. = 0.12, P = 0.14). The total effect of subcortical cystic infarcts on EXEC (β = −0.07, s.e. = 0.12, P = 0.56) was not significant and was smaller in magnitude. These results were not altered significantly after adding HV in the path model above. The direct effect of AD-PATH on EXEC remained statistically significant (β = −0.26, s.e. = 0.11, P = 0.01).
Path analysis between pathologic measures of cerebrovascular disease (CVD) and Alzheimer’s disease (AD), cortical gray matter (CGM) and hippocampal volume (HV), and executive function (EXEC) (N = 81). In (a), the total effect of AD-PATH on EXEC (β = −0.35, s.e. = 0.10, P = 0.0003) was stronger than that of AS (β = −0.24, s.e. = 0.10, P = 0.02). The total effect of subcortical cystic infarcts on EXEC (β = −0.09, s.e. = 0.13, P = 0.49) was not significant and was smaller in magnitude. In (b), the total effect of AD-PATH on EXEC (β = −0.39, s.e. = 0.10, P < 0.0001) was stronger than that of AS (β = −0.16, s.e = 0.12, P = 0.18). The total effect of subcortical cystic infarcts on EXEC (β = −0.06, s.e. = 0.12, P = 0.60) was not significant and was smaller in magnitude (see Figure 3 for complete legend).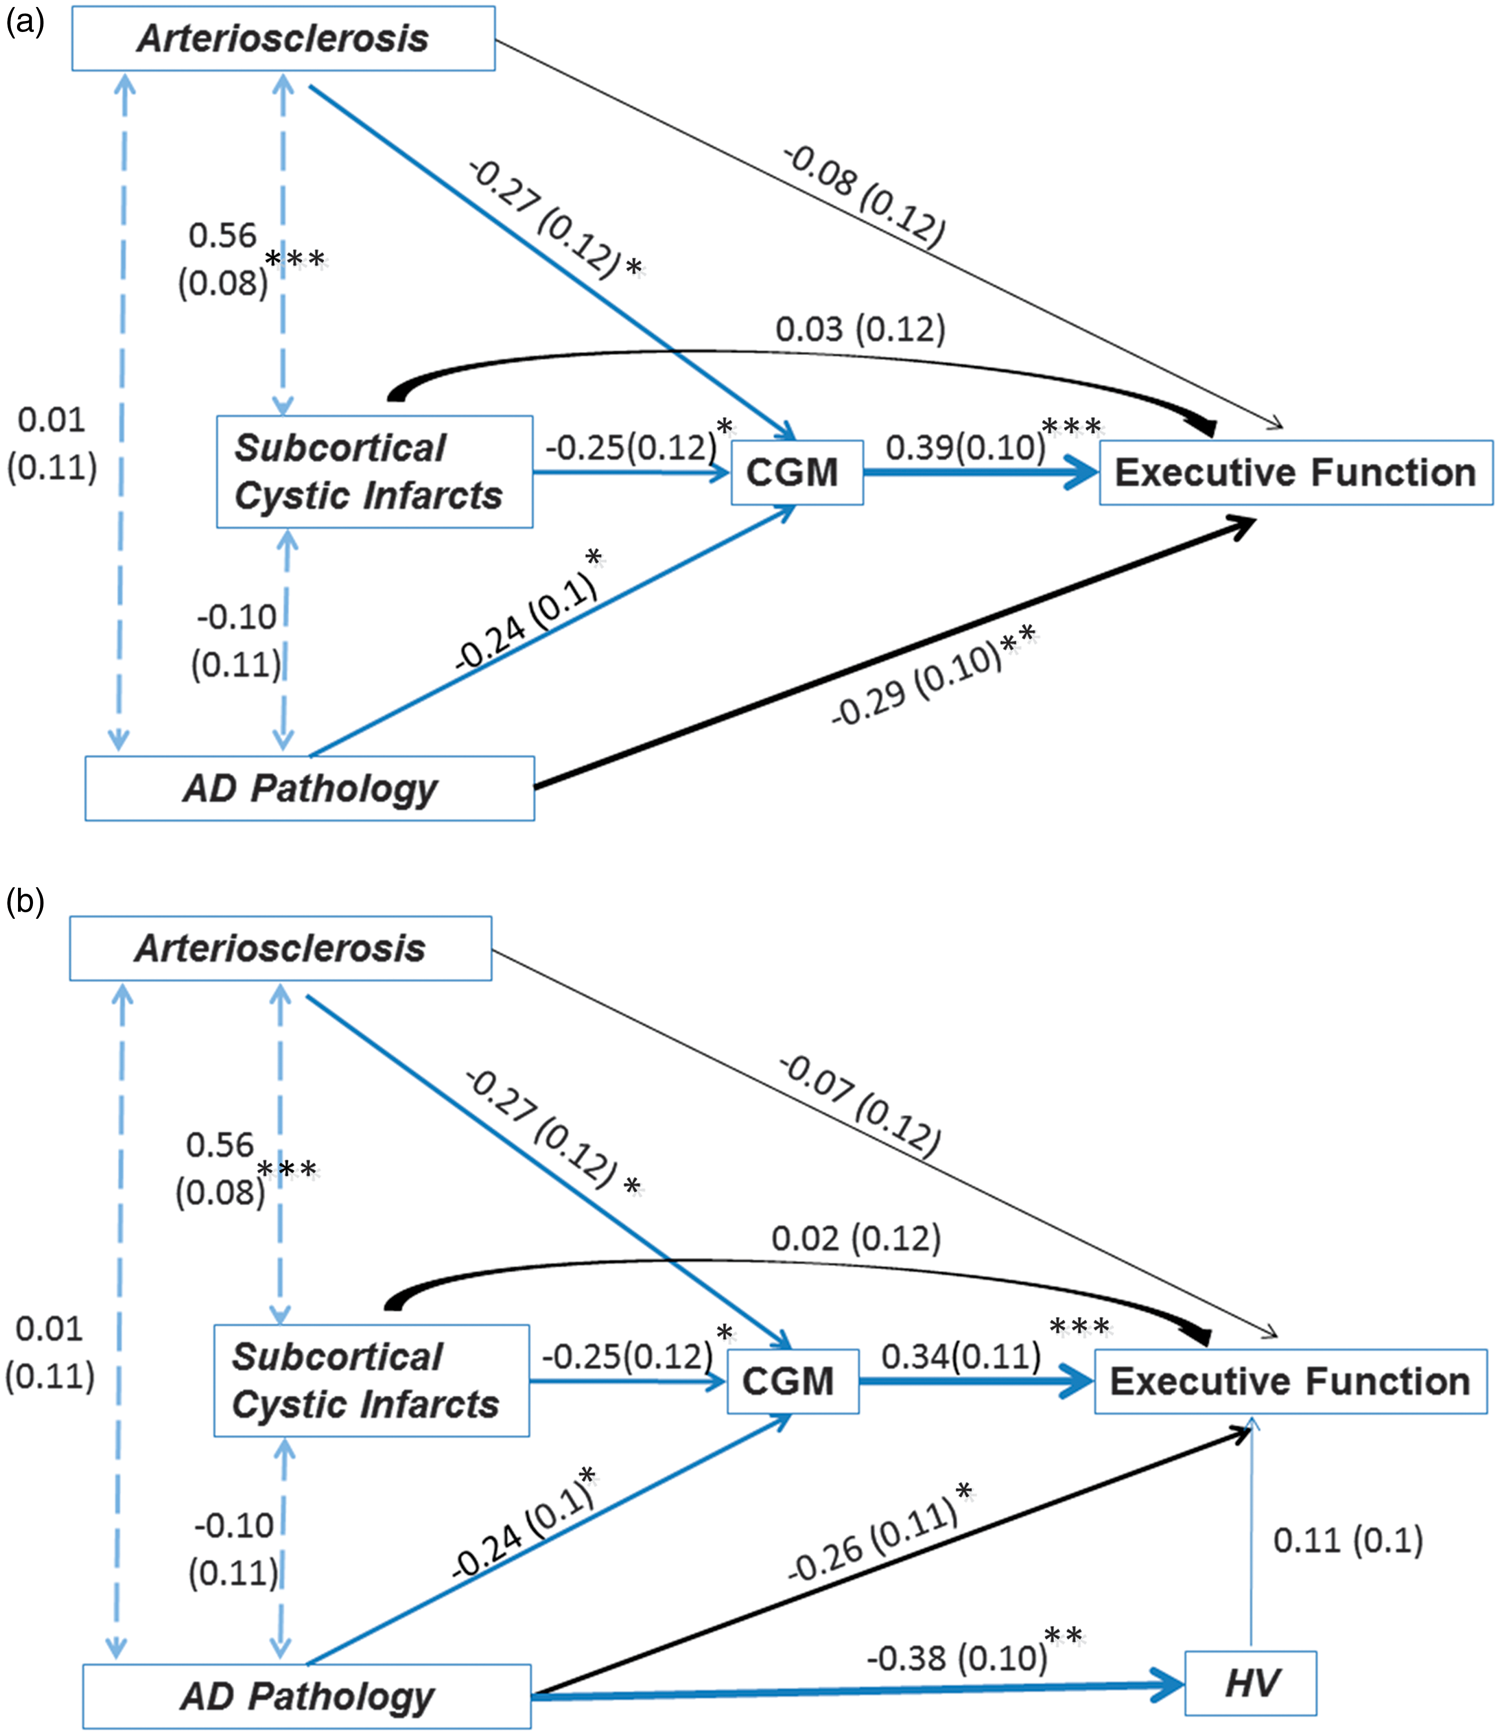
Discussion
As reported previously, in this expanded elderly autopsy sample enriched for cases with SIVD and AD, we found that AS, Alzheimer pathology (AD-PATH), and subcortical cystic infarcts contribute independently to CGM atrophy. 13 In the present study, we applied path analyses to determine the relative strengths of associations between these pathologic lesions and cognitive impairment, mediated by CGM. In contrast to regression analysis, path analysis yields standardized path coefficients that enable direct comparisons among different pathways. Whereas cortical atrophy appears to be the predominant pathway mediating AS-PATH effects on cognition, the effects of AD-PATH appear to act not only through CGM atrophy, but also via a ‘direct’ pathway that was not measured in this study. The effect size of this direct pathway was not significantly mitigated when HV was forced into the pathway model, even while the expected pathway between HV and memory loss was confirmed (Figure 4B).
In a clinical setting, differentiation between SIVD and AD to guide pharmacological treatment and other interventions has been a persistent challenge. We report a strong and novel differential path-structure-function effect of SIVD and AD on cortical atrophy and cognition. Among typical structural MRI measures, CGM was the strongest correlate of cognition in our sample. 12 Since AS, AD-PATH, and subcortical cystic infarcts independently contribute to CGM atrophy, we hypothesized that pathologic changes in the brain may lead to cognitive decline via changes in MR measures of brain structure. The path analysis approach allowed us to deconstruct the various factors affecting brain atrophy into direct effects and indirect effects on cognition.
Our current findings underscore that vascular disease can affect cognition not only through effects on subcortical structures and white matter, but also by exacerbating cortical atrophy. Atrophy could occur through secondary deafferentation and degeneration of the overlying cortex (e.g., retrograde or Wallerian degeneration), or possibly through primary subclinical cortical ischemia associated with widespread AS. A prospective longitudinal study including in vivo measures of AS, ischemic brain injury, diffusion tensor imaging of white-matter tracts and cortical thickness could help to address the sequence and relative importance of these possibilities.
The path analyses delineated at least two distinct pathways between Alzheimer pathology and cognitive impairment, one represented by cortical atrophy and another by a latent variable not measured in this study. Potential latent variables could be related to synaptic changes (e.g., structural, chemical, or physiologic) that antedate loss of cortical volume. For example, in preclinical and predementia stages of AD (defined by amyloid accumulation on PiB PET scans), decreases in cerebral glucose metabolism (CMRglu) exceed brain atrophy. 26 In AD, decreases in CMRglu have been attributed to decreased synaptic function, which normally accounts for the greatest rates of oxidative phosphorylation. 27 Although animal models of AD show toxicity of oligomeric β-amyloid 28 and tau 29 on synaptic function, it is difficult to directly assess in vivo synaptic structure and function in human beings with AD.
We repeated the path analysis for MEM and EXEC, subdomains of GLOB. The indirect effect of AS on cognition was greater for EXEC (β = −0.09, s.e. = 0.05, P = 0.06), GLOB (β = −0.07, s.e. = 0.03, P = 0.04) than MEM (β = −0.01, s.e. = 0.02, P = 0.54). Whereas the indirect effect of AD on cognition was greater for GLOB (β = −0.46, s.e. = 0.08, P < 0.0001), and MEM (β = −0.43, s.e. = 0.08, P < 0.0001), and weaker for EXEC (β = −0.26, s.e. = 0.11, P = 0.01). The total direct and indirect effects of AD on cognition were greater for GLOB (β = −0.62, s.e. = 0.06, P < 0.0001), and for MEM (β = −0.60, s.e. = 0.07, P < 0.0001), and weaker for EXEC (β = −0.39, s.e. = 0.10, P < 0.0001). The relative strengths of these neuropsychological associations for AS and AD are consistent with the literature.6,30,31
We were unable to confirm previous controversial associations between atherosclerosis and AD pathology (i.e., neuritic plaques and neurofibrillary tangles). 32 Several cross-sectional autopsy studies reported associations between atherosclerosis and AD pathology among cases drawn from AD brain banks.33,34,35,36 However, three autopsy studies drawn from non-dementia settings did not show associations between atherosclerosis and AD pathology.37,38,39 In our sample enriched for cases with SIVD and AD, we also found no correlations between AS and AD-PATH. 40 The inconsistency of finding may be related to differences in sample selection and the distribution of atherosclerosis in the comparison groups (for review, see Chui et al.). 32
The major strengths of this study were the inclusion of a broad spectrum of subjects with both SIVD and AD, as well as cognitively unimpaired elderly, together with a standardized neuropathologic assessment of the brain parenchyma (neurofibrillary tangles, neuritic plaques, or infarcts) and quantitative MRI measures closest to death. Most importantly, we employed path analysis to help disentangle the various processes underlying brain atrophy and cognitive decline. Standardized path coefficients allowed us to compare the relative magnitude of the effects of AS and AD-PATH in direct and indirect pathways. Limitations of our study included (1) the use of semiquantitative measures to rate severity of vascular pathology; (2) MRI measures were obtained closest to autopsy, but this was often an interval of several years. Changes in pathology during this period would weaken MR-pathology correlations. Notably, however, there was no statistically significant difference in the time interval between last MRI and death across the five pathologic groups.
Footnotes
Funding
The author(s) disclosed receipt of the following financial support for the research, authorship, and/or publication of this article: This research was supported in part by NIA Grants P01 AG12435, P50 AG05142, and P50 AG16570 (HVV).
Acknowledgement
The authors thank other investigators in the IVD program project (Bruce R Reed, Joel H Kramer, Dan Mungas, William G Ellis, Chris Zarow) for their contributions.
Declaration of conflicting interests
The author(s) declared no potential conflicts of interest with respect to the research, authorship, and/or publication of this article.
Authors’ contributions
LZ, WJM, HCC, and HVV contributed to study design. HVV, MW, LZ, WJM, and HCC contributed to data acquisition. LZ, WJM, HCC, and HVV contributed to data analysis and interpretation. LZ, WJM, HCC, HVV, and MW contributed to preparation of manuscript.