
Abstract
Type 2 diabetes (T2DM) patients develop vascular complications and have increased risk for neurophysiological impairment. Vascular pathophysiology may alter the blood flow regulation in cerebral microvasculature, affecting neurovascular coupling. Reduced fMRI signal can result from decreased neuronal activation or disrupted neurovascular coupling. The uncertainty about pathophysiological mechanisms (neurodegenerative, vascular, or both) underlying brain function impairments remains. In this cross-sectional study, we investigated if the hemodynamic response function (HRF) in lesion-free brains of patients is altered by measuring BOLD (Blood Oxygenation Level-Dependent) response to visual motion stimuli. We used a standard block design to examine the BOLD response and an event-related deconvolution approach. Importantly, the latter allowed for the first time to directly extract the true shape of HRF without any assumption and probe neurovascular coupling, using performance-matched stimuli. We discovered a change in HRF in early stages of diabetes. T2DM patients show significantly different fMRI response profiles. Our visual paradigm therefore demonstrated impaired neurovascular coupling in intact brain tissue. This implies that functional studies in T2DM require the definition of HRF, only achievable with deconvolution in event-related experiments. Further investigation of the mechanisms underlying impaired neurovascular coupling is needed to understand and potentially prevent the progression of brain function decrements in diabetes.
INTRODUCTION
Type 2 diabetes mellitus (T2DM) seems to be associated with increased risk for brain function loss and long-term cognitive impairment, which are well documented in verbal and visual memory domains, information processing speed, and executive functioning.1–3 It is crucial to understand the neurobiological correlates of early brain dysfunction in T2DM to develop preventive interventions.1,3
The majority of the studies investigated structural differences in the brain of T2DM patients and revealed a consistent finding of atrophy,1,3 particularly in cortical and subcortical gray matter4–6 but the association between sensory, cognitive deficits and brain structure is still poorly understood, in particular at early stages of the disease, when there are no evident structural lesions.1,4,6
Concerning functional studies, results are not as consistent. 3 There are reports of changed cerebral blood flow in T2DM patients, 3 although a study with a larger sample found no significant differences when accounting for brain volume. 7 Recent studies examined the relation of cognition, brain volume, or white matter alterations with both cerebral blood flow and cerebrovascular reactivity and found no significant relationships.8,9 Notably, a number of functional magnetic resonance imaging (fMRI) studies relied on BOLD (Blood Oxygenation Level-Dependent) signal 10 to indirectly measure neuronal activity and investigate neurophysiological impairment. Studies addressing resting-state fMRI found reduced functional connectivity between several regions of the ‘default mode network’ in T2DM patients, which has been related to impaired episodic memory processing in older participants. 11 In previous studies the relation between brain activity and performance impairment was either not tested 12 or reductions in connectivity between default mode regions were not performance related. 13 A recent study reported distributed activity changes in T2DM patients, including the temporal gyrus, in which activity was negatively correlated with executive functioning, suggesting a joint effect of structural and functional alterations. 14 A later study, however, reported abnormal resting-state brain activity in the absence of structural differences in T2DM, which was associated with cognitive impairment. 15
The uncertainty about pathophysiological mechanisms underlying behavioral impairments and brain dysfunction remains. They could be neurodegenerative, vascular, or a combination of both. It should be noted that the measure of neuronal activity relies on neurovascular coupling, which can be altered in the presence of cerebrovascular disease. Attenuated BOLD responses may be caused by impaired vascular reactivity and not by impaired neuronal activity.
The vascular response triggered by neuronal activation—the so-called hemodynamic response function or HRF—elicits variations in the BOLD signal as measured in fMRI. 16 An important pathophysiological mechanism in T2DM might be the early alteration of the blood flow autoregulation (the intrinsic ability of the brain vascular bed to functionally maintain its needed supply) in cerebral microvasculature, reflecting impaired neurovascular coupling and altered HRF. In patients with stroke it has been shown that the HRF can be altered, which may result in misinterpretation or underestimation of fMRI signal.17,18 The only way to disentangle vascular from neural impairment-driven changes in the BOLD response is to also use stimuli that are performance matched, thereby using similar neural and cognitive resources.
To elucidate the disruption of neurovascular coupling the use of event-related designs is crucial, as it allows to extract by deconvolution the real hemodynamic response to a single stimulus event, without any assumption (see the study by Dale and Buckner 19 for a detailed explanation).
We therefore queried whether T2DM patients present an HRF that is different from the canonical one. Unlike previous studies, which emphasized the experimental block design, here we used for the first time an event-related approach, which is the only one that can directly tackle this question. If the hemodynamic regulation is affected in the brain of T2DM patients as directly measured at the event level it could be the basis for findings of no activation or underactivation at the more macroscopic block level. This could provide support for the interpretation of neurovascular coupling changes expressed in the fMRI signal changes and their relation to behavioral measurements. We examined the HRF in the human brain by using both a block and an event-related experimental design to investigate the BOLD response to a visual speed discrimination task in the whole brain and specifically in three regions-of-interest (ROIs). One of the regions, hMT+/V5, was selected independently of the task as it is one of the visual brain regions that can be most reliably localized owing to its well established motion selectivity.20–22 Furthermore, we investigated two other regions that were significantly activated during this type of task: the insula, known for its role in perceptual decision mechanisms, and the inferior frontal gyrus, which plays a role in executive functioning. We discovered a significant difference in the HRF of T2DM patients, reflecting impaired neurovascular coupling and altered fMRI response amplitudes in all investigated brain areas. An important implication of these results is the requirement of event-related deconvolution approaches in fMRI studies in T2DM (and other vascular diseases). Standard block designs cannot extract the true HRF and may mask the findings and interpretation of true differences in brain responses.
MATERIALS AND METHODS
Participants
We recruited 121 participants (70 controls and 51 T2DM). An expert neuroradiologist had access to both standard clinical 2D-FLAIR and 3D-SPACE T2-weighted images to perform the neuroradiological assessment of all participants and examine for the presence of white matter hyper intensities. We excluded participants with vascular or structural lesions or any changes that could confound our results. After applying exclusion criteria, we could select 51 T2DM participants (30 male (M) and 21 female (F)) and 29 age-matched controls (14M, 15 F). Table 1 details the participants' demographic and clinical data. In this cross-sectional study participants had normal or corrected to normal vision (as further confirmed by fundus photography and optical coherence tomography) and no history of neurological or psychiatric disease.
Characteristics of study participants
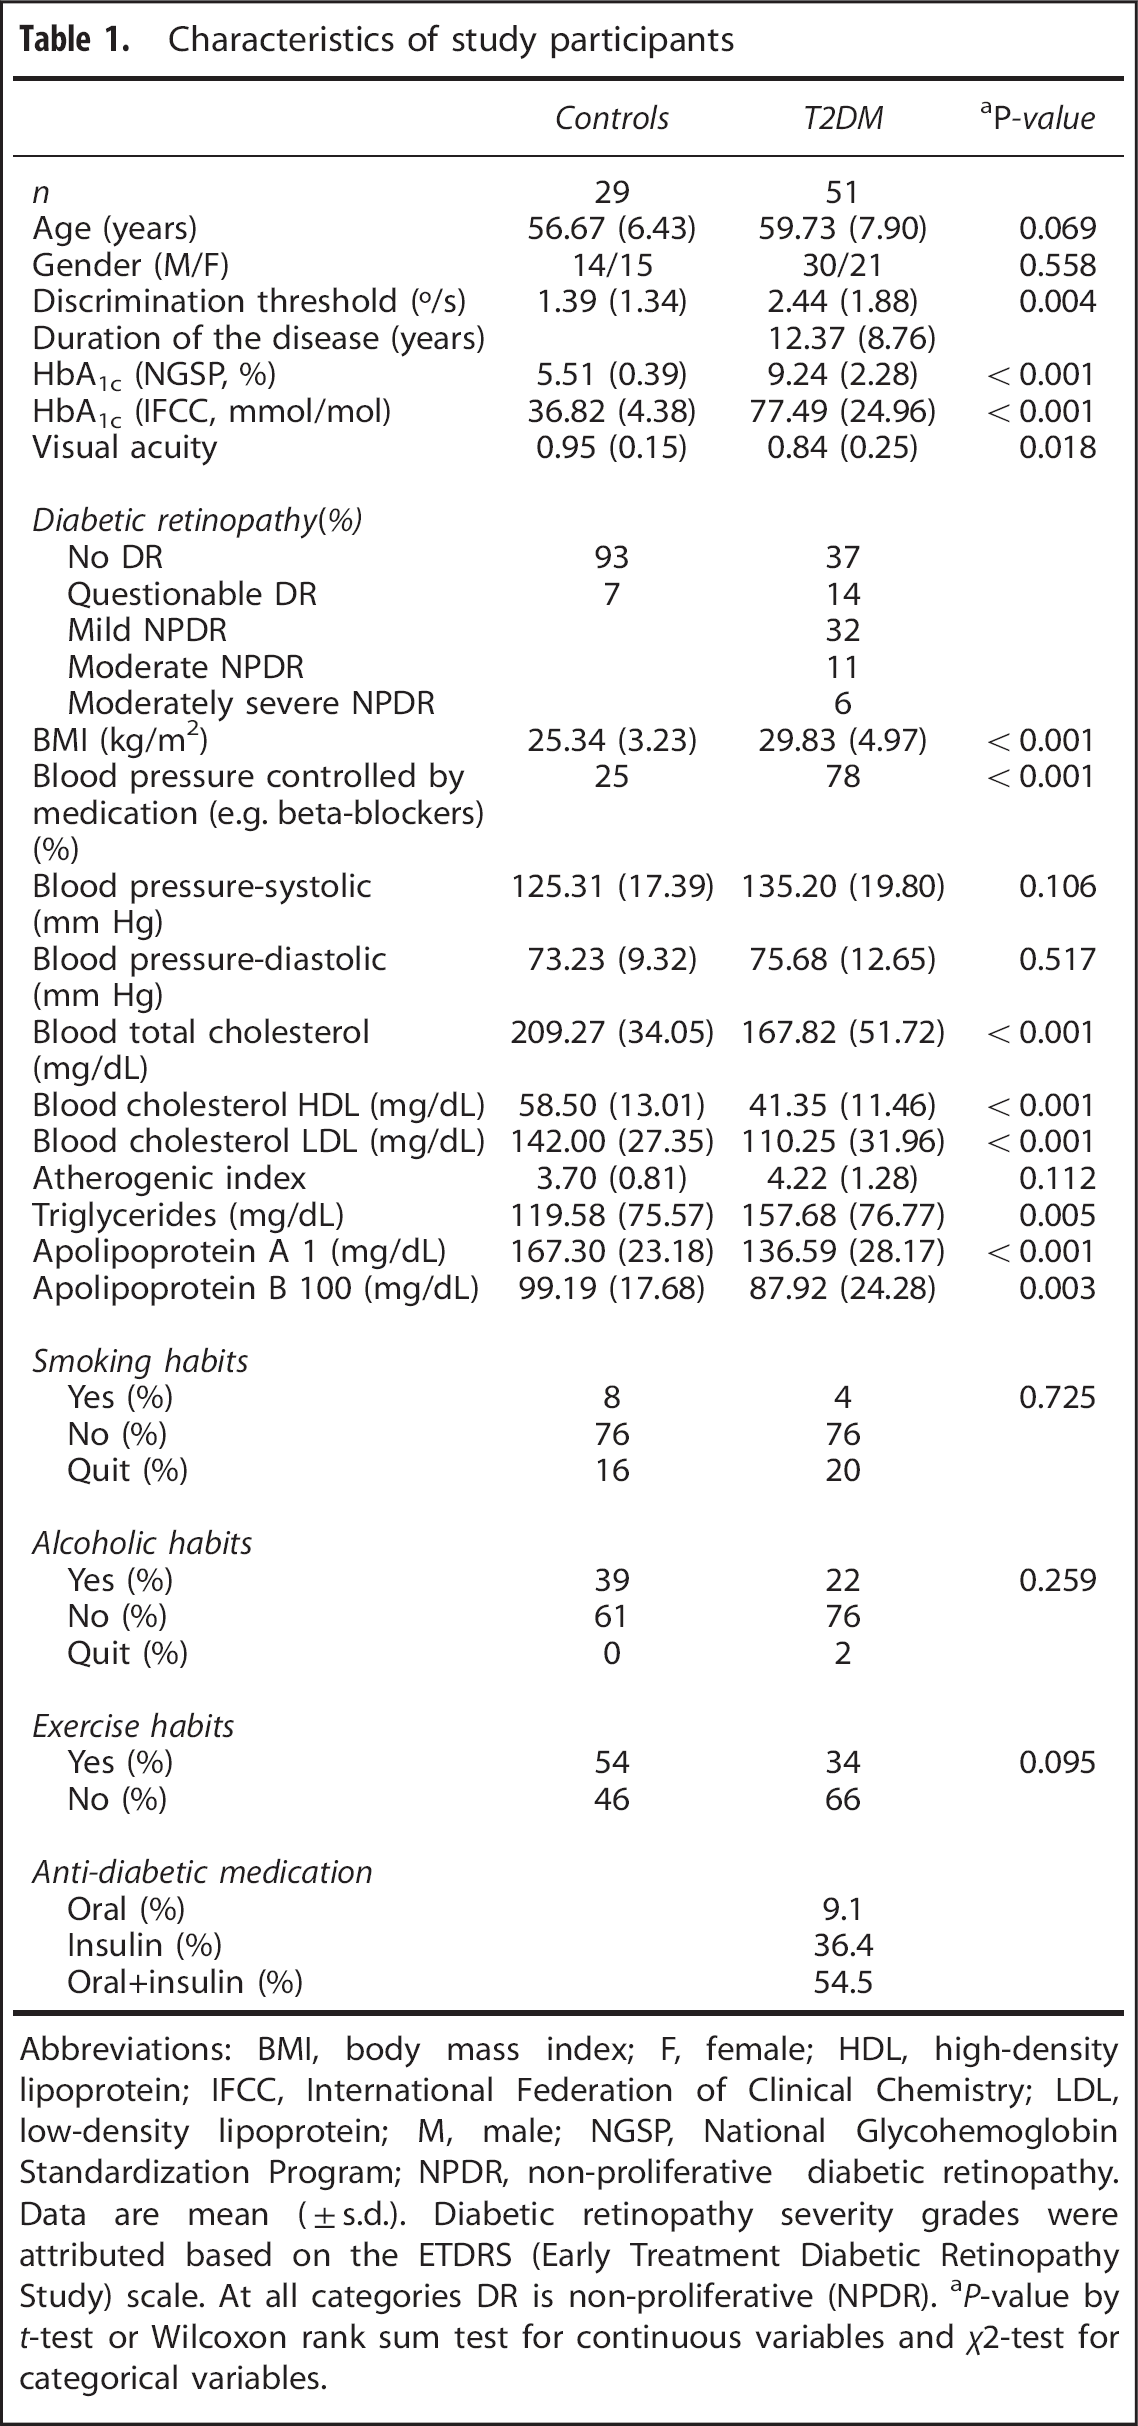
Abbreviations: BMI, body mass index; F, female; HDL, high-density lipoprotein; IFCC, International Federation of Clinical Chemistry; LDL, low-density lipoprotein; M, male; NGSP, National Glycohemoglobin Standardization Program; NPDR, non-proliferative diabetic retinopathy. Data are mean (± s.d.). Diabetic retinopathy severity grades were attributed based on the ETDRS (Early Treatment Diabetic Retinopathy Study) scale. At all categories DR is non-proliferative (NPDR).
P-value by t-test or Wilcoxon rank sum test for continuous variables and X 2-test for categorical variables.
T2DM patients were diagnosed in the Endocrinology Department of the University of Coimbra Hospital using standard WHO criteria,23,24 including the recent recommendation of a cutoff point of 6.5% for HbA1c (in addition to the criteria based on fasting plasma or tolerance test glucose levels), and were recruited among the T2DM clinical population of this Department. Inclusion criteria for patient group: (1) age between 40 and 75 years; (2) T2DM for at least 1 year before the commencement of this study; (3) informed consent. Matched controls were recruited from the general population of the Hospital or University staff as follows. Inclusion criteria for control group: (1) age between 40 and 75 years; (2 and 3) T2DM diagnosis excluded based on levels of glycated hemoglobin (HbA1c) and fasting glucose; (4) informed consent. The diagnosis and the severity of diabetic retinopathy were carried by expert hospital professionals, based on a technical report after the guidelines of the Early Treatment Diabetic Retinopathy Study. For each participant, ocular dominance was determined using the hole-in-the-card test (Dolman method). Hand dominance was ascertained using the Edinburgh inventory.
All participants provided informed written consent. The Helsinki Declaration of 1975 (and as revised in 1983) guidelines were followed throughout the study. The Ethics Committee of the Faculty of Medicine of the University of Coimbra approved all experimental procedures.
Stimulus Presentation and Apparatus
We wrote our experiments in MATLAB, using the Psychophysics Toolbox extensions (David Brainard and Denis Pelli, http://www.psychtoolbox.org). Stimuli were projected by means of an LCD projector (Avotec Real Eye Silent Vision 6011, resolution 1,024×768, 60 Hz refresh rate - Avotec Incorporated, Stuart, FL, USA) onto a screen pad positioned in the bore at a distance of 163 cm from the projector (image size in the screen pad 22.62° × 17.06°; mirror distance from screen, 50 cm). Stimuli were viewed monocularly with the dominant eye while the other eye was covered with an opaque eye patch.
Psychophysics
The psychophysical task (performed inside the scanner to select stimulus levels) consisted on a two-alternative forced choice test aimed to determine a speed discrimination threshold by comparing the speed of two white dots, a reference dot, and a target dot with mean luminance 22.9 cd/m 2 , moving on a gray background with mean luminance 9.39 cd/m 2 . The dots composing each trial were randomly presented one in each visual hemi-field simultaneously for 400 milliseconds at an eccentricity of 7.5° along the horizontal meridian, with each dot moving back and forth along a path of 2 visual degrees with a pseudo-random linear trajectory (between 0 and 180°). Dot size was 0.22° × 0.22° and fixation cross-size was 0.33° × 0.33°. The subject reported which dot moved faster by means of a button press with a Cedrus Lumina LP-400, LU400 PAIR response box (Cedrus Corporation, San Pedro, CA, USA). The speed of the target dot of the successive trials was determined using a descending logarithmic staircase, which determined the number of trials and allowed the estimation of the discrimination threshold. The staircase had six reversals (two practice/four experimental). It allowed to compute speeds from 24°/s (initial target speed) to 5°/s (reference speed) using a step value that ranged from 1 to 0.05 dB. The speed discrimination threshold was then estimated using the mean of the last four reversals.
Stimuli and Functional Magnetic Resonance Imaging Tasks
Each participant performed three experimental runs: two presenting the stimuli in blocks and one in an event-related design. All participants were presented with the same randomized sequences. Both block and event-related designs are represented in Figure 1. The stimuli characteristics were the same as in the psychophysical task, except the duration.
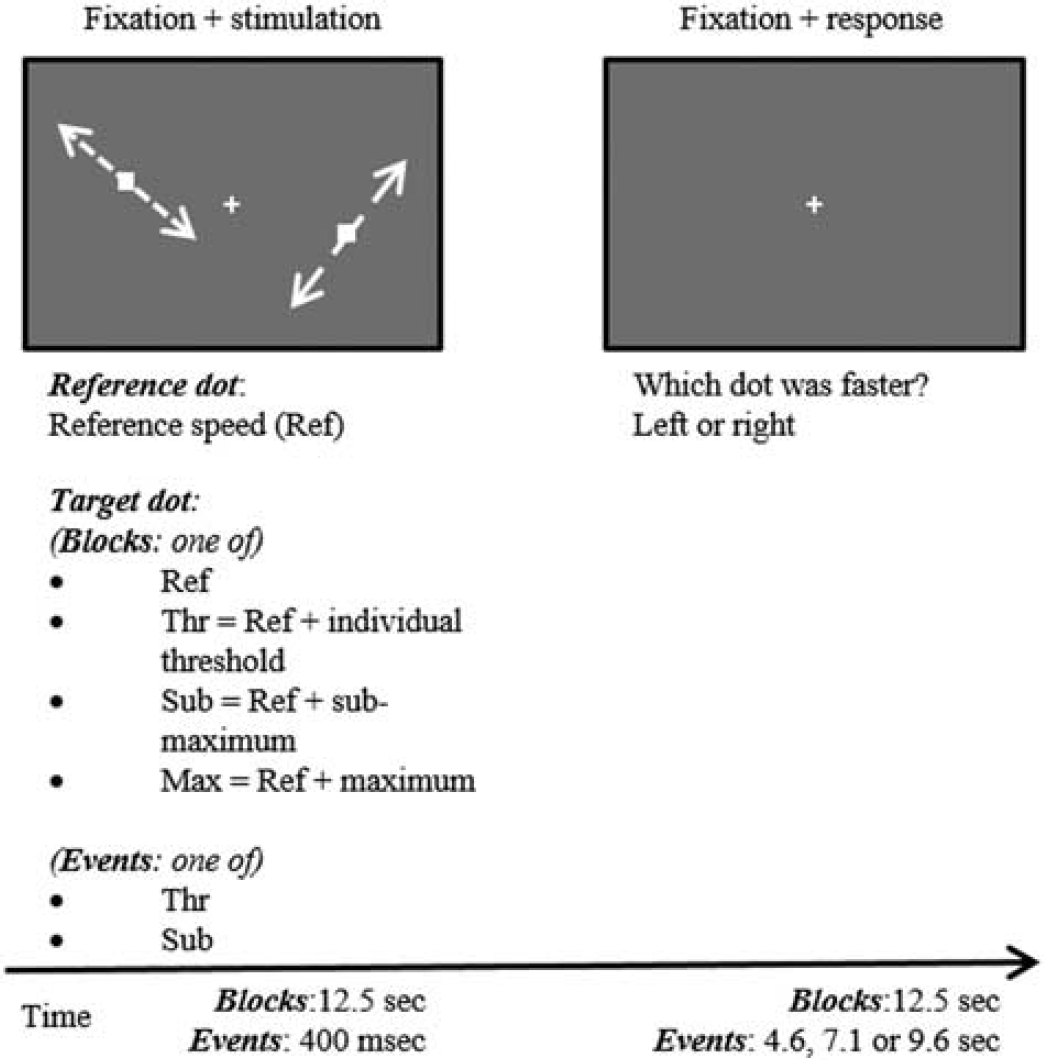
Graphical representation of the stimuli and experimental protocols of block and event-related designs (for details see Materials and Methods).
In the block design runs the reference dot always moved at 5°/s and the target dot moved with one of four different values: the reference speed (reference condition), the reference speed incremented of the individual threshold of discrimination (threshold condition), the reference speed incremented of three times the previous threshold (sub-maximum condition), and an arbitrarily defined high speed value of 20°/s (maximum condition). The reference condition was presented two times (both visual hemi-fields with the dot moving with the reference speed). Each of the three remaining conditions was repeated four times with the faster dot appearing two times in each visual hemi-field. This yields 29 blocks of alternated visual stimulation (14 blocks of 12.5 seconds each) and baseline fixation (15 blocks of 12.5 seconds each). In the event design stimulation paradigm, the alternation between stimulation and baseline fixation is maintained but only the threshold and the sub-maximum conditions were presented. Because of efficiency reasons (as event-related designs have much lower statistical power than block designs we need much more trials per event) each of the two conditions (representing representative and intermediate difficulty levels) was presented 20 times (10 times per hemi-field). Each visual stimulation period lasted 400 milliseconds and the baseline fixation period lasted 4,600, 7,100, or 9,600 milliseconds, which occurred randomly. Participants were instructed to maintain fixation on a white cross during the whole experiment and report the faster dot during the baseline fixation periods succeeding the stimulation blocks/events.
The computation of the speed values was individually tuned to ensure that we would analyze fMRI signal changes in identical performance conditions across participants.
Image Acquisition
The MR scans (2012 to 2014) were acquired at the Portuguese Brain Imaging Network facilities, on a 3 T research scanner (Magnetom TIM Trio, phased array 12-channel birdcage head coil—Siemens, Munich, Germany).
We acquired a 3D anatomical MPRAGE (magnetization-prepared rapid gradient echo) scan using a standard T1w gradient echo (GE) pulse sequence (repetition time (TR) = 2,530 milliseconds; echo time (TE) = 3.42 milliseconds; TI (inversion time) = 1,100 milliseconds; flip angle 7°; 176 slices with voxel size 1 × 1 × 1 mm; field of view (FOV) 256 mm). A functional imaging series consisted of: 2 runs of 145 GE, echo-planar imaging (EPI) brain scans (TR = 2,500 milliseconds; TE = 30 milliseconds; flip angle 90°; 36 interleaved slices with voxel size 3 × 3 × 3 mm; FOV 256 mm) in a block design stimulation paradigm for measurement of BOLD signal and 1 run of 116 GE, EPI scans (TR = 2,500 milliseconds; TE = 30 milliseconds; flip angle 90°; 36 interleaved slices with voxel size 3 × 3 × 3 mm; FOV 256 mm) in an event-related design stimulation paradigm with measurement of BOLD signal.
hMT+/V5 Functional Localizer
To analyze the BOLD signal in the motion responsive ROI, we used a functional hMT+/V5 localizer based on dot motion.22,25 We presented an independent group of participants (data not shown) a moving-dot task, which has been used in imaging and neurophysiological studies based on both single and multiple dots.22,26 The random effects (RFX), general linear model (GLM) analysis of BOLD responses in Talairach space confirmed that hMT+/V5 was successfully activated in the expected coordinate locations (peak voxel Talairach coordinates x = −45, y = −66, z = 2 in the left and x = 42, y = −66, z = −2 in the right) and this ROI was selected by choosing the whole cluster that survived a false discovery rate-corrected P-value = 0.001 with cluster extent threshold correction.
Functional Magnetic Resonance Imaging Data Processing
Image processing and analysis were carried out using BrainVoyager QX 2.6 (Brain Innovation, Maastricht, The Netherlands). We applied slice scan time correction, linear trend removal, temporal high-pass filtering (two cycles per run), slight spatial smoothing (full width at half maximum, 4 mm), and interscan head motion correction. Functional scans were coregistered with each individual anatomical scan in Talairach space.
To ensure that we were investigating differences in BOLD signal related to the HRF and not the task difficulty levels, we included in our GLM confound predictors accounting for the incorrect trials. In other words, we only investigated BOLD signal variation explained by correct responses to the task, ensuring the emergence of differences at the vascular and not cognitive level.
Statistical analysis was performed using an RFX GLM which allows modeling explicitly both within-subjects and between-subjects variance components to generalize findings to the population level. 27 The data for each subject is concatenated resulting in mean effect estimates per condition (first level). Then the estimated first-level mean effects enter the second level as the new dependent variable (instead of the raw data) and are analyzed across subjects (group analysis). Since the analysis at the second level explicitly models the variability of the estimated effects across subjects, the obtained results can be generalized to the population (see reference for a detailed explanation). 28
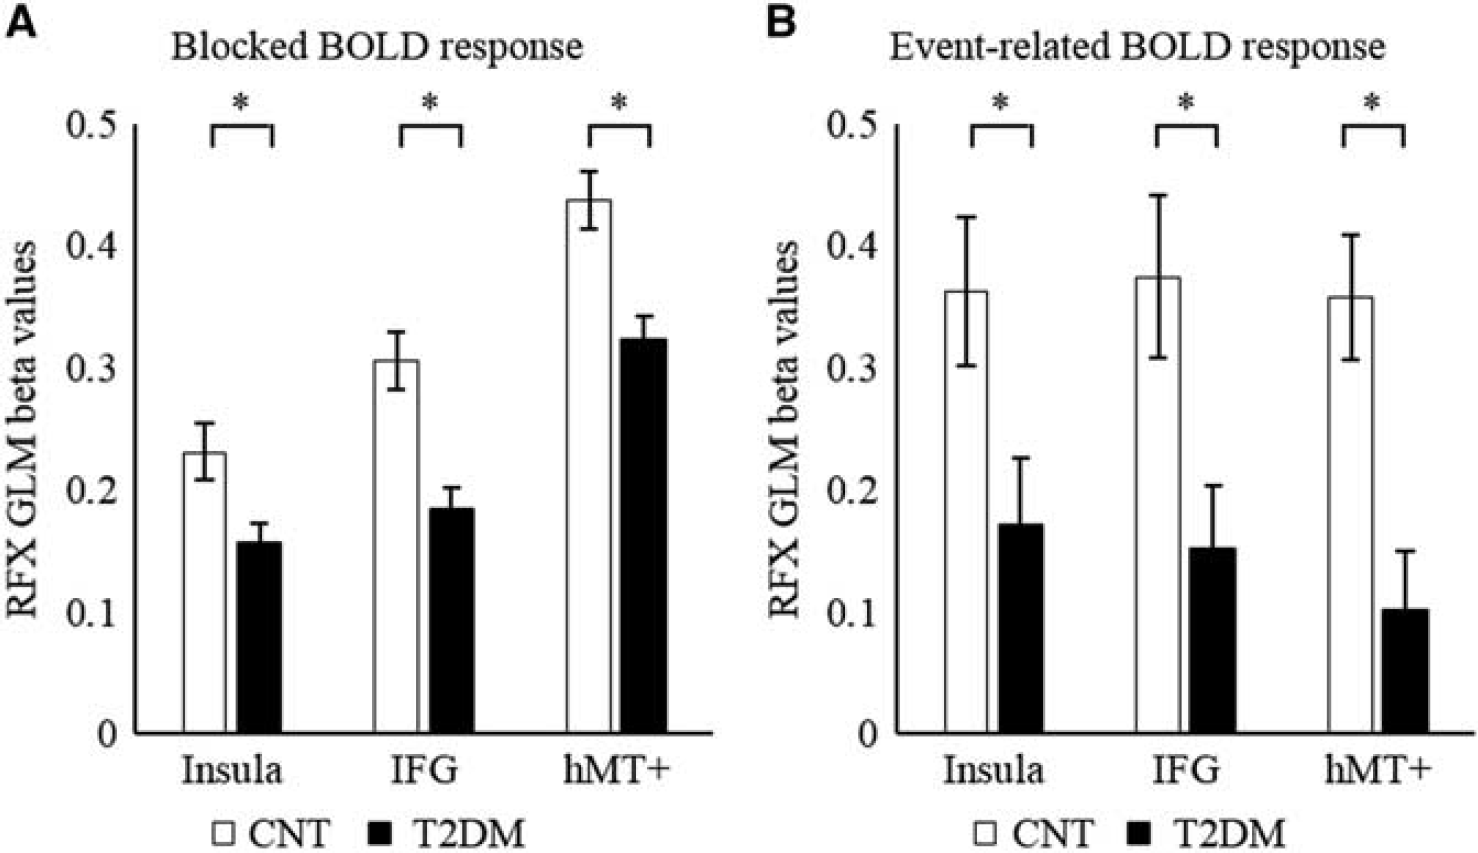
Predictors for the four stimulation conditions were used to estimate condition effects (beta values) separately for each subject. The subsequent resulting group statistical maps were corrected for multiple comparisons using the false discovery rate correction at P-value < 0.001 with cluster extent threshold. The resulting statistical maps for both controls and T2DM patients are as seen in Figure 2. We defined two additional ROIs based on the thresholded RFX GLM statistical maps: one at the insula because of its known role in decision making processes and one in the inferior frontal gyrus (IFG) because of its role in executive functioning. We extracted the mean BOLD activity within the three ROIs and compared between groups (see Figure 4). We further examined the average BOLD fMRI response time courses for each stimulation condition in the three ROIs, as shown in Figure 5.
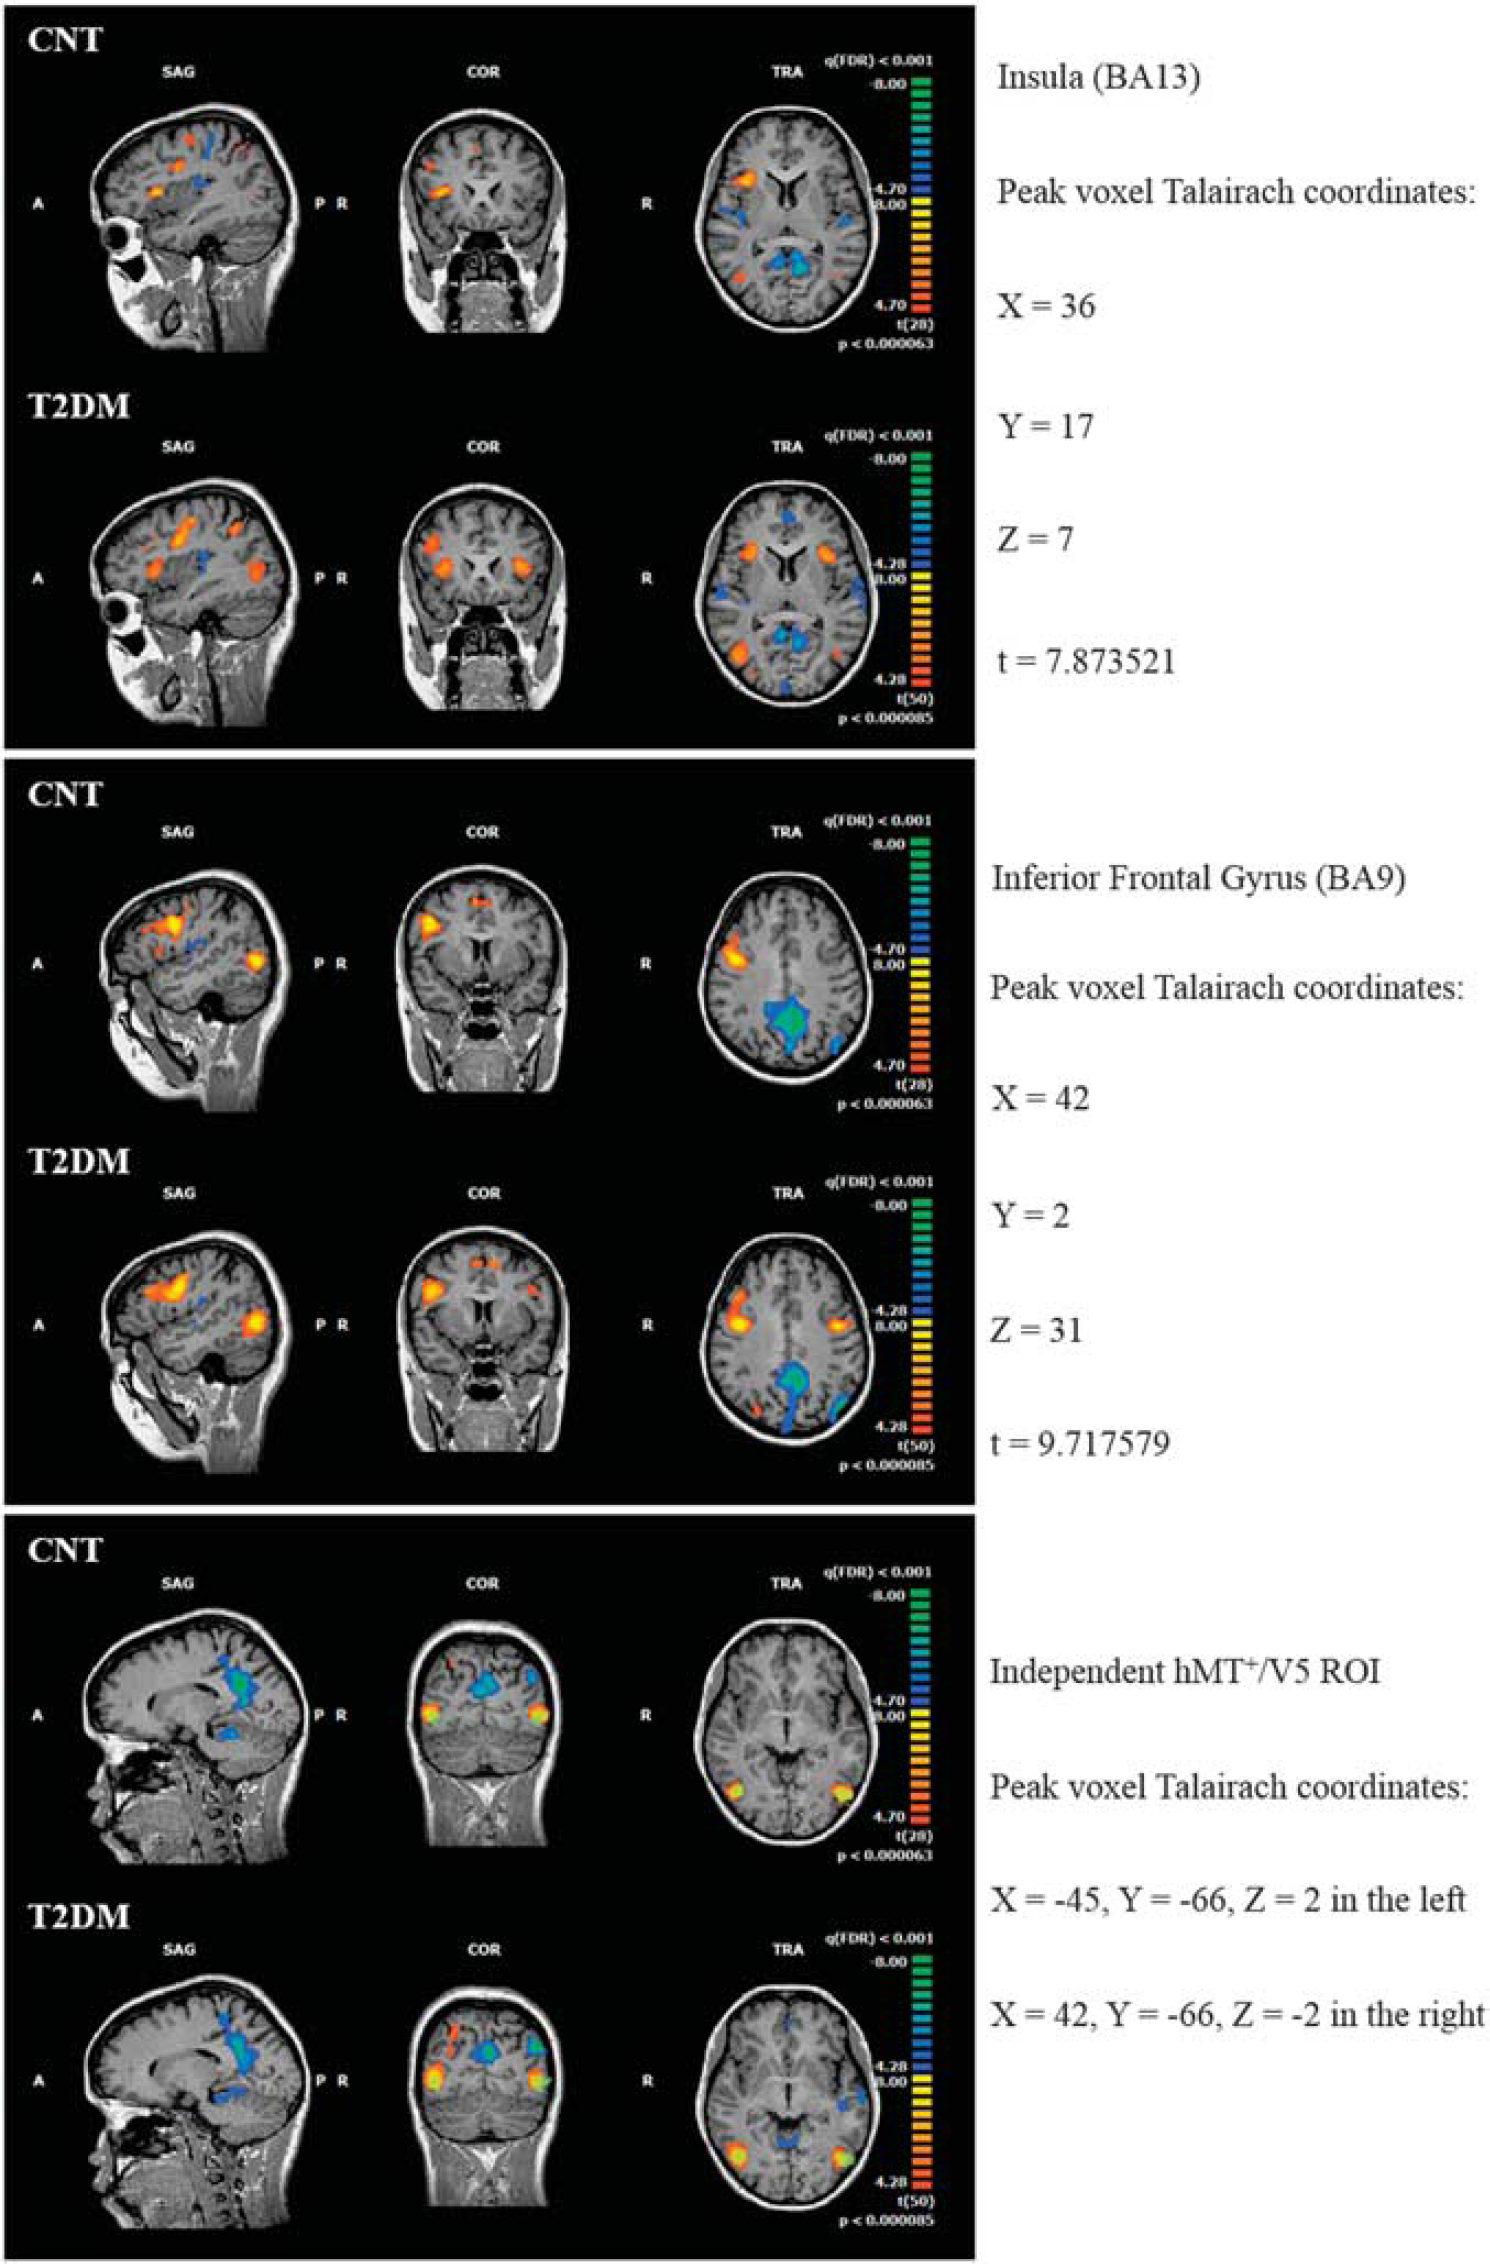
Functional maps generated from RFX analysis of the BOLD fMRI response to the speed discrimination task during the block design experiment for controls and T2DM patients. Both maps are corrected for false discovery rate (FDR) at P-value < 0.001. One can see significant activations within part of the insula (top), inferior temporal gyrus (IFG, middle), and hMT+/V5 (bottom), the latter being well overlapped with the independent localizer shown in green. We used this ROIs to extract the fMRI BOLD signal for further analysis of the response profile in both groups. BOLD, blood oxygenation level-dependent; fMRI, functional magnetic resonance imaging; RFX, random effects; ROI, region-of-interest; T2DM, type 2 diabetes mellitus.
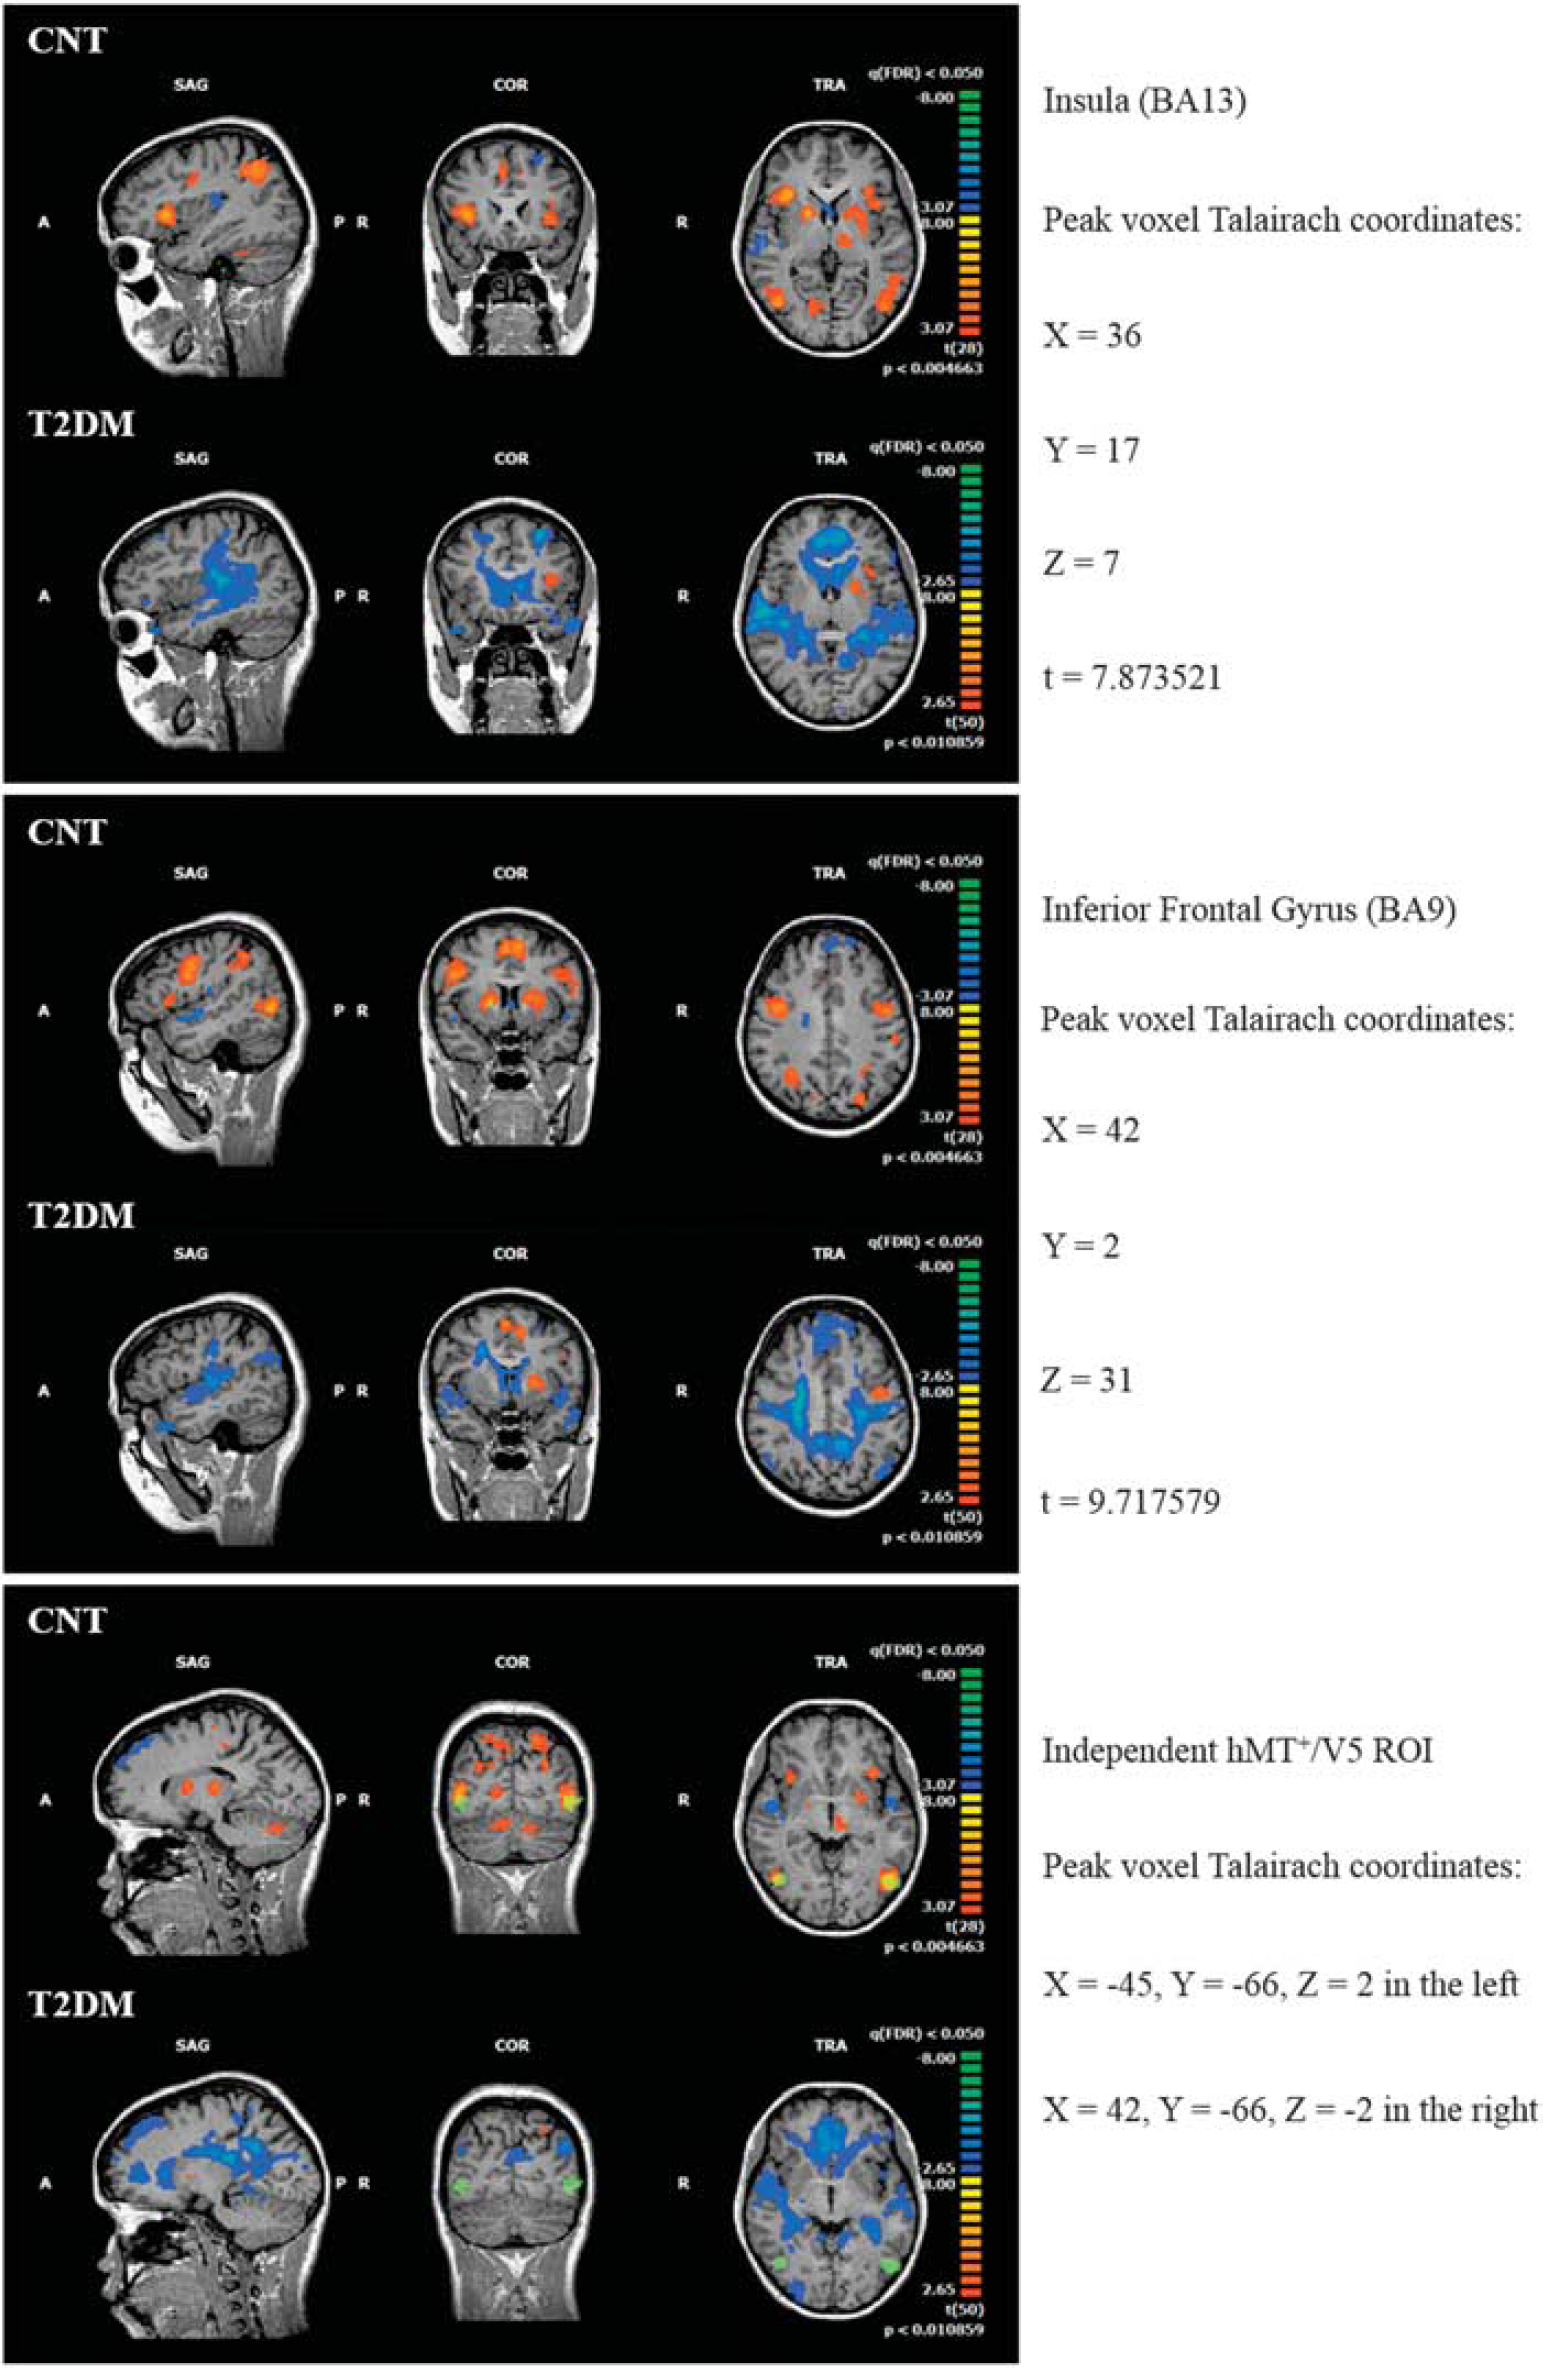
Functional maps generated from standard RFX analysis of the BOLD fMRI response to the speed discrimination task during the event-related experiment for controls and T2DM patients, using a canonical HRF. Both maps are corrected for false discovery rate (FDR) at P-value < 0.05. Note the absence of significant activation in the statistical map of T2DM patients, which shows mainly deactivations relative to baseline. In the control group, we can see significant activations within part of the insula (top), inferior temporal gyrus (IFG, middle), and hMT+/V5 (bottom), the latter well overlap with the independent localizer shown in green. We used these ROIs to extract the true hemodynamic response function from the BOLD signal in both groups. BOLD, blood oxygenation level-dependent; fMRI, functional magnetic resonance imaging; HRF, hemodynamic response function; RFX, random effects; ROI, region-of-interest; T2DM, type 2 diabetes mellitus.
Mean BOLD activity within the three selected regions-of-interest (ROIs) during (
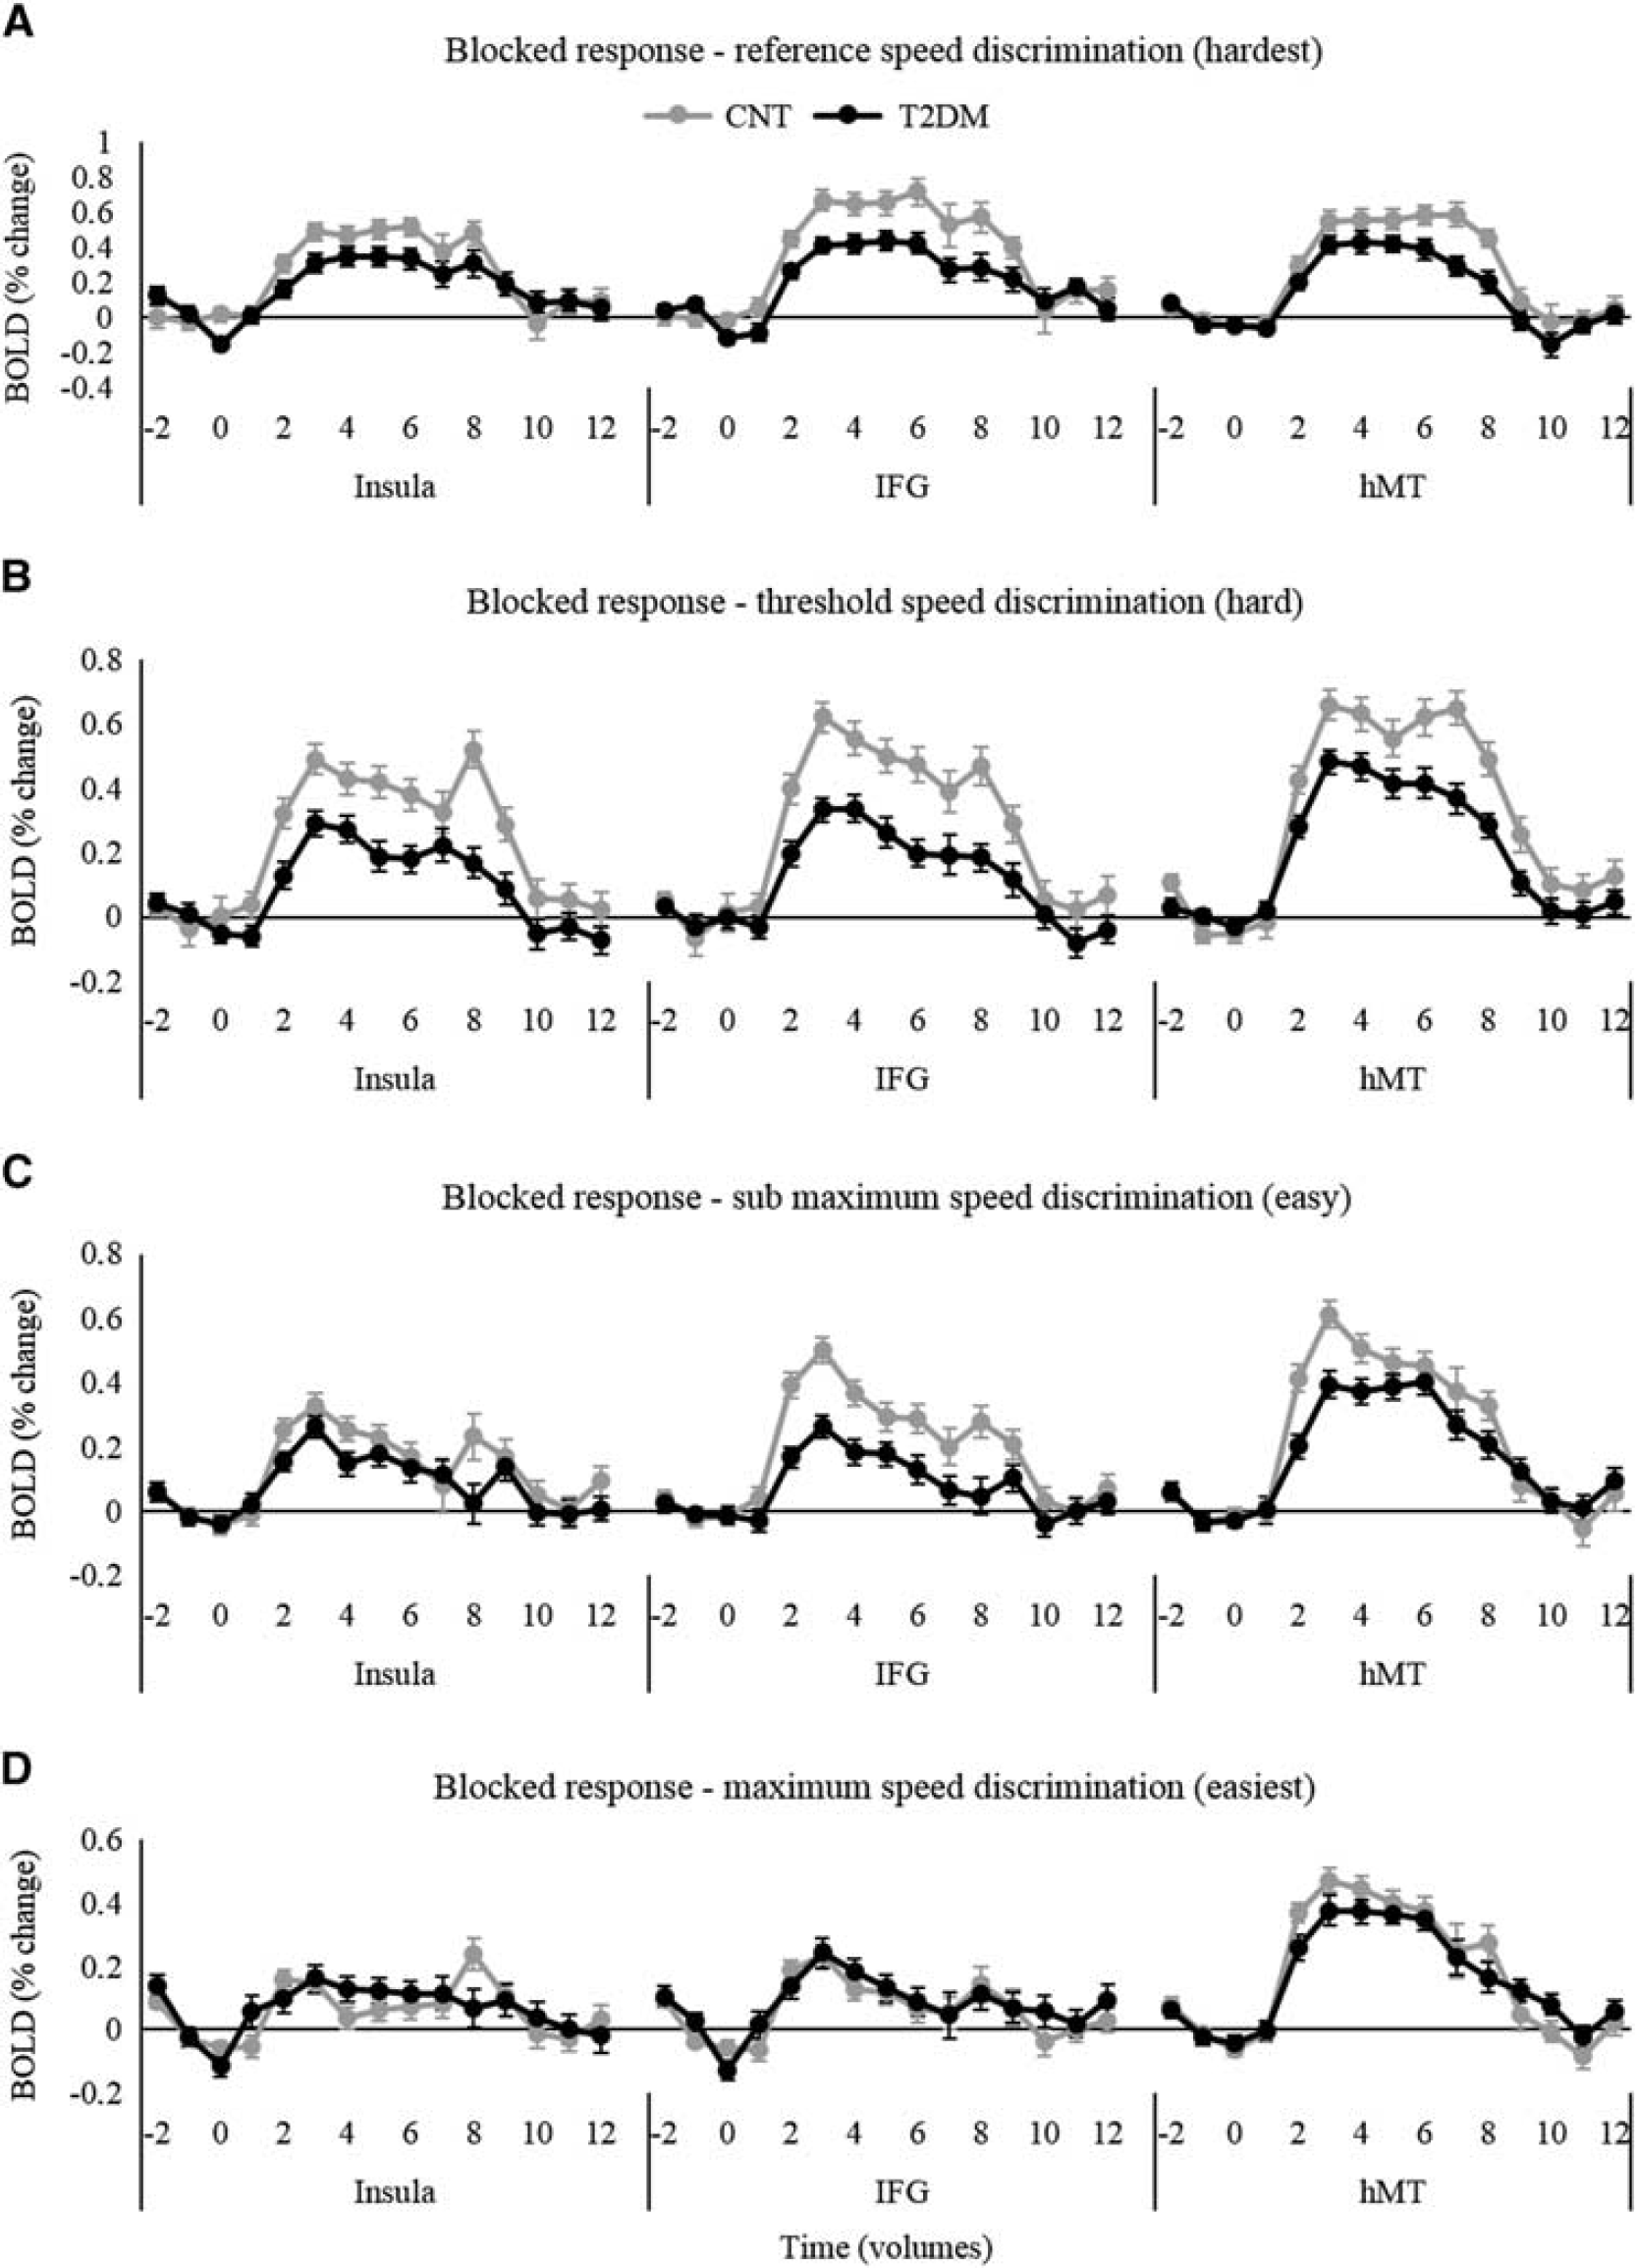
Averaged time course of the BOLD fMRI response within the three ROIs for the (
For the event-related design, we applied both the standard RFX GLM analysis, shown in Figure 3, and deconvolution analysis within the previously defined ROIs to separate the contributions of different events. A deconvolution analysis consists of an alternative to the standard GLM analysis as the entire shape of the HRF is not fixed in advance. It allows to estimate the HRF for each event type. In this approach of linear deconvolution, each condition is coded in a user-specified number of ‘stick’ predictors each modeling separately the BOLD response at one data point about the onset of that condition. This allows a more flexible fitting of the model and allows the user to compare conditions on the single data point basis (see ref. 29 for more details). Furthermore, this is done at the individual level in a way that each participant has its own HRF estimated by deconvolution.
RESULTS
Behavioral Performance
We observed a statistically significant difference in the psychophysical threshold of speed discrimination between T2DM patients and controls: thrCNT = 1.39 (1.34)°/s and thrT2DM = 2.44 (1.88)°/s (Mann–Whitney test, P-value = 0.0043, see Table 1).
In this study it was critical to study BOLD responses and neurovascular coupling under performance-matched conditions (in threshold units), in addition to physically matched stimuli. For this reason and given that stimuli were chosen (tailored) for subsequent fMRI scanning taking also into account levels above and below individually determined thresholds, overall response accuracy while scanning did not show a significant difference between control and diabetic participants. Controls and patients could therefore be performance matched in both blocked and event-related experiments, reaching leveraged average and matched accuracy values for easier discrimination trials (data not shown). Furthermore, to ensure we would be analyzing hemodynamic effects rather than differences in cognitive processes we included only trials with correct task response in the fMRI analysis procedures.
Functional Magnetic Resonance Imaging Findings
The fMRI statistical maps extracted from the standard RFX GLM analysis are shown in Figure 2 for the blocked experiment and in Figure 3 for event-related experiment with identical section views. In the blocked experiment, we can observe similar statistical maps for controls and T2DM patients, although the map of T2DM patients show an interesting bilateral activation in all three previously described ROIs (see Materials and Methods) while the control group shows a right lateralization in activation of higher level areas.
In the lower panel, we can observe the overlap between the RFX GLM statistical maps with the independent hMT+/V5 localizer used for investigation of the HRF in a visual area. The independent localizer (data not shown) is consistent with prior reports of its localization.21,25 We defined two additional ROIs based on the thresholded RFX GLM statistical maps for further analysis of the HRF: one at the insula (top panel, peak voxel Talairach coordinates x = 36, y = 17, z = 7; t = 7.873521) because of its known role in decision making processes and one in the inferior frontal gyrus (middle panel, peak voxel Talairach coordinates x = 42, y = 2, z = 31; t = 9.717579) because of its role in executive function.
For the standard GLM analysis of the event-related experiment, we found a striking effect of the same visual speed discrimination task. In the control group, we observe a similar pattern of response across the brain as in the block experiment. Notably, in T2DM patients we observed very little or no significant activations at the same statistical threshold, for the event-related design. We rather observe large deactivation regions, although one can see that most of the regions present a statistic value on the lower extreme of the thresholded scale.
Region-of-Interest-Based Activation Differences
We used the independently defined hMT+/V5 and the functionally defined insula and IFG ROIs to further investigate the BOLD response during the visual speed discrimination separately in controls and diabetic participants.
In Figure 4, we show the average group beta values for all ROIs, extracted from the standard RFX GLM analysis of the BOLD response during the block and event-related designed experiments. We found significantly lower beta values in T2DM patients compared with controls in the block experiment (Pinsula = 0.011; PIFG < 0.001; PhMT+ < 0.001) as well as in the event-related experiment (Pinsula = 0.024; PIFG = 0.043; PhMT+ = 0.002). These values represent the average BOLD signal change in these areas during all periods of stimulation, which are suggested to be systematically lower in the T2DM group.
General Blood Oxygenation Level-Dependent Response Profiles-Block Design
The average time courses of the BOLD fMRI response to each condition within the three ROIs during the blocked experiment are shown in Figure 5. We found globally higher amplitude in controls compared with T2DM patients except for the trials presenting a discrimination task between the reference speed and the maximum speed, which is the easiest condition. The difference in the response amplitude can be distinguished as a function of the timing and difficulty of the stimulation block. Interestingly, these differences are more pronounced in the beginning of the blocks during the sub-maximum and maximum conditions (easy conditions, Figures 5C and 5D) while they appear later in the period during the reference and threshold conditions (difficult conditions, Figures 5A and 5B). This suggests that participants hold higher responses during more difficult discrimination blocks while in easier ones they decide faster and return to baseline sooner. Type 2 diabetes patients tend to present this mechanism diminished.
True Estimation of Hemodynamic Response Function
In the event-related experiment we employed for the first time in T2DM deconvolution-based GLM analysis, which is used explicitly to extract the effect of the impulse response from the measurements, to attempt more accurately to depict the time course of the neuronal activity from the measured BOLD response. In Figure 6, we show the global average of the estimated HRF for each group from both threshold and sub-maximum events and over the three ROIs (Figure 6A), and also the ROI-specific HRF for each event type (Figures 6B to 6D). In the specific case of the deconvolution GLM, the beta weights of the GLM allow to reconstruct the entire BOLD response to each condition from the data. The height of the peak response was significantly lower in T2DM (P = 0.02) as well as the ‘pre-peak dip’. In T2DM patients, the characteristic undershoot of the HRF does not seem to occur before returning to baseline (see significant data points in the global HRF, Figure 6A). In addition, we performed a sensitivity and specificity analysis of the HRF of T2DM patients versus healthy controls. We computed the receiver operating characteristic curve for the peak amplitude of the HRF. The area under the curve (AUC) was found to be significantly different from the null hypothesis of no discrimination between groups (AUC = 0.65; s.e.m. = 0.06; P = 0.03).
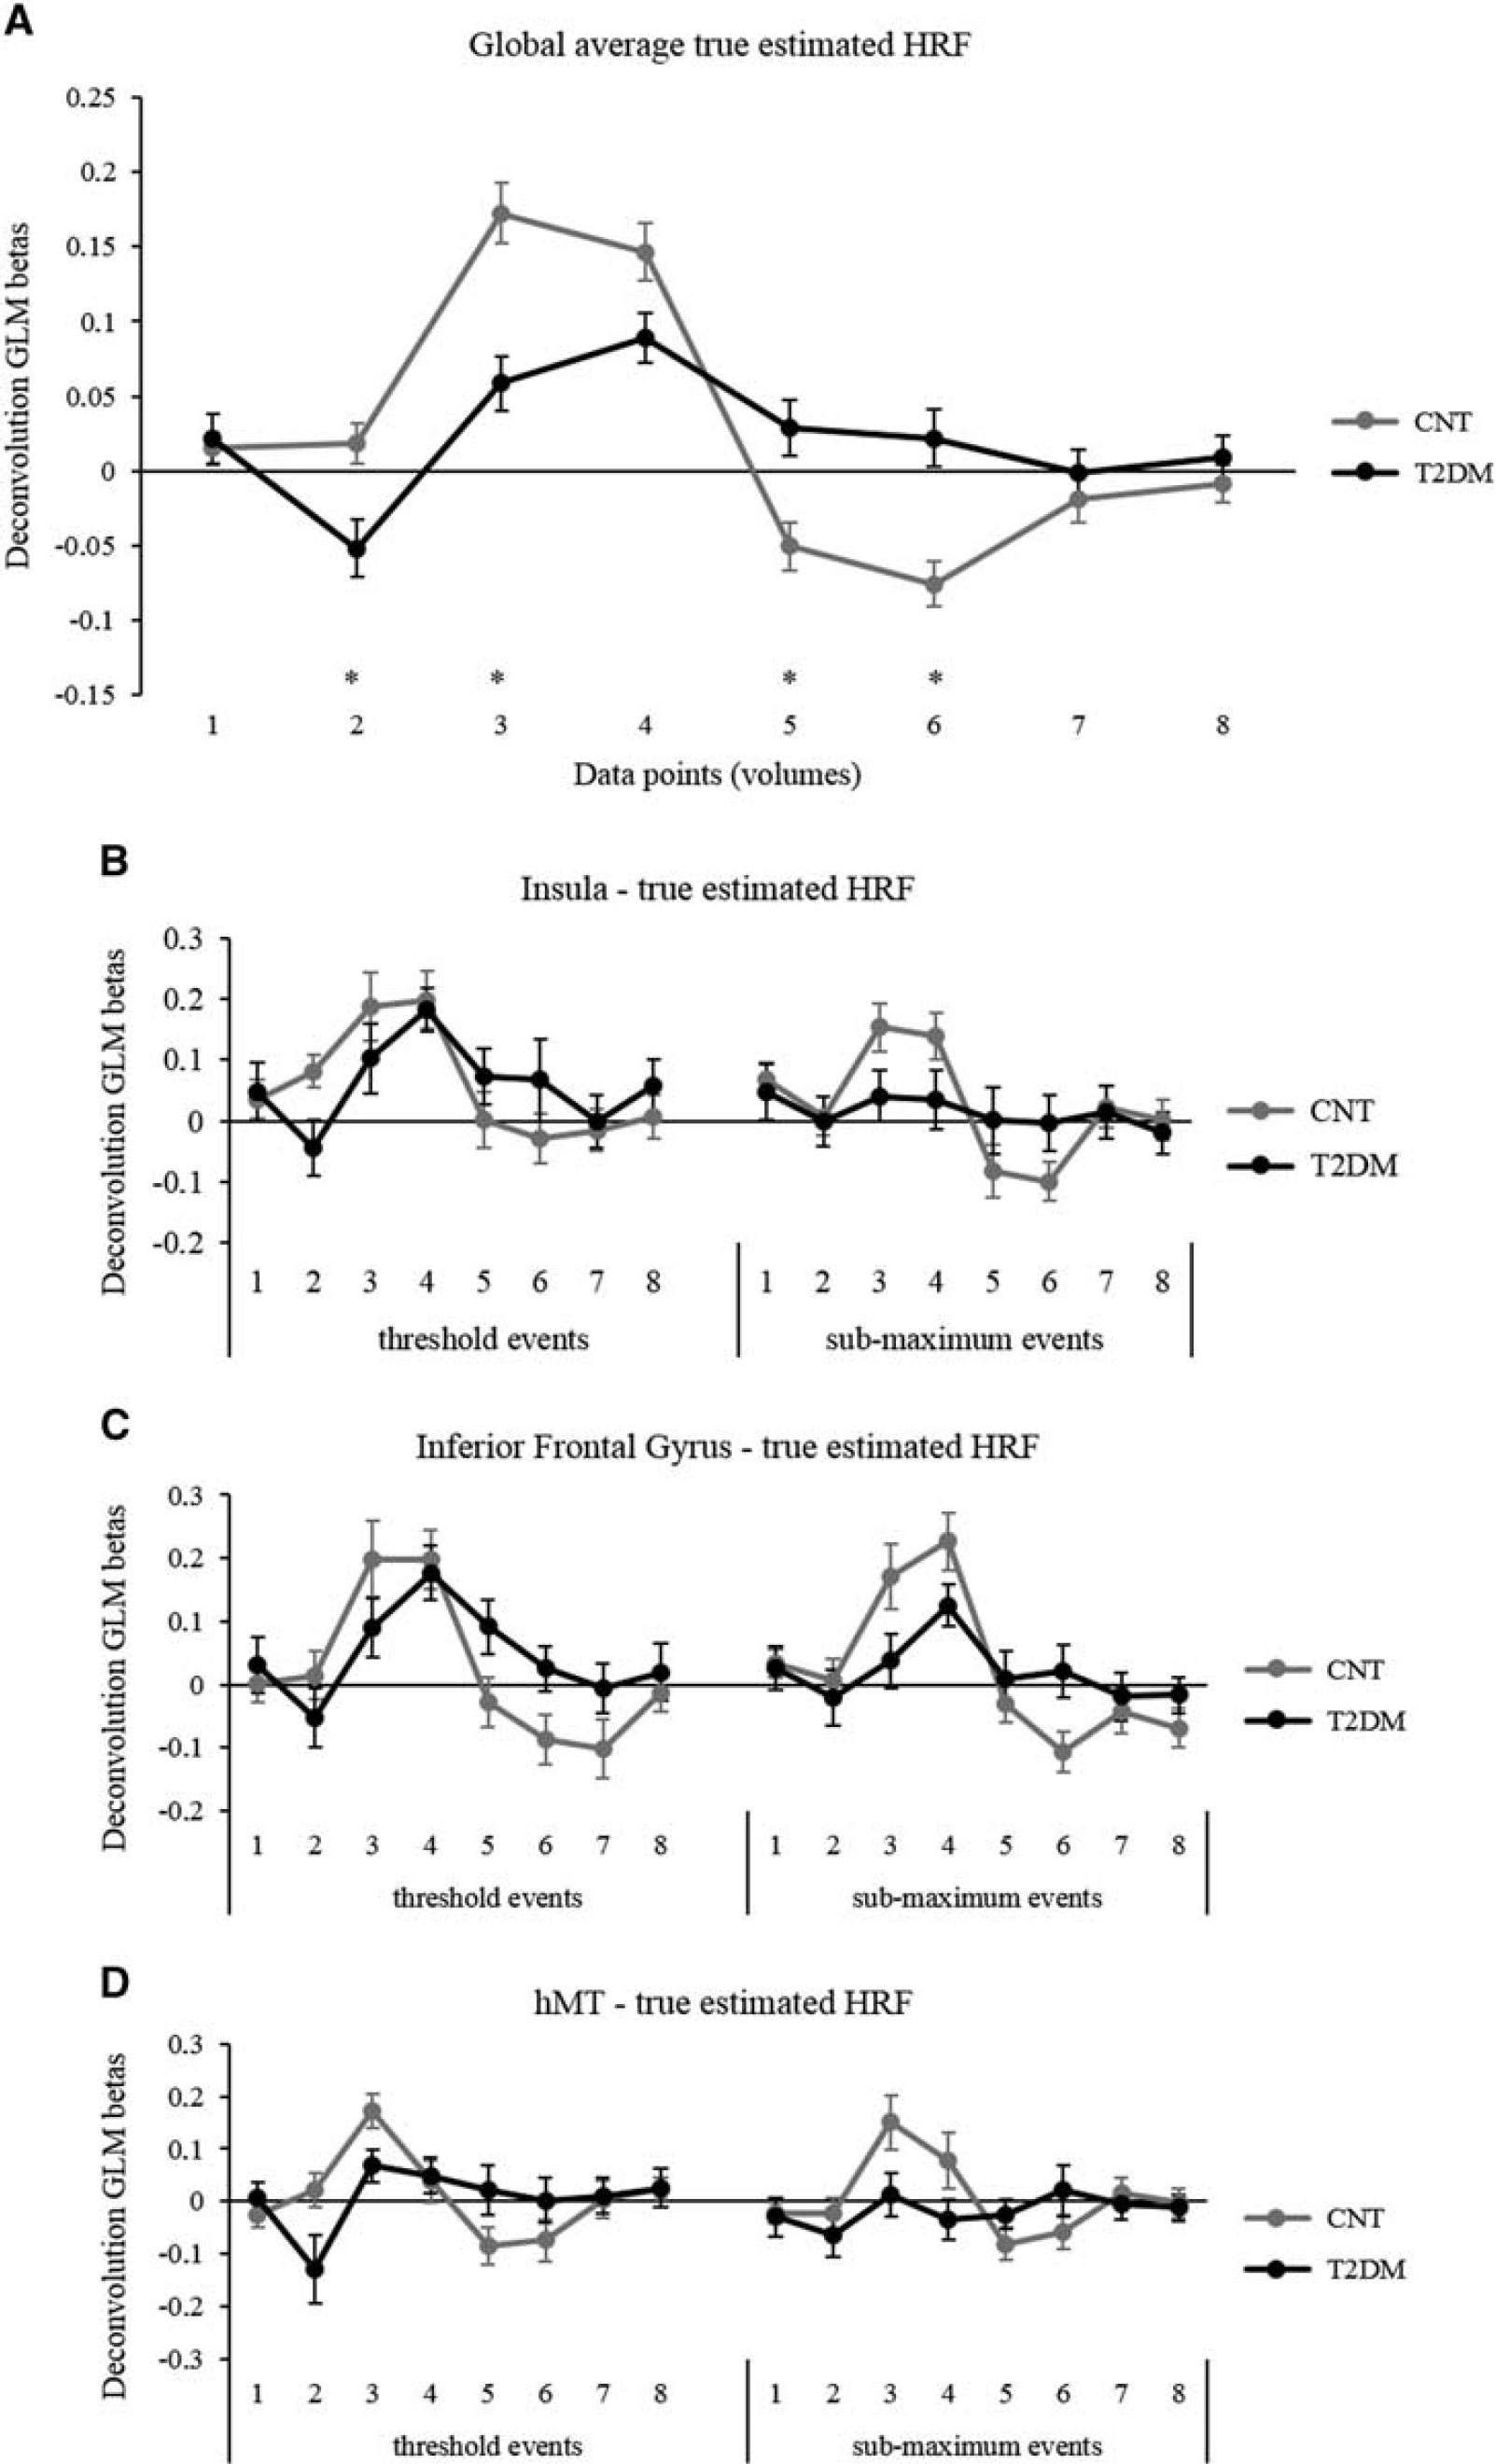
The global average true estimated HRF in the brain is presented in
DISCUSSION AND CONCLUSIONS
This study aimed at assessing the stimulus-driven BOLD hemodynamic response in neurologically intact patients with T2DM, without any neuroradiological signature of brain damage. We investigated fMRI signal changes in response to a visual speed discrimination task, using both block and, most importantly, event-related designs, which allowed for the extraction (by deconvolution) of the real hemodynamic response function.
Our results revealed differences in the amplitude of BOLD signal changes as in the time course of the HRF of diabetic patients (Figures 4–6). The event-related design and the possibility to implement response deconvolution allowed to determine that T2DM participants had dissimilar physiological response curves (lower global amplitude, peak height, ‘dip’, and undershoot). This shows that the HRF is changed and thereby that neurovascular coupling is disturbed even in apparently normal intact brains. These differences cannot be attributed to the documented processing impairment since task performance was tailored across groups and, importantly, fMRI signal analysis accounted for the correct trial responses only. Intermediate stimulus levels were adjusted to near and above individual threshold levels to ensure performance matching. Note that it is impossible to completely match the task at the stimuli parameters and performance levels at the same time (although all participants had performance or physically matched stimuli, and only correct responses were used). In this type of studies, the literature recommendation is to normalize the stimuli to individual threshold units.30,31 Notably, we also tested the association between global activation measures and diabetic retinopathy grades in this subgroup of patients and we did not find a significant correlation. We assume that gross abnormalities in the HRF in this subgroup could not have driven the main findings of this study. The differences in the hemodynamic response are an effect of T2DM rather than retinopathy (which was expected given that the inclusion criteria were anyway mild).
In sum, microvascular pathophysiology is the likely explanation for our results, in line with previously suggested pervasive injuries to the vascular bed.16,32 The BOLD fMRI signal change is owing to variations of deoxyhemoglobin concentration in the cerebral vasculature and can be affected by local changes in blood flow, blood volume, and oxygen consumption. As a consequence, the temporal and spatial characteristics of the BOLD time course can be influenced by differences in the vascular bed. 33 It is also plausible that increased levels of baseline blood flow might reduce the BOLD signal amplitude. This could be measured in future studies using arterial spin labeling or contrast agent MRI techniques.
The use of both blocked and in particular event-related paradigms was unique in our study. The latter allowed to investigate and directly estimate the transient hemodynamic response to a short stimulus and to extract it without making assumptions as to its shape.34,35 This is particularly useful in the case of an event-related design because standard averaging, as in the case of standard GLM analysis of block designs, is not effective in directly estimating the event-related HRF responses. This enables the study of this hemodynamic response function as a measure of auto-regulatory processes. Neuronal activation imposes an increase in oxygen demand in functionally relevant brain areas, which is managed by regulatory increases in blood supply to optimize oxygen supply. 36 In the presence of cerebrovascular disease, the oxygen reserve may not be sufficient to respond to the stimulus, resulting in a loss of autoregulation.37,38 In this situation, the standard HRF is changed and induces subsequent alterations in the BOLD signal time course.
We speculate that the differences in the temporal dynamics and magnitude of BOLD responses may reflect the degree of collateralization required in patients compared with controls.16,39 Future studies are needed to find the local determinants of changed HRF shape and whether they are predictive of clinical progression.
The identified BOLD signal changes in diabetic patients may therefore partially be explained by changes in the cerebral vasculature that modifies its capacity to adapt to local demands. In fact, assessment of fMRI activation in a damaged brain might depend on the constraints owing to decreased oxygen delivery during activation. Consequently, these results yield an increased concern about the limits of functional MRI in evaluating patients with T2DM, at least using a canonical HRF. Using a standard canonical HRF to model the BOLD response may result in misestimating the response parameters. Previous event-related studies have identified significant variability in the shape of the hemodynamic response across healthy young adult 40 and elderly subjects. Some studies have reported that hemodynamic impairment can affect fMRI signal detection. 32 The present study confirms these findings and reports for the first time the dynamic variations of BOLD signal in individuals with T2DM in several brain regions, and at the event level. We suggest that, in fMRI studies with diabetic patients, each participant's HRF should be measured using a long trial event-related study, conducted during each experimental fMRI session. Information about the hemodynamic parameters can then be used to optimize data analysis. The use of standard fixed GLM analysis of block designs might camouflage true differences in BOLD signal and consequently bias the interpretation about brain function in T2DM and other vascular diseases.
Future longitudinal studies are needed to assess the predictive value of BOLD fMRI in the assessment of auto-regulatory capacity in diabetic patients. Blood oxygenation level-dependent fMRI has the advantage of being a noninvasive method and may compare favorably with other approaches. Our results suggest that a simple visual activation paradigm is sensitive in detecting alterations in the hemodynamic response of individuals with T2DM.
Functional MRI remains a useful tool in the indirect assessment of neuronal function, but its results should be approached with caution when evaluating patients with altered hemodynamics as in the case of T2DM. Event-related designs, as used in this study, will become very important to help extract the true shape of the hemodynamic response function, which is a promising new measure. Participants with T2DM show a different fMRI response profile: lower peak amplitude, lower dip, and no undershoot before returning to baseline. Future studies will allow a more complete understanding of hemodynamic model parameters and the underlying physiology of the BOLD signal to improve the utility of functional brain mapping in the context of diabetes.
Footnotes
JVD, MR, and MCB conceived and designed the experiments. JVD and BQ performed the experiments. JVD analyzed the data. JVD, MR, JMSP, and MCB wrote the paper. CM, LG, and FC contributed to the discussion and revised the manuscript.
The authors declare no conflict of interest.
ACKNOWLEDGMENTS
MCB is the guarantor of this work and, as such, had full access to all the data in the study and takes responsibility for the integrity of the data and the accuracy of the data analysis. We thank the participants for their involvement in this study. We also thank Carlos Ferreira and João Marques from ICNAS, the University of Coimbra, for help with MRI procedures.