
Abstract
The cross-sectional area of a blood vessel determines its resistance, and thus is a regulator of local blood flow. However, the cross-sections of penetrating vessels in the cortex can be non-circular, and dilation and constriction can change the shape of the vessels. We show that observed vessel shape changes can introduce large errors in flux calculations when using a single diameter measurement. Because of these shape changes, typical diameter measurement approaches, such as the full-width at half-maximum (FWHM) that depend on a single diameter axis will generate erroneous results, especially when calculating flux. Here, we present an automated method—thresholding in Radon space (TiRS)—for determining the cross-sectional area of a convex object, such as a penetrating vessel observed with two-photon laser scanning microscopy (2PLSM). The thresholded image is transformed back to image space and contiguous pixels are segmented. The TiRS method is analogous to taking the FWHM across multiple axes and is more robust to noise and shape changes than FWHM and thresholding methods. We demonstrate the superior precision of the TiRS method with in vivo 2PLSM measurements of vessel diameter.
INTRODUCTION
Penetrating arterioles are control points of cortical blood flow1–5 making them important regulators of oxygen delivery to active neural tissue.6,7 The dynamics of diameter changes in penetrating arterioles can differ from surface vessels, 8 consequently accurate measurement of the dilatory responses of penetrating vessels is critical for interpreting functional hemodynamic signals. 9 Two-photon laser scanning microscopy (2PLSM) has been employed to measure the diameters of penetrating arterioles.4,8 The size of the vessel is typically quantified using the full-width at half-maximum (FWHM) measurement.10,11 An implicit assumption of the FWHM method is that the vessels are circular, or nearly circular, although some studies have taken this non-circularity into account when quantifying vessel sizes.3,12 Careful anatomic quantifications have shown that blood vessels throughout the body, 13 including the carotid arteries14,15 and coronary veins, 16 have decidedly non-circular cross-sections, making a single diameter axis inadequate for measuring cross-sectional area. Importantly, if very large vessels, which flux a substantial fraction or even all of the circulating blood, are non-optimally shaped, it is likely that smaller vessels will also depart from circularity. In addition, it has been underappreciated that the cross-sectional shape of blood vessels can change with dilation and constriction.17–19 Other factors, such as mechanical connections to the neighboring tissue 20 and changes in the endothelial cell shape 21 can also distort the vessel cross section from circularity and contribute to changes in shape during changes in the vascular tone. Deviations from circularity in the vessel lumen cross-section increase vascular resistance, 22 and have widely been postulated to account for anomalous measures of viscosity of blood in post capillary venules 23 and discrepancies in the calculated flow measurements through vessels.24–26 While an imaging plane that is not perpendicular to the long axis of the vessel will result in a non-circular cross-section, it cannot account for the changes in the shape observed in these studies.
Rather than assuming circularity and measuring along a single axis to determine the cross-sectional area of the vessel, it is preferable to determine the cross-sectional area of the vessel in a shape-independent manner. One way of measuring area is thresholding 27 to generate a binary mask, and quantifying the area within the mask. However, thresholding algorithms are often very sensitive to the threshold value, and perform poorly on images with low signal-to-noise without more complicated prefiltering and processing steps. 28 As, under physiologic conditions, penetrating and ascending vessels have a convex cross-section, we would like to use this constraint to aid our automated image processing algorithms. We make use of the Radon transform, 29 in which an image is converted into a series of projections at various angles by taking integrals along parallel lines. To obtain robust estimates of the area change of the cross-section of vessels oriented perpendicular to the cortical surface, we developed a new method, thresholding in Radon space (TiRS). The TiRS method is analogous to taking the FWHM across many axes of an image, such as a frame from movie. Briefly, we transform the images into Radon space, threshold the image in Radon space, then transform the image back in to image space, where the area of the penetrating vessel is quantified after a second thresholding, and detection of contiguous pixels. Performing the thresholding in Radon space is advantageous over thresholding in image space, as performing the operation in Radon space makes use of the global structure of the image, not just a single pixel. Unlike the Hough transform, 30 which has been used to detect parameterized shapes, 31 the TiRS method is for quantifying the area of non-parameterized (but convex) objects. We show that the TiRS algorithm is more robust to noise, size, and shape changes than FWHM and standard thresholding methods, and can be applied to real data.
MATERIALS AND METHODS
Simulations
All processing and simulations were done in Matlab (Mathworks, Natick, MA, USA). Within the simulated vessel, the pixel intensity was drawn from an exponential distribution with a mean of one. After varying amounts of exponentially distributed noise were added, the image was convolved with a 2-dimensional Gaussian with x and y s.d. of one pixel.
For ease of comparison of the FWHM method, which outputs diameter or radius, with the TiRS and pure thresholding methods, which output area, we used the identity as follows: radius =
Thresholding in Radon Space
The Radon transform takes an image and performs line integrals along parallel lines oriented at an angle θ, with the distance of the closest point along the line from the center of the image specified by ρ. ρ is varied to span the extent of entire image, and θ extends over the range from 0 to 180 degrees.
The algorithm for this procedure is given below, and outlined in Figure 3A. The numbers below correspond to images in Figure 3 at various stages of processing.
We start with a frame of a movie, M[x,y] containing a penetrating vessel. To reduce computational time with in vivo data, and avoid interference from nearby vessels, a rectangular ROI enclosing the vessel of interest is manually selected. The mean pixel intensity, averaged over the entire ROI, is subtracted.
The Radon transform of this image R[ρ,θ] is calculated with θ = [0,π] in π/180 radian (one degree) increments (Figure 3C, top). The Matlab radon command (Image Processing toolbox) was used for this operation.
For each angle θ p , R is rescaled to be between 0 and 1 to give a normalized radon transform Rnorm:
(Figure 3C, middle). This rescaling transformation allows us to use a single threshold for all angles.
For each angle θ p , we find the FWHM of Rnorm[ρ,θ p ], that is the minimum and maximum ρ, ρ− and ρ+, where Rnorm[ρ,θ p ], respectively exceeds and falls below the threshold CRadon. This is analogous to the FWHM operation in image space. Empirically, we found that setting CRadon between 0.3 and 0.5 effectively segmented the image. We used CRadon = 0.35 for the simulations and measurements shown in this paper. Rnorm[ρ,θ p ] is thresholded such that: Rth[ρ,θ p ] = 1 for ρ− < ρ < ρ+, and Rth[ρ,θJ p ] = 0 for ρ < ρ− and ρ+ < ρ (Figure 3B, bottom). The net effect of this transformation is to reduce the amplitude of any pixels outside the central contiguous shape.
Rth[ρ,θ] is transformed back into image space, using the inverse Radon transform, yielding MIR[x,y] (Figure 3B, right). The Matlab toolbox function ‘iradon’ with a Hamming window to reduce high-frequency noise was used for this transformation.
We threshold Mth[x,y] = H(MIR[x,y]-c), where H is the Heaviside function and c is a constant, typically in the range of 0.1 to 0.3. We used 0.2 for simulations and measurements shown in this paper. The area enclosed by the external border of the largest contiguous region of pixels (using 8-connectedness, i.e., pixels on the diagonal from each other could be contiguous) is then quantified. This is to ensure that any pixels that are spuriously below this threshold are discounted. A similar procedure is used in the pure thresholding algorithm (described below).
Pure Thresholding Algorithm
Parameters for the pure thresholding algorithm were chosen to optimize accuracy under the zero-to-low noise conditions (signal/noise ˜3).
We start with a frame of a movie, M[x,y] containing a penetrating vessel. The mean over the entire images is subtracted.
The image is filtered with a 3 × 3 pixel median filter. This served to reduce the influence of pixels with very high intensities, increasing thresholding accuracy.
The pixel values in the ROI are normalized to lie between 0 and 1 by the transformation.
The pixel intensity is binarized, according to the transformation:

where H is the Heaviside function and Cbt the threshold for binarization. For the simulations shown here, Cbt was set to 0.35, with the exception of Figure 3, where 0.25 and 0.45 were used for the low and high thresholds, respectively.
As with the TiRS method, the area is taken to be largest contiguous region of pixels (using 8-connectedness).
Full-Width at Half-Maximum
The image was first filtered with a 3 × 3 median pixel filter. This filtering reduces extreme values, and decreases noise in the diameter measurement.
A single horizontal axis through the center of the vessel was used to determine the FWHM. The distance between the most extreme pixels along this axis that are 0.5 times the maximum was calculated to be the diameter of the vessel. For ellipse measurements, the diameter chosen was along the horizontal axis. This was done purposefully to emphasize the magnitude of error with an arbitrarily chosen axis in a vessel that changes shape.
Surgery
All surgical and experimental procedures were performed in accordance with NIH guideline and approved by the Pennsylvania State University Institutional Animal Care and Use Committee (IACUC). Two-photon imaging subjects were nine (six male) 2- to 4-month-old C57/BL6 mice (Jackson Labs, Bar Harbor, ME, USA). Thinned skull windows were implanted over the right somatosensory cortex after the polished and reinforced thin-skull windows procedure. 32 Briefly, a head bolt was glued to the skull, and three self-tapping #000 3/32″ screws (JI Morris, Southbridge, MA, USA) were threaded into the skull and attached to the head bolt and skull via dental cement. The window area was first thinned to ˜30μm using #7 drill bit, and then polished with 3f then 4f grit (Convington Engineering, Redlands, CA, USA) each ˜3 minutes. A #0 cover slip was attached to the polished window area with cyanoacrylate and the edges sealed with dental cement. Animals were allowed to recover for 2 days after the surgery before they were habituated on the imaging setup in 15-minute session for up to four sessions a day.
Two-Photon Imaging
Animals were imaged using a two-photon microscope consisting of a Movable Objective Microscope (Sutter Instruments, Novato, CA, USA) and a MaiTai HP laser (Spectraphysics, Mountain View, CA, USA), controlled by MPScan software. 33 The 20 × 0.5 N.A. (Olympus, Center Valley, PA, USA), or 20 × 1.0 N.A. (Olympus) water-dipping objectives were used for imaging. Before each imaging session, animals were briefly anesthetized with isoflurane (2% in air) and infraorbitally injected with 50 μL (50 mg/mL) fluorescein-conjugated dextran (70 kDa; Sigma-Aldrich, St Louis, MO, USA) to visualize vascular system. The mouse was awake and head fixed 10 on top of a spherical treadmill equipped with an optical rotation encoder to record motion. 34 Imaging sessions typically lasted ˜2 hours. Vessels were imaged for ˜20 minutes at 6 to 9 frames/second. Imaging sessions took place up to 3 months after the initial surgery. Vessel cross-sections were imaged 30 to 150 μm below the pia.
Data Analysis
All vessel time series were filtered with a 5-point median filter. All reported numbers are mean ± s.d. unless indicated. All error bars in the plots show s.d. A total of 15 arteries and 11 veins were used in the analysis shown here. Vessels were chosen from a data set collected for a different set of experiments. To allow a fair comparison between the FWHM and TiRS methods, we excluded vessels that the FWHM method obviously could not resolve the diameter. Post hoc calculation of statistical power (1-β error probability) of the flux and diameter discrepancies in Figures 1D and 1E was 0.84, and that of the ratios of precision of the FWHM and TiRS methods in Figure 6F was 0.99.
Penetrating vessels change shape, making flux calculations based on single diameter measurement highly variable. (
RESULTS
Shape Changes in Penetrating Vessels Lead to Large Errors in Flux Calculations using Single Diameter Measurement
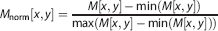
Figure 1 shows frames taken from a 2PLSM movie of a single penetrating arteriole in the parietal cortex of an awake mouse (Figures 1A and 1B) during a stationary period of no locomotion. This vessel shows obvious changes in cross-sectional area and shape owing to spontaneous diameter fluctuations. 10 We quantified the non-circularity by taking two measures of diameter at perpendicular angles using the FWHM method (Figure 1B, magenta and green lines, respectively). The ratio of the two diameters, changes over time (Figure 1C, middle), indicating a shape change in this vessel. We quantified the long-axis/short-axis ratio, which were placed along the vertical and horizontal axes of the vessels, as in the example (Figure 1B), across a population of penetrating arterioles and ascending venules (Figure 1D). The ratios of the measured diameters in these vessels were substantially different from 1 (Figure 1D). If the imaging plane is not perpendicular to the axis of the vessel, this will introduce a minor distortion of the vessel cross-section. The absolute area of an off-angle cross-section can be calculated using trigonometry. If the angle (θ) between the long axis of the vessel and the imaging plane is known, the image can be rescaled by cos(θ) along the elongated axis of the image. In practice, the distortionary effects of off-axis imaging are unlikely to contribute substantially to the non-circularity seen here, as a 10-degree off-angle will result in a distortion of 2%. We also emphasize that the shape changes cannot be caused by non-perpendicularity of the vessel to the imaging plane, and as motion in the x-y plane is minimal (<1 μm), the changes are unlikely to be due to z-plane motion.
The effects of the non-circularity and shape changes become even more pronounced if we estimate the flux of blood through the vessel, which controls local tissue oxygenation.1,2,7–9 According to the Poiseuille equation, the flux of fluid through a pipe with radius r is proportional to r 4 , although this is likely to be a lower bound on the diameter dependence of flow.35,36 The consequences of this relationship between radius and flux is that relatively small changes in diameter, whether actual or owing to the measurement noise, will have a dramatic impact on the calculated flux. To demonstrate how large the effects on calculated flux might be, we caculated the % difference of the mean flux between the two diameter measures across the population of vessels (Figure 1E). The percentage differences in the flux between the estimates using the diameters measured along the two axes were enourmous (Figure 1E), nearly 200%. This shows that a single axis of diameter measurement produces unacceptably large variability in both diameter measurments and in blood flux calculations.
The choice of axis can generate enormous variability in the diameter and flux calculations depending on the axis measured. To remove the bias and error intrinsic to the selection of a single diameter axis, a better method would perform the FWHM along all possible axes to obtain the average diameter or area. A second issue is that only a small fraction of the possible pixels is used to calculate diameter using the FWHM method, and it would be preferable to use a method that is able to spatially average to reduce noise.
Thresholding in Radon Space Method is more Accurate and Precise in Measurement of Simulated Penetrating Vessel Diameter
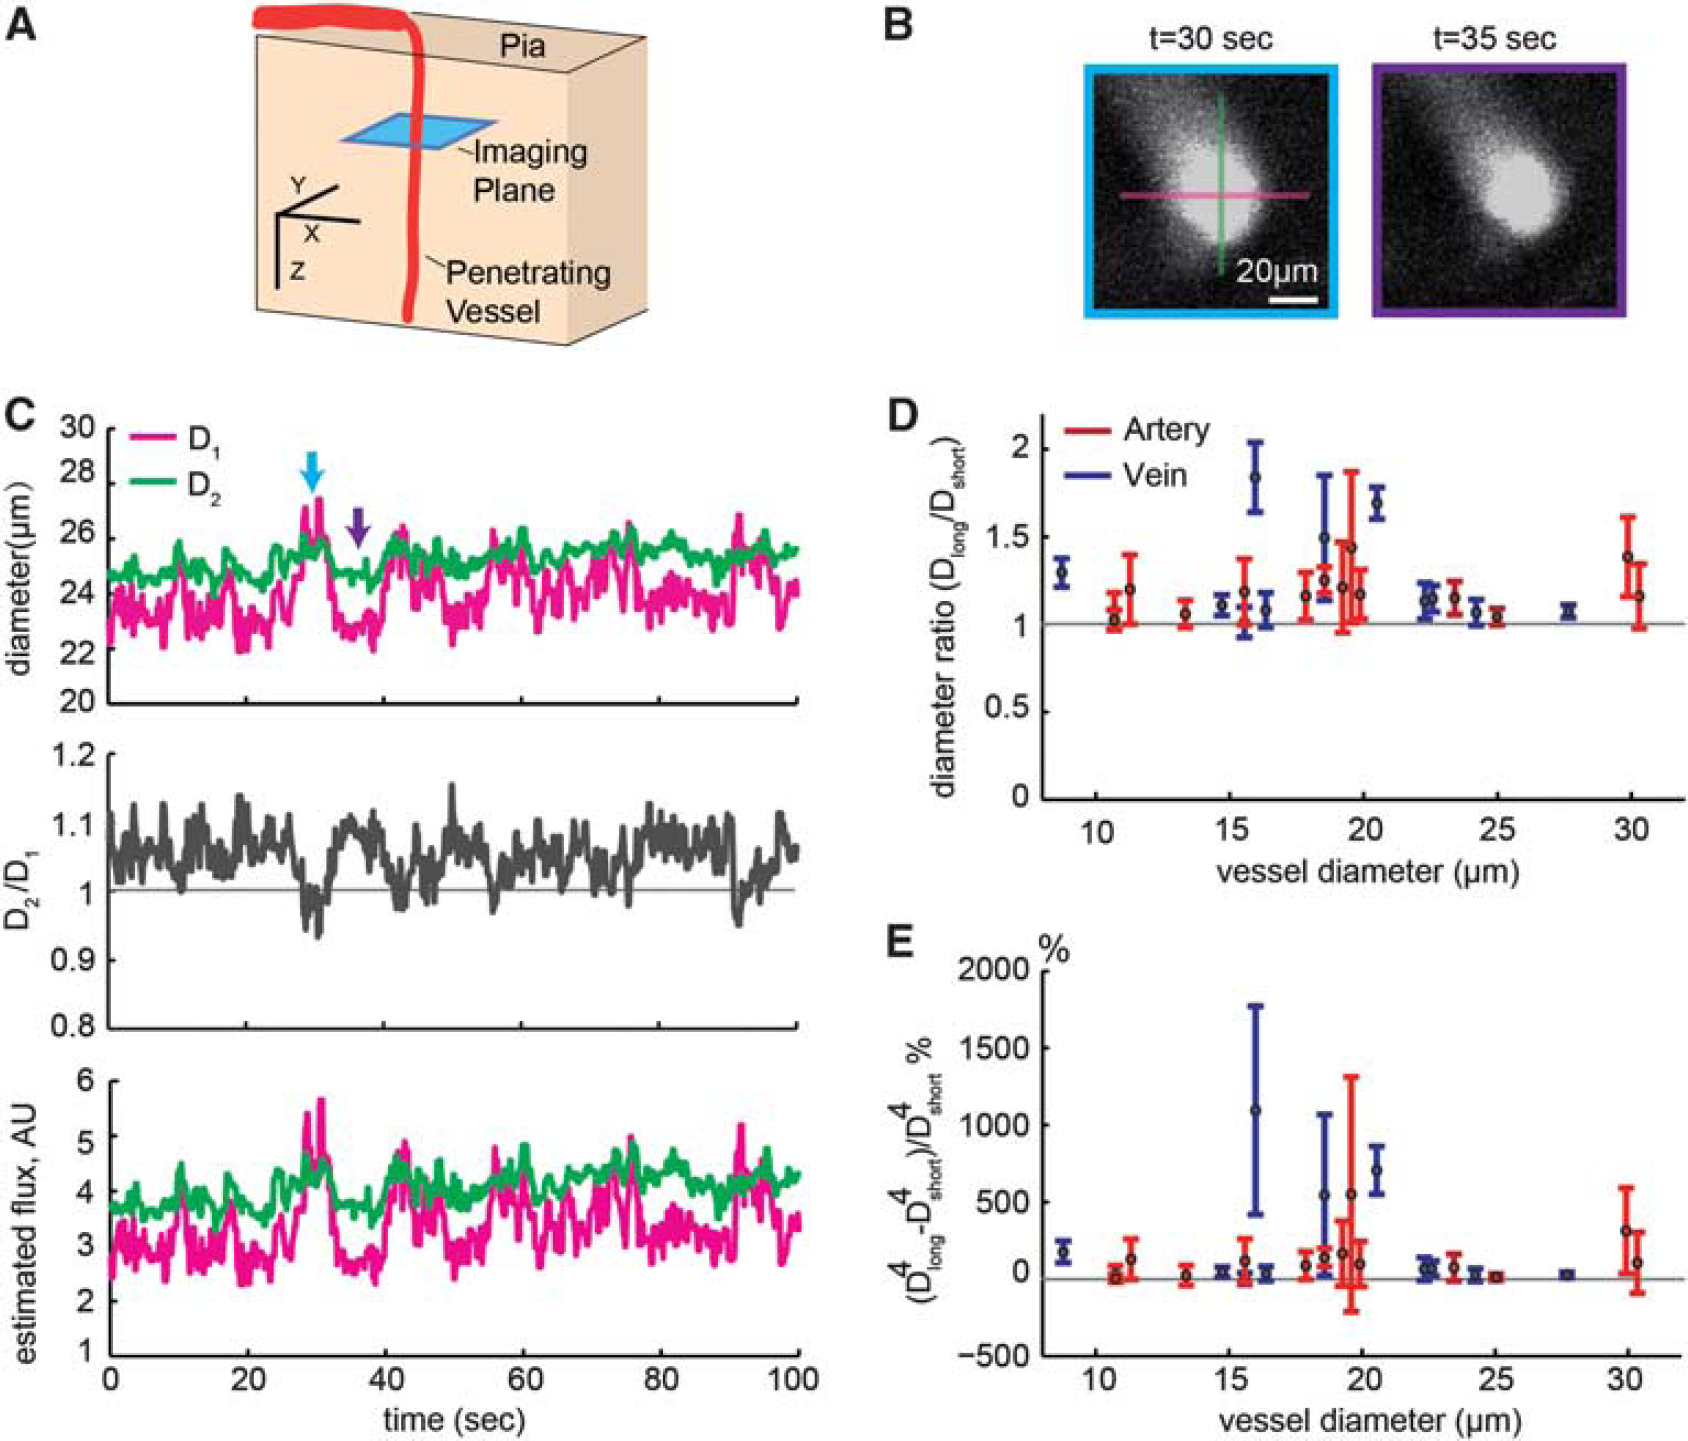
To perform something like the FWHM along multiple diameters in a natural way, we will use the Radon transform. 29 An example of the Radon transform of a simple binary image of an oval at three sample angles is shown in Figure 2. The advantage of performing this operation in Radon space is that a FWHM-type calculation can easily be done at many angles.
Radon transform of a convex object permits full-width at half-maximum, (FWHM) calculations at multiple angles. Upper left, binary image containing a bright oval. Clockwise from the upper right are Radon transforms of this image at 0, 45, and 90 degrees, respectively. Blue lines with arrows show the width of the transform above the half-maximum threshold (FWHM). Transforms have been rotated to better show the relationship to the original image.
In Figure 3, we illustrate the steps involved in the TiRS algorithm (Figure 3A), and show the output along various stages of processing. The numbers in the boxes correspond to the numbers in the corners of the images. The labels on the arrows denote the processing step that is done between images. The detailed algorithm is stated in method. Briefly, the image to be segmented contains a circle with a radius of 25 pixels, centered in a 100 × 100 pixel ROI (Figure 3B left). The raw image is transformed into Radon space (Figure 3C, top), and the amplitude at each angle is rescaled to lie within 0 and 1 (Figure 3C, middle). The Radon transformed image is then thresholded (Figure 3C bottom) and transformed back in image space. The transformed image at two different noise levels is shown in the right hand column of Figure 3B. The net effect of thresholding in Radon space is to boost the contrast of the edges. A second thresholding operation is performed in image space and the largest contiguous area of pixels is determined to be the vessel. Importantly, the detected area is relatively insensitive to the exact values of these thresholds, unlike the pure thresholding algorithm, which can be very sensitive to the exact value chosen (Figure 3D). This demonstrates that under essentially noiseless conditions, the TiRS method easily segments the image, allowing the area of the ‘vessel’ to be easily quantified.
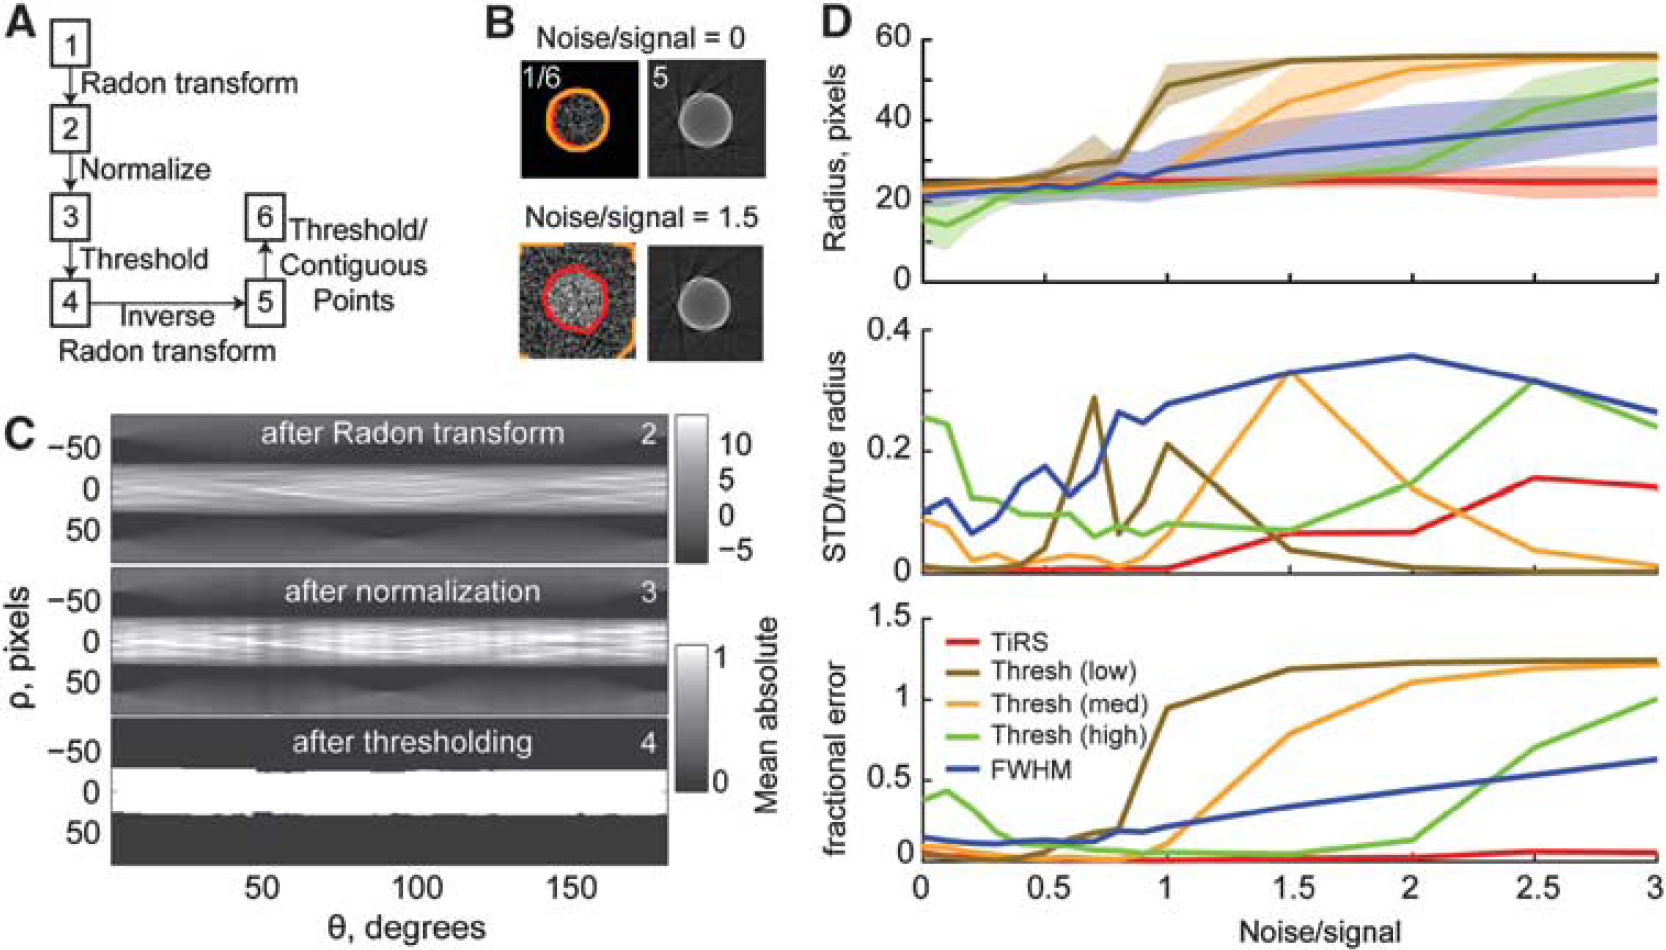
Determining penetrating vessel cross-sectional area by thresholding in Radon space is more robust to noise than pure thresholding or full-width at half-maximum (FWHM). In this and subsequent figures, the results of the thresholding in Radon space (TiRS) method is shown in red, pure thresholding with a low threshold is brown, pure threshold with a medium threshold is orange, pure threshold with a high threshold is green, FWHM blue, and the true result is a black line. Thick lines show means of 100 runs, shaded areas ± one s.d. (
We then compared the effects of adding noise to the image on the performance of the TiRS algorithm, the FWHM, and the pure thresholding algorithms. We used exponentially distributed additive noise, and quantified the accuracy by comparing the actual area of the circle with that detected by the three algorithms (Figure 3D, top). At low levels of noise, all algorithms performed well; however, as the noise increased, the accuracy of both the FWHM and pure thresholding algorithm degraded rapidly. The fractional error (s.d./true radius) for the TiRS method is lower than the other methods when the signal-to-noise ratio is above 1. The fractional error of the pure thresholding method decreases when the noise-to-signal ratio rises above some critical value that depends on the threshold parameter. This is because the pure thresholding algorithm consistently gives a woefully incorrect estimate of the area of the vessel, as it is incorrectly segmenting nearly the entire image as being above threshold (Figure 3B left bottom). This can be seen more clearly when we look at the mean absolute fractional error (Figure 3D bottom). As the noise increases, the FWHM method consistently overestimates the diameter of the simulated vessel. The pure threshold method (with a medium threshold parameter) also undergoes a change around S/N = 1, where very large portions of the thresholded image were detected as a contiguous region above threshold, resulting in large overestimation of the vessel area. This can somewhat be mitigated by choosing a higher threshold, but this results in inaccuracy at lower S/N ratios (Figure 3D). In practice, where the real diameter is not known, using the pure thresholding method is difficult, as slight changes in the threshold parameter will give differing measures of diameter, and it will not be clear which one is correct. This result clearly shows the robust performance of the TiRS algorithm to noise, and its superiority to standard FWHM and pure thresholding operations.
We then address the ability of the TiRS algorithm to accurately detect circles of different sizes. This is relevant, as penetrating cortical blood vessels constrict and dilate under natural conditions, and our algorithm should be able to detect these cross-sectional area changes. We use a signal-to-noise ratio of 3 for these simulations, in the regime where pure thresholding and FWHM measures are of comparable accuracy to the TiRS algorithm. In Figure 4, we plot the performance of these three algorithms versus the size of the circle to be detected. In Figure 4A, we plot the measured output versus the actual circle diameter for all three methods. All accurately gauge the circle diameter. In nearly all conditions, the TiRS method has lower noise (Figure 4B) and is more accurate (Figure 4C) than the FWHM and pure thresholding algorithms. The only exception is for simulated vessels with very large radii (>40 pixels), where the mean fractional error is somewhat higher than the pure thresholding algorithm, owing to the constant number of angles used in the Radon for all image sizes. For vessels with diameters of >80 pixels or so, it is advisable to increase the number of angles to enable a more accurate reconstruction. These issues are only apparent at vessel diameters much larger than those obtained under typical magnifications, but bears attention when analyzing real data.
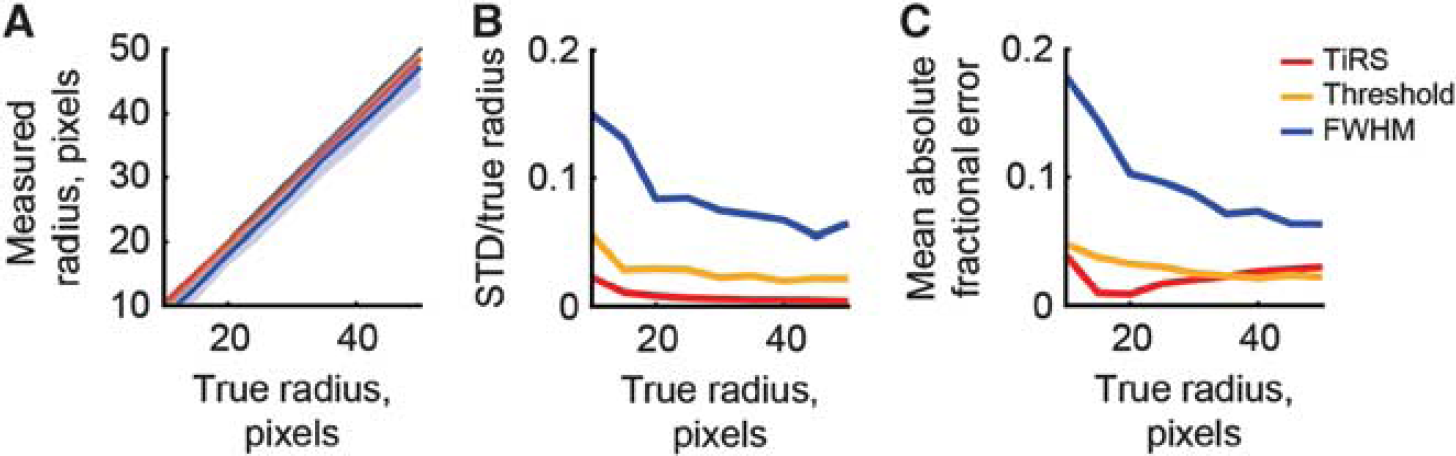
Accurate quantification of vessel cross-sectional area for different vessel sizes by the thresholding in Radon space (TiRS) method. The signal-to-noise ratio was 3. Thick lines show means of 100 runs, shaded areas ± one s.d. (
We then address how accurate the TiRS method is in determining the area when the object to be segmented departs from circularity. In Figure 5, we parametrically vary the ratio of the long axis to the short axis of an ellipsoidal region, while keeping the area constant, to mimic the sorts of shape changes of vessels seen in vivo. Shape changes in real vessels can be thought of as variations along the abscissa. Again, we have chosen a signal-to-noise ratio of 3, to give a fair comparison across methods. The FWHM is measured along the horizontal axis to demonstrate how (relatively) slight departures from circularity and shape changes can cause large errors in area measurements. A non-circular cross-section will cause the FWHM method to give a constant, potentially very large error in the area, and any changes in shape will cause some variability in this error. In Figure 5A, we see that both the pure thresholding and TiRS method accurately quantify the area of the ellipse across all long/short axes ratios, while the FWHM method is inaccurate and highly variable. The low precision and accuracy of the FWHM method is clearly shown in Figures 5B and 5C. The pure thresholding and TiRS methods have no problem with determining the area of non-circular objects.
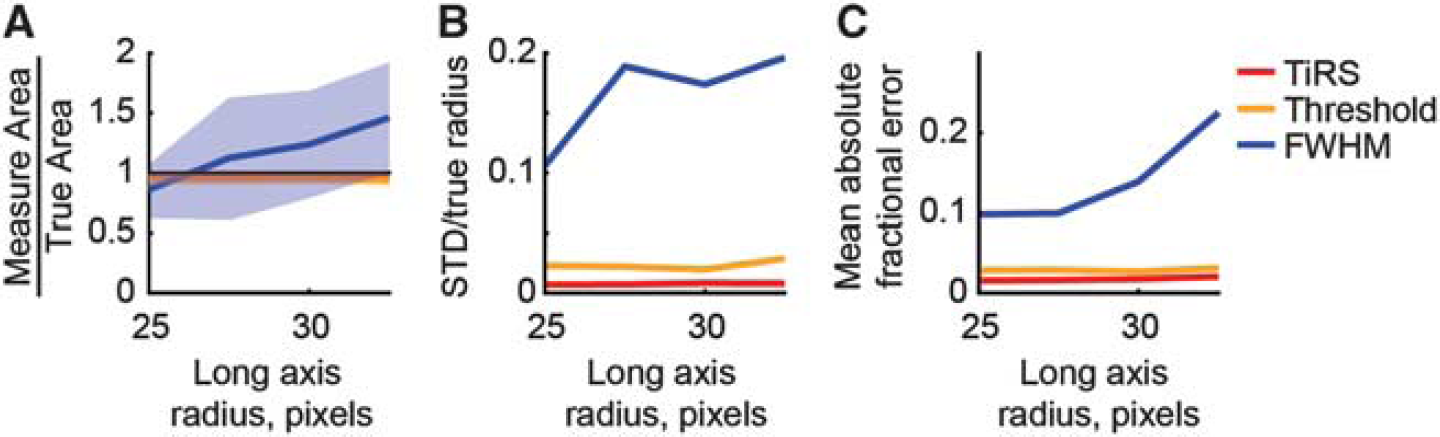
Accurate quantification of cross-sectional area during shape changes by the thresholding in Radon space (TiRS) method. The long axis was varied from 25 to 35 pixels. The short axis started at 25 pixels and was adjusted so that the total area remained constant. The signal-to-noise ratio was 3. Thick lines show means of 100 runs, shaded areas ± one s.d. (
Thresholding in Radon Space Method is more Precise than Full-Width at Half-Maximum in Quantifying the Diameterand Flux of Penetrating Vessels Imaged by Two-Photon Laser Scanning Microscopy
Finally, we demonstrate the greater precision of the TiRS method relative to the FWHM method on a population of vessels. We did not compare the pure thresholding algorithm because its sensitivity to the threshold parameter made it difficult to optimize for use with real data, where signal-to-noise can vary dynamically. Using 2PLSM, we took movies of penetrating vessels in the parietal cortex in an awake mouse head fixed on a spherical treadmill 34 (Figure 6). This example image shows a simultaneously imaged penetrating arteriole and an ascending venule 40 μm below the pia (Figure 6B). We used the TiRS method to calculate their cross-sectional areas. Frames taken from the movie show changes in the diameter of both the arteriole and venule, as well as the contour of area obtained with the TiRS method (Figure 6C, TiRS estimate of arterial in red, venule in blue). Full-width at half-maximum values were taken along the green and magenta axes. The diameters of the two vessels, with TiRS diameter assumed to be proportional to the square root of area, are plotted in Figure 6D. The FWHM estimates are substantially noisier than the TiRS estimate. As with spontaneous and sensory evoked in pial vessels, the artery shows fast dilation and relaxation, on a time scale of seconds, and the vein exhibits smaller dilations that are much slower, on the time scale of tens of seconds. 10 As the time courses of the arterial and venous responses are very different, it is unlikely that these changes in cross-sectional area are owing to movement. Because there is no ‘ground truth’ for the vessel diameter in real image data, as there was with simulations, we cannot compare the accuracy of the TiRS and FWHM methods for real data, but we can compare their precision. To quantitatively compare the precision of the FWHM and TIRS methods, we began by taking the temporal derivative of the diameters measured with TiRS and the average diameter obtained with two perpendicular FWHM estimates (Figures 6E and 6F). Because the dynamics of dilation and constriction are slow5,8,10,12 relative to the frame rate used here (6 to 9 Hz), frame-to-frame differences in diameter will primarily reflect measurement error of the respective methods, not real vessel diameter changes. The temporal derivative of the diameter obtained with the FWHM method is visibly noisier than the TiRS method (Figure 6E). To quantify the relative precision of the TiRS and FWHM methods, we plotted the ratios of the s.d. of the differentiated FWHM and TiRS traces for the same population of vessels (Figure 6F) as in Figures 1D and 1E. The ratio can be interpreted as the relative amount of ‘noise’ in the two methods, with a ratio of 1 implying equal noise, and ratios above 1 mean that the TiRS method has lower noise. Looking over a population of vessels, we see a substantial and significant advantage for the TiRS method over the FWHM (Figure 6F). These results demonstrate that the TiRS method gives a much more precise measure than the FWHM method on in vivo data.
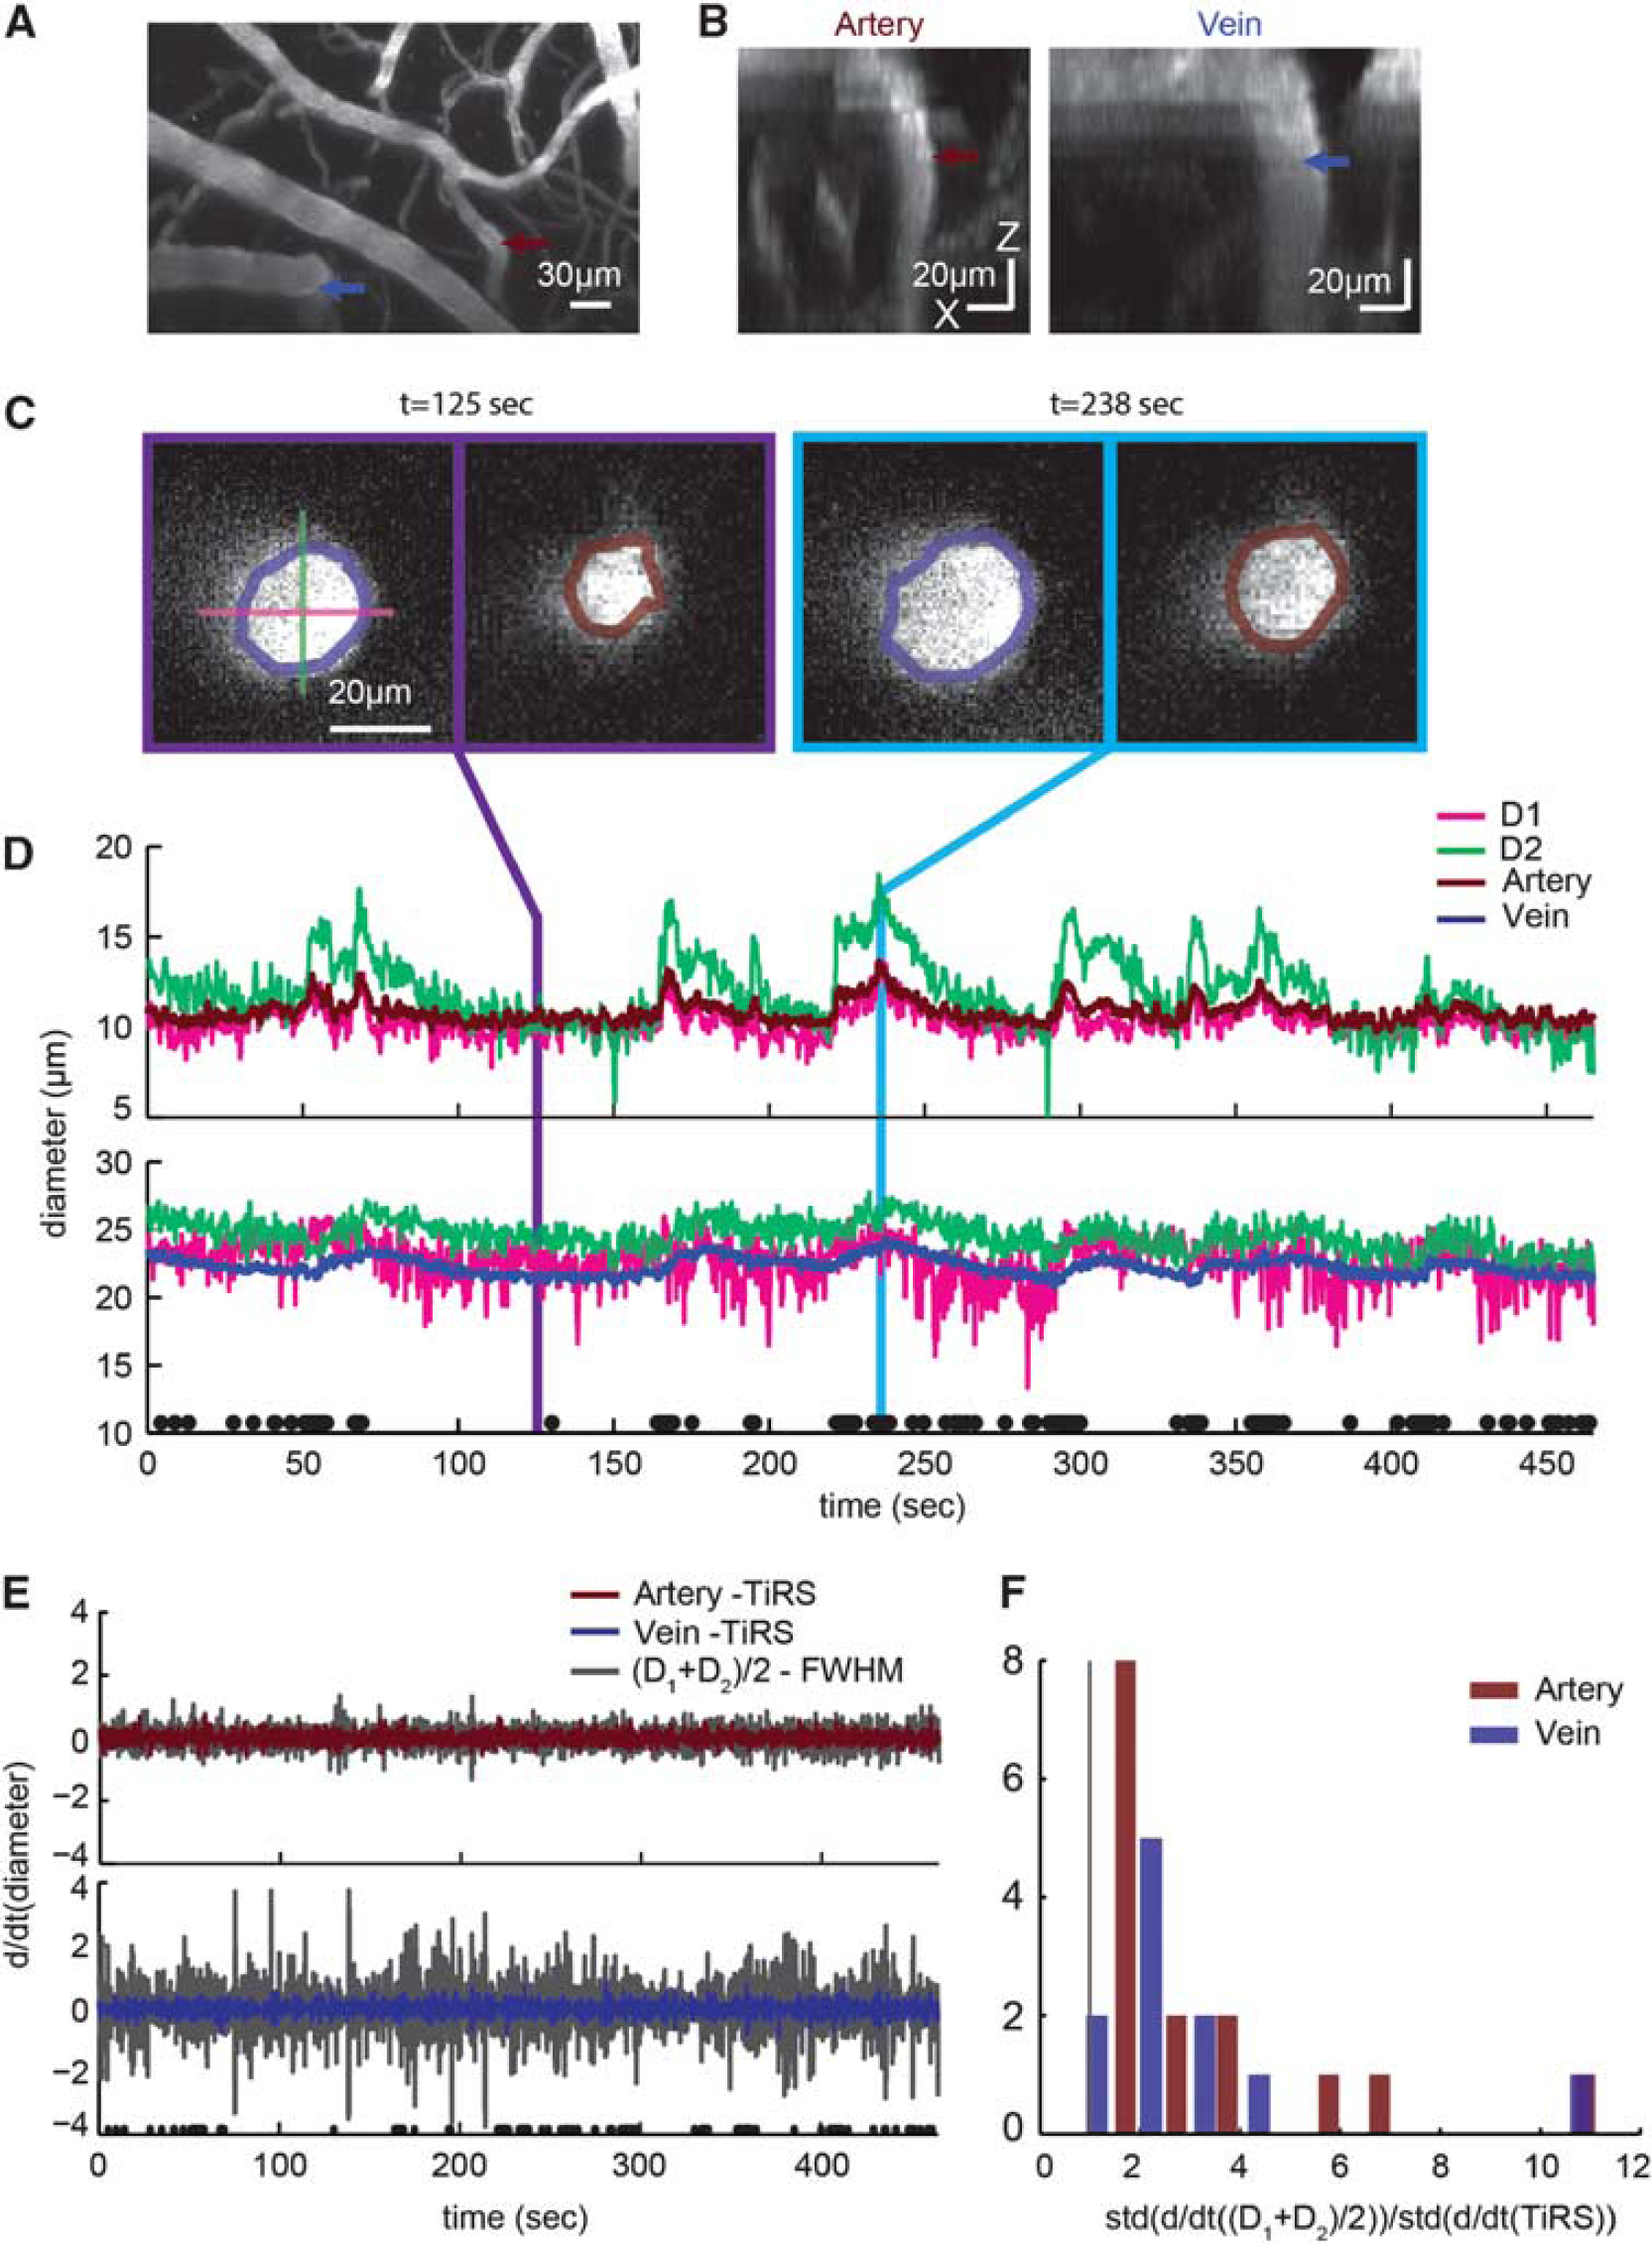
Comparing the results of full-width at half-maximum (FWHM) and thresholding in Radon space (TiRS) methods on in vivo two-photon laser scanning microscopy (2PLSM)-imaged vessel data. (
DISCUSSION
The cross-sectional area of a blood vessel is the prime determinant of its resistance, thus it is important to accurately quantify any changes in area if we want to understand the regulation of blood flow. 37 Given that the cross-section of blood vessels is non-circular, and that the cross-sectional shape can change, it is critical to use a method that correctly captures these changes. Here we show that because vessel shape varies and can be non-circular, a standard diameter method for determining vessel cross-sectional area, the full-width at half-maximum (FWHM), will give inaccurate and highly variable results owing to its reliance on a single axis of measurement. Because of this limitation, the FWHM is a poor choice for quantifying the diameters of penetrating arterioles and ascending venules of the cortex. We also showed that a thresholding algorithm, when precisely tuned, could perform better than the FWHM method, but not the TiRS method. However, the accuracy of the thresholding algorithm depends on the signal-to-noise ratio. In practice, the signal-to-noise ratio of the imaged vessel could vary dynamically during the course of the imaging session. The signal-to-noise could be changed by dilation of pial vessels,5,10 which can decrease the fluorescence signal owing to the absorption of incoming or emitted photons,5,38 changes in the background owing to out-of-plane fluorescence, 39 potentially from dilation of pial vessels containing fluorescent dye, or cross-talk 28 from another channel, such as one containing a calcium indicator, whose fluorescence will vary on a rapid time scale. Thus, it is greatly preferable to have an algorithm that gives reliable results in the face of a variable signal-to-noise, such as the TiRS method.
We exploited the global feature sensitivity of the Radon transform to quantify the cross-sectional area of a vessel. The TiRS method is analogous to taking the FWHM at multiple different angles, which gives it two advantages. First, that it can accurately determine area for convex shapes of varying size, which is important as blood vessel cross-sections can be non-circular and can change their shapes. Second, the TiRS algorithm effectively makes use of many measurements of diameter taken at a wide range of angles, making it very robust to noise, even more so than pure thresholding algorithms. Image transformations that operate on a global level, such as the Hough and Radon transforms, have been extensively used in computer vision to detect and localize particular parameterized shapes, 31 or to extract a parameter from these shapes, such as the slope of a line. 40 By using the global nature of the Radon transform to suppress noise, we can obtain more accurate measures of area of an object than other methods. The TiRS method's robustness to noise will likely prove helpful in studying vascular dynamics that cannot be averaged over trials, such as spontaneous dilations. 10
Footnotes
The authors declare no conflict of interest.