
Abstract
Brown adipose tissue (BAT) is able to generate heat and dissipate energy in response to cold exposure in mammals. It has recently been acknowledged that adult humans also have functional BAT, whose metabolic activity is reduced in obesity. In healthy humans, the cerebral mechanisms that putatively control BAT function are unclear. By using positron emission tomography (PET), we showed that cold-induced BAT activation is associated with glucose metabolism in the cerebellum, thalamus, and cingulate, temporoparietal, lateral frontal, and occipital cortices in lean participants, whereas no such associations were found under warm control conditions. The cold-induced increase in cerebral glucose metabolism was more robust in lean than obese participants. Cerebral glucose metabolism was not associated with skeletal muscle or white adipose tissue glucose uptake under warm or cold conditions. In conclusion, BAT metabolism was accompanied by the activation of specific cerebral regions, and this shows an uncharacterized role that the brain plays in the regulation of BAT function. In obese participants, the cold-induced response in cerebral activity was attenuated that provides a clue for obesity-induced impairment in BAT metabolism.
INTRODUCTION
Mammalian adipose tissue comprises white and brown adipocytes. White adipose tissue (WAT) functions as an energy storage reservoir, whereas brown adipose tissue (BAT) is thermogenetic In a cold environment, this thermogenicity is a response to sympathetic nervous system stimulation. 1 This is part of facultative thermogenesis that is regulated by the central nervous system. 2 The debate of the existence of functional BAT in adult humans was elucidated by advances in molecular imaging, and conclusive evidence of functional BAT in healthy humans was confirmed with biopsies.3,4 Human BAT is highly insulin sensitive and less active in obese humans, but the cause of the reduced BAT capacity, in obesity, is not clear. 5 – 7 The role of central nervous system in regulating human BAT and the effect of cold exposure on cerebral glucose metabolism are largely unclear and the relationship of BAT metabolism with brain function remains to be determined.8,9 There exists no prospective studies on cerebral BAT-controlling mechanisms with healthy participants and cold exposure. During cold exposure, the cerebral cortex is suggested to have an inhibitory influence on brain autonomic centers that control general sympathetic responses. 10
The regional glucose metabolic rate (GMR) reflects focal neural activity. 11 By using positron emission tomography (PET) with 2-deoxy-2-[ 18 F]fluoro-D-glucose (FDG) as a glucose analogue tracer, we elucidated the interactions of cerebral GMR with BAT GMR in 24 healthy lean and 17 obese adult humans during cold exposure. Because BAT is hypometabolic in obesity and could result from a central nervous system dysfunction, obese humans were studied. 12 As a control, eight lean and seven obese participants underwent treatment under warm conditions. The kinetic modeling of FDG-PET, used in this study, offers a precise determination of metabolic activity, because it provides an accurate metabolic uptake rate of glucose independently of the size of the participant, plasma glucose concentration, and administered dose and plasma clearance of FDG.
We hypothesized that cold activation of BAT could be linked to altered brain activity in healthy humans and that cold exposure affects cerebral glucose uptake. Our secondary aim was to characterize brain activation patterns during cold exposure and to test whether cold-induced cerebral GMR responses differ between lean and obese humans.
MATERIALS AND METHODS
Study Participants
The participants were 24 lean (body mass index 18.5–24.9 kg/m2) and 17 obese (body mass index ≥25.0 kg/m2) individuals. All participants were screened for medical history and metabolic status, as assessed on the basis of routine laboratory tests, 2-hour oral glucose tolerance test, electrocardiograms, and measured blood pressure. All participants were nondiabetic and euthyroid. The study protocol was approved by the Ethics committee of the hospital district of Southwest Finland, and the study was conducted in accordance with the Declaration of Helsinki. Written informed consent was obtained from all participants.
Study Design
Positron emission tomography imaging was performed after overnight fasting. All participants were studied under cold conditions, and eight lean and seven obese participants were also studied under warm control conditions. On the cold exposure day, the participants spent 2 hours wearing light clothing in a room with an ambient temperature of 17°C before PET imaging. During PET imaging, the cold exposure was induced by intermittent immersion (5 minutes in/5 minutes out) of the right foot in water at a temperature of 8°C. Interindividual variation in the insulating subcutaneous adipose tissue is minimal in this region. The foot was always placed in the water by investigators order minimize excess skeletal muscle (SM) activity. The PET imaging during warm control conditions was performed similarly, except no cold exposure was applied. The participants were covered with blanket, preventing sensation of cold.
Positron Emission Tomography Acquisition
In accordance with the standard manufacturing procedure of Turku PET Centre, FDG was synthesized. 13 Antecubital venous catheters were inserted in both arms, one for the injection of the PET tracer and the other for blood sampling. The PET scanning began from the cervical region. A 185-MBq bolus of FDG was administered intravenously, and a dynamic emission scan with variable frame lengths (1 × 1 minute, 6 × 0.5 minutes, 1 × 1 minute, 3 × 5 minutes, 2 × 10 minutes) was started simultaneously to measure GMR in the supraclavicular BAT, subcutaneous white adipose tissue (SCWAT), and SM in the cervical region. Next, dynamic scans with constant frame lengths (5 × 3 minutes) were performed in lower thoracic and abdominal regions to measure GMR in visceral adipose tissue (VAT). A dynamic brain scan with constant frame lengths (5 × 3 minutes) was started ~90 minutes after the injection of FDG. For emission data acquisition, GE Discovery VCT (General Electric Medical Systems, Milwaukee, WI, USA) and ECAT EXACT HR + scanners (Siemens/CTI, Knoxville, TN, USA) were used. The PET data were corrected for photon attenuation, physical decay, dead time, scatter, and random coincidences, and PET images were reconstructed with a matrix size of 128 × 128 using iterative reconstructions.
Quantification of Glucose Uptake in Brown Adipose Tissue, Subcutaneous White Adipose Tissue, Visceral Adipose Tissue, and Skeletal Muscle
The regions of interests for supraclavicular BAT, SCWAT, SM, and VAT were manually outlined. The regions of interests were drawn on transaxial planes on both lateral aspects of deltoid muscle and supraclavicular adipose tissue to define metabolic rates in SM and BAT, respectively. Cervical SCWAT was outlined posteriorly in the midline, and VAT at the level of the umbilicus. Vinci 2.54.0 software (Max-Planck Institute, Cologne, Germany) was applied in the image analysis. Subsequently, regional FDG time-activity curves were generated.
Image-derived input functions were created by drawing regions of interests in the aorta, after which whole-blood time-activity curves were generated. 14 In order to determine the plasma time-activity curves of FDG, rather than image-derived whole-blood time-activity curves, a conversion taking account of measured hematocrit values and continuing accumulation of FDG into red blood cells was applied. 15 The ratio of FDG concentration in red blood cells to concentration in plasma was assumed to rise monotonically with a slope of 0.0012/minute. 15 To extend the plasma FDG image-derived input functions to the brain scan, the aortic plasma image-derived input functions were extrapolated by fitting line to the natural logarithm of all aortic tracer concentrations against time. After adjusting for given FDG dose and lean body mass, the areas under the curve of the FDG input functions were similar for the lean and obese participants under warm (0.16 ± 0.02 versus 0.15 ± 0.02 min kg/cm3, lean versus obese, P = 0.66) as well as cold (0.16 ± 0.02 versus 0.16 ± 0.03 min kg/cm3, lean versus obese, P = 0.87) conditions.
After uptake into a cell, FDG is phosphorylated but not further metabolized and thereby trapped. 16 The GMR was determined using the model of Patlak. 17 A lumped constant value of 1.14 was used for adipose tissue, 1.20 for SM, and 0.52 for brain tissue.18–20
Voxel-Based and Regional Mapping of Cerebral Glucose Uptake
Voxel-based mapping of cerebral GMR was performed with SPM8 (http://www.fil.ion.ucl.ac.uk/spm/). Parametric GMR images were calculated voxel by voxel. First, dynamic brain PET images were summed, and normalized into MNI standard space; subsequently, these parameters were applied to the parametric GMR images. Spatially normalized GMR images were smoothed with 12-mm full width at half-maximum Gaussian kernel. The data were analyzed with random effects models contrasting GMR in (1) warm versus cold conditions; and (2) for lean versus obese participants, separately in warm and cold conditions. To quantify the relationship between GMR in the brain and BAT, we also regressed cerebral GMR with BAT GMR separately for warm and cold conditions. Age was introduced as a nuisance covariate for all between-participant comparisons. A statistical threshold of P<0.05 with false discovery rate correction at cluster level was applied in all analyses. To quantify regional GMR values, we generated regions of interests in frontal cortex, parietal cortex, temporal cortex, occipital cortex, limbic lobe, pons, sublobar regions, hypothalamus, and cerebellum using the WFU Pickatlas tool. 21 Subsequently, participant-wise GMR values were computed for each region. Glucose uptake in the brain and BAT were determined during the same PET imaging session order avoid differences in the imaging conditions and to minimize radiation dose.
Anthropometry, Blood Pressure, and Heart Rate
Fasting weight was measured barefoot and in light underwear to the nearest 0.1 kg using a digital scale (Seca, Hamburg, Germany). Height was measured using a stadiometer to the nearest 0.1 cm (Seca). Waist circumference was measured midway between the anterior superior iliac spine and the lower rib margin, and hip circumference at the level of the greater trochanters. Fat percentage was assessed in a fasting state after voiding using a bioimpedance method (Omron BF400, Omron Healthcare, Kyoto, Japan). Blood pressure and heart rate were measured using an electronic sphygmomanometer (Omron 711 Automatic IS, Omron Healthcare).
Blood Measurements and Oral Glucose Tolerance Test
Plasma glucose was determined with a glucose oxidase method (Analox GM9 Analyzer; Analox Instruments, London, UK). Fasting plasma glucose was always <7.0 mmol/l during screening and PET imaging. Glycosylated hemoglobin was determined using high-performance liquid chromatography (Variant II, Bio-Rad Laboratories, Hercules, CA, USA). Plasma insulin, thyroid-stimulating hormone, free plasma thyroxin (free T4), and free plasma triiodothyronin (free T3) concentrations were measured using the electrochemiluminescence immunoassay technique (Modular E180 automatic analyser; Roche Diagnostics GmbH, Mannheim, Germany). Plasma total cholesterol, high-density lipoprotein cholesterol, and triglycerides were determined photometrically (Modular P800, Roche Diagnostics). The concentration of plasma low-density lipoprotein was calculated using the Friedewald equation. 22 The concentration of norepinephrine in EDTA plasma was determined with high-performance liquid chromatography with coulometric electrochemical detection (Coulochem 5100A; ESA, Bedford, MA, USA) in 27 participants. 23
A 2-hour oral glucose tolerance test (75 g glucose) was performed after overnight fasting in a separate session. Venous blood samples for the determination of plasma glucose and insulin at 0, 15, 30, 45, 60, 90, and 120 minutes were obtained.
Statistical Analyses
Data were analyzed using mixed models analysis of variance and t-tests. Results are expressed as means ± s.d. Two-tailed P value of <0.05 was considered significant in analysis of variance and t-tests, and two-tailed P value of <0.01 was considered significant in correlation analyses. The following variables were log 10-transformed before statistical testing: BAT GMR, plasma thyroid-stimulating hormone, and free plasma tree T4. Statistical analyses were performed using SPSS 20.0.0. 24
RESULTS
In addition to the weight-related anthropometrics, lean and obese subjects were different in terms of blood glycosylated hemoglobin and plasma concentrations of high-density lipoprotein cholesterol, triglycerides, and free T3 (Table 1).
Characteristics of participants
HbA1c, glycosylated hemoglobin; HDL, high-density lipoprotein; LDL, low-density lipoprotein; TSH, thyroid-stimulating hormone; T4, free plasma thyroxin; T3, free plasma triiodothyronin. The basic characteristics of the participants are shown. The participants were divided into two groups: lean (BMI 18.5–24.9 kg/m2) and obese (BMI ≥25.0 kg/m2). Data are mean ± s.d.
P values are from two-tailed unpaired t-tests.
P values are from two-tailed unpaired t-tests except P value of gender difference that was calculated using χ 1 test.
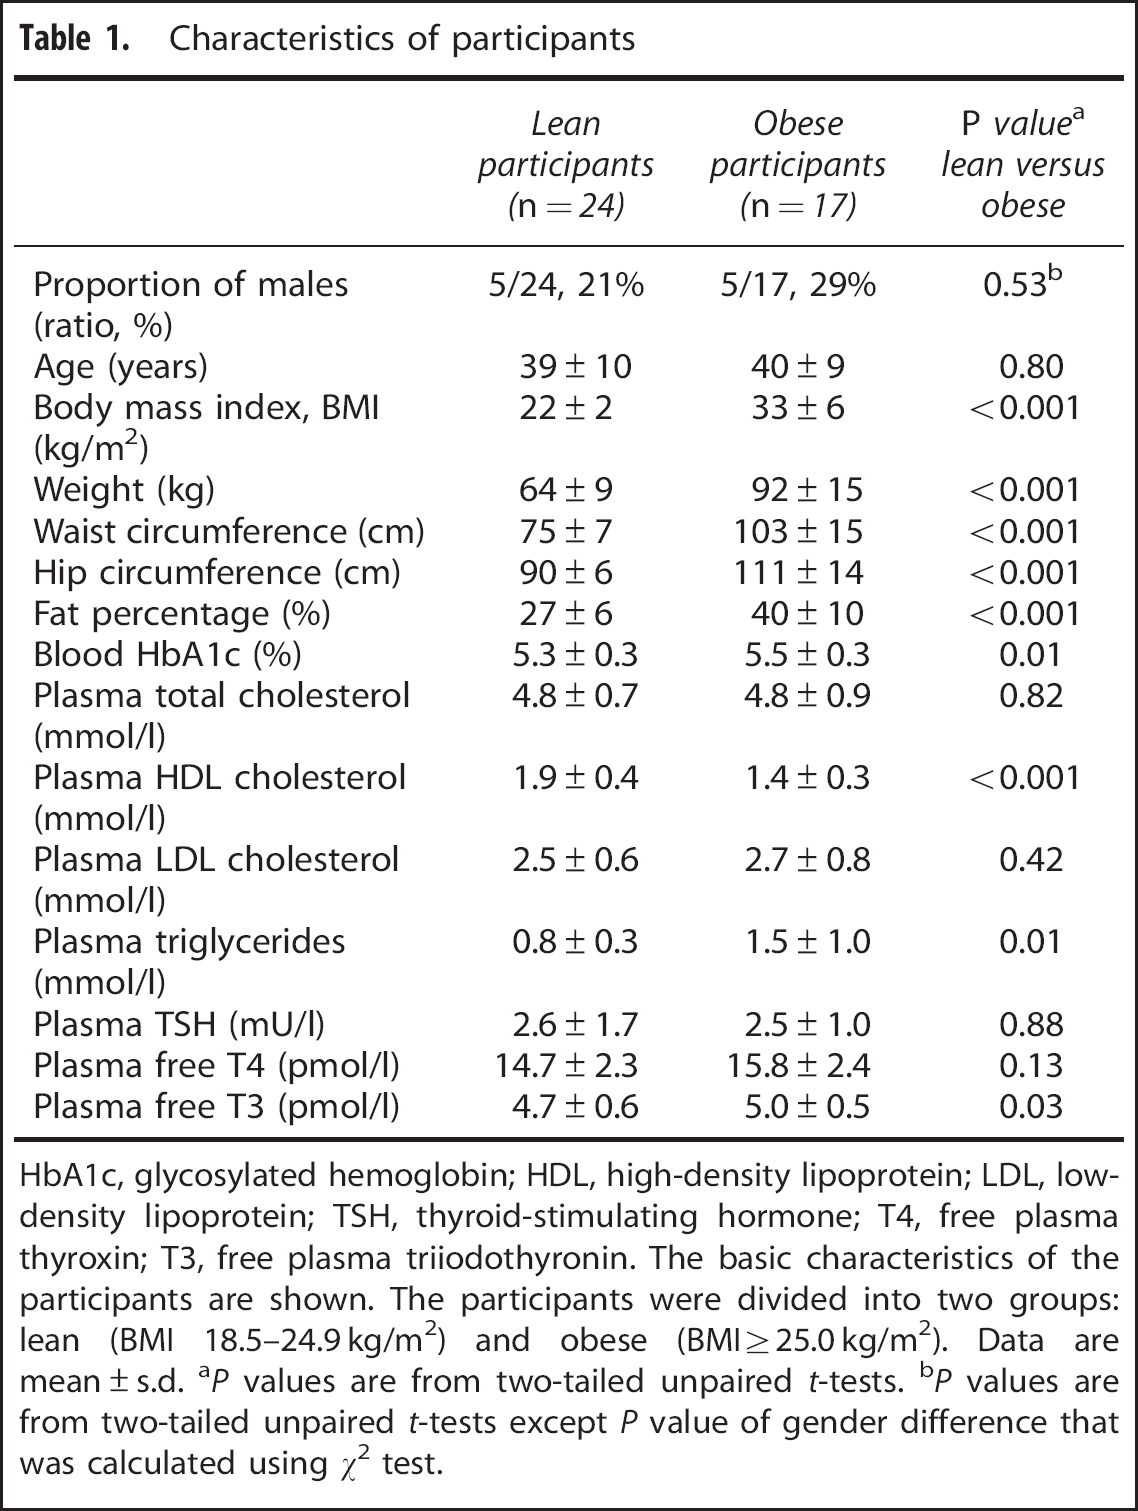
The BAT GMR and cerebral GMRs were measured during the same PET imaging session. Subsequently, statistical parametric mapping analysis revealed that BAT GMR was positively associated with GMR of cerebellum, thalamus, temporoparietal, lateral frontal, and cingulate cortices under cold conditions in the lean participants (Figure 1A), but no significant connections existed during warm conditions.
Relationship of glucose metabolic rates between the brain and brown adipose tissue (BAT).
In the obese participants, however, no significant associations could be found between glucose metabolism in BAT and brain during cold (Figure 1B) or warm conditions.
The GMR was also measured in SCWAT, VAT, and SM. Unlike BAT, we could not establish any associations between their metabolism and the cerebral GMR during cold (Table 2) or warm (Table 3) conditions. Furthermore, no associations were found between cerebral GMR and blood pressure or plasma concentrations of free thyroxin, free triiodothyronin, lactate, and norepinephrine (Supplementary Tables S1 and S2).
Correlations between cerebral glucose metabolic rates and other measurements in lean and obese participants during cold conditions
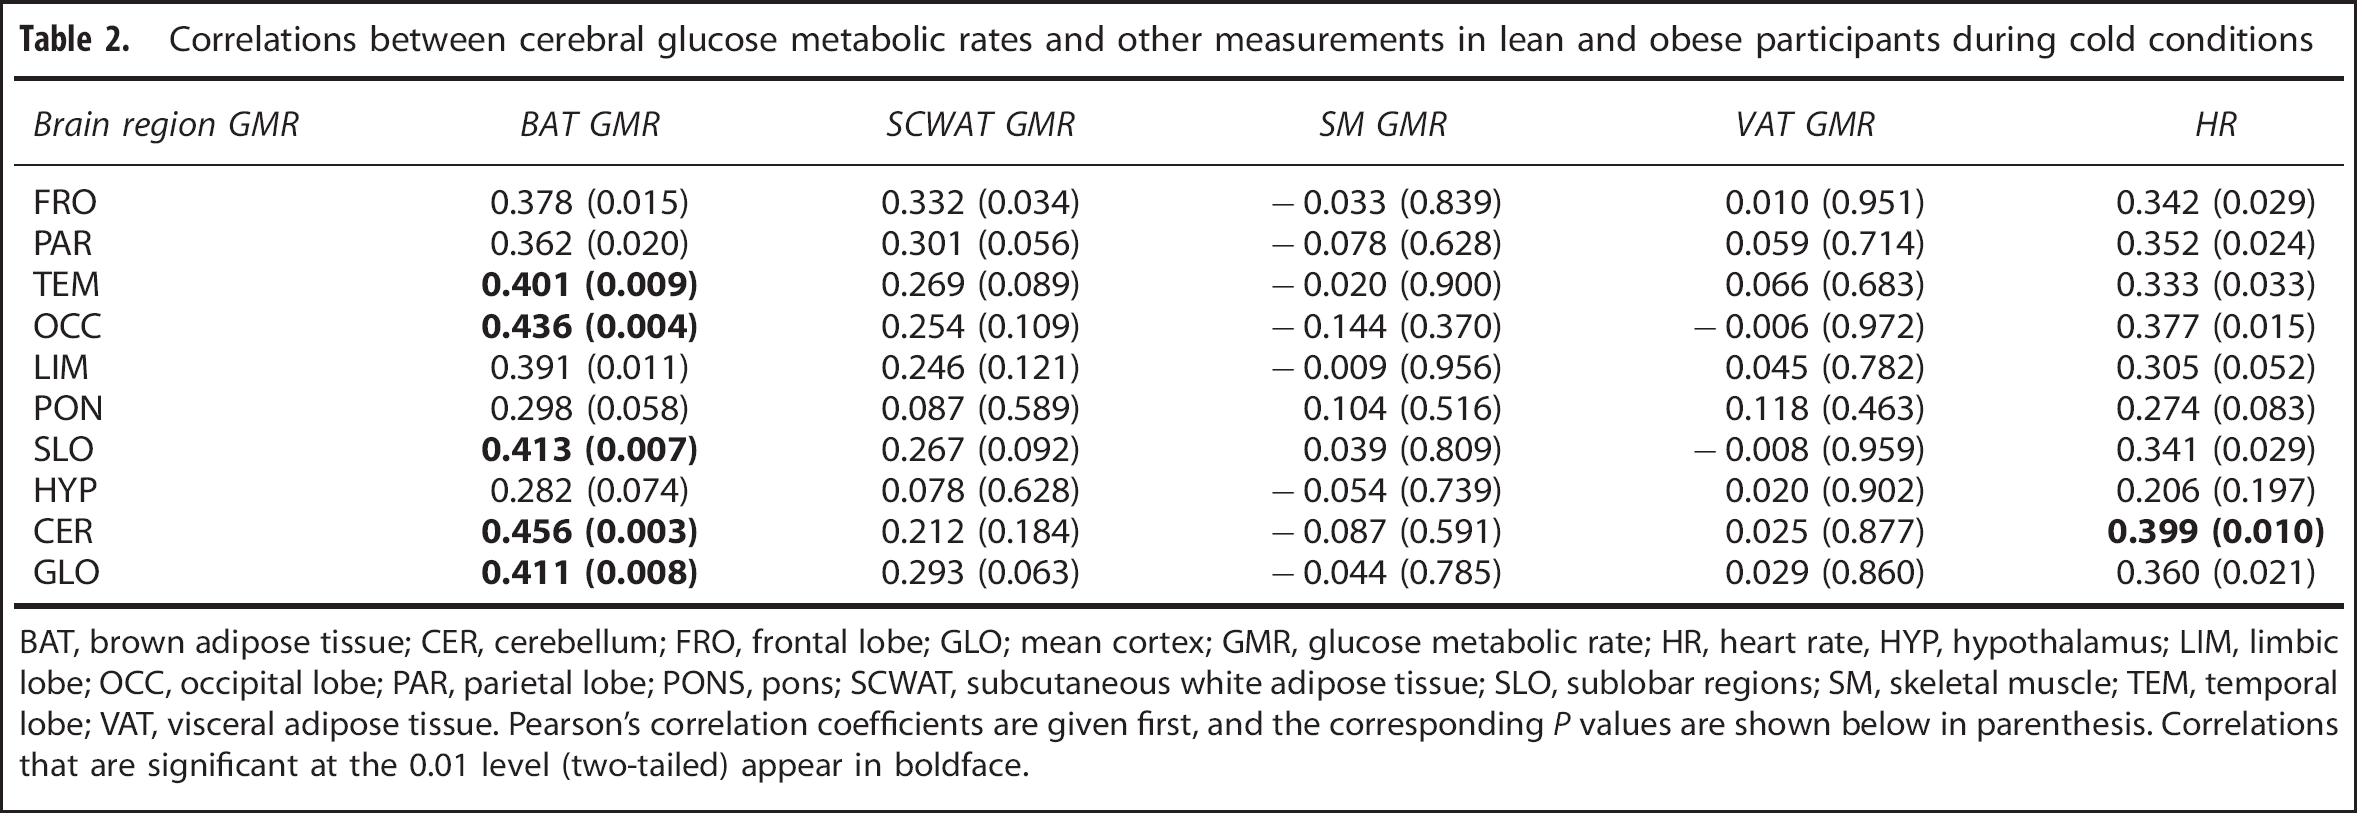
BAT, brown adipose tissue; CER, cerebellum; FRO, frontal lobe; GLO; mean cortex; GMR, glucose metabolic rate; HR, heart rate, HYP, hypothalamus; LIM, limbic lobe; OCC, occipital lobe; PAR, parietal lobe; PONS, pons; SCWAT, subcutaneous white adipose tissue; SLO, sublobar regions; SM, skeletal muscle; TEM, temporal lobe; VAT, visceral adipose tissue. Pearson's correlation coefficients are given first, and the corresponding P values are shown below in parenthesis. Correlations that are significant at the 0.01 level (two-tailed) appear in boldface.
Correlations between cerebral glucose uptake rates and other measurements during warm conditions
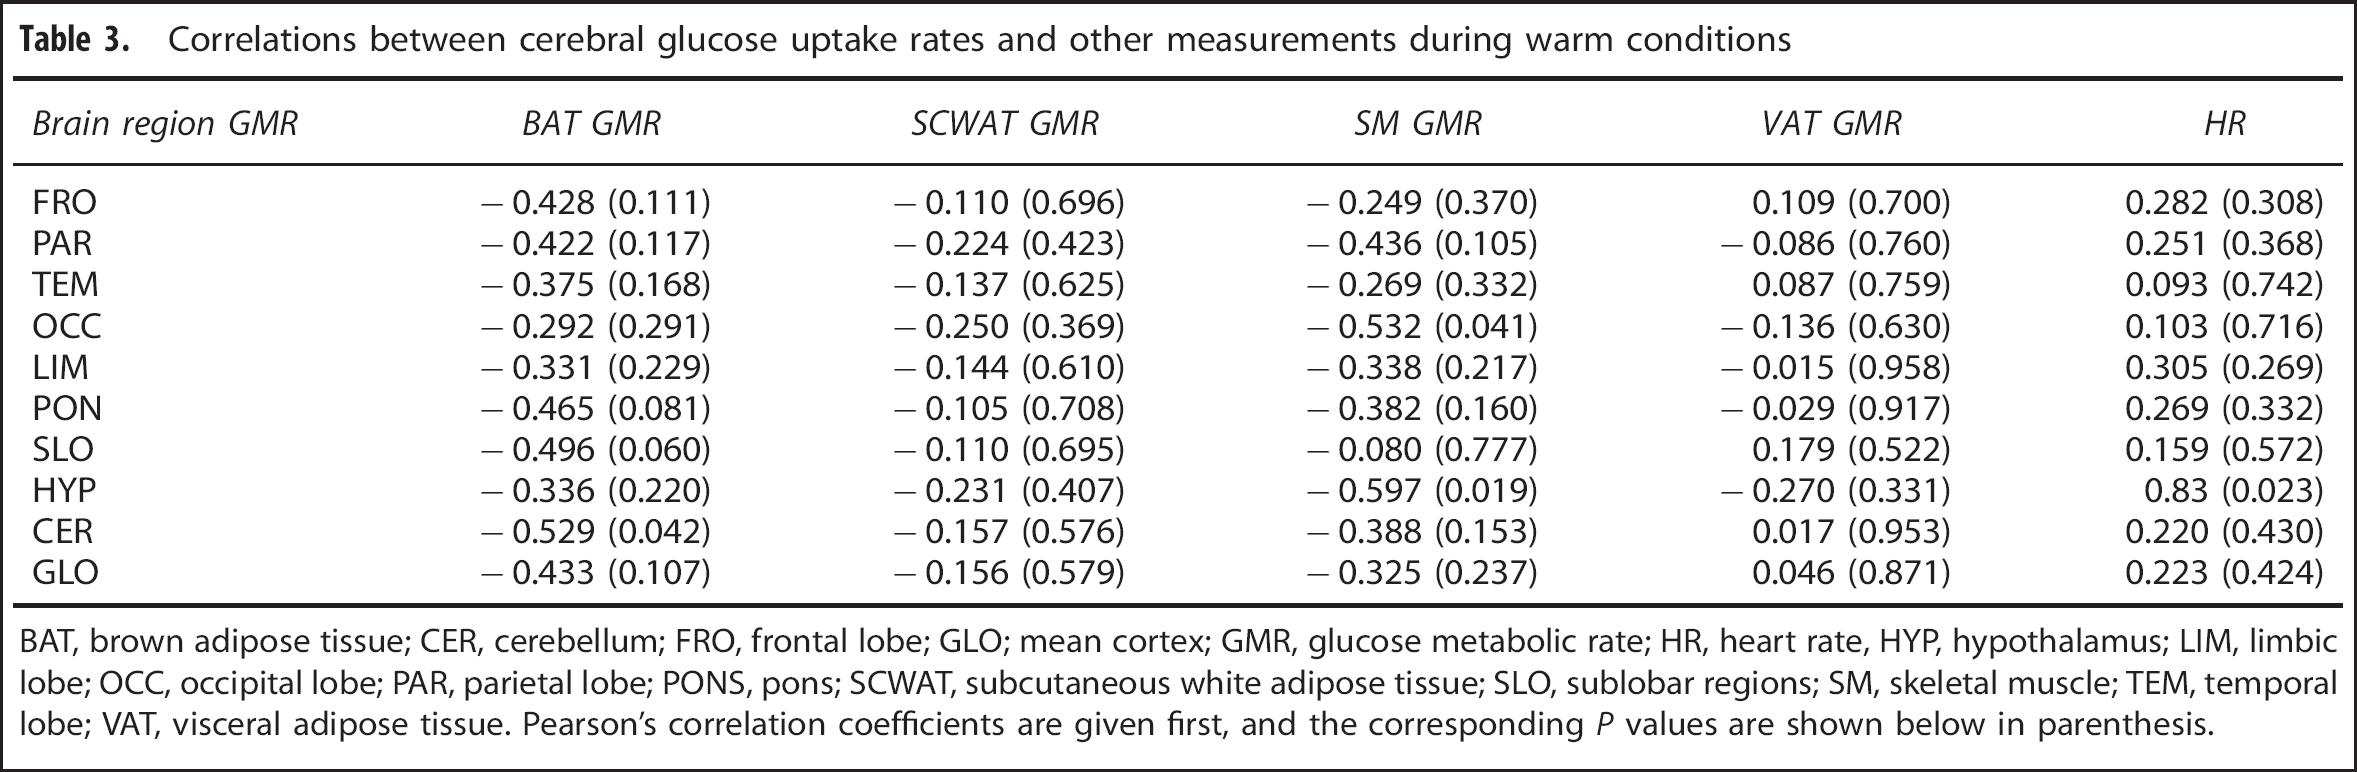
BAT, brown adipose tissue; CER, cerebellum; FRO, frontal lobe; GLO; mean cortex; GMR, glucose metabolic rate; HR, heart rate, HYP, hypothalamus; LIM, limbic lobe; OCC, occipital lobe; PAR, parietal lobe; PONS, pons; SCWAT, subcutaneous white adipose tissue; SLO, sublobar regions; SM, skeletal muscle; TEM, temporal lobe; VAT, visceral adipose tissue. Pearson's correlation coefficients are given first, and the corresponding P values are shown below in parenthesis.
We also compared brain GMR measurements during warm and cold conditions. Cerebral glucose metabolism increased uniformly in the neocortex, in subcortical regions, and the cerebellum (Figure 2A) during cold exposure. The highest cold-driven GMR elevation was observed in the parietal and frontal lobes. The GMR was not altered in the limbic system, the pons, and the hypothalamus (Figure 2B). No lateralization of cerebral glucose metabolism could be found during cold exposure.
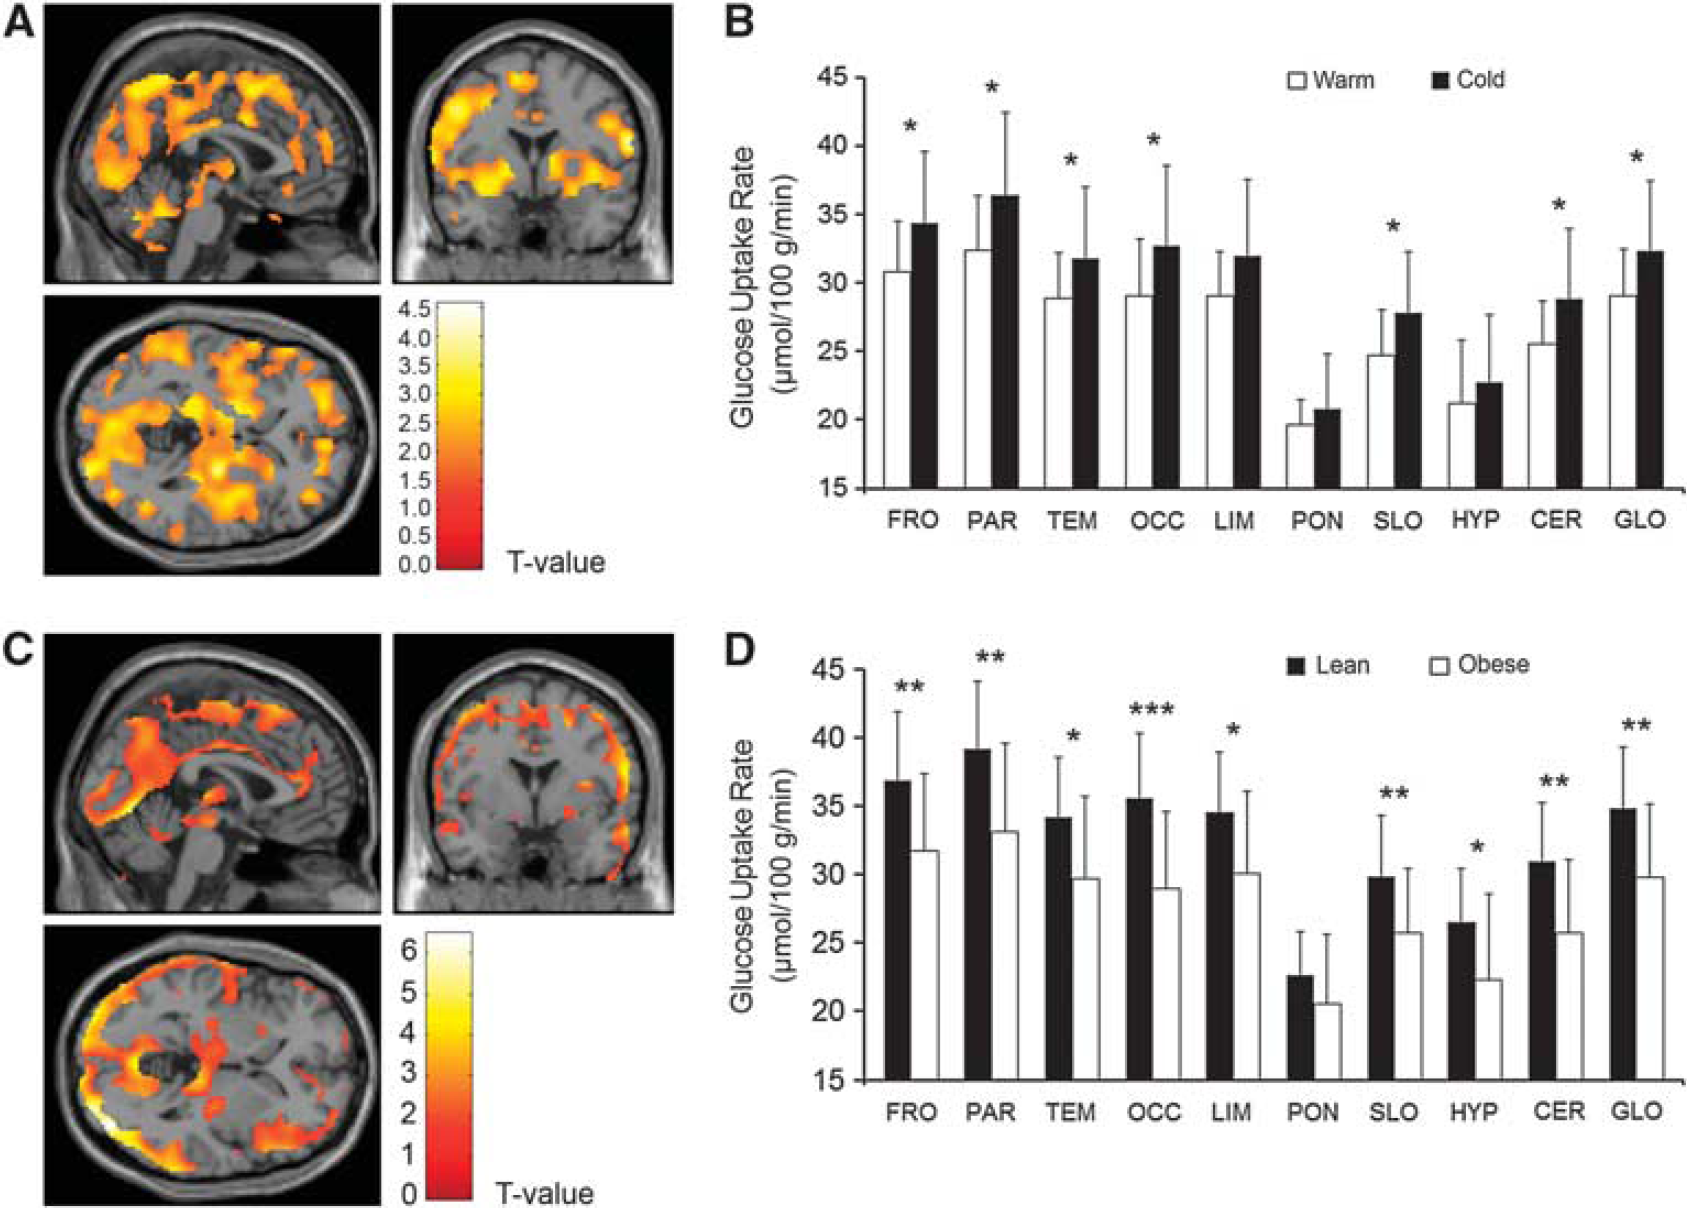
Cerebral glucose metabolic rates in lean and obese participants during cold conditions.
In the obese participants, it was found that the cold-induced increment in the cerebral GMR was blunted significantly (Figures 2C and D), whereas no differences between lean and obese participants were observed during warm conditions (Figures 3A and B).
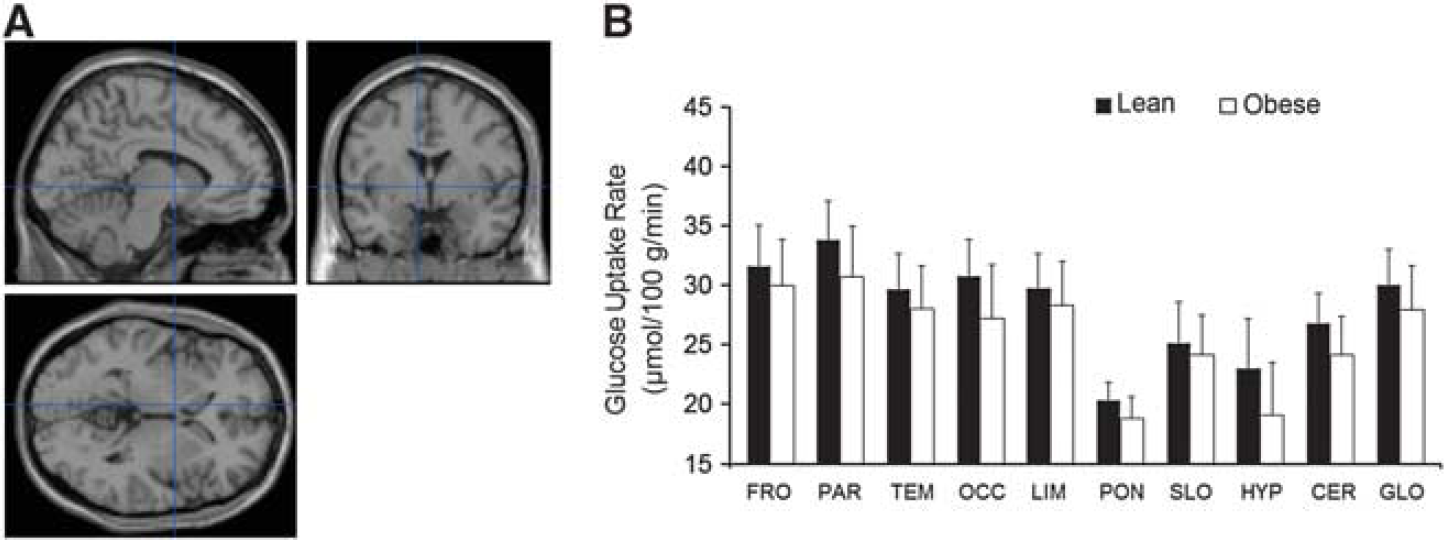
Cerebral glucose metabolic rates in lean and obese participants during warm conditions. (
DISCUSSION
Studies have previously suggested that no significant differences exist in the resting brain glucose metabolism between lean and obese healthy humans. Here, we show for the first time that lean and obese humans (Table 1) are different in their cold-induced cerebral glucose uptake capacity (Figures 2C and D); however, as expected, no significant differences were found under warm conditions (Figures 3A and B). However, earlier observations indicate different cerebral glucose uptake responses to insulin stimulation between lean and obese humans. 25 Taken together, cerebral glucose uptake seems to be affected by obesity at least under certain physiologic conditions.
The close relationship between the metabolism of specific cerebral regions and BAT function in the lean participants shows that BAT thermogenesis involves diverse and intense neural activation in the brain. The physiologic central mechanisms of BAT activation in humans during cold exposure have not been clarified before. It has previously been found in a group mainly consisting of cancer patients that BAT activity is associated with hypermetabolism in the right inferior parietal lobule and hypometabolic regions in the left insula and right cerebellum. 8 Conversely, humans with active BAT have previously been found to have lower activity in the inferior parietal lobule, limbic system, and frontal lobe, and higher activity in the precuneus, compared with humans without BAT activation. 9 No cold exposure was applied in those studies.
The positive association of BAT metabolism with the cingulate cortex that was found may be related to the regulation of the sympathetic response. 26 Increased activity was also detected in the cerebellum. The cerebellum processes sensory input that might explain its activity in conjunction with cold exposure. 27 The cerebellum is involved in the coordination of sympathetic and parasympathetic information and lesions have fundamental impact on autonomic functions, especially in the regulation of the cardiovascular system. 28 In concert with the latter notion, we found a significant association with the heart rate and cerebellar GMR during cold exposure (Table 2). Increased cerebellum metabolic activity associates with hyperthermia. This suggests it has a thermoregulatory function. 29 Here, we show an additional role for the cerebellum in the regulation of BAT function.
It is challenging to measure both BAT and brain glucose uptake during the same imaging session, but in our view, it would have been inconclusive to try to establish a connection between BAT activity and cerebral function, if the BAT and brain measurements had been carried out in different PET imaging sessions. However, the brain and BAT measurements were not performed exactly at the same time, causing minor uncertainty in the interpretation of the results. Ideally, brain measurements should have been carried out first followed by the cervical region BAT scan.
In accordance with prior studies, we observed that cold exposure elicited activation of the somatosensory cortex.30,31 Cerebral glucose uptake was not lateralized under cold conditions, although cold exposure was applied on the right lower extremity. This was probably because of the robust nature of the cold exposure that caused diverse physiologic changes, including sensory activation, stimulation of BAT, and change in the heart rate. Increased cold-induced cerebellar FDG activity was found in one study investigating cold-induced glucose metabolism. 10 In contrast to this study, we did not detect decreased metabolism in either insula during cold exposure. The reason for this discrepancy could stem from the fact that in study participants, cold exposure and quantification of FDG-PET data differed considerably.
Based on animal experiments, the neural pathways from the thermoreceptors to hypothalamus and subsequent efferent route to BAT are well characterized. The preoptic area in the hypothalamus has an essential role in activating BAT sympathetic preganglionic neurons. 32 The hypothalamus has a key role in controlling BAT function and body temperature. 33 We did not detect change in the glucose metabolism of hypothalamus by cold exposure (Figure 2B). We did not observe an association between BAT and the hypothalamic GMR (Table 2). However, it was found that GMR in the hypothalamus was higher in lean than in obese participants during cold exposure (Figure 2D), implying that the hypothalamus was less active in obese humans. This can be interpreted that the obese participants were able to defend their core body temperature with less involvement of the hypothalamic nuclei as compared with the lean participants. Nevertheless, these results should be interpreted with caution because the hypothalamus comprises multiple nuclei that reside in a small area and have versatile functions. 34
In conclusion, BAT metabolic activity is accompanied by the activation of specific cerebral regions in healthy lean humans, showing a role for neuronal modulation of human BAT metabolism. Furthermore, the cold-induced response in cerebral activity is attenuated in obese humans, suggesting for a mechanism for impaired BAT activation. Future studies on human BAT should focus more on the central BAT-controlling mechanisms because better understanding of the central nervous system process could provide novel approaches to stimulate BAT thermogenic activity and combat obesity.
Footnotes
The authors declare no conflict of interest.
ACKNOWLEDGMENTS
The authors thank Robert M Badeau (
References
Supplementary Material
Please find the following supplemental material available below.
For Open Access articles published under a Creative Commons License, all supplemental material carries the same license as the article it is associated with.
For non-Open Access articles published, all supplemental material carries a non-exclusive license, and permission requests for re-use of supplemental material or any part of supplemental material shall be sent directly to the copyright owner as specified in the copyright notice associated with the article.