
Abstract
This study aimed to investigate the changes in functional connectivity (FC) within each resting-state network (RSN) and between RSNs in subcortical stroke patients who were well recovered in global motor function. Eleven meaningful RSNs were identified via functional magnetic resonance imaging data from 25 subcortical stroke patients and 22 normal controls using independent component analysis. Compared with normal controls, stroke patients exhibited increased intranetwork FC in the sensorimotor (SMN), visual (VN), auditory (AN), dorsal attention (DAN), and default mode (DMN) networks; they also exhibited decreased intranetwork FC in the frontoparietal network (FPN) and anterior DMN. Stroke patients displayed a shift from no FC in controls to negative internetwork FC between the VN and AN as well as between the VN and SMN. Stroke patients also exhibited weakened positive (anterior and posterior DMN; posterior DMN and right FPN) or negative (AN and right FPN; posterior DMN and dorsal SMN) internetwork FC when compared with normal controls. We suggest that subcortical stroke may induce connectivity changes in multiple functional networks, affecting not only the intranetwork FC within RSNs but also the internetwork FC between these RSNs.
INTRODUCTION
The motor pathway is frequently impaired because of subcortical infarction. Under these conditions, stroke lesions commonly extend beyond the range of the motor pathway, depending on the arteries occluded. The motor function of these stroke patients may experience recovery even in the absence of rehabilitation therapy. 1 After subcortical infarction, the structural and functional changes within the motor system have been extensively studied using neuroimaging techniques.2, 3 For example, structural magnetic resonance imaging has revealed not only extensive atrophy in brain regions that connect with stroke lesions but also increased grey matter volume and cortical thickness in motor-related areas either during spontaneous recovery or after treatments. 4 Diffusion imaging showed both impairment and modification of motor-related white matter fiber tracts in stroke patients. 5 Task-based functional magnetic resonance imaging (fMRI) has also demonstrated altered activation of the motor system. 6 However, little attention has been paid to the functional changes in other functional networks and their interaction between the functional networks after subcortical stroke.
The brain is a complex network consisting of multiple subnetworks serving different functions. 7 A focal subcortical lesion may impair a certain subnetwork, thus affecting the functional organization of the impaired network. For example, a longitudinal study has demonstrated that functional connectivity (FC) changed more in networks containing lesions during recovery when compared with unaffected networks. 8 However, these subnetworks are connected with each other and cooperate to maintain efficient brain function. Therefore, the impairment of a single subnetwork may affect internetwork connectivity extending beyond the range of the impaired subnetwork. 9 Region of interest-based resting-state FC analysis has been used to characterize the intranetwork FC changes after stroke and has revealed a series of impressive findings. 10 Most of these studies focused on the sensorimotor network (SMN).11, 12 Only a few studies have revealed that stroke patients also show FC changes in other subnetworks, including the attention-related networks, 13 the default mode network, 14 and the frontoparietal network (FPN) and the cingulo-opercular network. 15 Recently, graph theory has been used to characterize the network efficiency of the brain after stroke.16, 17 However, neither region of interest-based FC analysis nor graph analysis of the whole brain network can provide a full picture of the impairments in and the compensation of intra and internetwork FC of the subnetworks in stroke patients.
Independent component analysis (ICA) of resting-state fMRI data, a multivariate data-driven analysis method, can identify multiple resting-state networks (RSNs) and investigate intra and internetwork FC in vivo. 18 The ICA has been applied to analyze intra and internetwork FC in many neurologic and psychiatric disorders, such as the Alzheimer's disease 19 and schizophrenia. 20 However, the ICA method has not been applied to characterize intra and internetwork FC alterations after stroke. In the present study, we performed an ICA analysis of resting-state fMRI data to investigate both the impairment in and the compensation of intra and internetwork FC in well-recovered patients with chronic subcortical infarction. The principal novelty of this work is the analyses of both intra and internetwork connectivity in stroke patients.
MATERIALS AND METHODS
Subjects
The experiment was approved by the Ethical Committee of Tianjin Medical University General Hospital, guidelines according to Tianjin Medical University General Hospital were followed, and written informed consent was obtained from each subject before the study. A total of 25 patients (7 females and 18 males; mean age: 56.2 years; range: 42 to 72 years) were included in this study. Inclusion criteria were as follows: (1) first-onset stroke; (2) single lesion of ischemic infarct involving the internal capsule and neighboring regions; (3) manifesting motor deficit at stroke onset; (4) right-handedness before stroke; (5) time after stroke onset of >6 months; (6) significant recovery in global motor function based on an upper extremity Fugl–Meyer test score of >60 and a whole extremity Fugl–Meyer test score of >90. Exclusion criteria were as follows: (1) recurrent stroke after initial onset; (2) any other brain abnormalities; (3) severe white matter hyperintensity manifesting as a Fazekas scale 21 score >1; (4) conscious disturbance or uncooperativeness; (5) history of drug dependency or psychiatric disorders; (6) substantial head movement during the fMRI data acquisition. The demographic and clinical data are provided in Table 1, and the lesion location of each subject is displayed in Figure 1. Twenty-two age-matched healthy subjects (11 females and 11 males; mean age: 57.2 years; range: 47 to 74 years) were also recruited as controls.
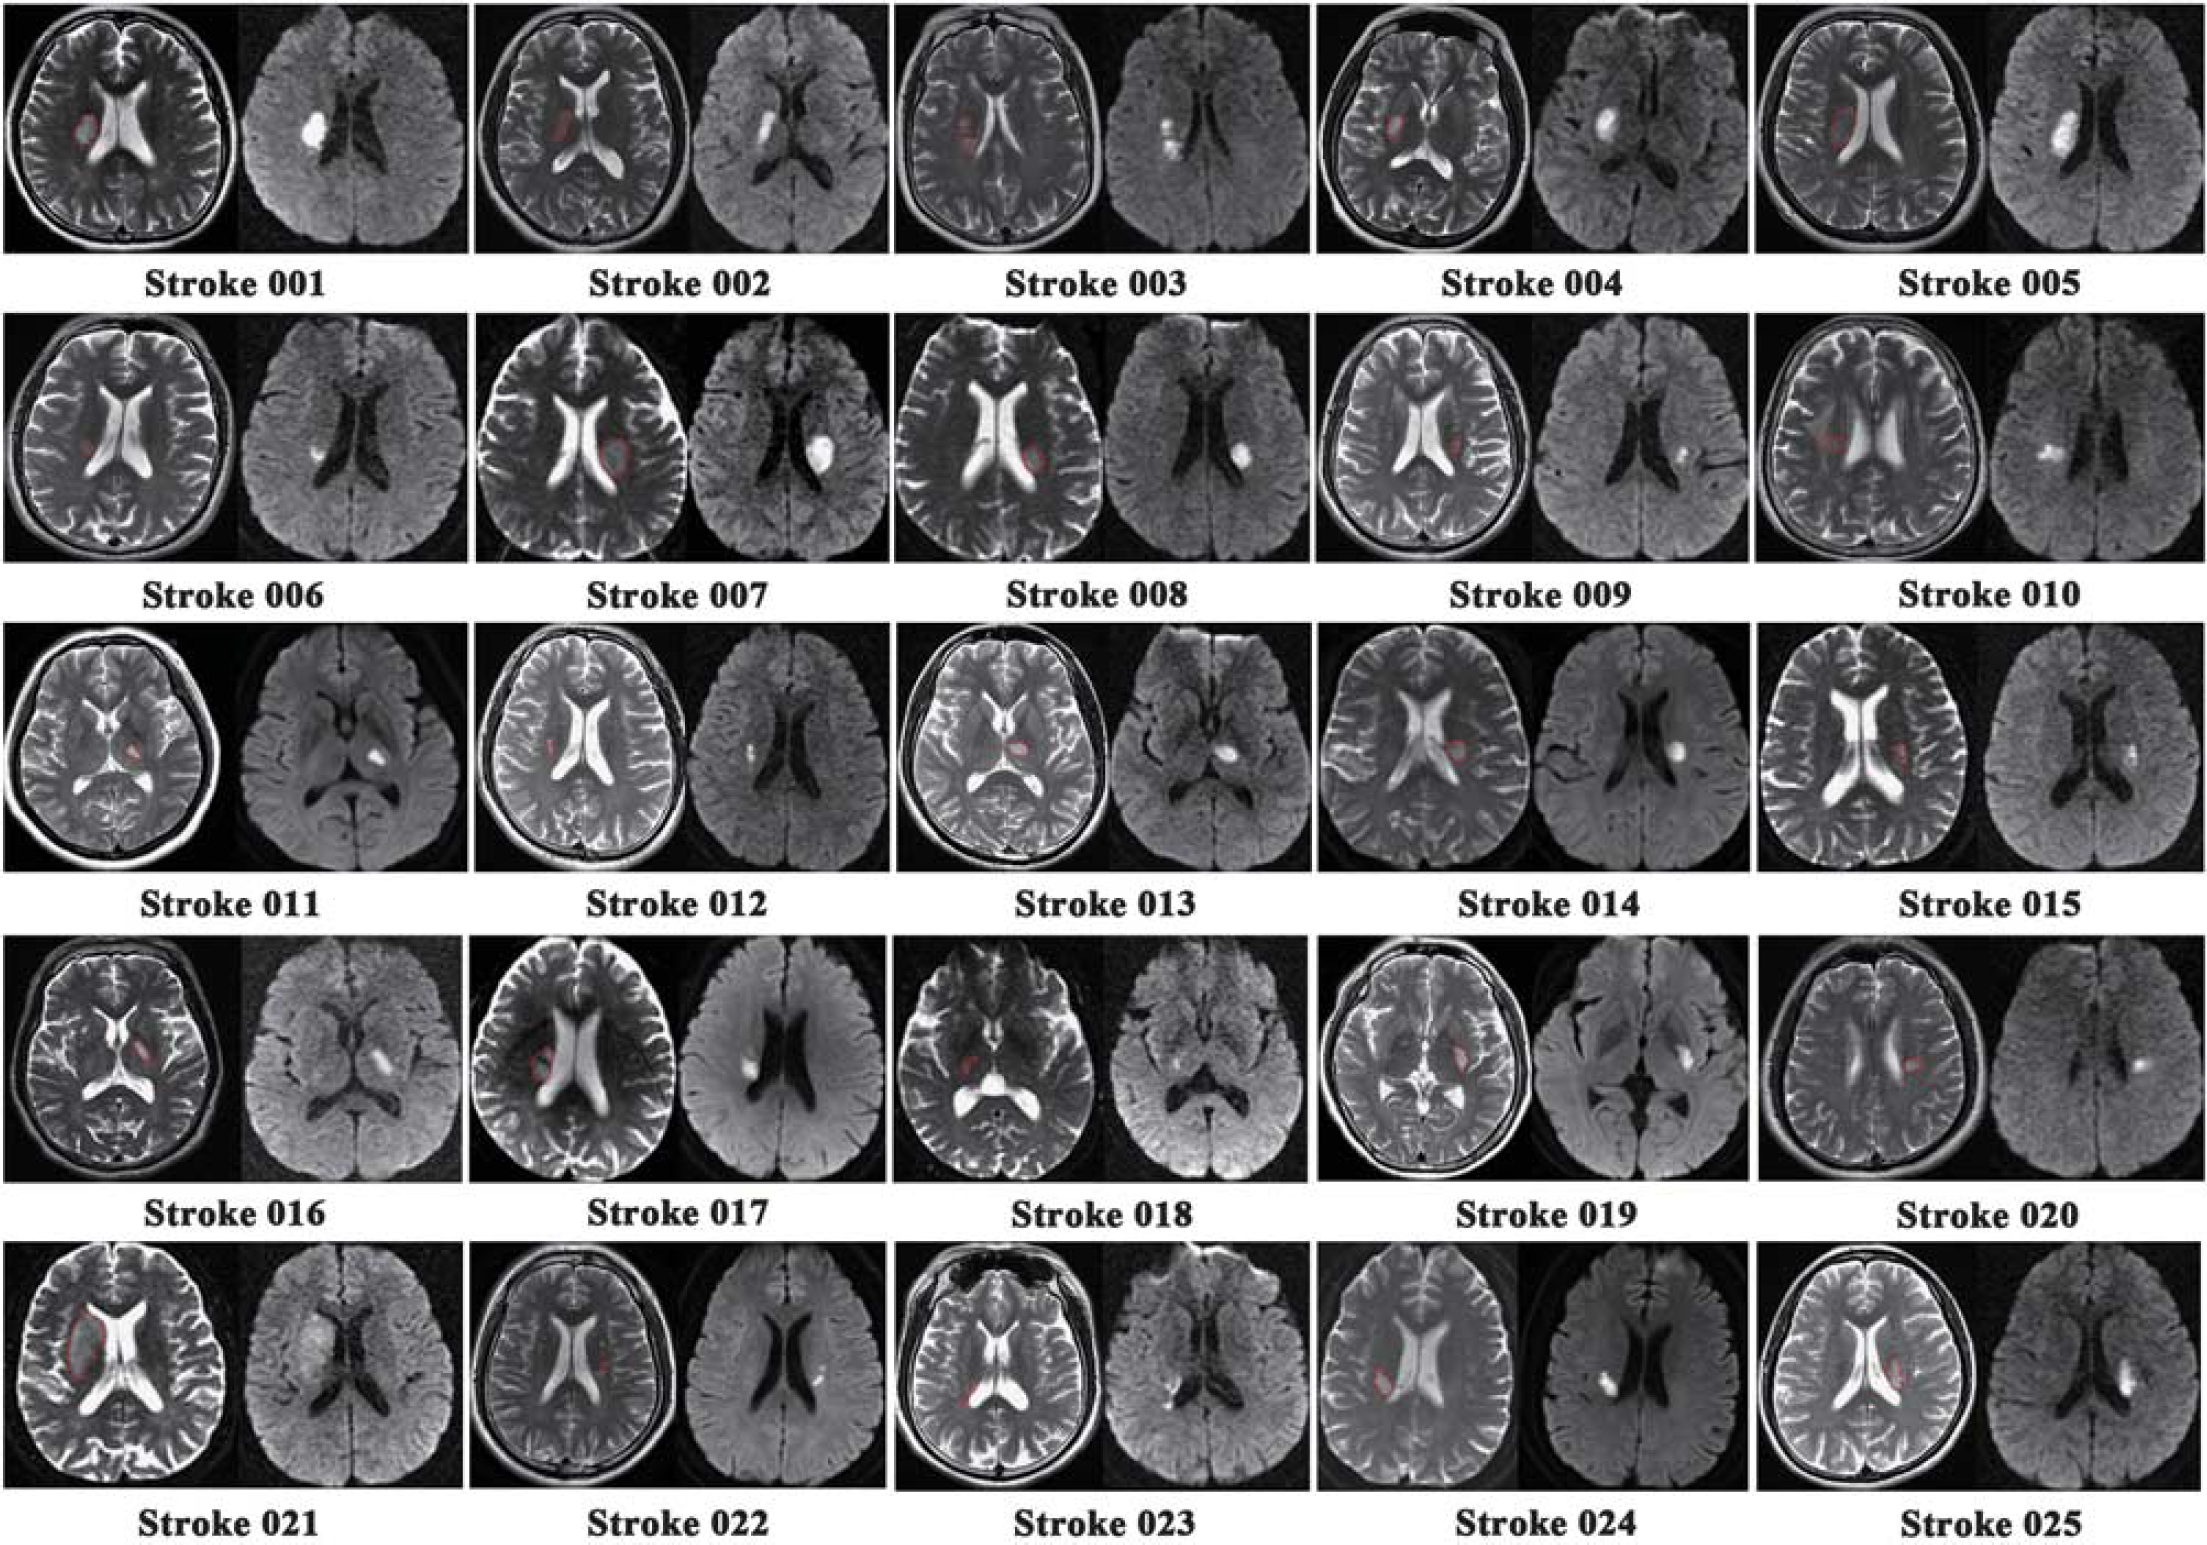
Lesion locations of stroke patients are displayed on axial slices of the T2-weighted images and diffusion-weighted images.
Demographic and clinical data of stroke patients
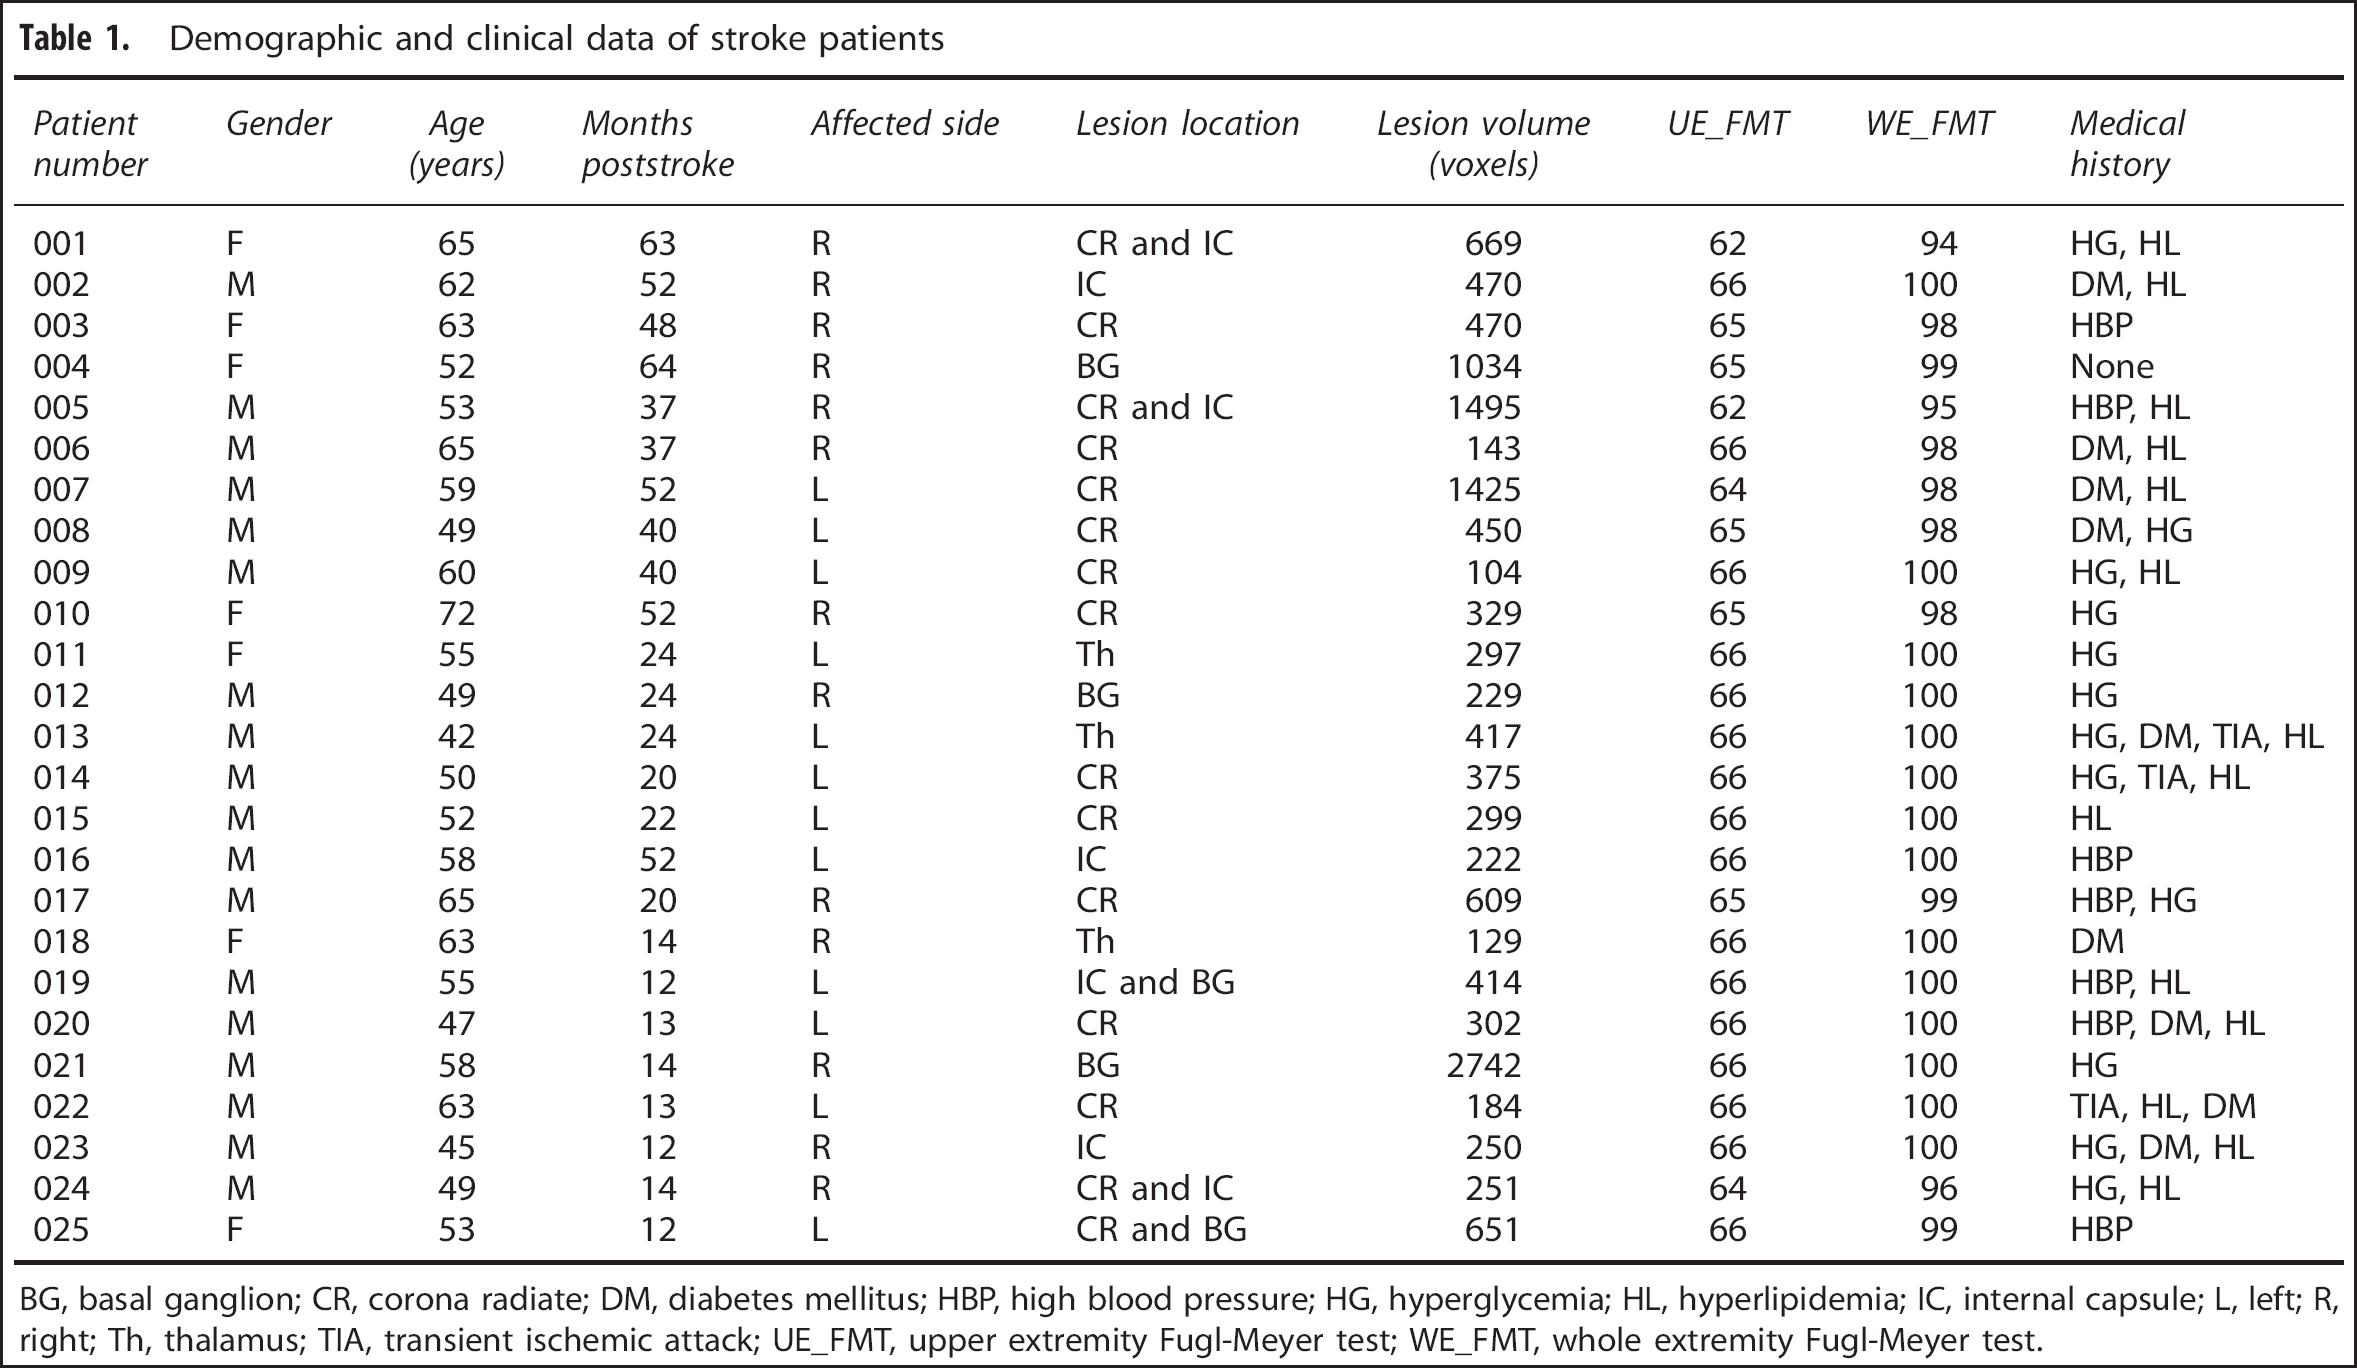
BG, basal ganglion; CR, corona radiate; DM, diabetes mellitus; HBP, high blood pressure; HG, hyperglycemia; HL, hyperlipidemia; IC, internal capsule; L, left; R, right; Th, thalamus; TIA, transient ischemic attack; UE_FMT, upper extremity Fugl-Meyer test; WE_FMT, whole extremity Fugl-Meyer test.
Data Acquisition
Magnetic resonance images were acquired using a 3.0 Tesla MR scanner (Signa Excite HDx; GE Healthcare, Milwaukee, WI, USA). During the examination, tight but comfortable foam padding was used to minimize head motion, and earplugs were used to reduce scanner noise. Sagittal three-dimensional T1-weighted images were acquired by a brain volume (BRAVO) sequence with the following parameters: repetition time/echo time=8.1/3.1 milliseconds; field of view=256 × 256 mm2; matrix=256 × 256; slice thickness=1.0 mm, no gap; 176 slices. The resting-state fMRI data were obtained using a gradient echo single-shot echo planar imaging sequence with the following parameters: repetition time/echo time=2,000/30 milliseconds; slice thickness=3 mm, 1 mm gap; field of view=240 × 240 mm2; matrix=64 × 64; 38 interleaved transverse slices; 180 volumes. During fMRI scanning, all subjects were instructed to keep their eyes closed, remain as motionless as possible, think of nothing in particular, and not fall asleep.
Research Design
To improve the statistical power, we flipped the imaging data from left to right along the mid sagittal line for patients with lesions on the left hemisphere. For all patients, the right side corresponded to the ipsilesional hemisphere and the left side corresponded to the contralesional hemisphere. To exhibit consistency of results derived from nonflipped data of the left- and right-sided lesion groups, we also performed the same analyses on the nonflipped data. The same processing steps and statistical analyses were applied to the flipped and nonflipped data except that the ICA was separately run for the two sets of data and RSN masks for the flipped and nonflipped data were extracted from their corresponding ICA.
Preprocessing of Functional Magnetic Resonance Imaging Data
The resting-state fMRI data were preprocessed using Statistical Parametric Mapping (SPM8, http://www.fil.ion.ucl.ac.uk/spm) and Data Processing Assistant for Resting-State fMRI. 22 The first 10 volumes from each subject were discarded to allow the signal to reach equilibrium and for the participants to adapt to the scanning noise. The remaining 170 volumes were corrected for acquisition time delay between slices. Then, the head motion parameters were estimated; none of the 47 subjects had a maximum displacement of >2 mm or a maximum rotation of >2.0°. The fMRI data were spatially normalized to the standard echo planar imaging template, and were re-sampled into a voxel size of 3 × 3 × 3 mm3. After normalization, images were smoothed using a Gaussian kernel of 6 × 6 × 6 mm3 full-width at half-maximum.
Identification of Resting-State Networks
We performed ICA using the group ICA (GICA) program of the fMRI toolbox (http://www.nitrc.org/projects/cogicat/). Zhang et al 23 found that for multistage principal component analysis reduction, which is adopted and implemented in GIFT and MELODIC, different subject concatenation orders produce variation in the GICA results. To achieve robust and accurate results, an improved algorithm, the Subject Order Independent Group ICA, 23 was implemented multiple times with randomized initial values and different subject orders. Then, the multiple results were integrated to form the final output. The Subject Order Independent Group ICA toolbox supports a GICA approach that first concatenates the individual data across time and subsequently computes the subject-specific components and time courses. Using this toolbox, we performed the analysis in three stages: (i) data reduction, (ii) application of the ICA algorithm, and (iii) back-reconstruction for each individual subject. In the present study, we performed GICA 100 times, and obtained 33 independent components that were auto estimated by the GICA software. Eleven meaningful components were identified as RSNs via visual inspection. The individual-level components were obtained from back-reconstruction, and the intranetwork FC was represented by the z-score of each voxel, which reflects the degree to which the time series of a given voxel correlates with the mean time series of its corresponding component.
Intranetwork Functional Connectivity Analysis
Each ICA component was entered into a random-effect one-sample t-test using a family-wise error correction (P<0.05) and a cluster size of >100 voxels to generate a sample-specific spatial map for each component (Figure 2); the sample here referred to both patients and controls. We compared the differences in the intranetwork FC between the two groups in a voxel-wise manner using two-sample t-tests. Multiple comparisons were corrected using a Monte Carlo simulation, resulting in a corrected threshold of P<0.05 and a cluster size of at least 15 voxels (AlphaSim program in AFNI software, http://www.afni.nimh.nih.gov/. Parameters: single voxel P=0.01, 5,000 simulations, full-width at half-maximum=6 mm, cluster connection radius=5 mm; gray matter mask; and resolution of 3 × 3 × 3 mm3). The intranetwork FC of each region of interest that showed significant group differences were extracted and compared between groups using a general linear model with age and sex as covariates of no interest. For the region of interest-based analyses, we used Cohen's d 24 to determine the effect size of each comparison.
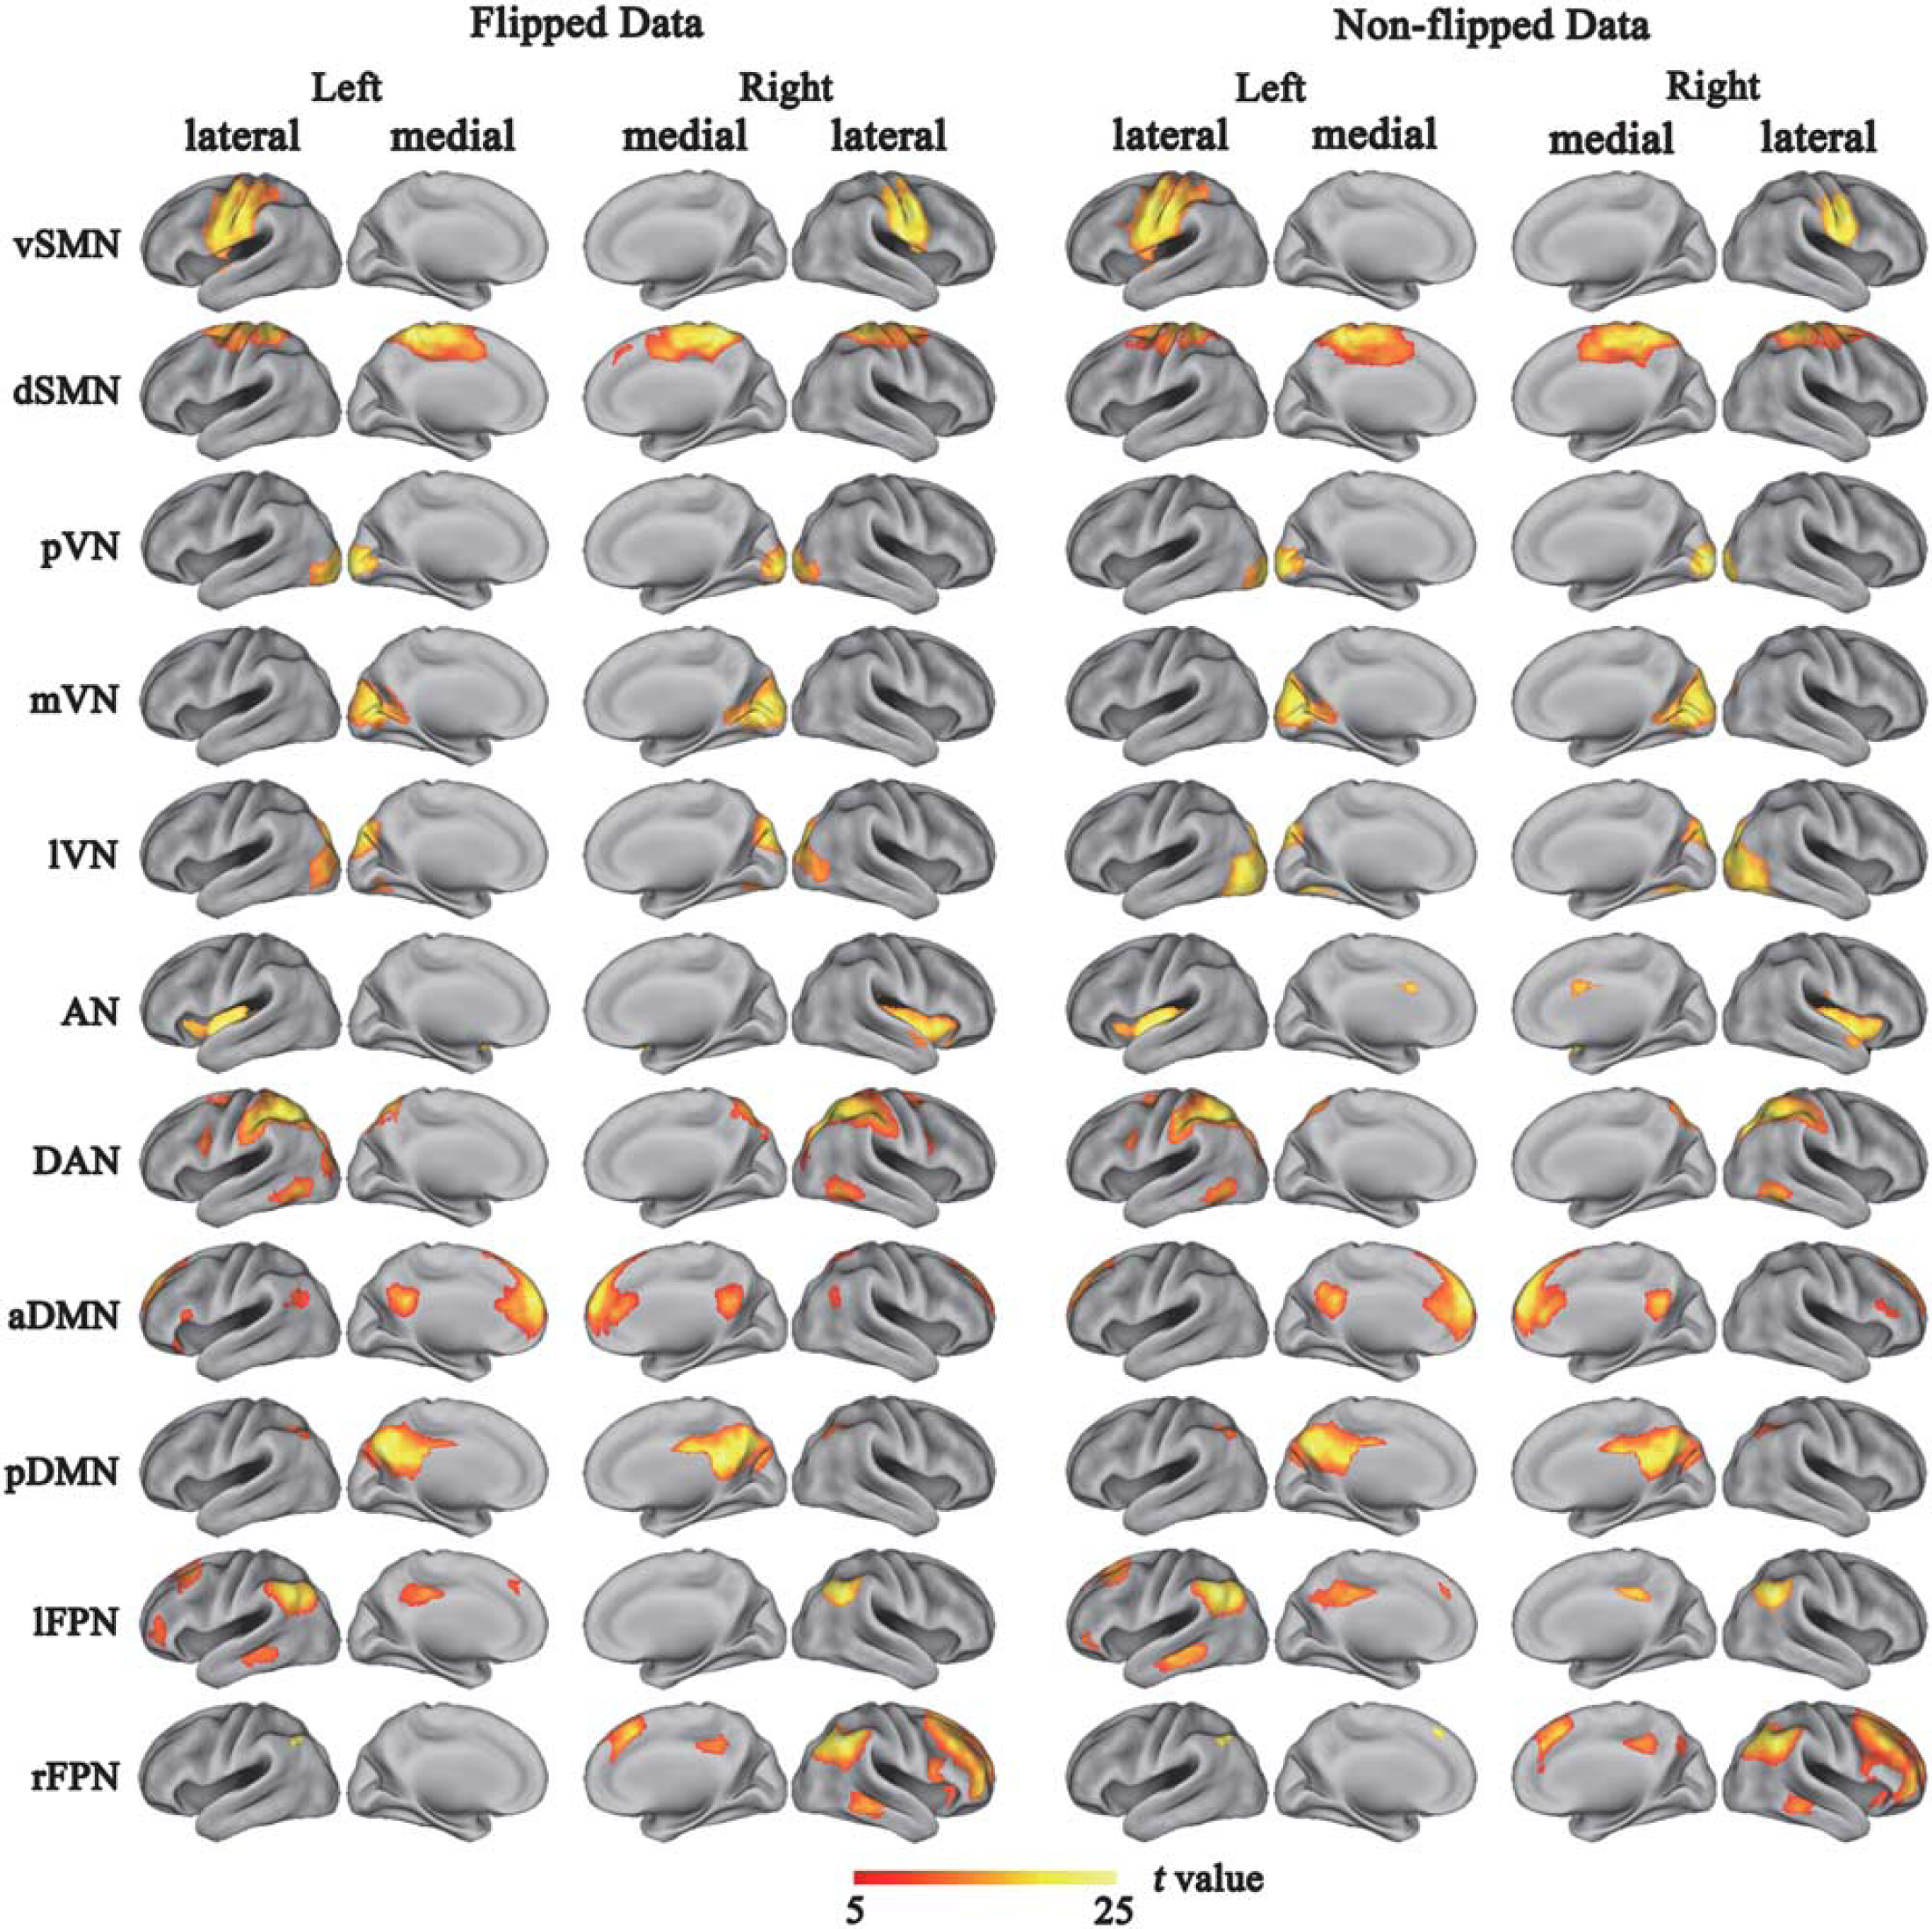
Cortical representation of the resting state networks (RSNs) identified by independent component analysis for both flipped and non-flipped data. Data are displayed on the lateral and medial surfaces of the left and right hemispheres of a brain surface map. The color scale represents the t values in each RSN. aDMN, anterior default mode network; AN, auditory network; DAN, dorsal attention network; dSMN, dorsal sensorimotor network; lFPN, left frontoparietal network; lVN, lateral visual network; mVN, medial visual network; pDMN, posterior default mode network; pVN, occipital pole visual network; rFPN, right frontoparietal network; vSMN, ventral sensorimotor network.
Internetwork Functional Connectivity Analysis
The preprocessing procedures for the internetwork FC analysis were nearly the same as those for the ICA, except that several nuisance covariates (head motion parameters, the average BOLD signals of the ventricles, the white matter, and the whole brain) were removed from the data using regression, and the datasets were band-pass (0.01 to 0.08 Hz) filtered. For each subject, the mean time courses of each RSN were calculated by averaging the time courses of all voxels within the sample-specific RSN mask. Then, Pearson correlation coefficients of the mean time courses between all pairs of RSNs were computed for each subject and then converted to z values using Fisher's r-to-z transformation to improve normality. For each group, individuals' z-values were entered into a random effect one-sample t-test to determine whether the correlation between each pair of RSNs was statistically significant (P<0.05). Only internetwork FCs that reached statistical significance (P<0.05) in either of the two groups were used for intergroup comparisons. A general linear model with age and sex as covariates of no interest was used to analyze which pairs of internetwork FC reached significant differences (P<0.05) between the two groups.
RESULTS
Components of the Resting-State Networks
Eleven RSNs were identified via the Subject Order Independent Group ICA method for both the flipped and nonflipped data. The RSNs were the ventral (vSMN) and dorsal (dSMN) SMNs, the occipital pole (pVN), the medial (mVN) and lateral (lVN) visual networks, the auditory network (AN), the dorsal attention network (DAN), the anterior (aDMN) and posterior (pDMN) DMNs, and the left (lFPN) and right (rFPN) FPNs (Figure 2). The components and locations of these RSNs were consistent with previous studies. 25 Although the SMN is commonly considered as a single network, the ventral and dorsal subdivisions of the SMN have also been reported in prior studies. 7 The spatial range of each RSN derived from the flipped data was very similar with that derived from the nonflipped data (Figure 2).
Altered Functional Connectivity within Resting-State Networks
We compared the intranetwork FC between the patient and control groups in a voxel-wise manner. For the flipped data, significant group differences (P<0.05, corrected) were detected in multiple brain regions (Figure 3 and Table 2). Stroke patients exhibited significantly increased intranetwork FC in the right rolandic operculum of the vSMN (Figure 3A), the left superior parietal lobule of the dSMN (Figure 3B), the right supramarginal gyrus of the DAN (Figure 3C), the cuneus of the mVN (Figure 3D), the right insular of the AN (Figure 3E), and the right precuneus of the pDMN (Figure 3F). In contrast, stroke patients also exhibited significantly decreased intranetwork FC in the left angular gyrus of the lFPN (Figure 3G), the right middle (Figure 3H) and superior frontal gyrus (Figure 3I) of the rFPN, and the left superior frontal gyrus of the aDMN (Figure 3J). We also extracted the z-values of these brain regions with significant group differences in intranetwork FC and performed group-wise comparisons. We found that all of these regions had significant differences (P<0.05) in intranetwork FC between stroke patients and healthy controls, with relatively large effective sizes (0.69 to 1.25) (Figure 3 and Supplementary Table S1).
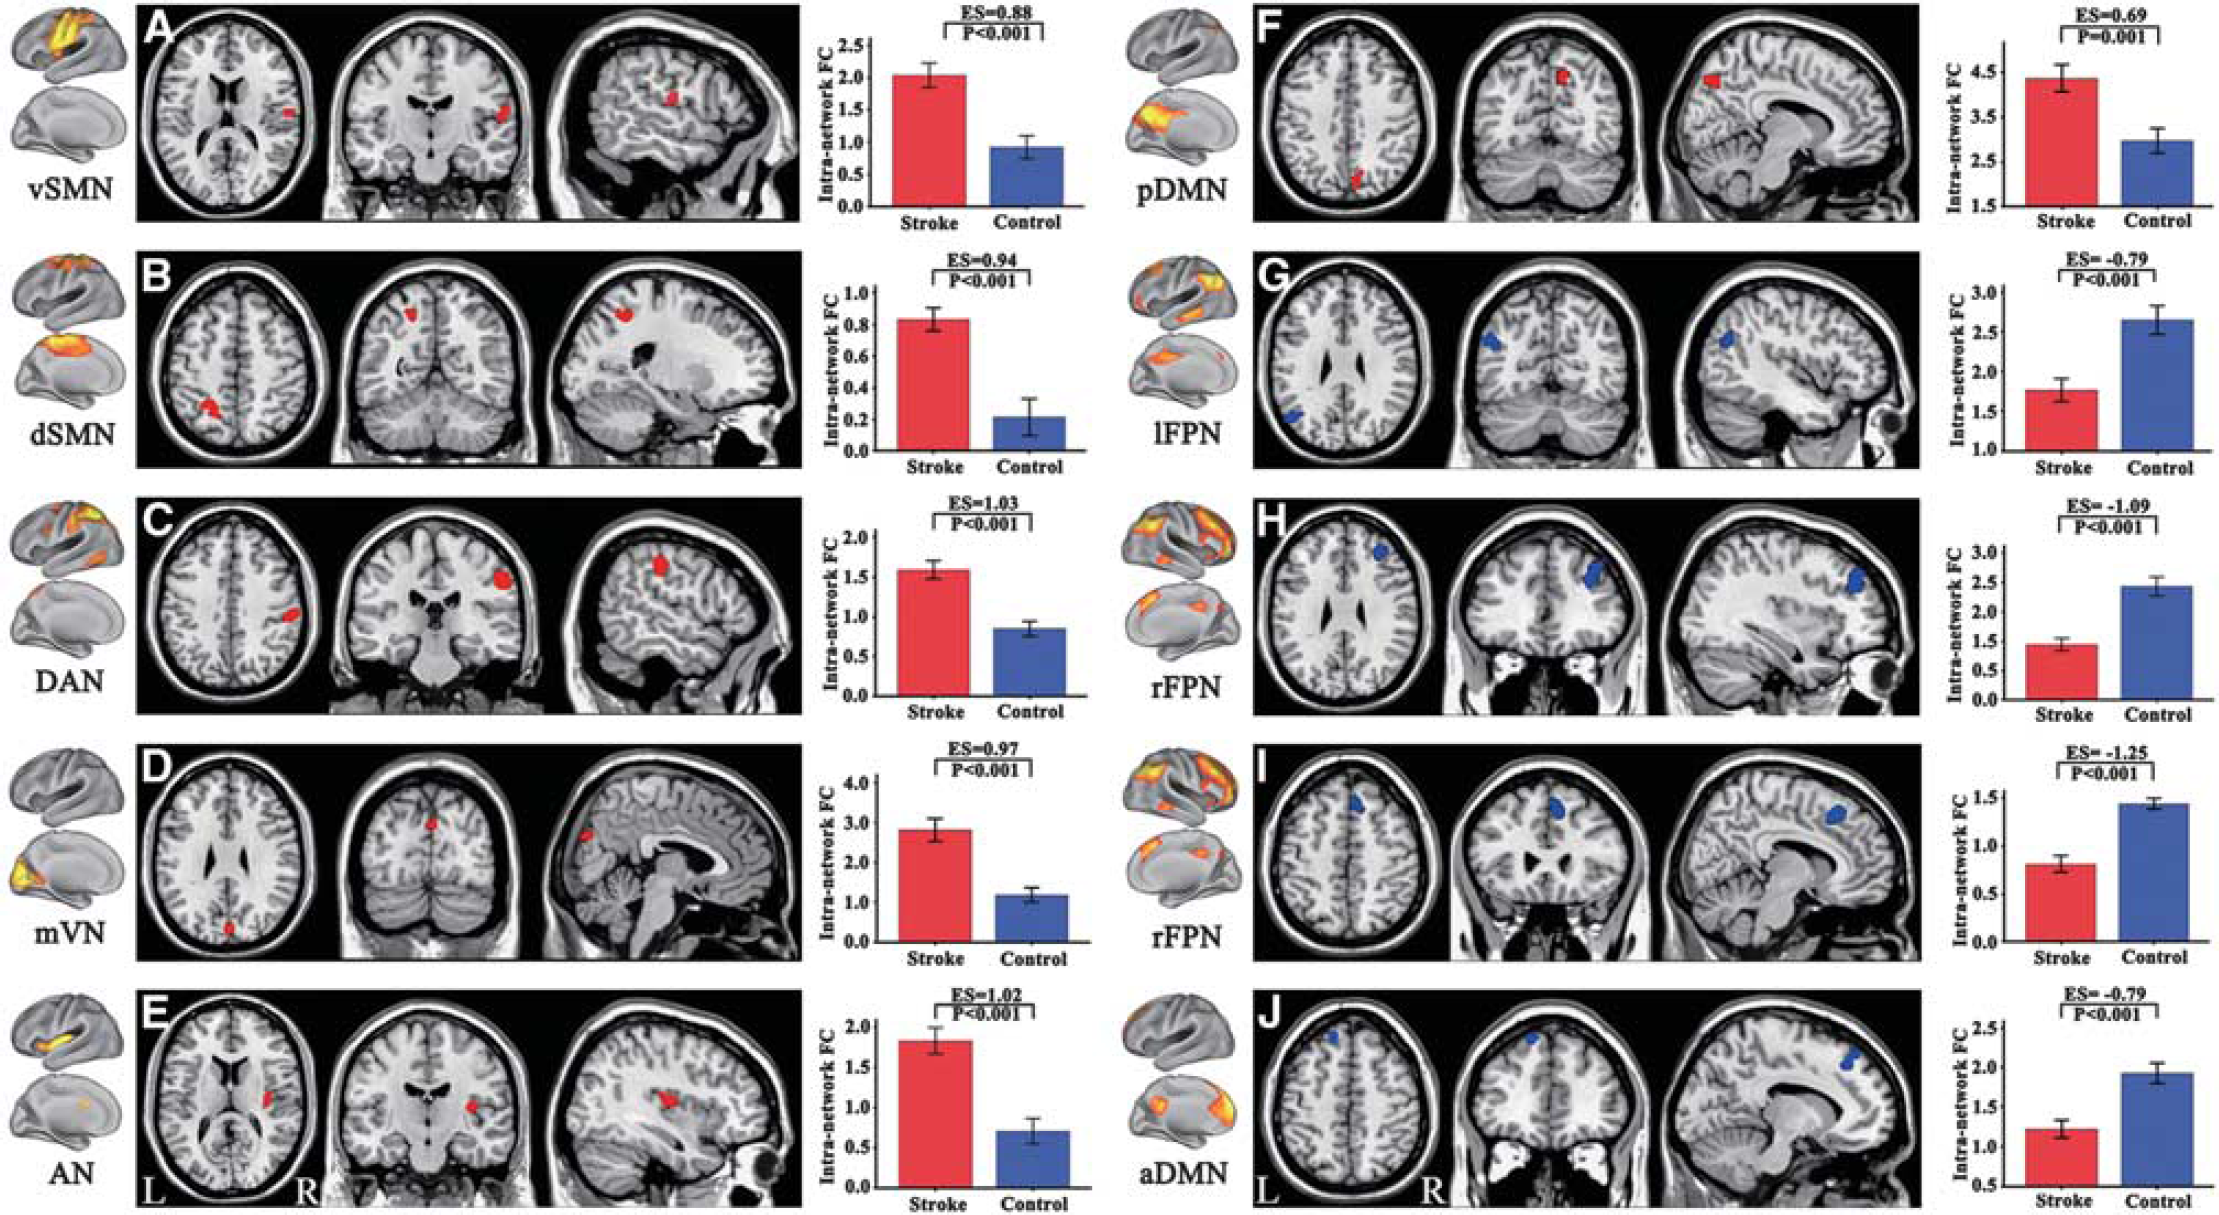
Brain regions with significant changes in intranetwork functional connectivity (FC) in stroke patients. Figures (
Brain regions with significant differences in intranetwork FC between stroke patients and healthy controls
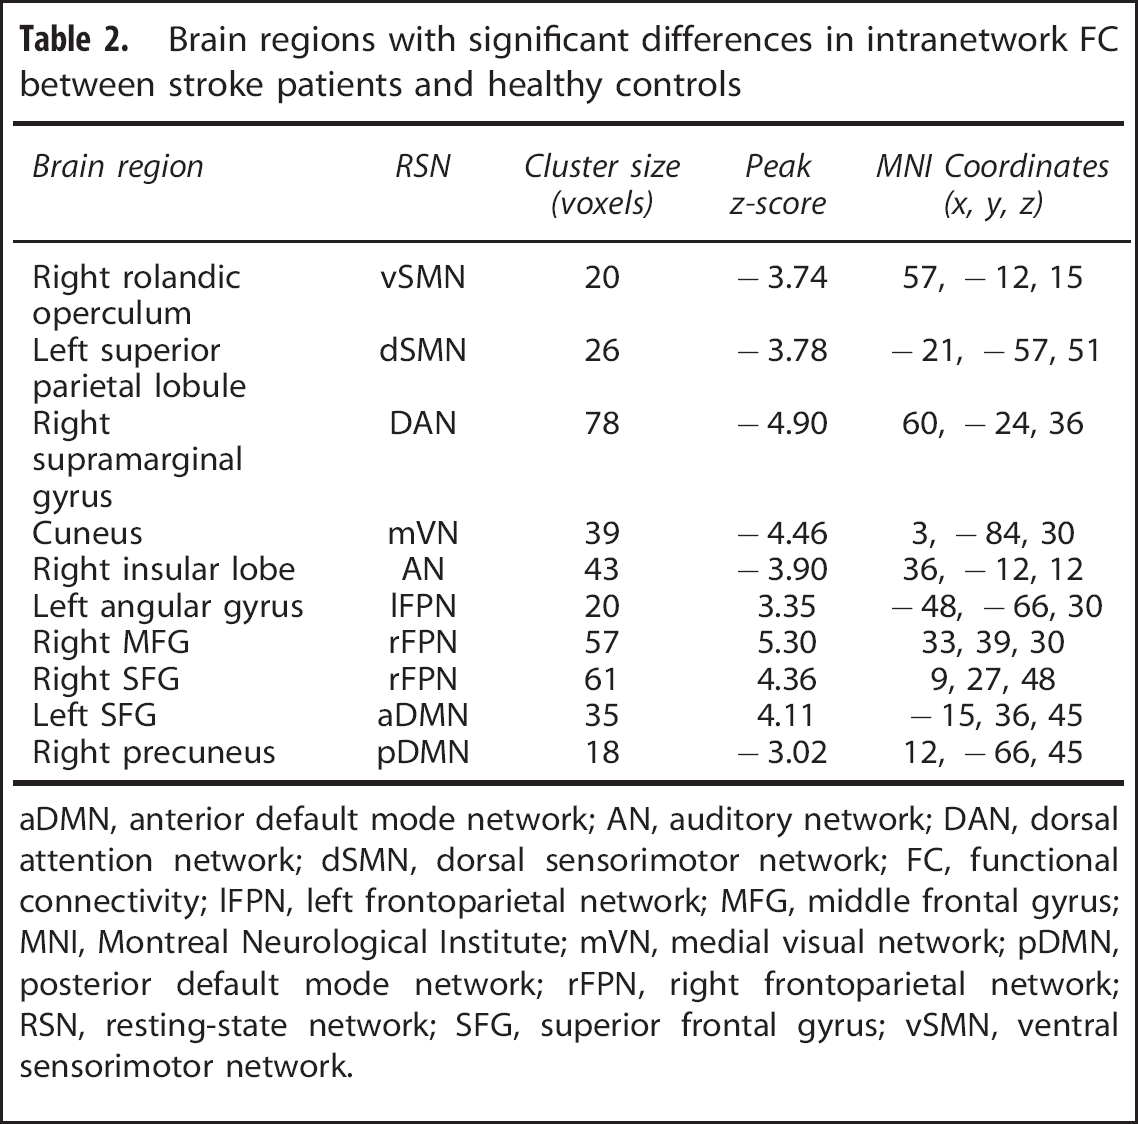
aDMN, anterior default mode network; AN, auditory network; DAN, dorsal attention network; dSMN, dorsal sensorimotor network; FC, functional connectivity; lFPN, left frontoparietal network; MFG, middle frontal gyrus; MNI, Montreal Neurological Institute; mVN, medial visual network; pDMN, posterior default mode network; rFPN, right frontoparietal network; RSN, resting-state network; SFG, superior frontal gyrus; vSMN, ventral sensorimotor network.
Compared with total patients (flipped data), patients with right-sided lesions (nonflipped data) exhibited similar changes in intranetwork FC of the vSMN, DAN, mVN, lFPN, and rFPN; however, they additionally exhibited increased intranetwork FC in the pVN while they failed to show connectivity changes in the dSMN, AN, and DMN (Figure 4 and Supplementary Table S1). Compared with patients with right-sided lesions (non-flipped data), patients with left-sided lesions showed completely different patterns of intergroup differences in intranetwork FC. They only exhibited increased intranetwork FC in the lVN and aDMN (Figure 4 and Supplementary Table S1).
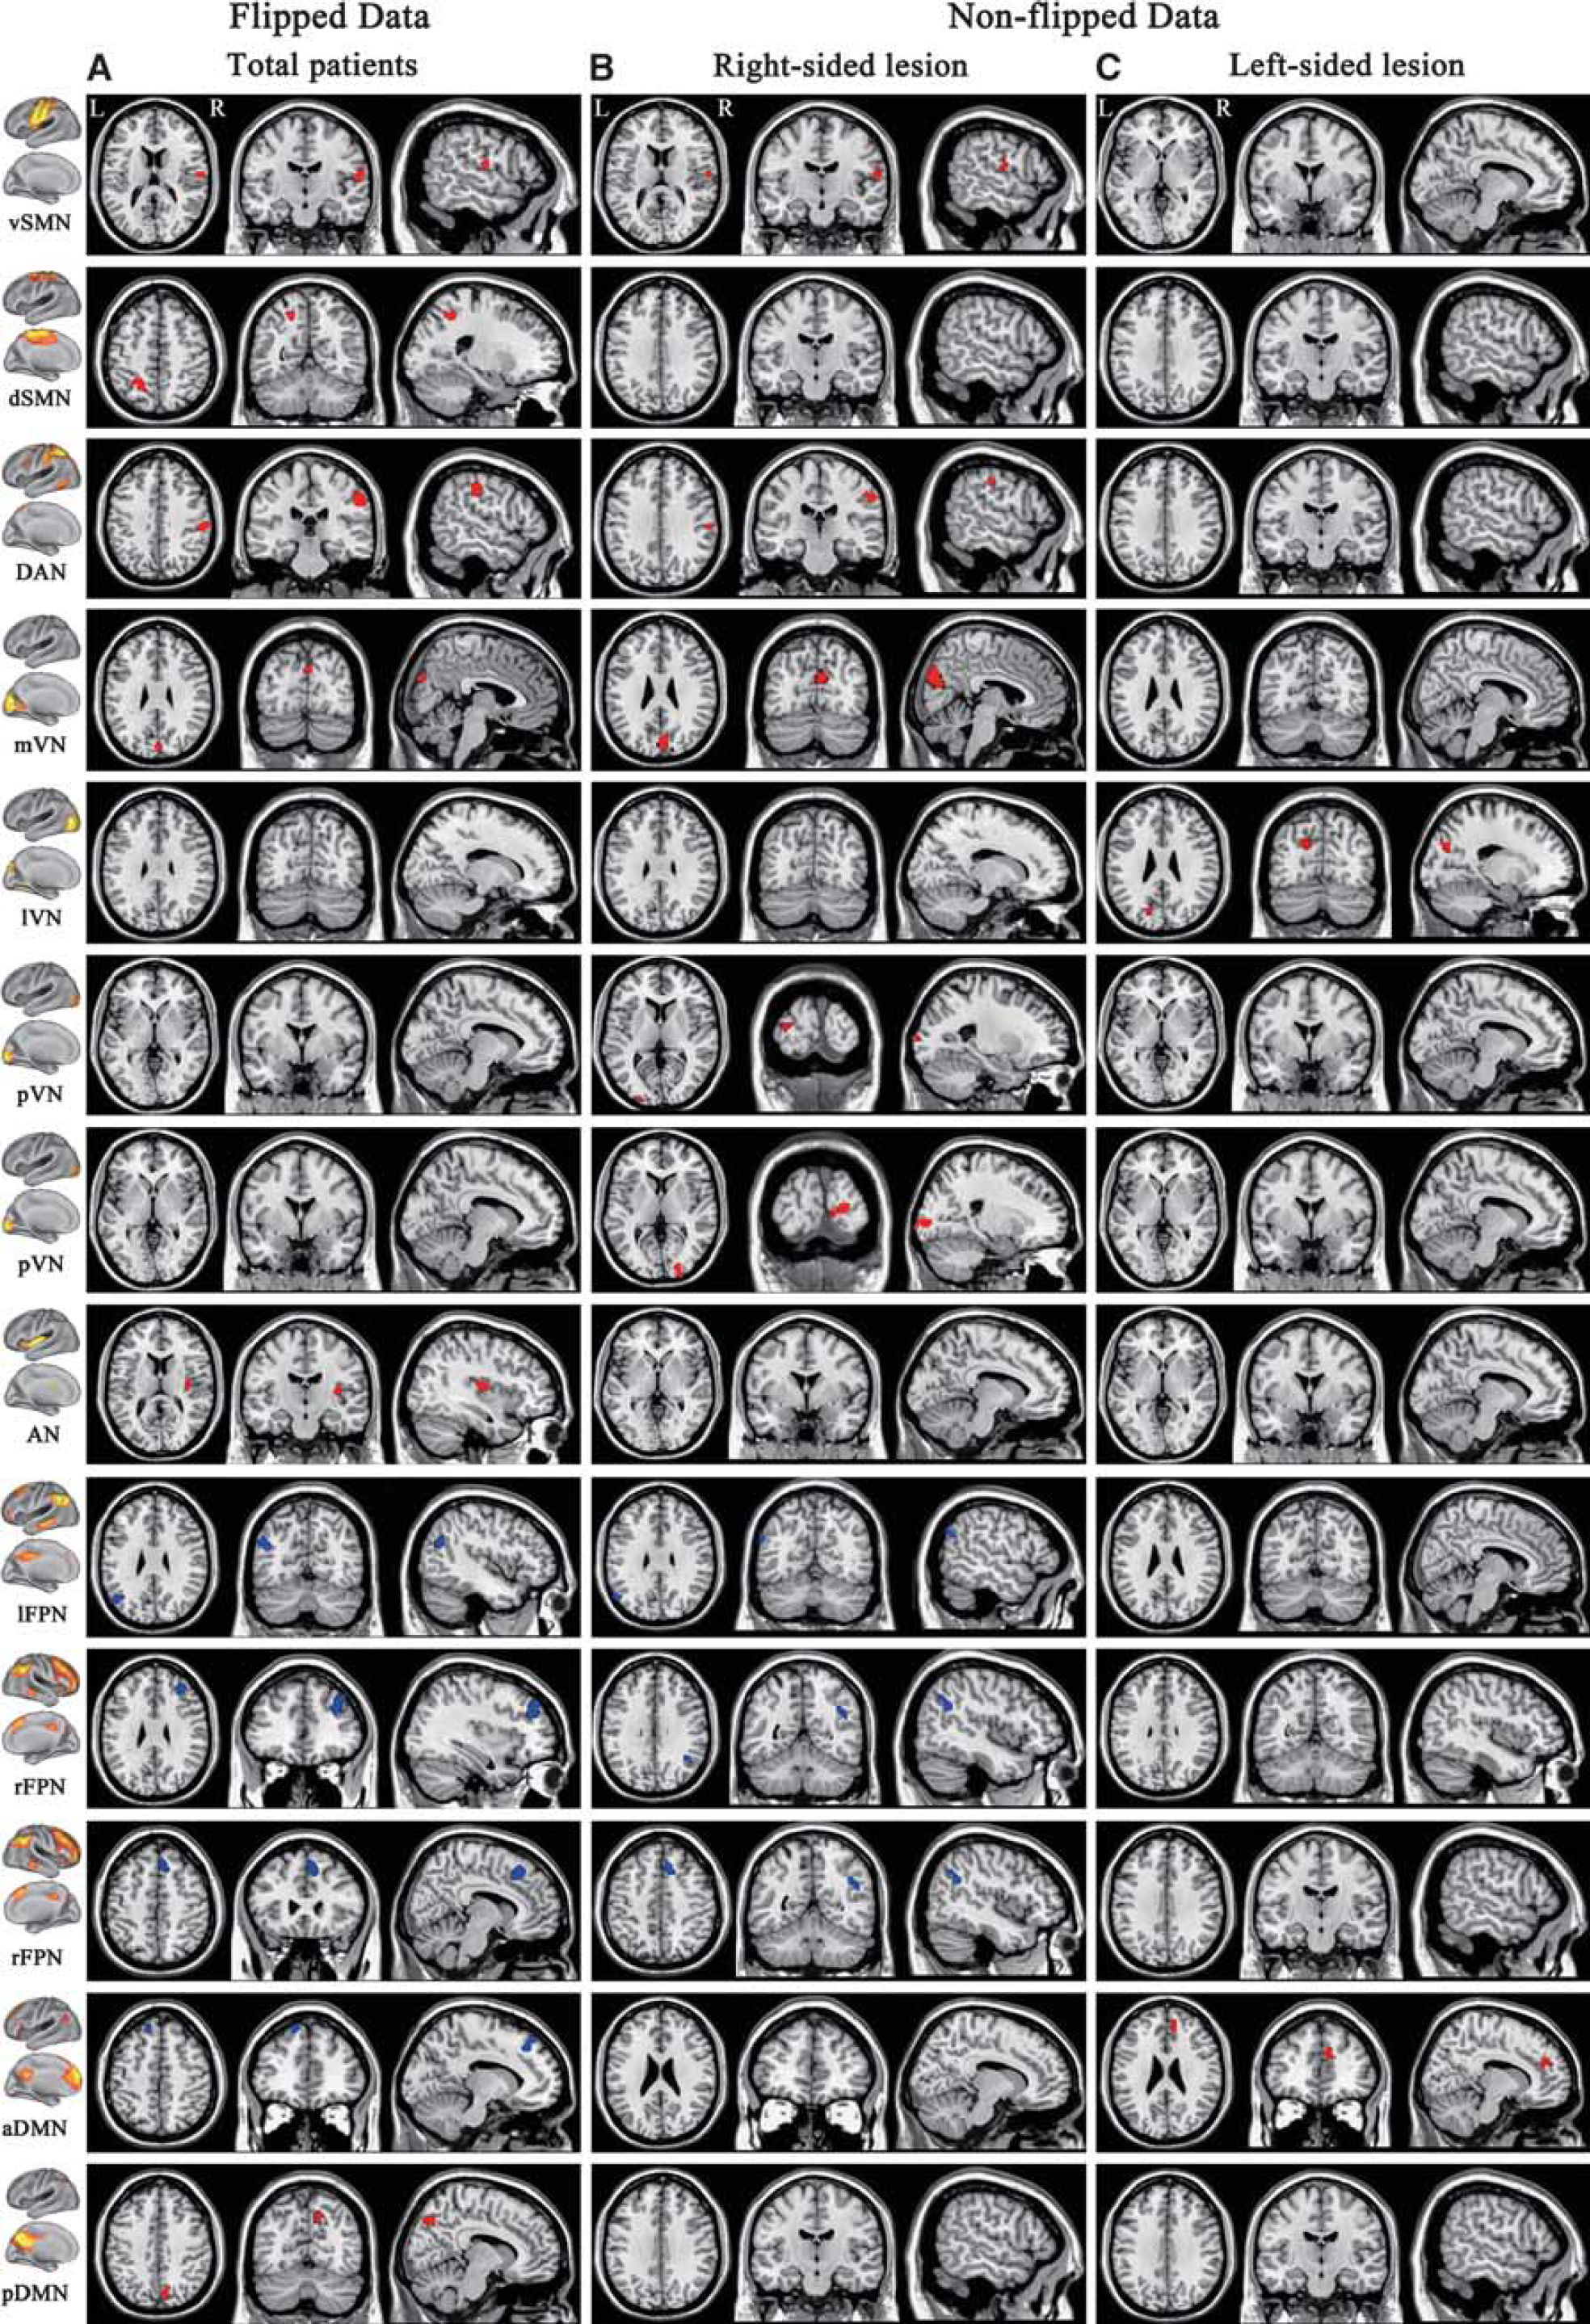
Intranetwork functional connectivity changes in stroke patients derived from flipped and nonflipped data. Column
Altered Functional Connectivity between Resting-State Networks
Intergroup differences in the internetwork FC between stroke patients and healthy controls are shown in Table 3. For the flipped data, stroke patients shifted from no significant FC in controls to significant negative internetwork FC between the AN and mVN (P=0.017, ES=0.54) as well as between the AN and lVN (P=0.027, ES=0.53). Compared with healthy controls, stroke patients also displayed decreased positive internetwork FC between the pDMN and rFPN (P=0.008, ES=0.65). However, none of these differences remained significant after correcting for multiple comparisons using either the Bonferroni or false discovery rate method.
Intergroup differences in the inter-network FC
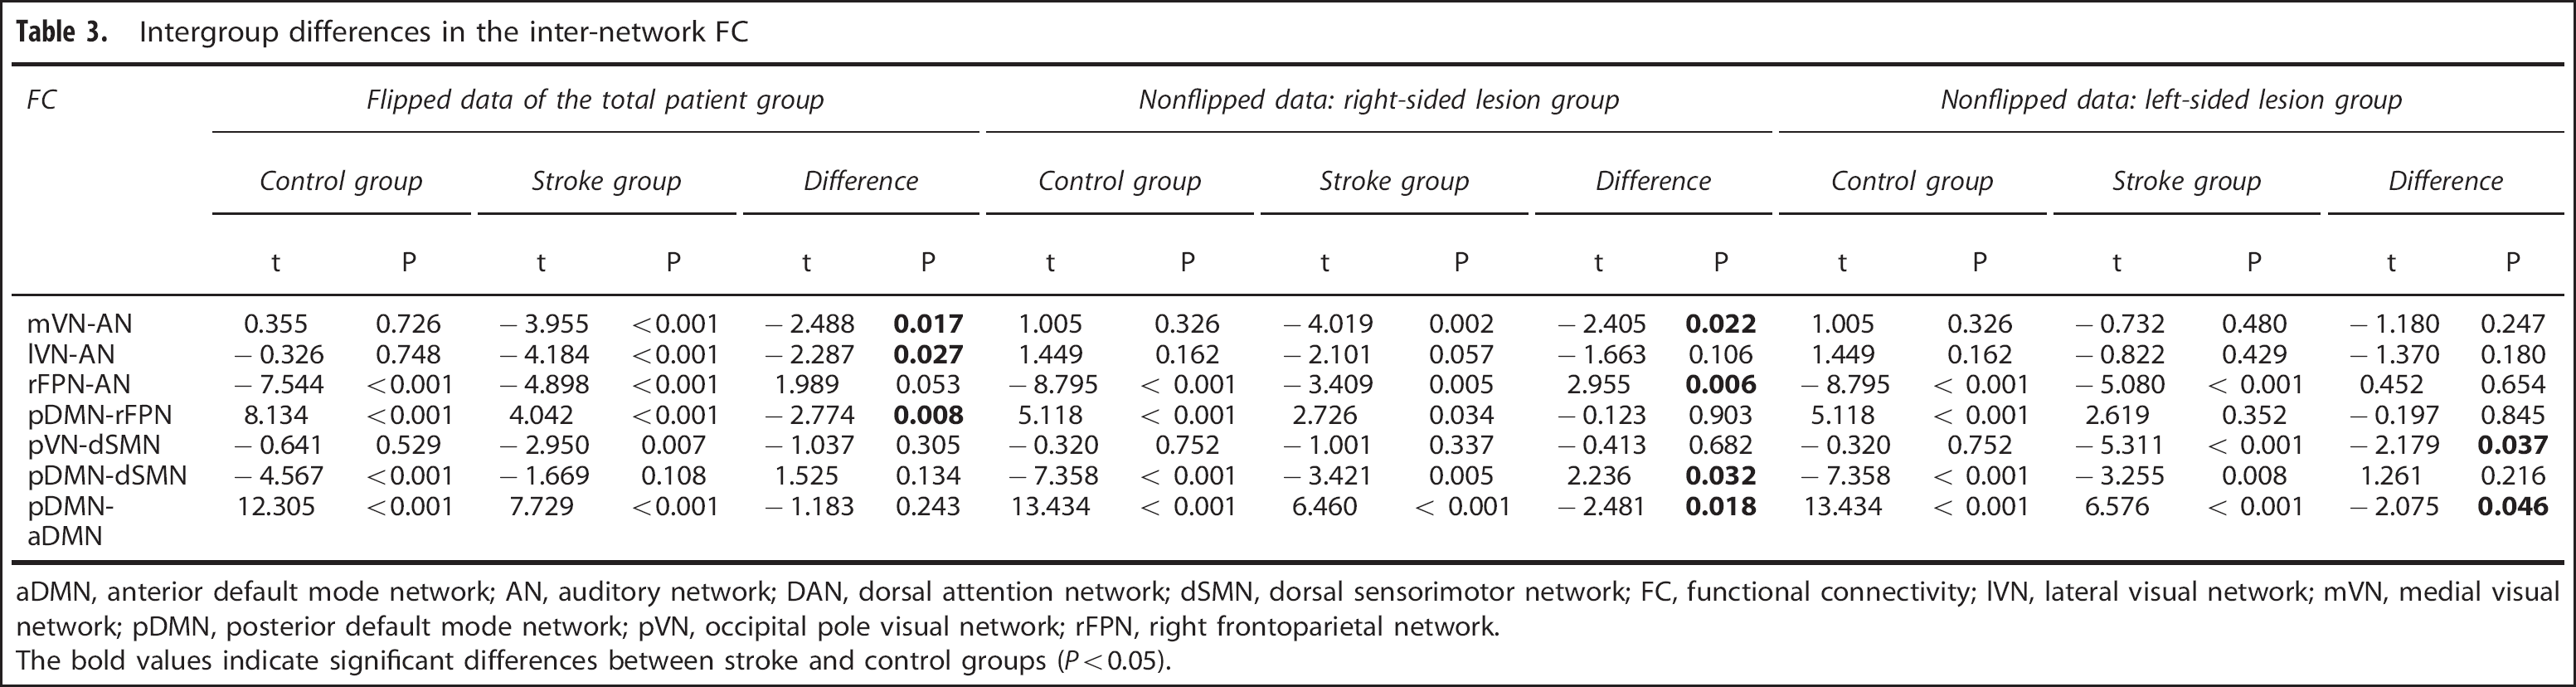
aDMN, anterior default mode network; AN, auditory network; DAN, dorsal attention network; dSMN, dorsal sensorimotor network; FC, functional connectivity; lVN, lateral visual network; mVN, medial visual network; pDMN, posterior default mode network; pVN, occipital pole visual network; rFPN, right frontoparietal network.
The bold values indicate significant differences between stroke and control groups (P<0.05).
For the non-flipped data, patients with right-sided lesions shifted from no significant FC in controls to significant negative internetwork FC between the AN and mVN (P=0.022). They also exhibited weakened positive (aDMN and pDMN, P=0.018) or negative (AN and rFPN, P=0.006; pDMN and dSMN, P=0.032) internetwork FC when compared with normal controls (Table 3). Compared with normal controls, patients with left-sided lesions shifted from no significant FC in controls to significant negative internetwork FC between the pVN and dSMN (P=0.037). They also exhibited weakened positive internetwork FC between the anterior and posterior DMN (P=0.046) (Table 3).
Effects of Lesion Volume on Intra and Internetwork Functional Connectivity in Stroke Patients
We performed partial correlations between the FC values and the lesion volume in stroke patients after controlling for age and sex. We did not detect any significant correlations (P>0.05) (Supplementary Table S2), suggesting that lesion volume did not significantly influence our results.
DISCUSSION
In the present study, we used ICA to investigate the changes in intra and internetwork FC in well-recovered patients with a subcortical infarction involving the motor pathway. We found increased intranetwork FC in the SMN, VN, AN, DAN, and DMN as well as decreased connectivity in the FPN and aDMN in stroke patients. We also detected negatively changed internetwork FC (VN-AN and VN-SMN) and weakened positive (aDMN–pDMN and pDMN–rFPN) or negative (AN–rFPN and pDMN–dSMN) internetwork FC in stroke patients. These findings suggest that intra and internetwork functional impairment and reorganization may coincide in well-recovered subcortical stroke patients. Moreover, these findings also suggest that stroke-induced alterations may present beyond the motor system and manifest as the involvement of multiple functional systems.
Increased Intranetwork Functional Connectivity within the Sensorimotor Network, Visual Network, Auditory Network, and Dorsal Attention Network
We found increased intranetwork FC within the SMN, VN, AN, and DAN in stroke patients. The increased intranetwork FC within the SMN has been previously reported; 26 and the increased interhemispheric FC of the SMN has been associated with motor recovery. 27 Here, we found that stroke patients exhibited increased intranetwork FC in the right rolandic operculum of the SMN and the right insula of the AN, which are typical perisylvian regions relating to speech function. 28 The basal ganglia lesions can lead to subcortical aphasia, 29 the recovery of aphasia depends on the reorganization of the speech system. Thus, the increased connectivity both of the AN and SMN may represent a compensatory reorganization for subcortical aphasia, which is consistent with a previous longitudinal study of stroke patients with subcortical aphasia that reported increased regional cerebral blood flow in the bilateral perisylvian regions 1 year after stroke. 30 The VN and DAN are involved in visual attention. 31 Increased connectivity in these networks may be a reflection of functional reorganization in the attention system after stroke, although its functional implication in stroke recovery needs to be clarified in future studies.
Decreased Functional Connectivity of the Frontoparietal Network
We found that both intra and internetwork FC of the FPN weakened in stroke patients. The FPN is a lateralized network and has been commonly identified as an independent RSN in previous ICA studies. 25 The FPN is primarily composed of the dorsolateral prefrontal cortex and the posterior parietal cortex, and it supports the function of cognitive control. 32 The weakened connectivity of the FPN in stroke patients is consistent with previous studies that reported cortical atrophy 33 and functional disconnection 15 in brain regions of the FPN in subcortical stroke patients, which may underlie cognitive impairment in these patients.33, 34 Although the mechanisms of the weakened connectivity of the FPN are unclear, it may be related to axonal degeneration secondary to subcortical lesions because these subcortical regions are densely connected with the frontal and parietal lobes. 35
Altered Functional Connectivity of the Default Mode Network
Although the internetwork FC of the DMN weakened in stroke patients, the intranetwork FC changes are rather complex (increased connectivity in pDMN; both increased and decreased connectivity in different regions of the aDMN) in these patients. The DMN mainly includes the medial prefrontal cortex and anterior cingulate cortex as well as the posterior cingulate cortex and precuneus, which is associated with both cognitive and emotional control. 36 The DMN connectivity changes after stroke are consistent with a previous study that reported a dysfunction of DMN FC in stroke patients. 37 However, the mechanisms of these complex functional alterations of the DMN should be determined by future studies.
Negative Internetwork Functional Connectivity Among Processing Networks (Auditory Network, Visual Network, and Sensorimotor Network)
The AN, VN, and SMN are independent processing systems for auditory, visual, and sensorimotor functions, respectively. The functional independency of these networks is supported by our finding of the lack of significant internetwork FC among these networks in healthy controls. In stroke patients, the significant negative internetwork FC among these processing networks may reflect abnormal large-scale functional interaction among functional networks. Although the mechanisms underlying the abnormal internetwork FC are unclear, it may be possibly related to the direct or indirect impairment of the thalamus, which transmits sensory inputs to the corresponding sensory cortices. 38
The Differences in Functional Connectivity Alterations between Left- and Right-Sided Lesions
The intergroup differences in both intra and internetwork FC were largely different between the left- and right-sided lesion groups. These findings may really represent the effect of lesion side on connectivity changes in stroke patients, highlighting the importance of analyzing stroke patients with unilateral lesions. However, they may also be caused by the lack of statistical power because of the small sample sizes in each stroke subgroup. Consequently, our findings should be further validated by studies on stroke patients using unilateral lesions and a large sample size.
Limitations
Several limitations should be noted in the present study. Although we restricted our analyses to stroke patients with lesions at the level of the basal ganglia, the extent of the involved brain regions and the lesion size exhibited a relatively large variation across individuals. To determine the effects of lesion size on our results, we performed partial correlations between the FC values and the lesion volume in stroke patients after controlling for age and sex. We did not detect any significant correlations (P>0.05), suggesting that lesion volume did not significantly influence our results. This study adopted a cross-sectional design that cannot realize the longitudinal changes in FC within and between RSNs. It has been demonstrated that changes in the resting-state FC occur dynamically and nonlinearly after stroke.16, 39, 40 Investigation of the dynamic changes in intra and internetwork FC after subcortical stroke should be performed in future studies. Moreover, the lack of cognitive and language assessments prevents us from investigating the relationship between the FC impairments and behavioral performance in these stroke patients. Further studies should be performed to determine these relationships. Finally, the correctness of flipping data of stroke patients is unclear and needs to be clarified in future.
CONCLUSIONS
In well-recovered patients with a subcortical lesion in the motor pathway, changes in FC were identified in multiple functional networks rather than only in the SMN. Moreover, functional alterations after stroke were also present in the internetwork FC. These findings suggest that subcortical stroke lesions may affect more extensive functional networks than we expected, including not only intra but also internetwork FC. Extending our investigation from the SMN to other brain networks may provide a more complete picture of the functional alterations in stroke patients.
Footnotes
References
Supplementary Material
Please find the following supplemental material available below.
For Open Access articles published under a Creative Commons License, all supplemental material carries the same license as the article it is associated with.
For non-Open Access articles published, all supplemental material carries a non-exclusive license, and permission requests for re-use of supplemental material or any part of supplemental material shall be sent directly to the copyright owner as specified in the copyright notice associated with the article.