
Abstract
While a number of studies have established that moderate doses of alcohol increase brain perfusion, the time course of such an increase as a function of breath alcohol concentration (BrAC) has not yet been investigated, and studies differ about regional effects. Using arterial spin labeling (ASL) magnetic resonance imaging, we investigated (1) the time course of the perfusion increase during a 15-minute linear increase of BrAC up to 0.6 g/kg followed by a steady exposure of 100 minutes, (2) the regional distribution, (3) a potential gender effect, and (4) the temporal stability of perfusion effects. In 48 young adults who participated in the Dresden longitudinal study on alcohol effects in young adults, we observed (1) a 7% increase of global perfusion as compared with placebo and that perfusion and BrAC are tightly coupled in time, (2) that the increase reaches significance in most regions of the brain, (3) that the effect is stronger in women than in men, and (4) that an acute tolerance effect is not observable on the time scale of 2 hours. Larger studies are needed to investigate the origin and the consequences of the effect, as well as the correlates of inter-subject variations.
Keywords
INTRODUCTION
It is generally known that alcohol increases brain perfusion or cerebral blood flow (CBF). As reviewed, for example, by Sano et al 1 or Mathew and Wilson, 2 early findings based on the nitrous oxide technique 3 were still inconsistent. However, with the emergence of less invasive perfusion imaging techniques, it is now well established that moderate doses of alcohol (∼0.6 g/kg breath alcohol concentration (BrAC) increase brain perfusion but also that the between-subject variability as well as the regional variability are large. For example, Khalili-Mahani et al 4 report that only 6 of 12 subjects show a perfusion increase, and Tolentino et al 5 find perfusion effects only in the frontal lobes whereas others report also, for example, temporal regions.4, 6Table 1 summarizes protocols and selected findings from nine related imaging studies1, 4, 5, 6, 7, 8, 9, 10, 11 that have measured the effect of alcohol on brain perfusion. As can be seen from Table 1, the advent of ASL magnetic resonance imaging 12 to measure absolute CBF with high spatial and temporal resolution has sparked a renewed interest in the field.
Summary of imaging studies investigating the effect of alcohol on perfusion
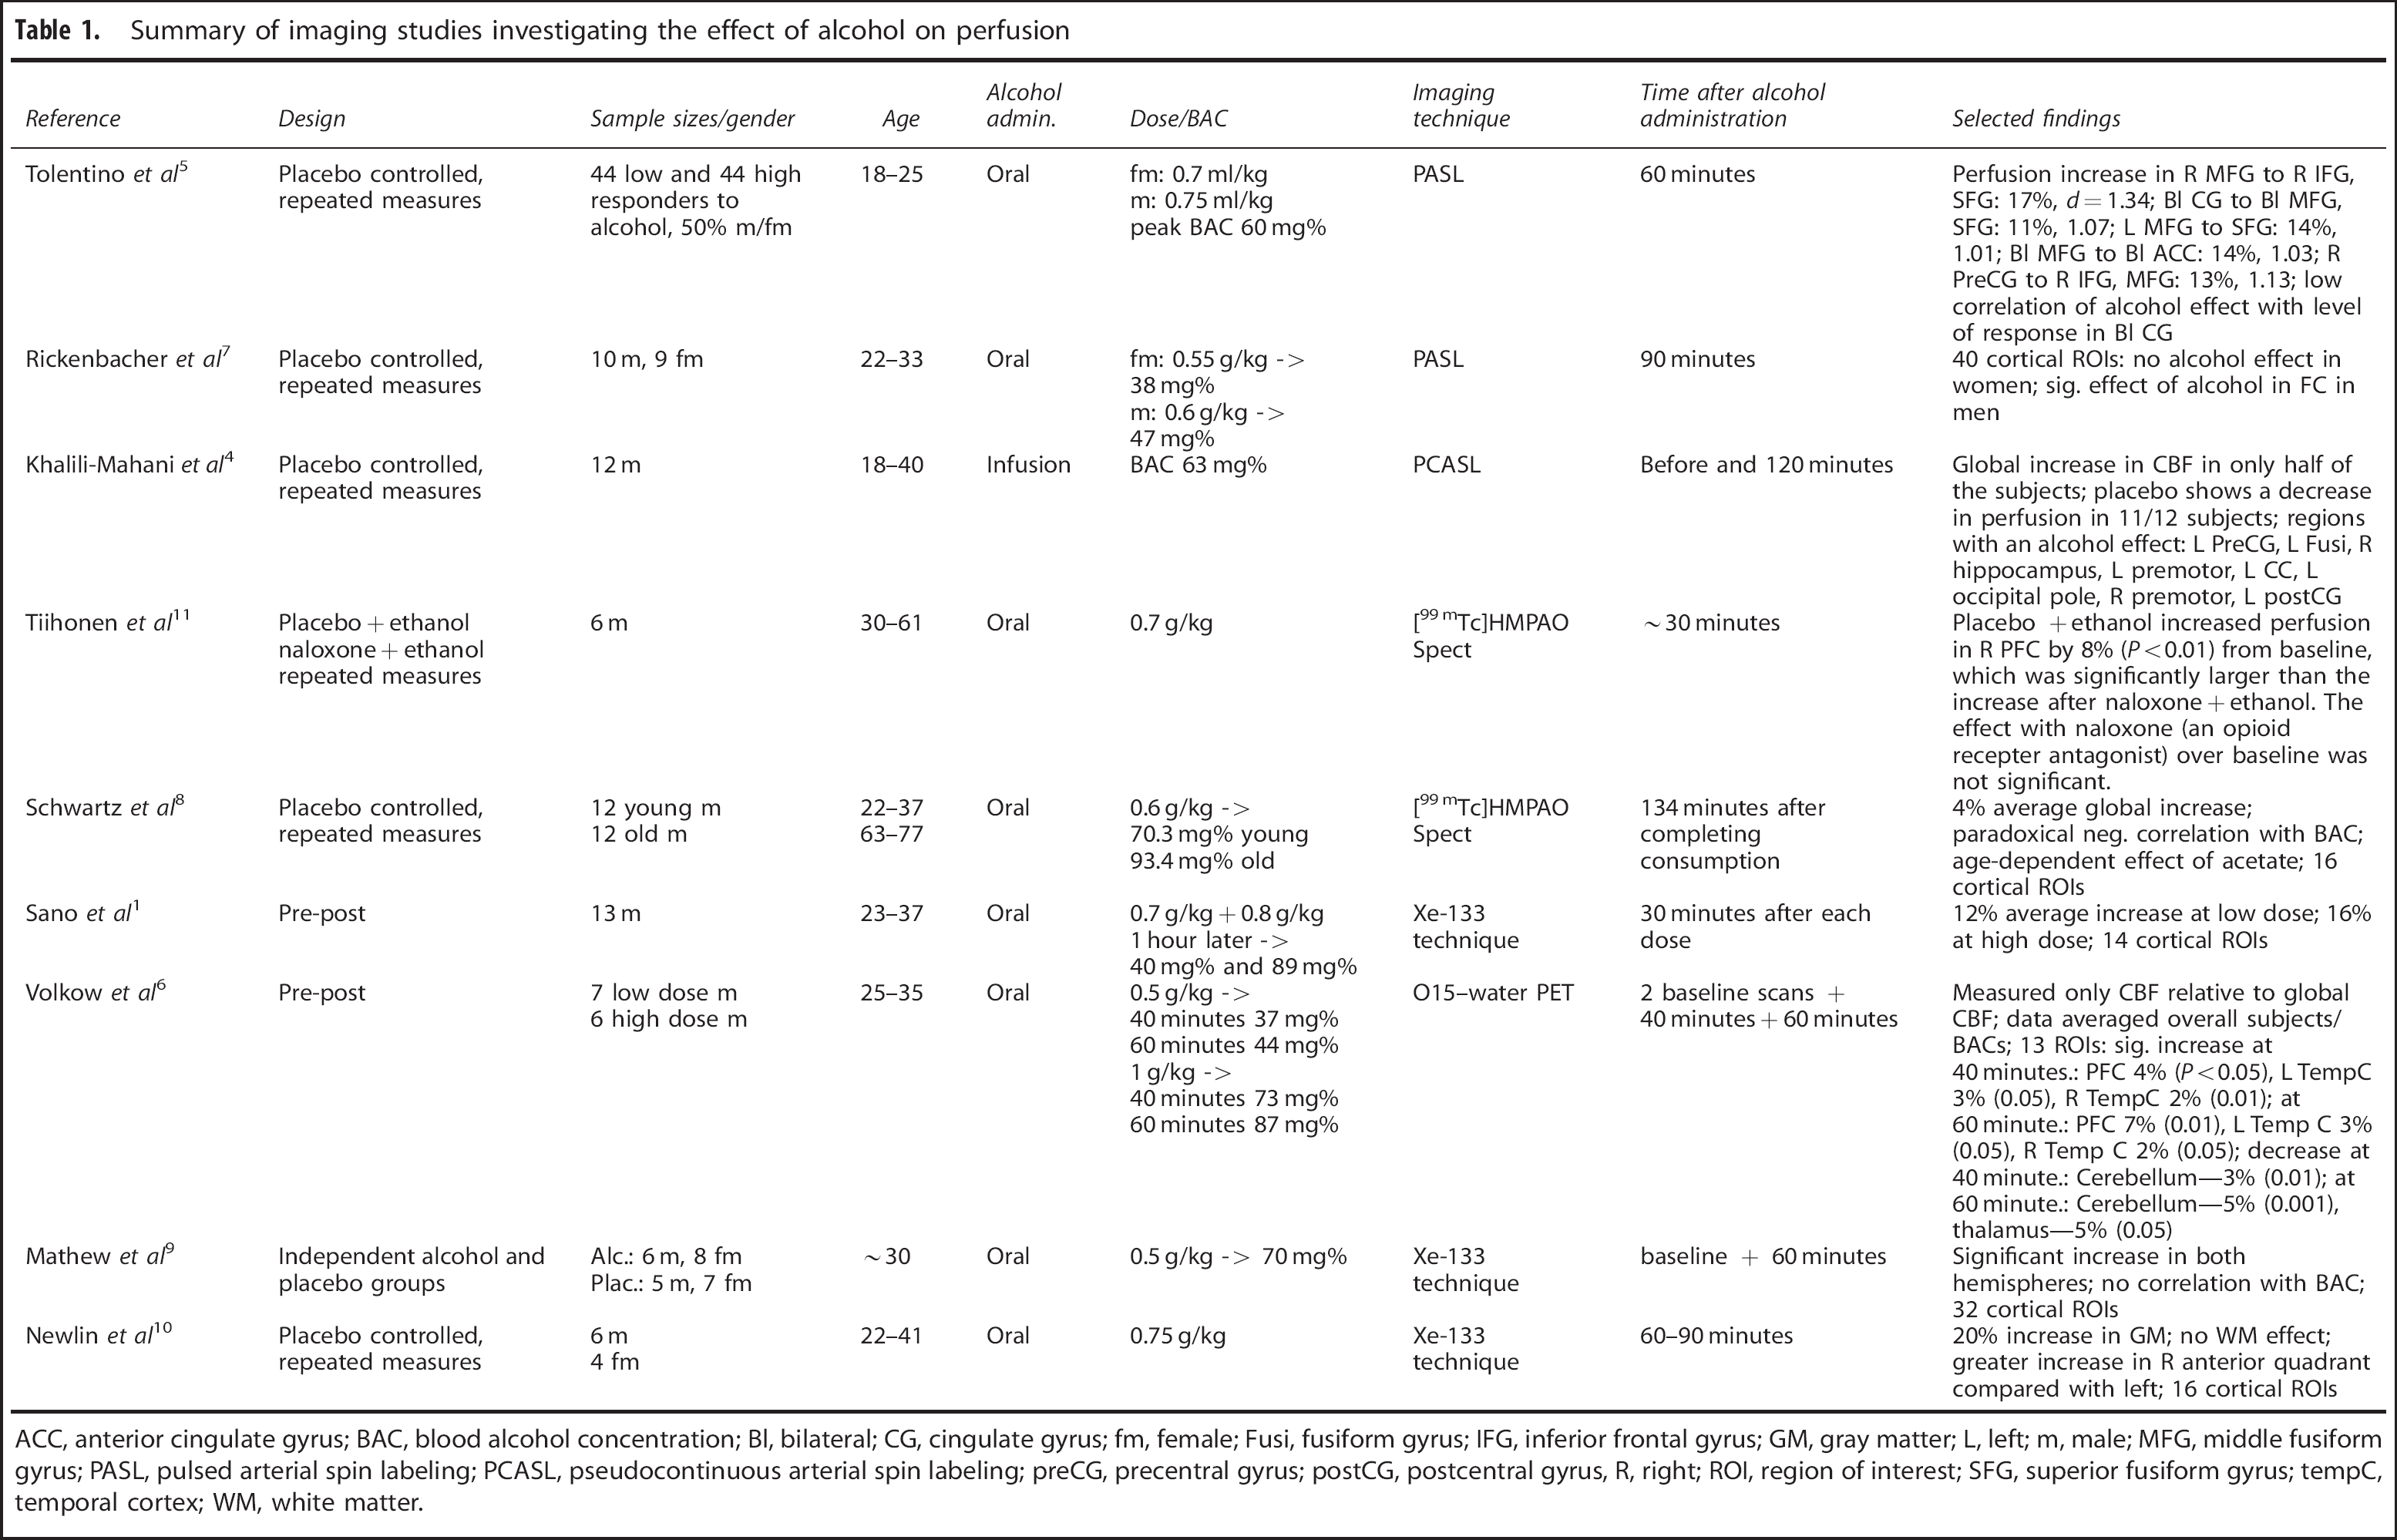
ACC, anterior cingulate gyrus; BAC, blood alcohol concentration; Bl, bilateral; CG, cingulate gyrus; fm, female; Fusi, fusiform gyrus; IFG, inferior frontal gyrus; GM, gray matter; L, left; m, male; MFG, middle fusiform gyrus; PASL, pulsed arterial spin labeling; PCASL, pseudocontinuous arterial spin labeling; preCG, precentral gyrus; postCG, postcentral gyrus, R, right; ROI, region of interest; SFG, superior fusiform gyrus; tempC, temporal cortex; WM, white matter.
While studies agree on the global trend, there are large differences about the magnitude of the effect and the regional distribution of the increase. Our study will address some of the potential reasons for these differences: (1) Perfusion might change not only as a function of BrAC but also as a function of time. All of these studies have acquired perfusion data from only 1 or 2 time points obtained 30 minutes or more after alcohol administration. Our study monitored perfusion continuously during the rise of BrAC and investigates whether perfusion rises immediately after the BrAC or is delayed. (2) Currently, only one study in Table 1 investigated more than 20 subjects. We present data from 48 subjects, which provide greater power to detect small local effects. In addition to a voxel-based whole-brain analysis, we have divided the brain into 26 sub-regions to reduce the potential for false-negative findings in the voxel-wise analysis (multiple comparison problems). (3) Only one study 7 has addressed the issue of gender as a potential reason for the inter-subject variability and reported an increase of perfusion in men but not in women. We will attempt to replicate this result in our cohort. (4) An additional late measurement at ∼110 minutes after the start of the infusion allows us to address the questions whether early and late perfusion measurements differ.
Finally, age and variable blood alcohol concentrations (BAC) after oral alcohol administration might contribute to the observed variability of perfusion changes under alcohol. The observation that an alcohol dose of 0.6 g/kg body mass led to 66 g/kg BAC in young males versus 88 g/kg in old males 8 emphasizes this possibility in combination with the fact that all but one study in Table 1 administered alcohol orally at a dose independent of age. In addition, it is well known that brain perfusion decreases with age. 13 In this regard, our study benefits from a narrow age range of 18- to 19-year-olds and from an infusion technique that allows us to reduce inter-subject variability by targeting specific BAC values accounting for subject weight, size, age, and gender of the individual subjects. 14
MATERIALS AND METHODS
Participants
Participants were recruited for the Dresden longitudinal study on alcohol effects in young adults. The Dresden longitudinal study on alcohol effects in young adults study includes only subjects with alcohol consumption levels of at least two drinks per week and at least one lifetime occasion of getting drunk. A subset without MR contraindications and who reached BrAC levels of at least 0.5 g/kg during a free-access alcohol self-administration experiment were selected for the combined ASL/functional magnetic resonance imaging experiment.
Arterial spin labeling data were acquired in 50 young adults (18 or 19 years old). Two subjects had to be excluded because of spatial normalization problems. Of 48 subjects, 17 were female and 13 had a positive family history of alcoholism (FHA) (at least one first-degree biologic relative affected by alcoholism), in four subjects FHA was unknown, 31 were FHA negative (no first- or second-degree relative affected by alcoholism). Effects of FHA are not considered here but investigated separately. Only 38 subjects had a complete set of ASL data including the required ASL gauge data for the estimation of absolute perfusion (see Supplementary 1). Consequentially, absolute perfusion results as well as late perfusion results at 110 minutes after the start of the infusion could only be computed in 38 subjects, while the early ramp data relative to baseline were available in 48 subjects.
All subjects were physically and mentally healthy, provided written informed consent, and were paid €10 per hour. The study was approved by the Ethics Committee of the Technische Universität Dresden and follows the Ethical Principles of Psychologists and Code of Conduct by the American Psychological Association.
Experimental Procedure
A single, masked, placebo-controlled, pseudorandomized crossover design was employed. Subjects were studied for 2 days separated by at least 1 week, once receiving an intravenous infusion of a 6% (v/v) alcohol solution (mixture of normal saline (0.9%) with 95% ethanol (Braun, Melsungen, Germany)) and once normal saline in the placebo condition. In the alcohol condition, BrAC was increased linearly up to 0.6 g/kg within 15 minutes using the computer-assisted infusion of ethanol system (CAIS).14, 15 The BrAC level of 0.6 g/kg was maintained for ∼115 minutes. The infusion rates required to achieve this time course of BrAC in every subject were calculated based on subjects' weight, height, age, and gender, as well as on measured BrACs and fed into the infusion pumps (Infusomat fmS, B. Braun, Melsungen, Germany) twice per minute by the CAIS system. On placebo days, exactly the same infusion protocol over time was employed, administering normal saline without ethanol. As shown in Figure 1, nine BrAC measurements were obtained using a Alcotest 6810 med breathalyzer (Draeger Sicherheitstechnik, Lübeck, Germany) during the course of the experiment. As the breathalyzer cannot be taken into the scanning room, we collected end-expiratory air from subjects lying in the scanner, using a standard children's toy balloon, and squeezed the air through the breathalyzer immediately afterwards. 16
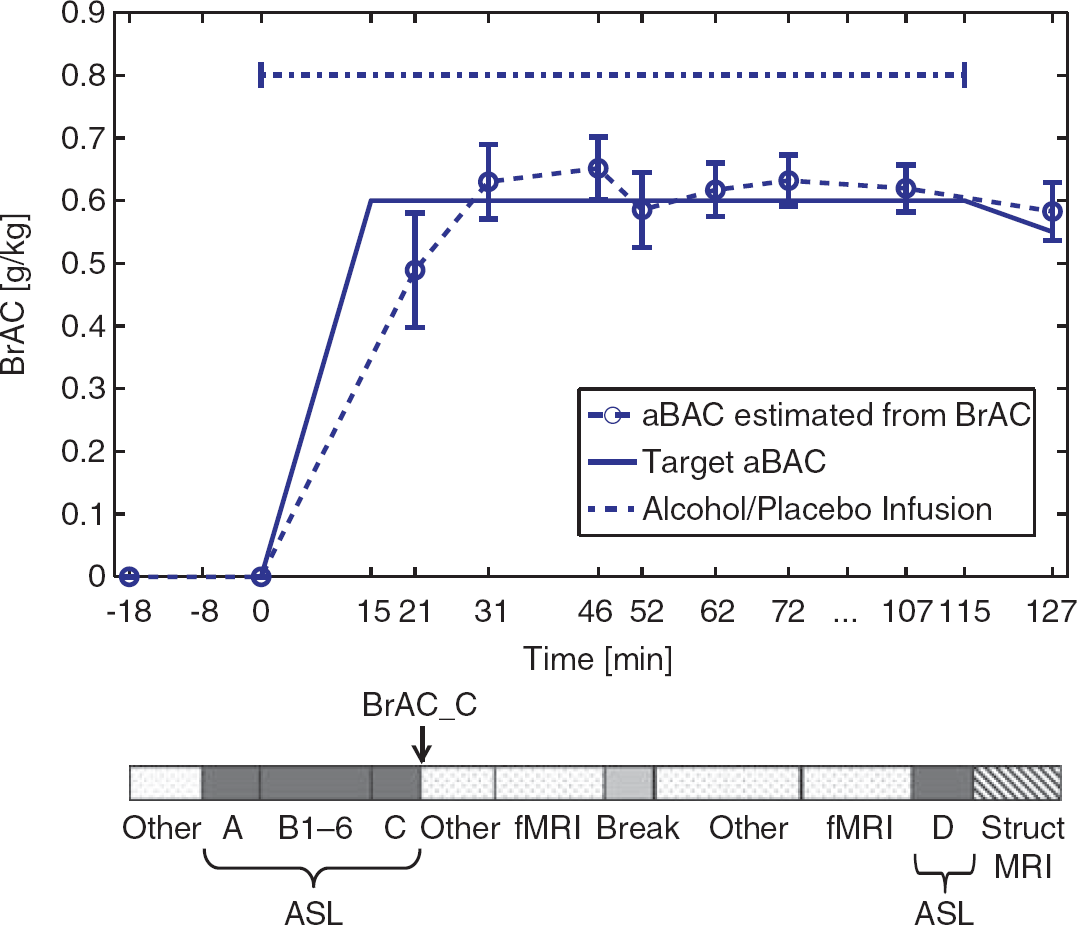
The time course of target and actual (mean±s.d.) breath blood alcohol concentration (BrAC) during the experiment with respect to the experimental measures listed at the bottom. ‘Other’ refers mainly to measures of eye movements and ratings of subjective perception of alcohol, which will be reported elsewhere. aBAC, arterial blood alcohol concentration; ASL, arterial spin labeling; fMRI, functional magnetic resonance imaging; MRI, magnetic resonance imaging.
Breath alcohol concentration measurements are preferable in our experiments over venous blood sampling because BrAC is always closely related to arterial blood alcohol concentration, even during the early phase of intravenous ethanol administration, when arterial and venous BAC values can differ substantially.17, 18 Physiologically, alcohol may change perfusion via two mechanisms: (1) alcohol may affect perfusion directly via its vasodilatory effects on arterial vessels 19 or (2) alcohol may lead to changes in brain metabolism that triggers indirect vasodilatory mechanisms. 20 Arterial BAC levels would obviously govern the first effect whereas the second effect could be a complicated function of local extravascular alcohol concentration. But even extravascular alcohol concentration should be closely related to arterial blood alcohol concentration than to peripheral venous BAC because the exchange of alcohol between arterial and capillary vessels with the extravascular tissue in the brain should be fast because of the high-flow rate and the relatively low extravascular water volume of the brain. Arterial spin labeling data were acquired once before (measurement A in Figure 1), 6 times during the 15-minute ramp of linearly increasing BrAC (B1 to B6), once after reaching the target alcohol concentration (C), and again 110 minutes after the start of the infusion (late measurement: D). Additional neuropsychological measures (subjective perception of alcohol, eye tracking) and 2 functional magnetic resonance imaging paradigms (stop-signal task and Taylor aggression paradigm) were acquired and will be reported elsewhere. Subjects received a washroom break after ∼1 hour inside the MR scanner.
Magnetic Resonance Data Acquisition and Processing
(See Supplementary 1 for details) Imaging data were acquired with a 3T MR scanner (Magnetom Tim Trio, Siemens, Germany) equipped with a 12-channel head coil. Perfusion was measured using a pulsed ASL sequence with a three-dimensional GRASE readout. 21 Images at inflow delays (TI) of 300 to 2600 milliseconds were acquired with an increment of 100 milliseconds allowing the estimation of perfusion as well as bolus arrival time of the spin-labeled blood. In each voxel, the ASL signal as a function of TI was fitted using a 1-compartment model 22 with perfusion CBF and bolus arrival time as free parameters. At the end of one scanning session, T2- and T1-weighted images were acquired for spatial normalization and tissue segmentation purposes. A gray and white matter mask was generated to compute global perfusion.
Data Modeling and Statistical Tests
The CBF data matrix DCBF as a function of time (18 time points for both sessions) was now modeled for each voxel or region of interest (ROI) and subject using a general linear model with six basis functions
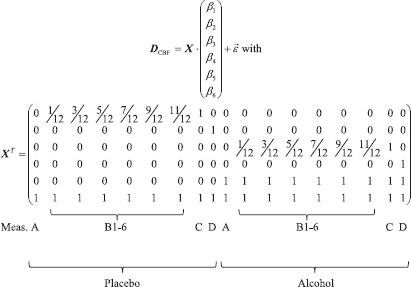
Thus, β6 represents the CBF baseline and β5 a potential offset of the baseline for the alcohol session. β1 and β3 represent a linear increase (ramp) of CFB as a function of BrAC. β2 and β4 represent the CBF increase at the late measurement point D over the baseline. The group average of β6 will be presented as a baseline perfusion map. Given our range of BrAC values, the linear ramp model was appropriate. Use of a logistic function, commonly applied in pharmacology, did not result in a stable fit. A model comparison between a 4-parameter logistic function and the linear model based on the Bayes Information Criterion also favoured the linear ramp model. Such models would require much higher BrAC levels unobtainable in human subjects to capture the tail end of the function or more precise, technically challenging measurements of perfusion and BAC with higher temporal resolution to capture the shape of the initial rise of perfusion.
Relative effects of placebo/alcohol were computed about the substance-specific baseline. Given that the targeted BrAC level was not reached precisely, we used the BrAC-based estimate of BrAC at time point C (BrAC_C; see Figure 1) to predict the placebo-controlled, relative alcohol effect for 60 mg/dL:
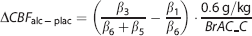
This quantity will be referred to as the ‘alcohol effect’ below.
On the group level, CBF values were subsequently analyzed voxel wise for the whole brain (mean from individual gray+white matter masks—see above) and for 26 ROIs covering the complete cerebrum (regional means). Regions of interest were defined in Montreal Neurological Institute space based on the automated anatomic labeling atlas 23 for subcortical regions and the Talairach Daemon database24, 25 for lobar regions using the WFU-Pickatlas tool. 26
The alcohol effect was tested against null on the group level (N=48) using a 2-sided student's t-test. Statistics were computed using SPM8, and active regions were specified based on the Talairach Daemon.24, 25
The effect sizes d are given for each ROI and were computed following 27 as
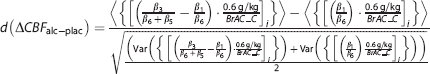
where 〈.〉 represents the mean, Var(.) the variance, and
To investigate a possible gender effect,
RESULTS
To demonstrate that our perfusion measurements are physiologically reasonable, we generated a map of group average baseline perfusion (see Figure 2A). As expected, gray matter regions show stronger perfusion values than white matter regions. The global baseline perfusion value of 54 mL blood per100 g tissue per minute (see Table 3—first row and Figure 2B) is comparable in magnitude to previous ASL studies.4, 7, 5 Note in Figure 2A that ASL data was not acquired for the cerebellum.
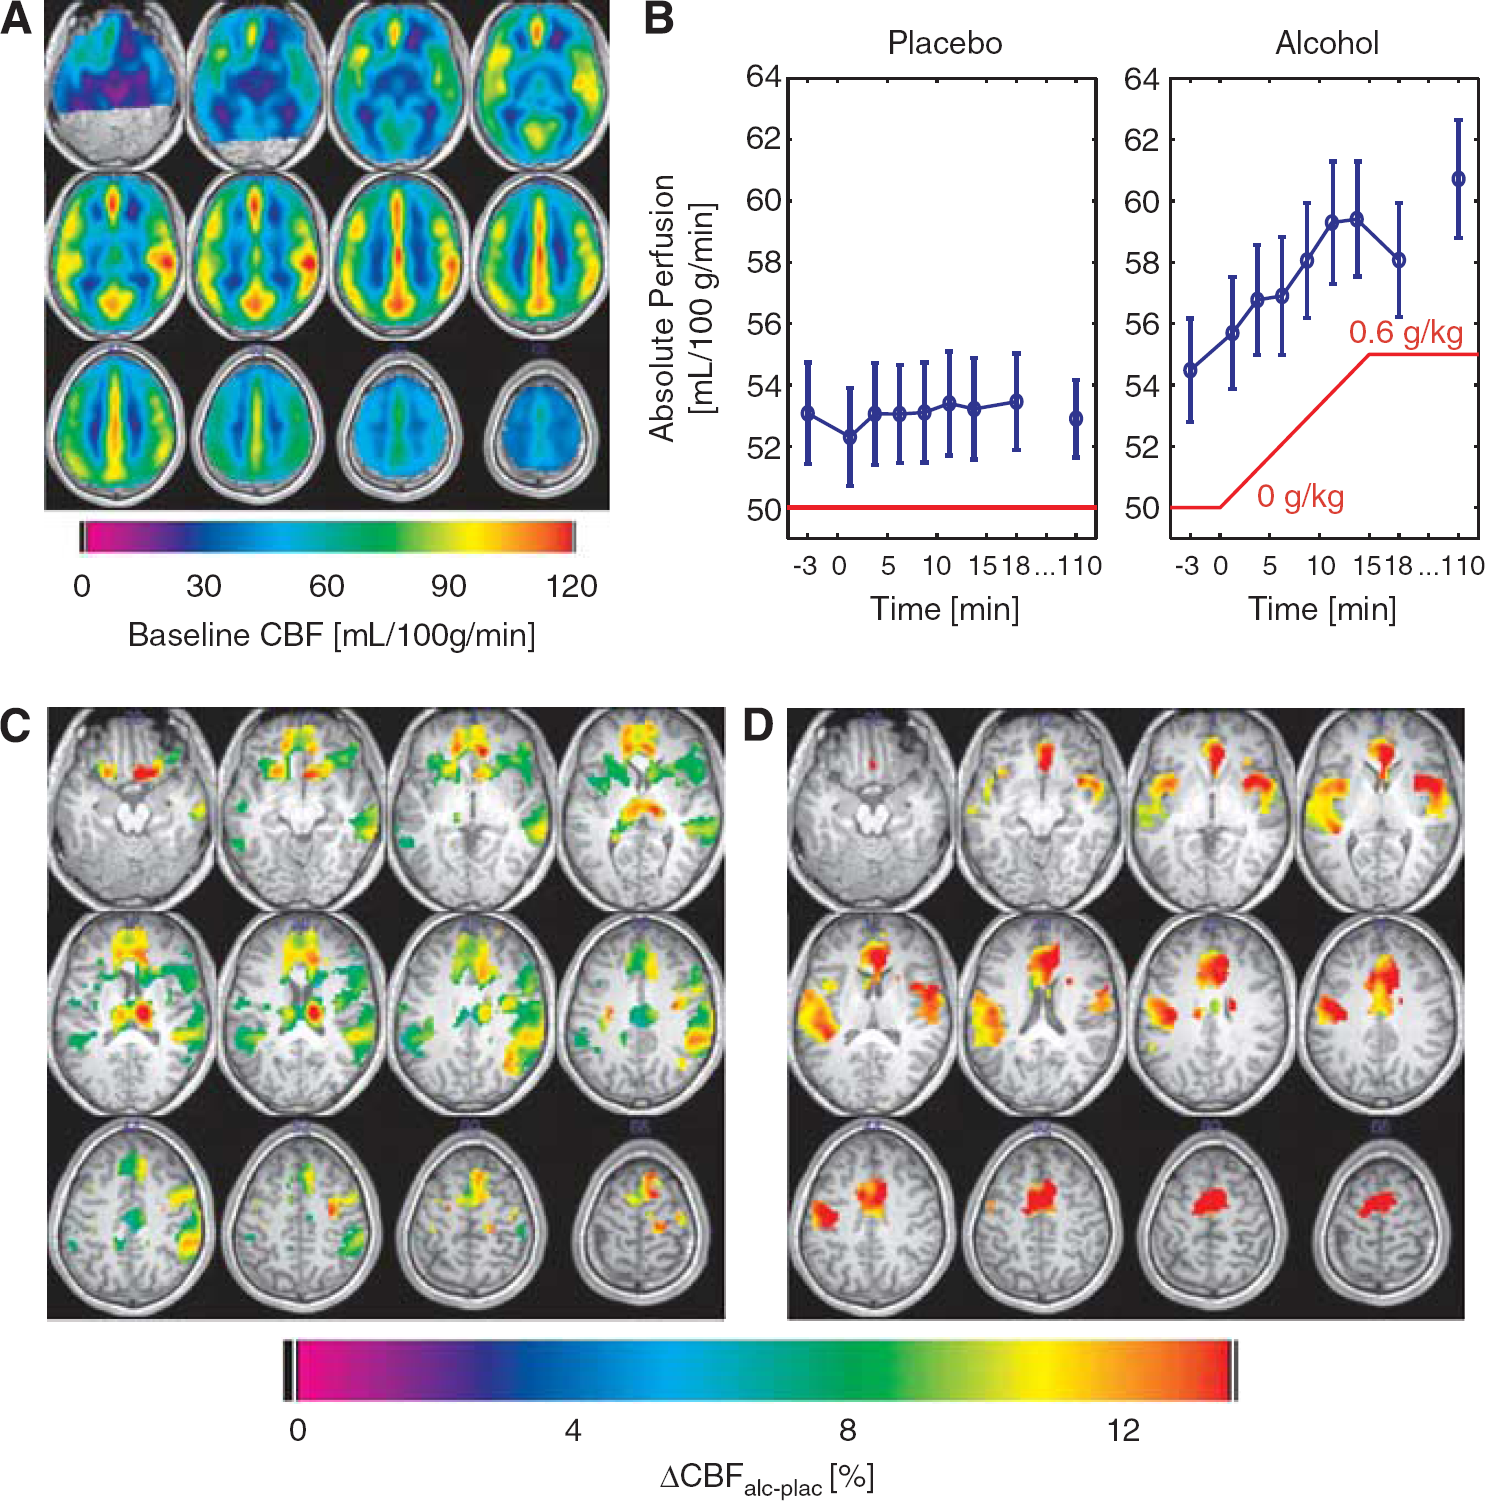
Results of the cerebral blood flow (CBF) measurements. (
As displayed in Figure 2B, global perfusion increases under alcohol from ∼54 mL/100 g per minute to 59 mL/100 g per minute and follows BrAC immediately. The relative change of 7.6% globally when extrapolated to 0.6 g/kg is highly significant (see Table 3—first row).
The results of the voxel-wise analysis of the regional alcohol effect are shown in Figure 2C with statistics in Table 2 for clusters with more than 25 voxels. A decrease in perfusion could not be observed in any voxel even at a liberal threshold of P<0.001 uncorrected. Results of the statistical analysis of the ROI data indicate substantial perfusion increases (Cohen's d0.5) in all brain regions except the left and right amygdala and the right occipital lobe (cf. Table 3; first row refers to global data).
Cluster statistics for P>0.05 (FWE) for clusters with more than 25 3 mm isotropic voxels
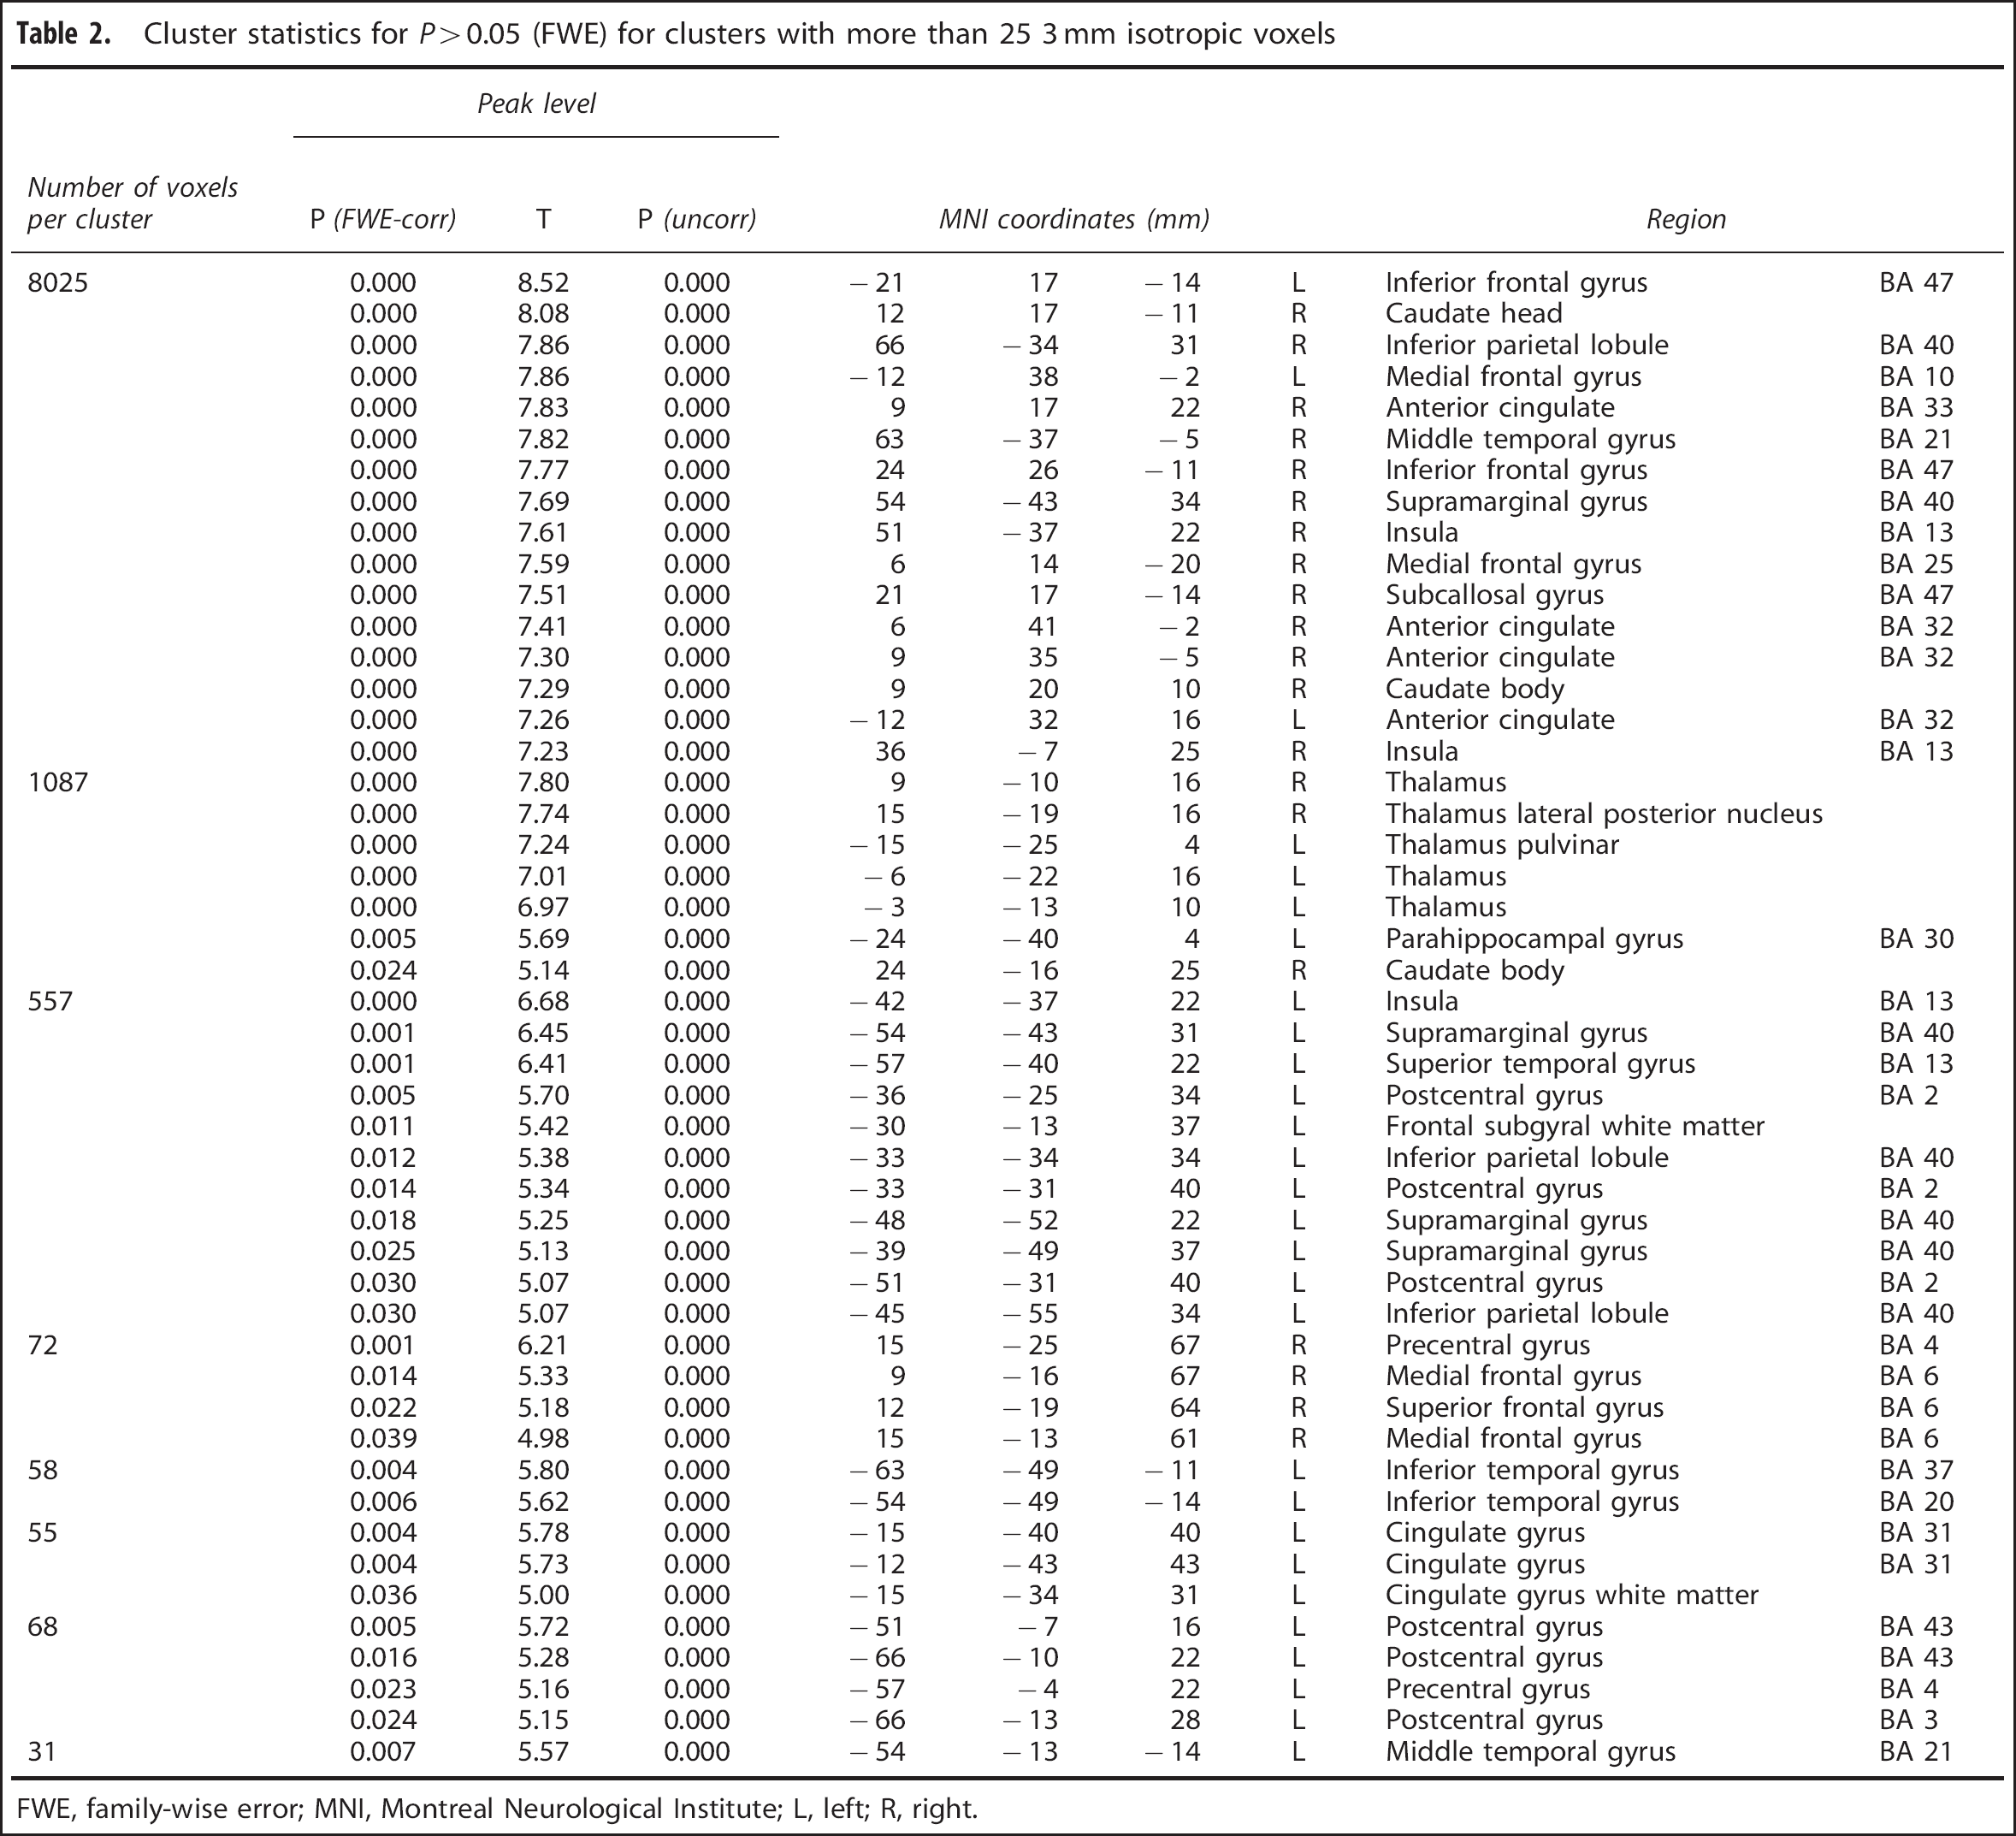
FWE, family-wise error; MNI, Montreal Neurological Institute; L, left; R, right.
Quantitative results for global and regional CBF values
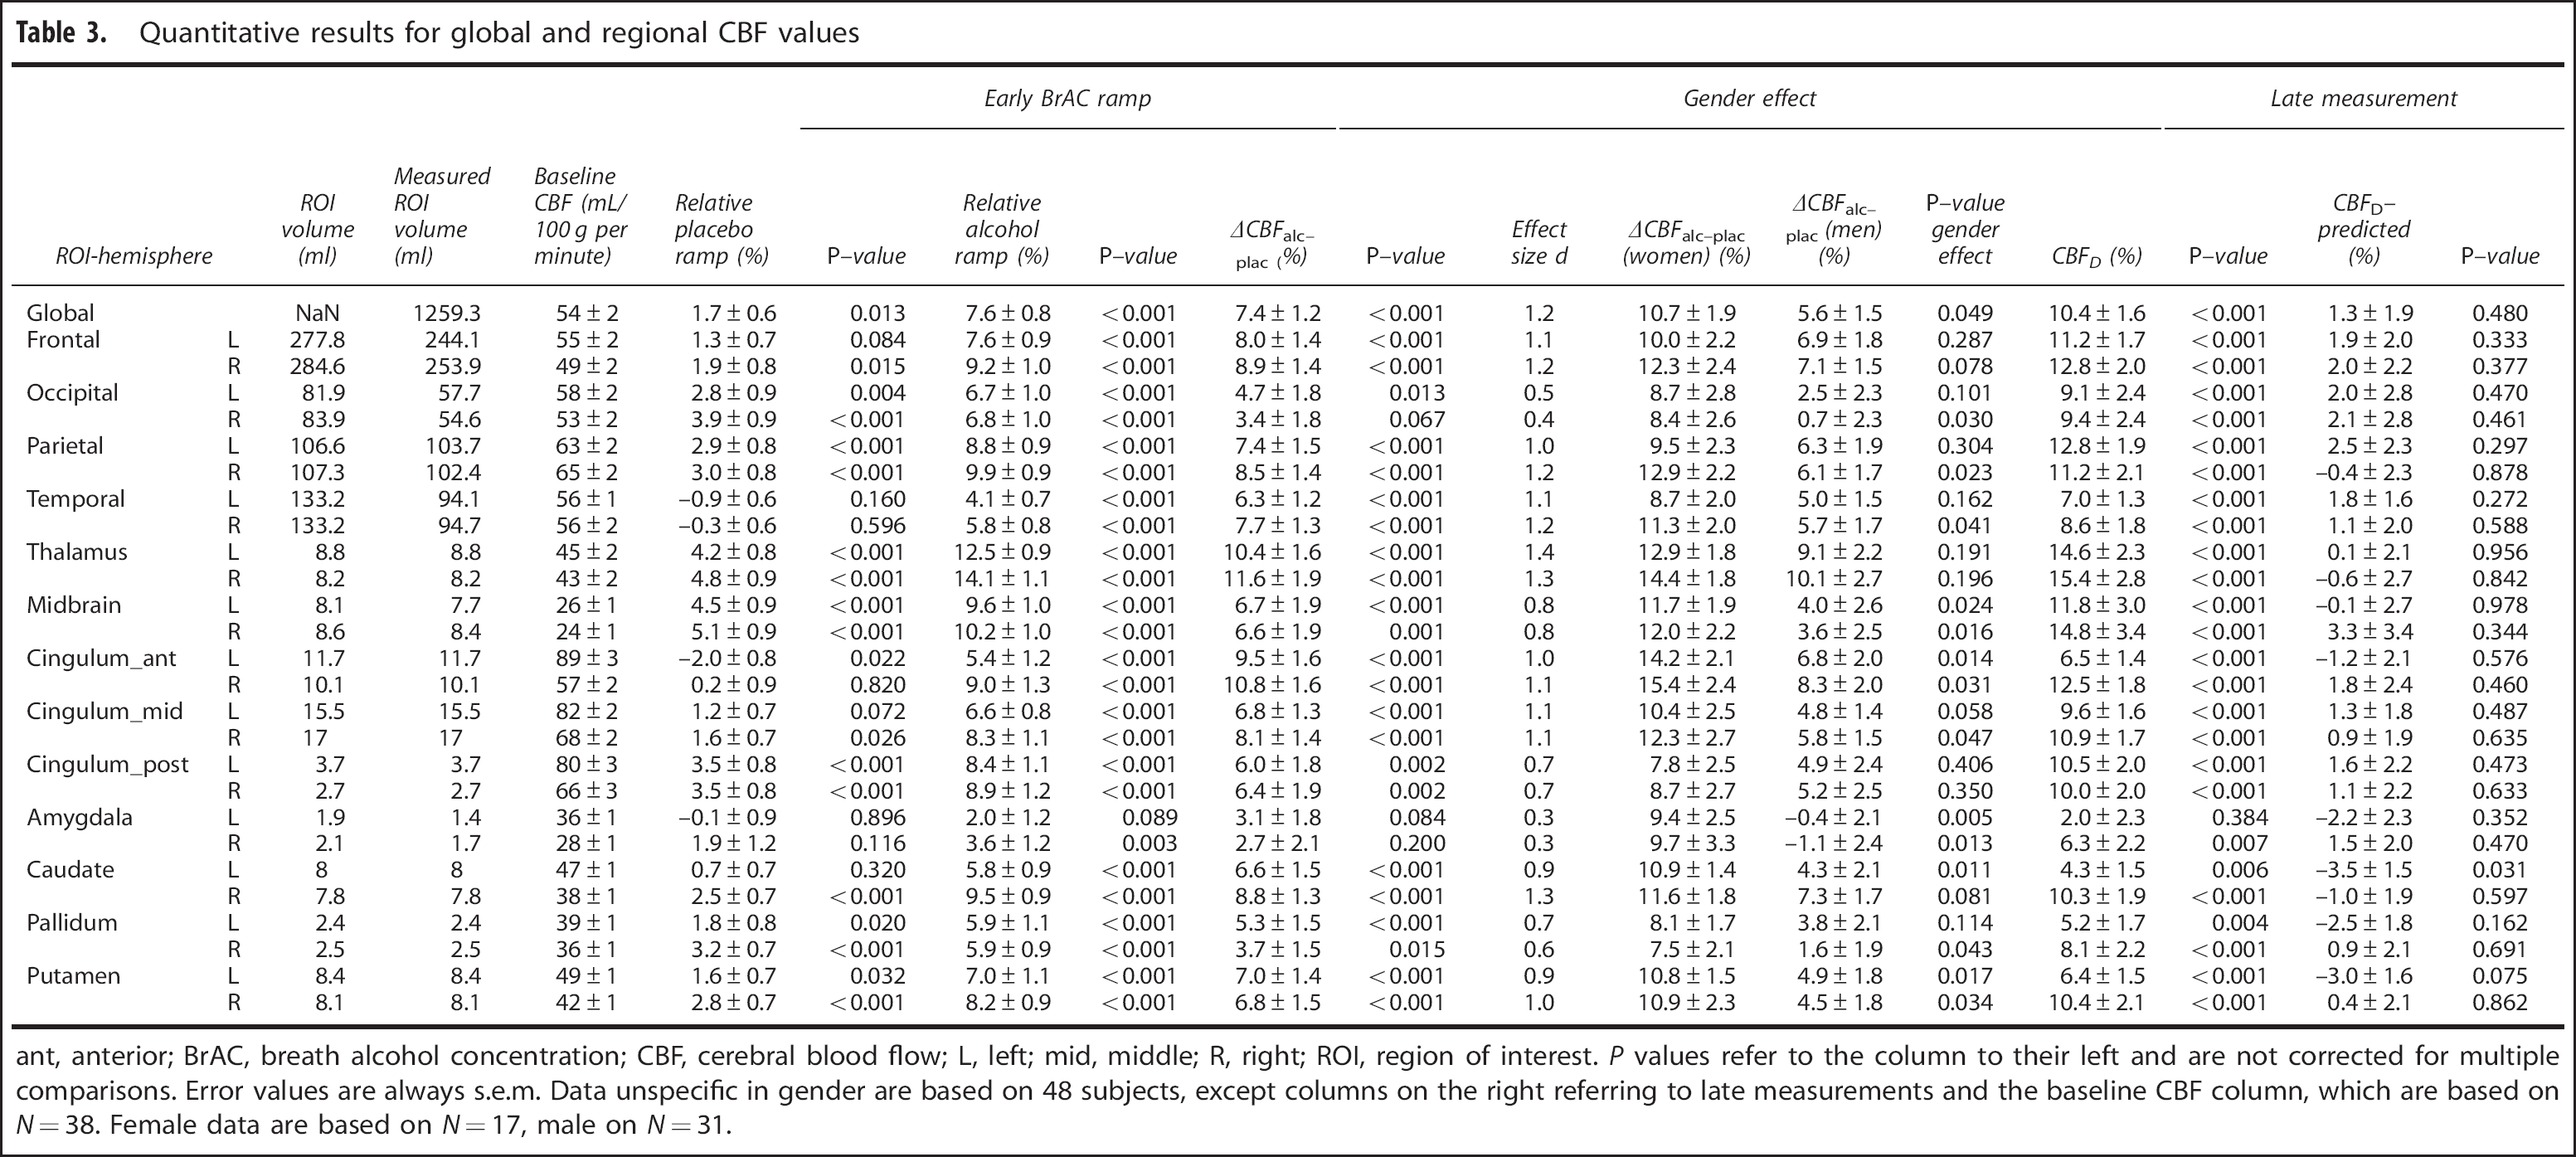
ant, anterior; BrAC, breath alcohol concentration; CBF, cerebral blood flow; L, left; mid, middle; R, right; ROI, region of interest.
P values refer to the column to their left and are not corrected for multiple comparisons. Error values are always s.e.m. Data unspecific in gender are based on 48 subjects, except columns on the right referring to late measurements and the baseline CBF column, which are based on N=38. Female data are based on N=17, male on N=31.
Regarding a potential gender effect, our global data (first row of Table 3) show a significantly stronger increase of perfusion in women than in men (P=0.049). As the numbers of female and male participants were unequal, we used bootstrapping to confirm the significance of the finding by computing 95% confidence intervals for the ramp difference between men and women in 500 sets of 16 female subjects and 16 FHA-matched male subjects (for one female subject, the FHA status was unknown). For all regions including the global value with P0.05, the 95% confidence interval for the gender difference does not include zero, which confirms our finding. However, the effect is not significant in any ROI when correcting conservatively for multiple comparisons.
Late perfusion measurements obtained 110 minutes after alcohol administration began are summarized in the last four columns of Table 3 and Figure 2D. Although alcohol effects on perfusion seem to change over time in the maps (Figures 2C, 2D), statistical testing revealed that perfusion at 110 minutes did neither change significantly globally nor in the ROIs compared with perfusion measured ∼90 minutes earlier when initially reaching the target BrAC level (perfusion value predicted for an BrAC of 0.6 g/kg; see Materials and Methods).
A few additional insights from the global perfusion data are not included in Table 3. There is no significant effect of substance (P=0.49) or gender (P=0.13) on baseline perfusion. The placebo ramp is significantly positive (P=0.01) overall but not significant in women (P=0.51); the effect is driven by males (P=0.01). The late perfusion measurement (D) in the placebo condition is not significantly different from the baseline (P=0.40), but is highly significant for the alcohol condition (see Table 3). However, there is no significant gender effect (P=0.97) for the late measurement (D). The late measurement is not significantly different (P=0.48) from the value predicted by the initial ramp response (see equation (2)). All the nonsignificant findings above are also true for all 26 ROIs when correcting for multiple comparisons (α=0.05/26).
Parameters additional to perfusion are not the focus of this paper. However, we did investigate a potential linear decrease of bolus arrival time under alcohol but could not observe such an effect.
DISCUSSION
Time Course, Dependence on Brain Exposure, and Spatial Distribution of Perfusion
The observed increase in global perfusion of 7% with respect to the placebo condition for an BrAC value of 0.6 g/kg is in approximate agreement with previous studies cited in Table 1. Figure 2B demonstrates that this increase follows BrAC without an obvious delay at a time scale of minutes. Although a small, significant increase of global perfusion of 1.7% in the placebo condition was observed (see Table 3), the alcohol effect is dominated by the alcohol ramp. Globally, and in all 26 ROIs, no significant acute tolerance or sensitization (change in perfusion over the course of almost 2 hours of steady exposure) could be detected (see the last 2 columns of Table 3). However, the voxel-wise perfusion analysis in Figure 2C, using the early ramp data in 48 subjects compared with late measurements after 110 minutes of alcohol infusion in 38 subjects, suggests some regional differences (see Figure 2D). For example, the thalamus and the right temporoparietal regions are missing in the late measurement maps. Frontal activations are focused more medially. In addition, the effect seems to be stronger in the left hemisphere in the late data whereas it appears stronger in the right hemisphere in the early data. Overall, the late perfusion changes are larger in magnitude, but the s.e.m. is also larger (see Table 3). The comparison of Figures 2C, 2D is an illustration of the common problem that statistically thresholded functional brain maps may appear very different despite the fact that no statistically significant differences exist between the two conditions.
Both early and late maps of the perfusion increase show large regions with no significant alcohol effect. A known issue with the voxel-wise analysis is the high potential for false-negative findings. In anticipation of such a bias, we conducted the ROI analysis, which demonstrates that most regions of the brain show a highly significant alcohol effect (after correcting for multiple comparisons). Effect sizes are medium to large, ranging from 0.6 to 1.2 (Cohen's d). The occipital lobes and the amygdalae are exceptions. Such effects still indicate a substantial amount of inter-subject variability despite the employed CAIS infusion approach. Unfortunately, a comparison of effect size with previous studies is not sensible in this context, as the available sample sizes are too small.
Similar significant changes are found 110 minutes after the start of the infusion. Even for the occipital lobe, the late changes are significant. Differences between the early and late measurement are far from significance. Amygdala data should be interpreted with caution because the regions are small, partially cut off by our field of vision, and at the bottom of the ASL data slab where ASL data quality is limited. The relatively low increase in perfusion in the occipital lobe is in agreement with the FDG–PET finding that glucose uptake relative to the whole-brain uptake is decreased in the occipital lobe (and the cerebellum), whereas other brain regions show a relative increase in uptake. 28 This observation indicates that the alcohol effect on perfusion might not be completely independent of the metabolic effect, which would be the case if direct vasodilatory effects of alcohol 19 would dominate the perfusion effect. However, the correlation of perfusion and brain metabolism is complicated. Whereas glucose metabolism is known to decrease with alcohol administration, 29 acetate, which also can be metabolized, exhibits an increased uptake in response to alcohol. 30
We shall discuss briefly the unexpected observation that perfusion appears to drop immediately after the BrAC curve changes from linear increase to a constant level (point BrAC_C at 18 minutes in Figure 1). Because the effect is only a trend when testing measurement C against B6 using a 2-sided paired t-test (P=0.09), we did not pursue the effect in great detail. Given that the effect is not observed in the placebo experiment, we consider a measurement error unlikely. We can think of two explanations for this effect: (a) perfusion might immediately respond to the leveling off of BrAC; (b) the effect might be an unwanted artifact of our infusion method. As shown in Figure 1, the actual BrAC reading at 21 minutes is below the target of 0.6 g/kg. Computer-assisted infusion of ethanol system software uses real-time feedback of actual BrAC measurements to compute adjustments to the infusion rate to maintain fidelity to the prescribed trajectory. However, we could only obtain BrAC readings starting 21 minutes after the start of the infusion to avoid an interference with MR data acquisition. After 15 minutes, the ascending limb BrAC should ideally have turned sharply into a constant time course. However, the CAIS software first received feedback about the low BrACs only at 21 minutes. Based on other studies using CAIS, it is probable that the uncorrected trajectory of BrAC included a transient drop during the interval from ∼15 to 23 minutes. In either case, the correspondingly dropping perfusion value appears to indicate a very tight coupling between BrAC and perfusion.
Gender Effect
We were not able to replicate the findings by Rickenbacher et al 7 in nine women and 10 men, that only men show an increase of brain perfusion after alcohol administration. Our global data show even a significantly stronger acute effect of alcohol on brain perfusion in women. The average global perfusion increase in women of 11% was almost double than that of men right after the BrAC ramp (see Table 3). However, the inter-subject variability is large and requires additional studies with more subjects to confirm our findings. At the late measurement point (D), the increase in both groups was ∼10% and no significant gender difference could be found. Larger group studies on the gender effect are encouraged and should pay particular attention to potential effects of gender on the time course of the perfusion response.
Methodological Issues
Acquiring ASL data at multiple inflow times in combination with the employed 2-parameter model offers the advantage of more accurate perfusion data in large regions of the brain owing to the additional information of voxel-wise bolus arrival time. However, in other regions of the brain, perfusion estimates may be biased by arterial transit flow, that contributes to the ASL signal but not to perfusion of local tissue. We have addressed this concern by employing two additional models to our data: (1) a conventional one-compartment model with an assumed bolus arrival time equals 0.8 seconds, which was only applied to the tail of the inflow curve with inflow times of 2 seconds and above. In this range of inflow times, the arterial component should not be present any more. (2) A two-compartment, four-parameter model that also includes arterial blood volume and arterial bolus arrival time as additional parameters. 31 However, these alternative models had only a minor influence on our results, e.g., the global alcohol effect on perfusion is 7.7±1.5% increase for model 2 versus 7.4±1.2% presented in Table 3, and do not change our general conclusions.
Conclusion
Our study demonstrates not only that moderate levels of BrAC increased brain perfusion but also that the effect follows the increase of BrAC immediately and persists for 2 hours of constant BrAC. We have further demonstrated that the effect is present throughout the brain with the potential exception of the occipital lobe and the amygdala. We could not replicate a report that women do not show such an effect, finding rather that the effect is stronger in women compared with men. The strong inter-subject variability is of interest, and larger studies are needed to address correlates of the alcohol effect on perfusion. Correlates of interest include age, gender, metabolic responses, recent or family history of drinking habits, other results of concomitant functional imaging studies, and behavioral measures.
Footnotes
The authors declare that over the past three years USZ has received compensation from Lundbeck, sächsische Landesärztekammer, Gewerkschaft Erziehung und Wissenschaft, Park-Krankenhaus Leipzig, ABW Wissenschaftsverlag, Servier, Janssen, GSK, and Pfizer. MG declares that he is collaborating with Siemens on sequence development and received funding from Siemens in the past. The remaining authors declare no conflict of interest.
ACKNOWLEDGMENTS
We thank the radiology staff at the Neuroimaging Center Dresden for managing magnetic resonance imaging recordings, Marie-Charlott Randhan, and Christine Markert for help during functional magnetic resonance imaging data acquisition, Dr Inge Mick, Alexandra Markovic, Maike Neumann, Stefanie Reißmann, and Christian Seipt for recruitment of participants. We thank Prof Sean O'Connor, Victor Vitvitskiy, and Marty Plawecki from the Indiana University School of Medicine, Indianapolis, IN, USA for helping to setup the software controlling the alcohol infusion. Prof Sean O'Connor is a collaborator on the NIAAA grant, and we are grateful for his careful review of the manuscript. We thank Johannes Gregori, Fraunhofer MEVIS, Bremen, Germany for support regarding the ASL sequence and Michael Chappell, Institute of Biomedical Engineering, University of Oxford, UK for supporting the application of his FSL tools for fitting ASL data. We thank the Center for Information Services and High Performance Computing (ZIH) at TU-Dresden for generous allocations of computer time.
References
Supplementary Material
Please find the following supplemental material available below.
For Open Access articles published under a Creative Commons License, all supplemental material carries the same license as the article it is associated with.
For non-Open Access articles published, all supplemental material carries a non-exclusive license, and permission requests for re-use of supplemental material or any part of supplemental material shall be sent directly to the copyright owner as specified in the copyright notice associated with the article.