
Abstract
This study characterized the effects of cerebral ischemia and reperfusion on T2∗-weighted magnetic resonance image (MRI) responses to brief oxygen challenge (OC) in transient (60 minutes) cerebral ischemia in rats. During occlusion, the ischemic core tissue showed no significant OC response, whereas the perfusion–diffusion mismatch tissue showed markedly higher percent changes relative to normal tissue. After reperfusion, much of the pixels with initial exaggerated OC responses showed normal OC responses, and the majority of these tissues were salvaged as defined by endpoint T2 MRI. The initial core pixels showed exaggerated OC responses after reperfusion, but the majority of the core pixels eventually became infarct, suggesting exaggerated OC responses do not necessarily reflect salvageable tissue. Twenty-four hours after stroke, basal T1 increased in the ischemic core. Oxygen challenge decreased T1 significantly in the core, indicative of the substantial increases in dissolved oxygen in the core as the result of hyperperfusion. We concluded that exaggerated T2∗-weighted MRI responses to OC offer useful insight in ischemic tissue fates. However, exaggerated OC pixels are not all salvageable, and they exhibited complex dynamics depending on reperfusion status, hyperperfusion, and edema effects.
INTRODUCTION
Perfusion and diffusion magnetic resonance images (MRIs) are widely used to distinguish reversible from irreversibly ischemic brain injury, and to guide acute stroke treatment in the preclinical and clinical settings. 1 However, some of the perfusion–diffusion mismatch has been shown to be oligemia, penumbra, or ischemic core. Whether the mismatch tissue is salvageable or not depends on a number of factors, including the duration and nature of ischemic injury, and proximity of patent vessels, among others. 2 Such uncertainty limits the full efficacy of its clinical utility in the diagnosis and treatment monitoring of ischemic stroke. Improved understanding of perfusion–diffusion mismatch and ischemic tissue fate in general would help to improve diagnosis of ischemic stroke.
One new approach to improve delineation of reversible from irreversibly ischemic brain injury uses T2∗-weighted MRI of transient oxygen challenge (OC).3, 4, 5 T2∗-weighted signal intensity is sensitive to relative concentration of deoxyhemoglobin.6, 7 During ischemia, the infarct core showed little or no change in T2∗-weighted signal intensity during OC. The at-risk regions surrounding the infarct core showed an exaggerated OC response compared with the homologous region in the contralateral hemisphere. Oxygen challenge brings in oxygenated blood displacing the high deoxyhemoglobin concentration in the at-risk region where cerebral blood flow (CBF) is partially compromised but has significant metabolic activity. Previous studies investigated OC responses in permanent stroke rats,4, 5 transient (109 minutes) 8 stroke rats. Correlations of OC responses with 2-deoxyglucose 9 and lactate 10 have also been reported. A recent human study 3 showed that the time-intensity curve of the OC reflects differences in deoxyhemoglobin concentration and thus metabolic activity in a subset of patients (see Discussion).
This study further investigated the effects of cerebral ischemia and reperfusion on T2∗-weighted MRI responses to brief OC in transient (60 minutes) cerebral ischemia in rats using additional MRI measures and analysis. The ischemic core, normal and mismatch tissues were objectively classified and temporally tracked pixel-by-pixel using automated cluster analysis of quantitative T2, apparent diffusion coefficient (ADC) and CBF. 11 Moreover, the influence of ischemia-induced and OC-induced T1 changes on T2∗-weighted OC responses were analyzed.
MATERIALS AND METHODS
Animal Preparation
All experimental procedures were approved by the Institutional Animal Care and Utilization Committee, University of Texas Health Science Center at San Antonio. Eight male Sprague–Dawley rats (250 to 300 g) were anesthetized with 2% isoflurane in air during surgery. Transient (60 minute) focal brain ischemia of the right hemisphere was induced using the intraluminal middle cerebral artery occlusion (MCAO) method.
12
Animals were mechanically ventilated and maintained at ∼1.2% isoflurane during MRI. End-tidal CO2 was monitored
Quantitative CBF and ADC were acquired every 30 minutes post occlusion up to 180 minutes, and again at 24 hours after stroke. Transient OC (inhaling oxygen) was performed at 45 minutes, 150 minutes, and 24 hours post occlusion. T2∗-weighted MRI data were continuously acquired during which the animals breathed 1-minute air, 2-minute O2, 5-minute air, and 2-minute O2, and 2-minute air. To evaluate the possible effects of ischemia and OC on T1 and CBF (which could indirectly affect T2∗-weighted signal changes during OC), quantitative T1 and CBF were measured during air and during oxygen inhalation (6 minutes). This was performed only at 24 hours after stroke on some animals (
Magnetic Resonance Imaging Experiments
Magnetic resonance imaging experiments were performed on a 7-T/40-cm magnet, a Biospec Bruker console (Billerica, MA, USA), and a 40-G/cm gradient insert (ID=12 cm, 120-
Apparent diffusion coefficient
Averaged ADC was obtained by averaging three ADC maps with diffusion-sensitive gradients separately applied along the x, y, or z direction. Single-shot, spin-echo, echo-planar images were acquired
12
with matrix=96 × 96 with partial Fourier (5/8) acquisition and reconstructed to 128 × 128, field of view (FOV)=2.56 × 2.56 cm, seven 1.5-mm slices, repetition time (TR)=3 seconds (90° flip angle), echo time (TE)=37 milliseconds, b=4 and 1,200 seconds/mm2, Δ=17.53 milliseconds,
Cerebral blood flow
Cerebral blood flow was measured using the continuous arterial spin labeling technique with single-shot, gradient-echo, echo-planar imaging acquisition as described previously.15, 16 Continuous arterial spin labeling employed a 2.7-second square radiofrequency pulse to the labeling coil. Acquisition parameters were matrix=96 × 96 with partial Fourier (5/8) acquisition and reconstructed to 128 × 128, FOV=2.56 × 2.56 cm, seven 1.5-mm slices, TR=3 seconds (90° flip angle), and TE=10.2 milliseconds.
T2∗-weighted MRI of oxygen challenge
Oxygen challenge functional magnetic resonance imaging was acquired using T2∗-weighted gradient-echo echo-planar image, matrix=96 × 96 (reconstructed to 128 × 128), FOV=2.56 × 2.56 cm, seven 1.5-mm slices, TR=10 seconds, TE=26 milliseconds, 90° flip angle. Oxygen challenge experiment paradigm was: 1 minute off, 2 minutes on, 5 minutes off, 2 minutes on, and 1 minute off, and 72 repetitions in total. For some experiments to evaluate the effect of T1, measurements were also made with TR=1 second (60° flip angle) in the same animals.
T1
T1-weighted images were acquired using single-shot inversion-recovery gradient-echo echo-planar image sequence with six different inversion delay times (0.025, 0.5, 1, 2, 4, and 8 seconds), matrix=96 × 96 (reconstructed to 128 × 128), FOV=2.56 × 2.56 cm, TR=12 seconds (90° flip angle), and 4 signal averages.
T2
T2-weighted images were acquired using fast spin-echo pulse sequence with two effective echo times (50 and 80 milliseconds), TR=2 seconds (90° flip angle), matrix=128 × 128, FOV=2.56 × 2.56 cm, echo train length 8, and eight signal averages.
Data Analysis
Data analysis used codes written in Matlab (MathWorks, Natick, MA, USA) and the STIMULATE (University of Minnesota, Minneapolis, MN, USA) software. Data were reported as mean±s.d., with
Cerebrospinal fluid and the corpus callosum were excluded from analysis. Three tissue types (normal, perfusion–diffusion mismatch, and ischemic core) were characterized by using auto-clustering ISODATA method 11 based on ADC and CBF data. Images among different animals were co-registered using custom-designed semi-automatic co-registration software16, 18, 19, 20 to generate group-averaged maps. Percent changes, ADC and CBF values were analyzed for different tissue types for individual animals, followed by group averaging.
Oxygen challenge percent changes at different time points were also plotted on ADC–CBF contour plots. The grid size was 0.05 × 10⁻³ mm2/sec for ADC or 0.1 mL/g per minute for CBF, respectively. Pixel-by-pixel scatterplots of the CBF and ADC values were analyzed to evaluate the distribution of pixels over time.
Oxygen challenge percent changes of recovered and non-recovered tissue from mismatch at 24 hours (determined by 24-hour T2 value) was summarized. T2 threshold was set as mean plus two standard deviations (s.d.) of normal hemisphere T2 values. Percentages of recovered and non-recovered tissue of the mismatch tissue were also calculated.
RESULTS
All recorded physiologic parameters were maintained within normal physiologic ranges (end-tidal CO2: 35 to 45 mm Hg, arterial O2 saturation: 94% to 97%, temperature: 36.5°C to 37.3°C, heart rate: 350–400 b.p.m.) unless otherwise perturbed by OC.
Figure 1 shows the CBF, ADC, and OC T2∗-weighted percent-change maps at 30 minutes, 150 minutes, and 24 hours after transient (60 minutes) MCAO from one animal. At 30 minutes after MCAO, ADC and CBF were reduced in the ischemic hemisphere as expected. ISODATA classified pixels into normal, mismatch, and core clusters at 30 minutes after stroke. The ischemic core pixels showed negative OC percent changes and the mismatch pixels showed substantially higher percent changes compared with the homologous region in the contralateral hemisphere. The majority of the mismatch pixels showed exaggerated OC responses.
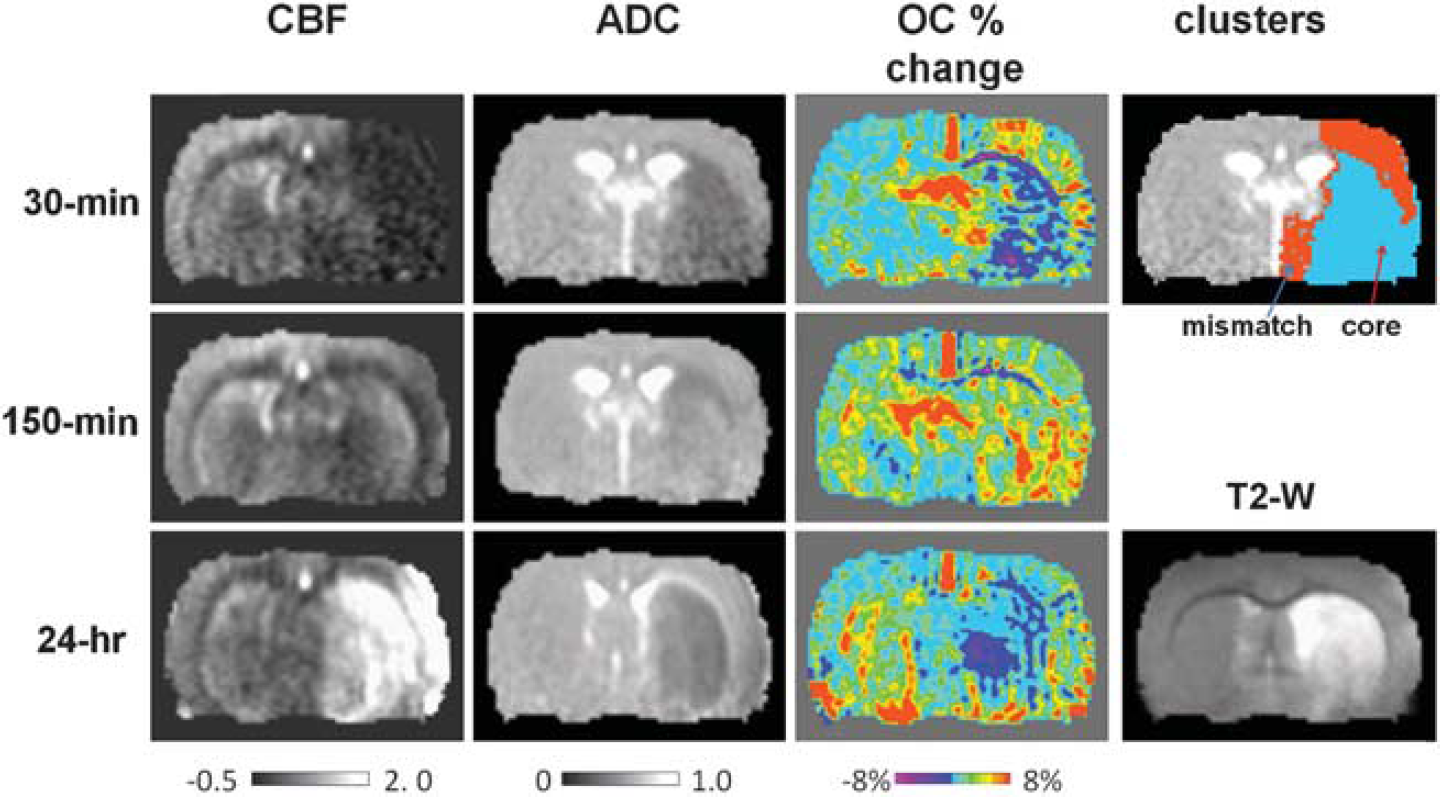
Cerebral blood flow (CBF) maps, apparent diffusion coefficient (ADC) maps, and oxygen-challenge (OC) percent-change maps at 30 minutes, 150 minutes, and 24 hours after middle cerebral artery occlusion (MCAO) from one animal. ISODATA cluster map at 30 minutes and T2 map at 24 hours post occlusion are also shown. Scale bar unit for ADC is 10−3 mm2/second and for CBF is mL/g per minute. In the ISODATA maps, mismatch is shown as red and core as cyan.
After reperfusion, the initial mismatch showed normal OC percent changes and the initial core showed elevated OC percent changes. At 24 hours, the initial mismatch showed normal OC percent changes and the initial core showed negative OC percent changes. T2-weighted MRI at 24 hours showed the majority of the initial mismatch was salvaged but the initial core was not.
The temporal profiles of ADC, CBF, and OC responses for the normal (normal hemisphere), mismatch, and core pixels defined at 30 minutes after MCAO are shown in Figure 2. Apparent diffusion coefficient of the initially defined core transiently recovered at 150 minutes after MCAO but returned to the lower value at 24 hours, indicating that the initially defined core tissue was not salvaged. By contrast, ADC of the initially defined mismatch was mostly normal across all time courses imaged. Cerebral blood flow of the initial mismatch and core were lowered compared with normal at 30 minutes, recovered after reperfusion at 150 minutes, and overshot (hyperperfusion) at 24 hours after MCAO. The initial core showed higher hyperperfusion than the initial mismatch pixels.
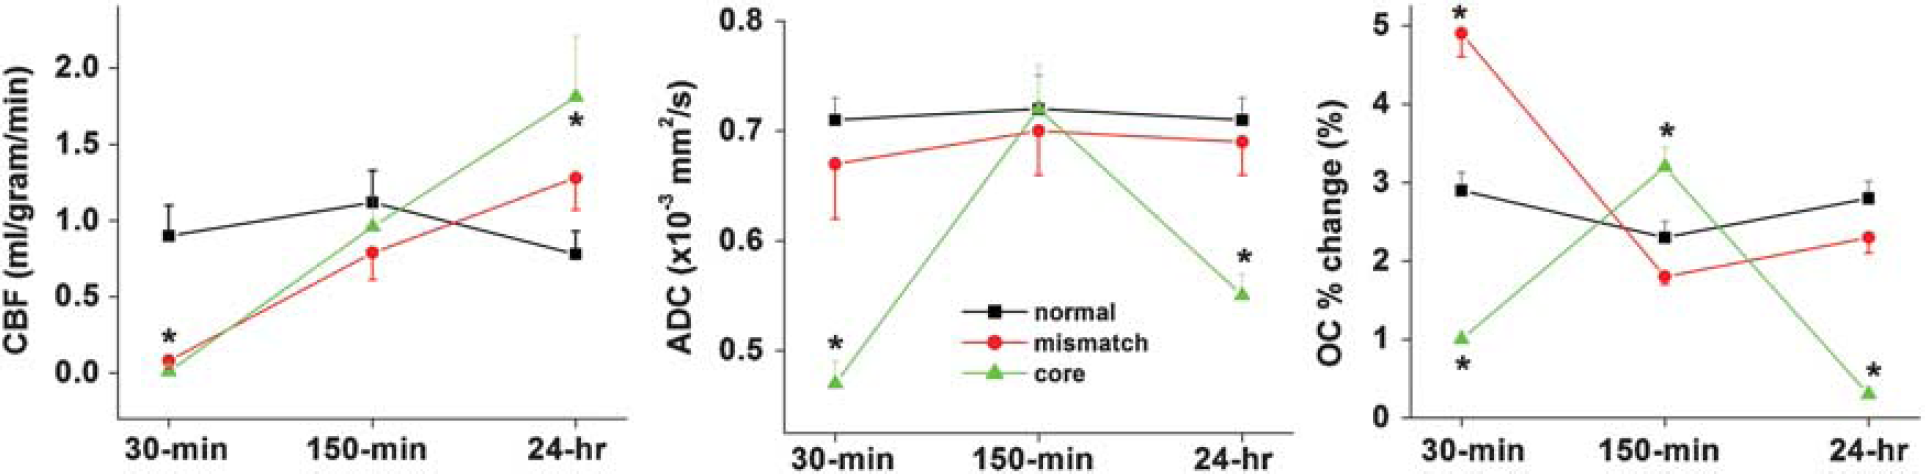
The temporal profiles of cerebral blood flow (CBF), apparent diffusion coefficient (ADC) and oxygen-challenge (OC) responses for the normal (normal hemisphere), mismatch, and core pixels defined at 30 minutes after middle cerebral artery occlusion.
The OC responses were also analyzed using ADC–CBF contour plots with the color-code scale indicating the OC percent changes (Figure 3). The scatterplots also showed the number of pixels in different regions on the ADC–CBF spaces. At 30 minutes, the largest OC percent changes centered ∼0.65 to 0.7 × 10⁻³ mm2/second and 0 to 0.4 mL/g per minute of CBF (circle #1). There were three clusters, with significant number of mismatch pixels. At 150 minutes (after reperfusion), all initial mismatch and core pixels migrated toward the ‘normal’ cluster. There were also elevated OC responses, but the number of pixels contributing to the elevated OC responses were very small (circle #2). At 24 hours, there were significant hyperperfusion pixels with reduced ADC and low or negative OC responses (circle #3), which corresponded to infarct as indicated by T2-weighted enhancement, or normal ADC and relative high OC responses (circle #4), which corresponded to tissues at risk.
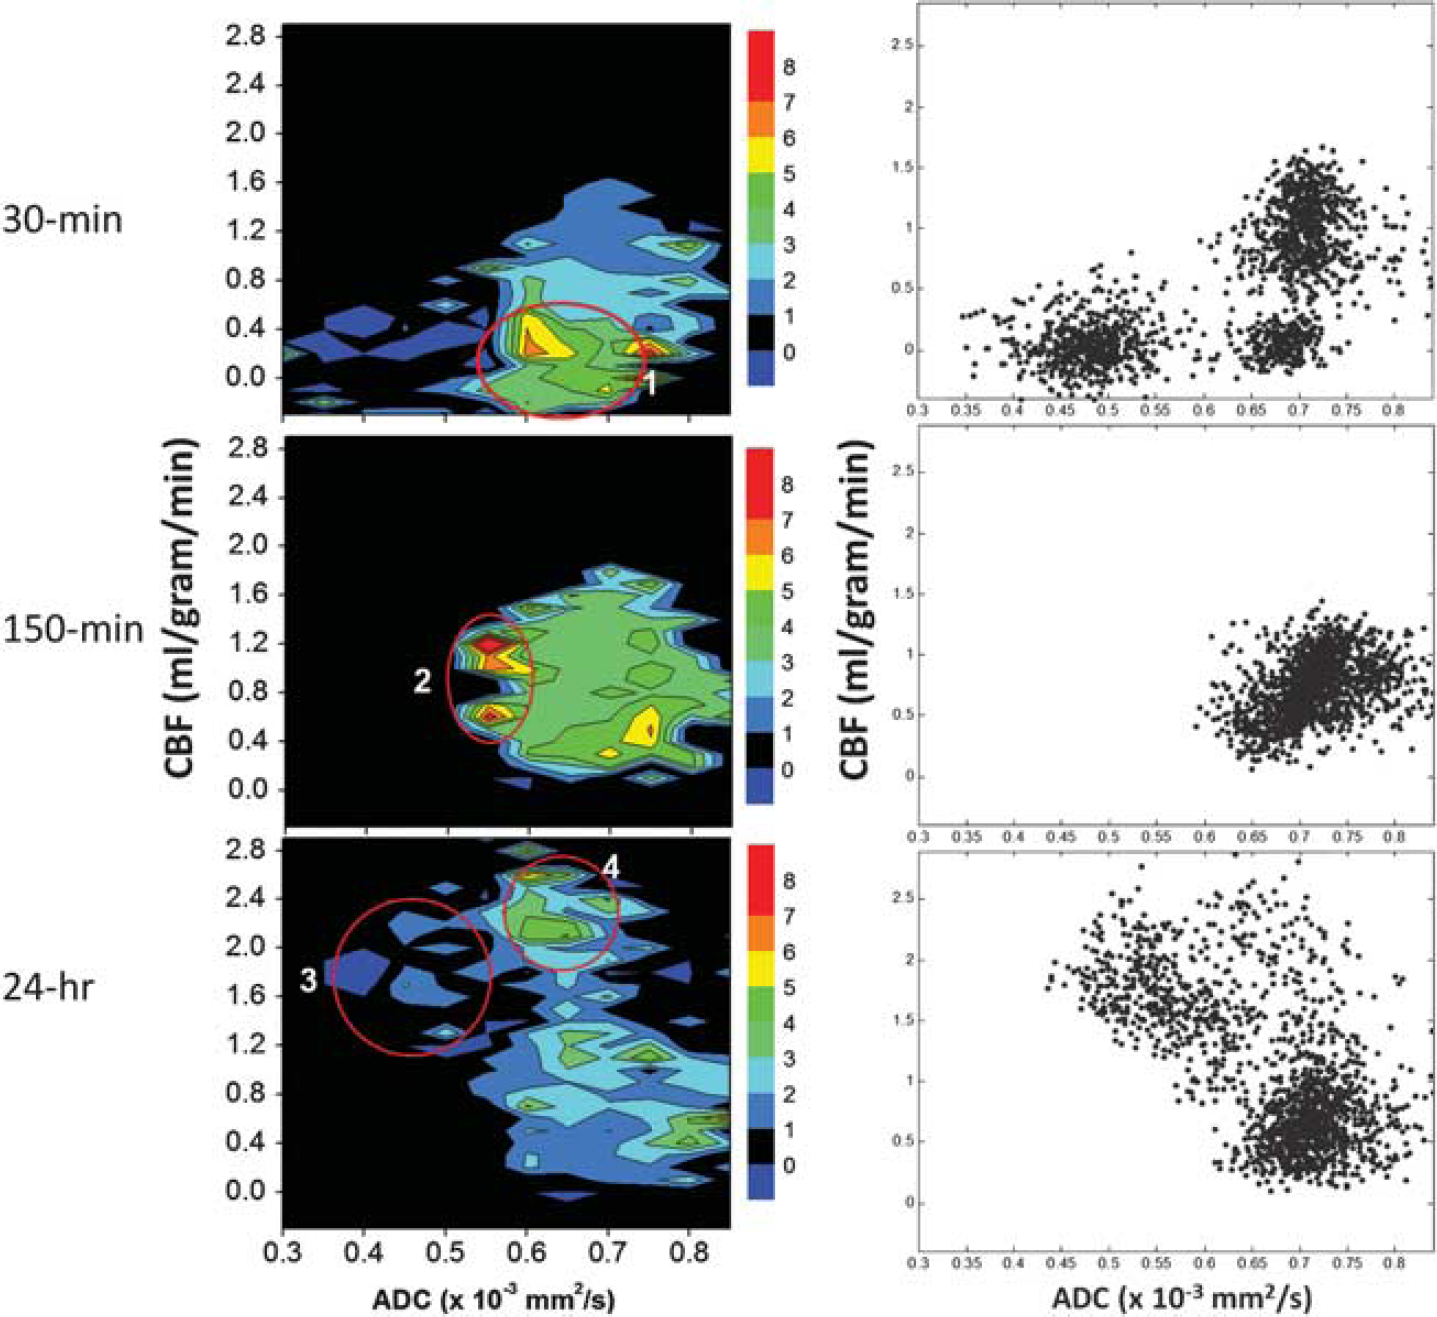
Group-averaged cerebral blood flow (CBF) and apparent diffusion coefficient (ADC) contour plots of percent changes by oxygen challenge and CBF–ADC scatterplots at 30 minutes, 150 minutes, and 24 hours after stroke. Color bars indicate percent changes.
The fate of diffusion/perfusion mismatch pixels (defined at 30 minutes post occlusion) was tracked and OC percent changes, T2, and the number of pixels of the mismatch tissue that were salvaged and not salvaged were analyzed (Figure 4). The tissues that were subsequently salvaged by reperfusion showed larger OC percent changes but those not salvaged showed lower OC percent changes. Only ∼68% of mismatch tissues were salvaged. Similar analysis was done for pixels with exaggerated OC responses using a threshold of the mean plus one s.d. of normal hemisphere OC response. The average value of the threshold was 4.2%±0.8%. Approximately 12% voxels showed exaggerated OC response. Voxels with exaggerated OC was ∼70% of DWI–PWI mismatch pixels (Figure 5). The number of non-salvaged pixels was similar between exaggerated OC and mismatch. As such, a smaller percentage of pixels with exaggerated OC responses were salvaged. This finding suggests that DWI–PWI overestimates penumbral tissue (i.e. some tissue of mismatch is oligemic). Alternative explanation is the mismatch volume was overestimated or the exaggerated OC volume was underestimated by our analysis method.
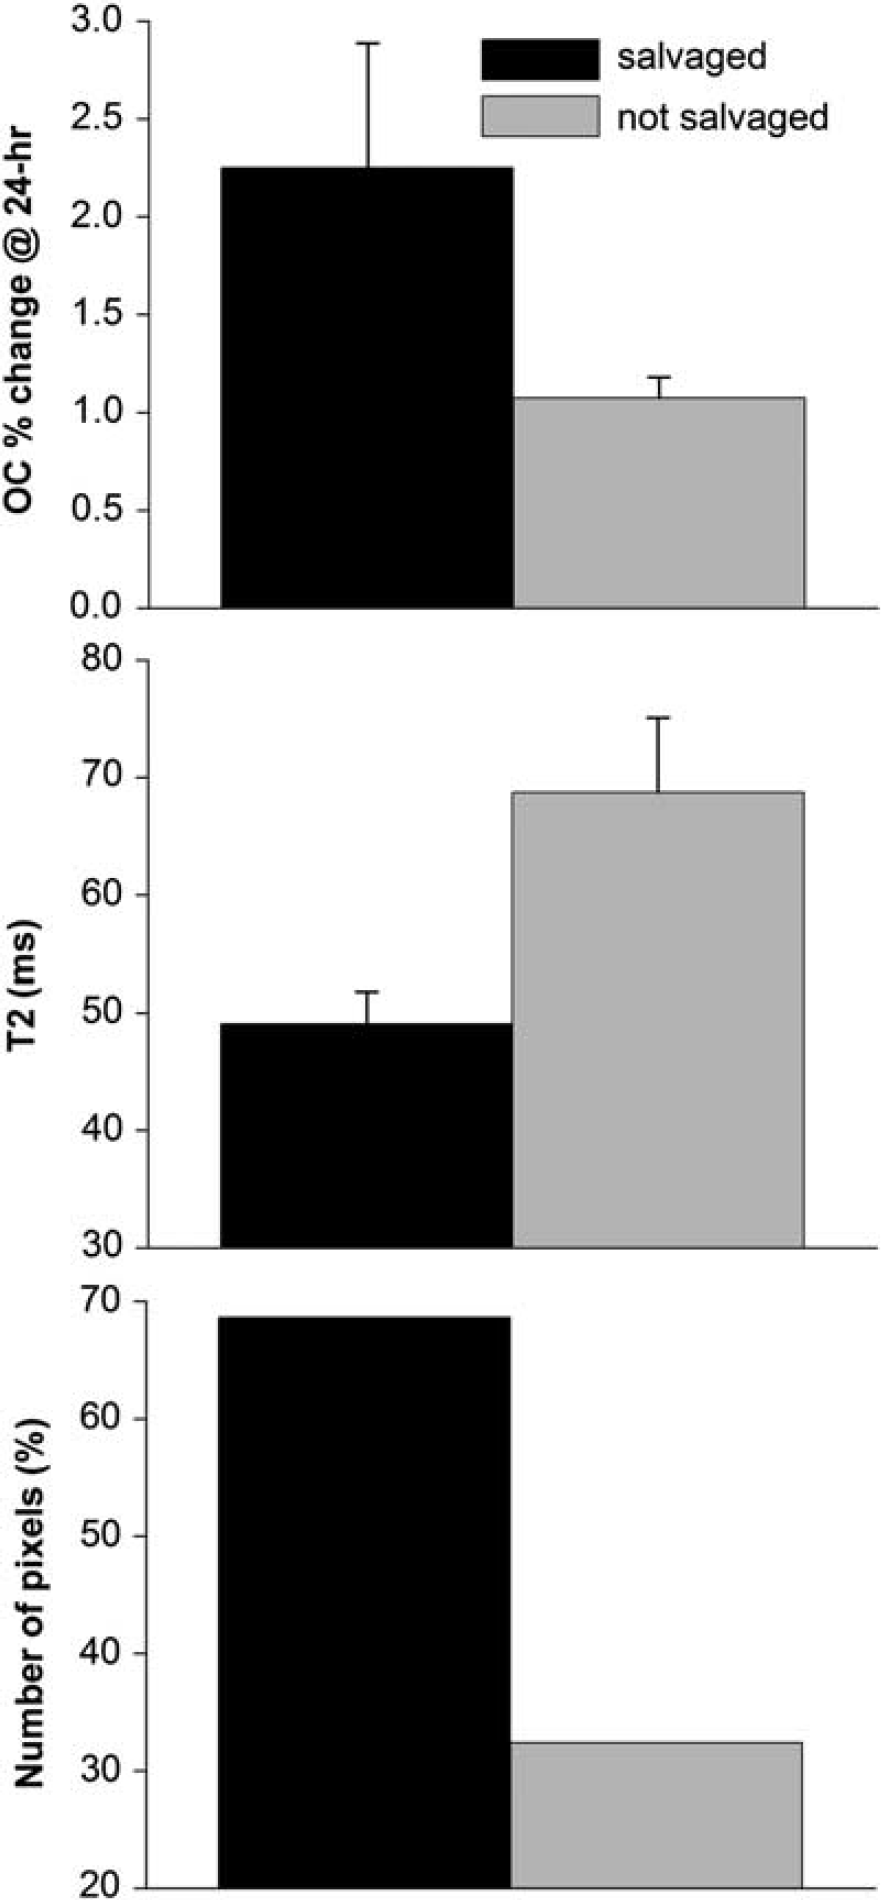
Oxygen-challenge (OC) percent changes, T2 and % of the mismatch pixels (defined at 30 minutes post occlusion) that were salvaged and not salvaged by reperfusion. Note that the average normal hemisphere OC percent change is ∼2.8% and normal T2 of rat brain is ∼45 milliseconds at 7T.
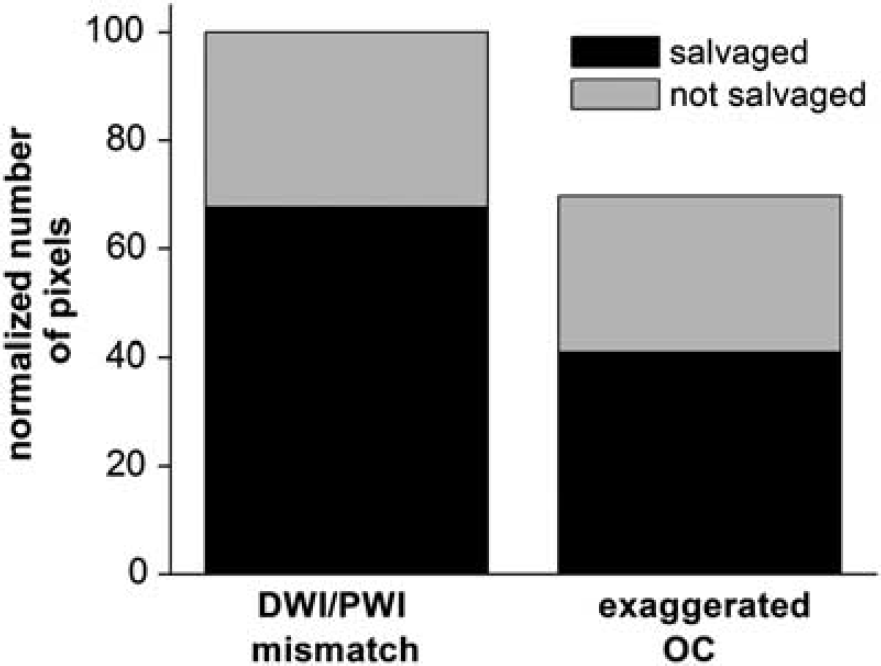
Normalized numbers of pixels of salvaged and non-salvaged tissues from the initially defined perfusion–diffusion mismatch and exaggerated oxygen challenge (OC) tissue. Analysis was performed on group data and thus no error bars are available. DWI, diffusion-weighted imaging; PWI, perfusion-weighted imaging.
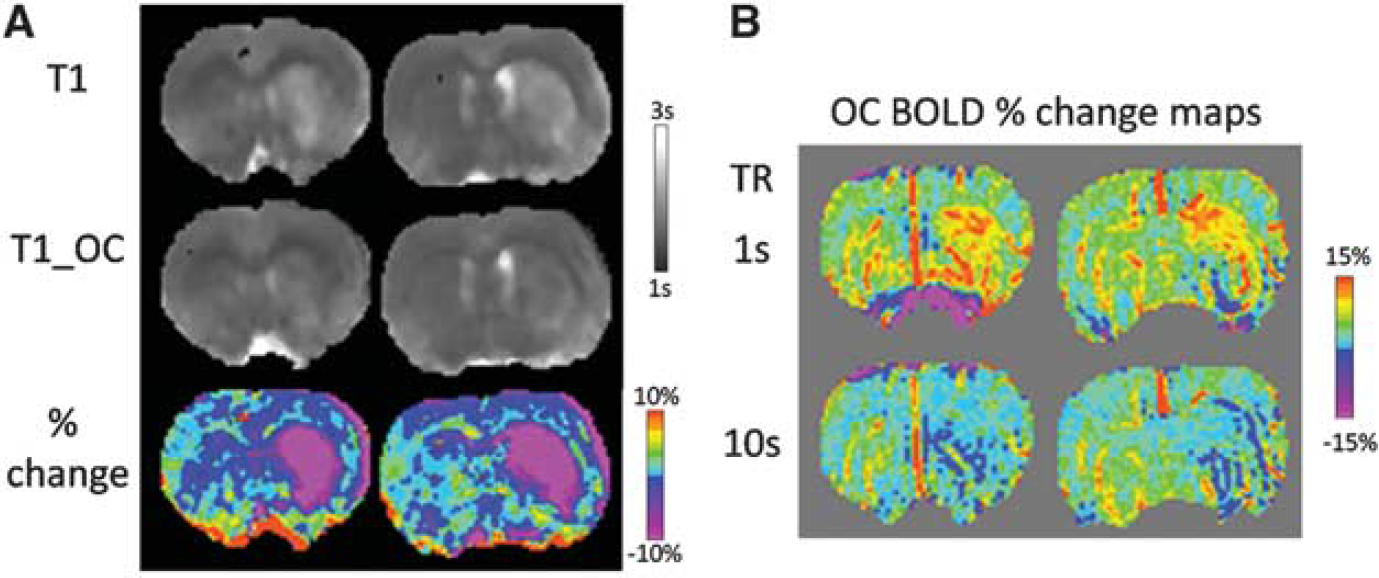
T1 during baseline and OC were measured at 24 hours after stroke to evaluate the potential effects of hyperperfusion on OC percent changes (Figure 6A). T1 during baseline in the ischemic core (corresponding to hyperperfusion region) was higher than normal, indicating cerebral edema. During OC, T1 in the ischemic core was reduced compared with that during air, suggesting increases in dissolved oxygen during OC. By comparison, the normal hemisphere was not substantially affected. At short TR, there were marked increases in OC percent changes in the core compared with normal tissue (Figure 6B). At long TR, such effect was eliminated and the core pixels showed negative OC responses relative to normal tissue.
(
DISCUSSION
This study further characterized the effects of cerebral ischemia and reperfusion on tissue with exaggerated OC responses in rats. The major findings were as follows: (i) during occlusion, the ischemic core cluster showed no significant response, whereas the mismatch cluster showed markedly higher percent changes relative to normal tissue, (ii) after reperfusion, much of the pixels with initial exaggerated OC responses showed normal OC responses, and the majority of these tissues were salvaged, (iii) after reperfusion, the initial core pixels showed exaggerated OC responses but the majority of the core pixels eventually became infarcted, suggesting exaggerated OC responses do not necessarily reflect salvageable tissue, (iv) OC-induced magnitude and percent changes on the perfusion–diffusion contour plots dropped monotonously for pixels below perfusion–diffusion viability thresholds, (v) basal T1 increased slightly in the ischemic core 24 hours after stroke. Oxygen challenge decreased T1 significantly in the core, indicating the substantial increases in dissolved oxygen occurred in the core as a result of hyperperfusion 24 hours after stroke.
Previous studies have shown that, in permanent MCAO in rats, pixels with exaggerated OC responses have substantial overlap with the perfusion–diffusion mismatch,4, 5 suggesting that exaggerated OC responses is potentially salvageable. This study showed that most pixels with the initial exaggerated OC responses returned to normal OC responses after reperfusion at 60 minutes after MCAO and were eventually salvaged. Our results are in general agreement with Robertson
During MCAO (30 minutes), some ADC-defined core pixels showed negative OC responses, suggesting that there was oxygen consumption in the core without CBF increase during OC. Other ‘core’ pixels did not show significant OC responses. This finding is consistent with our previous study of the permanent MCAO model. 5 Upon reperfusion, the initially defined core displayed exaggerated OC responses, indicating successful reperfusion and delivery of excess oxygen to hypoxic tissue. This finding is in contrast to Robertson's, which reported that OC response in the ischemic core after reperfusion remained low (∼0.84%±1.8%). A likely explanation is that their initial core pixels were mostly not reperfused, likely because of the longer (109 minutes) MCAO. Indeed, their CBF in the core after reperfusion was 31±74 mL/100 g per minute compared with 120 to 161 mL/100 g per minute in the contralateral hemisphere (∼20% of normal). Irrespective of the causes for differences, our finding suggests that not all exaggerated OC pixels are salvageable because the extent of CBF and oxygen consumption are difficult to be measured precisely.
Tissue fate of pixels with exaggerated OC has been compared with 2-deoxyglucose in a permanent MCAO in anesthetized rats. 9 At 150 minutes after MCAO, diffusion perfusion and OC were measured, immediately followed by 2-deoxyglucose intravenously. Regions of interest were located within the ischemic core, T2∗-defined penumbra, equivalent contralateral structures, and a region of hyperglycolysis. Oxygen challenge response (9.2%) was high in the presumed penumbra but the local cerebral glucose utilization values were equivalent to the contralateral cortex. Oxygen challenge response was negligible in the ischemic core compared with the 3.2% in the contralateral regions. Oxygen challenge response was 1.41% in hyperglycolytic tissue, located outside OC-defined penumbra and within the diffusion abnormality. They concluded that exaggerated OC-response region indicate normal glucose utilization and is potentially viable.
Holms
The OC approach has also been recently applied to human stroke. Dani
Although the exaggerated OC response in the ischemic penumbra is qualitatively indicative of active oxygen consumption and tissue viability, the OC signal is difficult to be interpreted quantitatively because of the complex interplay between oxygen-induced changes in blood oxygenation, CBF, and cerebral blood volume,21, 22 especially under diseased conditions. Specifically, the signal origins of the OC responses in core, mismatch, and normal tissues are influenced by differences in baseline cerebral blood volume, CBF, cerebral metabolic rate of oxygen, and arterial–venous oxygen saturation, 21 which are also modulated by OC to varying degrees. During ischemia, CBF is reduced and during reperfusion, CBF is heterogeneous with some regions returning close to normal and others remaining significantly reduced. Cerebral blood flow in the ischemic core tissue is close to zero, yielding negligible OC response in the ischemic core. Cerebral blood flow in the penumbra is below normal (but not zero) and regionally heterogeneous and thus the OC response could vary substantially because oxygen consumption, CBF, and cerebral blood volume (among others) differ to different extents. Early increase of cerebral blood volume in response to normobaric oxygen exposures in DWI–PWI mismatch region has been reported, although this was not sustained. 23 Our previous study 5 also showed positive CBF changes to OC in the DWI–PWI mismatch region, in contrast to negative CBF changes in normal tissue due to oxygen-induced vasoconstriction. Moreover, the cerebral metabolic rate of oxygen of different ischemic tissue types is reduced to varying unknown extents. Although it is not possible to determine the quantitative extent of vascular and metabolic contribution, especially under various ischemic conditions, the exaggerated OC could potentially be a good biomarker, as it reflects higher than normal baseline deoxyhemoglobin concentration and nonzero CBF in the ischemic penumbra region.
The Effects of Edema, Hyperperfusion, and Dissolved Oxygen on T1 and OC Responses
There were three possible effects on tissue T1, namely: (1) cerebral edema, (2) dissolved molecular oxygen during OC, and (3) dissolved molecular oxygen due to hyperperfusion. Such effects could differ among different tissue types 24 and have implications in the observed OC signal changes. In the acute phase (up to 3 hours) during which vasogenic edema was minimal, ischemia-induced T1 change was small. In the chronic stroke phase during which vasogenic edema was significant, 25 T1 in the infarct tissue increased as expected (Figure 6A, top panel).
At 24 hours after stroke, hyperperfusion in the ischemic core was observed in the current study, consistent with a previous study in which hyperperfusion was observed in 30-minute, 60-minute, and 90-minute MCAO but not in permanent MCAO that were reported previously. 26 During OC, T1 in the ischemic core was reduced compared with that during air (Figure 6A, bottom panel), suggesting hyperperfusion increased dissolved paramagnetic molecular oxygen. Such effects overrode the effects of edema-induced T1 increase. By comparison, T1 during OC in the normal hemisphere was only reduced slightly, indicating the substantial increases in dissolved oxygen occurred in the core was the result of hyperperfusion. The effects of hyperperfusion during OC shortened tissue T1 more than normal tissue without hyperperfusion, resulting in an increased OC response if short TR was used (Figure 6B, top panel) but not long TR (Figure 6B, bottom panel). Our data showed that the average T1 of core tissue at 24 hours was ∼2.1 seconds and decreased 13% during OC, which translated to an 8% T2∗-weighted signal intensity increase for TR=1 seconds and a 0.4% increase when TR=10 seconds. Thus, our study employed long TR to avoid the T1 effects.
Limitations
There are several limitations of OC approach. Pixels with high vascular density will have exaggerated OC responses, thereby confounding interpretation of potentially salvageable tissue, although some vascular patterns can be readily identified. Another confound is that after reperfusion, exaggerated OC responses were observed. Oxygen exposure during ischemic injury has been shown to have beneficial27, 28 or harmful29, 30 effects. The duration of our transient (2 minutes) OC herein could alter ischemic tissue fate. A short OC duration or lower oxygen content (such as 50% to 70% O2) 31 can be used to avoid potential unwanted effects on tissue fate.
CONCLUSIONS
This study further characterized the consequence of cerebral ischemia and reperfusion on tissue's OC responses in ischemic stroke. The key finding is that perfusion–diffusion mismatch showed exaggerated oxygen-challenge responses. Most tissues with exaggerated oxygen-challenge responses were salvageable by reperfusion. However, exaggerated oxygen-challenge responses might not be informative after reperfusion in their ability to predict final infarct. We concluded that exaggerated T2∗-weighted MRI responses to OC offer useful insight into ischemic tissue fates. However, exaggerated OC pixels are not all salvageable, and they exhibited complex dynamics depending on reperfusion status, hyperperfusion, and edema effects. Future studies will evaluate the effects of novel treatments, quantitatively define the OC-response viability threshold, and employ predictive model to determine if exaggerated OC responses improves prediction accuracy.
Footnotes
The authors declare no conflict of interest.