
Abstract
Angiography-based balloon test occlusion (BTO) has been empirically used to predict tolerance to permanent carotid artery occlusion. We tested the hypothesis that the laterality of the hemispheric circulation time (HCT) of the contrast medium at cerebral angiography would reflect bilateral asymmetry of the cerebral blood flow (CBF) during BTO. Thirty-one consecutive patients who underwent BTO of the internal carotid artery were retrospectively analyzed. HCT was defined as the interval between the time-to-peak in the middle cerebral artery and the cortical veins calculated using time-density curve. The difference in HCT between the occluded and nonoccluded side was calculated at the carotid or dominant vertebral angiograms obtained during BTO. We estimated the correlation between the difference in HCT and bilateral asymmetry of the CBF, which was quantitatively determined by single-photon emission computed tomography. The HCT was 5.3±1.5 seconds and regional CBF was 41.3±11.3 mL/100 g per minute in the occluded side, compared with 3.6±0.9 seconds and 48.4±14.9 mL/100 g per minute in the nonoccluded side, respectively. The difference in HCT was strongly correlated with the asymmetry ratio of the CBF (r2=0.89, P<0.0001). Angiographically based measurement of the cerebral circulation time can provide valuable information concerning cerebral hemodynamics.
Keywords
INTRODUCTION
Occlusion of the internal carotid artery (ICA) for treating symptomatic large or giant paraclinoid or intracavernous carotid aneurysms or complex cranial base tumors can cause ischemic complications, even in patients who successfully tolerate the balloon test occlusion (BTO) of the ICA. 1 The incidence of immediate and delayed ischemic stroke due to hypoperfusion, excluding that for embolic complications, ranges from 2% to 20%.2, 3, 4, 5 Various neuroimaging protocols such as 133Xe-enhanced computed tomography, 6 positron emission tomography,799mTc-hexamethylpropyleneamine oxime single-photon emission computed tomography (SPECT), 8 regional cerebral oxygen saturation monitoring, 9 and transcranial Doppler ultrasonography 10 have been reported; these protocols use modified BTO to increase the sensitivity of clinical test occlusion for predicting patients at risk for hypoperfusion-related ischemic events. However, many of these additional tests are expensive, complicated, or cumbersome to perform, and no combination of BTO and ancillary tests has significantly reduced the incidence of ischemic events compared with BTO and clinical evaluation.11, 12
Several investigators have reported a simple angiographic BTO technique known as venous phase BTO.13, 14, 15, 16 The angiography-based BTO empirically stratifies the risk of permanent ICA occlusion based on the angiographically measured time-lag between hemispheres in the opacification of cortical veins during BTO. 17 Although angiographic BTO requires additional catheter placement in the contralateral ICA or the dominant vertebral artery, this test appears to address cerebral perfusion without a requisitely protracted examination. However, although cortical vein opacification may be related to contrast medium circulation time, the physiologic meaning of the difference in circulation time between the occluded and nonoccluded hemisphere during BTO remains unknown.
Here, we aimed to establish the theoretical background of angiography-based BTO. For this purpose, the hemispheric circulation time (HCT) was evaluated by calculating the interval between the time-to-peak in the proximal middle cerebral artery and the cortical veins in each cerebral hemisphere using time-density curve derived from cerebral angiograms. We investigated the relationship between the difference in HCT and side-to-side asymmetry of the regional cerebral blood flow (CBF) as quantitatively determined with SPECT during BTO for the ICA. We also examined the types of prominent collateral circulation in relation to the asynchronicity of HCT during BTO.
MATERIALS AND METHODS
Patients
All subjects described in this study participated in a clinical neurosurgical protocol established at the Kohnan Hospital, which is affiliated with the Tohoku University Graduate School of Medicine in Sendai, Japan. The Kohnan Hospital institutional review board approved this retrospective study. Between April 2008 and March 2012, 31 consecutive patients (3 men and 28 women; mean age, 63.2 years; range, 36 to 86 years) underwent BTO of the ICA. The patients' clinical diagnoses comprise large or giant intracavernous carotid aneurysms (n=21), large paraclinoid aneurysms (n=9), or arterial dissection at the petrous portion of the ICA (n=1). One patient with right temporal lobe infarction was excluded. No other patient had abnormal findings of brain parenchyma on magnetic resonance imaging or stenoocclusive disease on cerebral angiography. All patients provided consent for participation in both BTO and SPECT imaging. Informed consent was obtained in written form as well as orally, emphasizing in particular the potential health risks associated with endovascular procedures and radiation exposure with imaging. The signed consent form contained a description of the patient's rights in agreement with the Helsinki Declaration.
Balloon Test Occlusion Procedure
The BTO procedure was performed under local anesthesia and systemic heparinization as described previously. 18 A 6F large-lumen guiding catheter, the Launcher (Medtronic, Minneapolis, MN, USA) was positioned in the cervical portion of the ICA. A 2.8 F double-lumen silicone balloon catheter, the MASAMUNE (Fuji Systems, Tokyo, Japan) was advanced into the ascending petrous portion of the ICA. The balloon was inflated under fluoroscopic visualization until the contrast injection from the guide catheter demonstrated complete flow arrest. Temporary occlusion was continued for 15 minutes, and two angiogram series (the contralateral ICA and the dominant vertebral artery) were performed with a second 5 F catheter to evaluate collateral circulation. Neurologic examination and measurement of arterial blood pressure were performed every 5 minutes. Stump pressure, which reflects postocclusion back pressure of the ICA, was measured at the distal tip of the inflated balloon through the other lumen of the MASAMUNE catheter. Patient without clinical symptoms during temporary occlusion were transferred to the radioisotope suite with the balloon deflated but still in position.
All angiographic procedures employed the Innova system (GE Healthcare, Buc, France) with the following parameters: matrix size, 750 × 750; field of view, 20 × 20 cm, 2.5 frames per second. A total of 8 mL of iodinate contrast was injected at 6 mL/second. This is the same protocol used for conventional angiography at our institution.
Cerebral Blood Flow Measurements
In the radioisotope suite, the balloon was reinflated to its previous volume, and complete occlusion was confirmed by ensuring that the stump pressure was the same as previously. SPECT with 133Xe inhalation was performed before December 2010 and N-isopropyl [123I]-p-iodoamphetamine (123I-IMP) was performed after January 2011 by using a three-head gamma camera system (PRISM-IRIX; Shimadzu, Kyoto, Japan). With the 133Xe inhalation method, patients (patient 1 to 10) inhaled 740 MBq of 133Xe gas 1 minute after balloon inflation, and CBF was quantitatively measured by dynamic SPECT (16 scans of a duration of 20 seconds each) according to the method of Kanno and Lassen. 19 Eight minutes later, the balloon was deflated and removed. Data acquisition was started immediately after inflation and continued for 8 minutes. In the remaining patients (patient 11 to 30), SPECT studies were performed using the 123I-IMP-ARG method. 20 One minute after balloon inflation, 222 MBq of 123I-IMP was intravenously injected, arterial blood sampling (2 mL) was performed 10 minutes later, and the balloon was deflated and removed. Data acquisition began 1 minute after 123I-IMP injection and continued for 28 minutes. 123I-IMP is a radioactive tracer with high lipid solubility and a high first-pass extraction ratio in the brain, which is estimated as ∼90%. The initial uptake of 123I-IMP is believed to relate largely to its high affinity for the nonspecific amine-binding sites in the brain, which reflects the slow washout of the agent during a period of more than 1 hour. Therefore, the image obtained 28 minutes postinjection is indicative of CBF distribution at the time of tracer injection, even if changes in the CBF occur after the injection. At least a 5-min occlusion may be necessary to obtain the flow during the occlusion, because the majority of IMP extraction occurs during the initial 5 minutes. 21
A quantitative CBF map, a 128 × 128 image matrix with a slice thickness of 9 mm, consisted of 15 axial slices covering the whole brain. A total of 22 regions of interest (ROIs) (area, 600 mm2) were bilaterally and symmetrically placed on each side of the middle cerebral artery territory in four slices (Figure 1). Each ROI provided a value of CBF measured as mL/100 g per minute. The average of mean CBF values for all ROIs in each hemisphere is defined as CBF in the middle cerebral artery territory. Finally, the degree of side-to-side CBF asymmetry (asymmetry ratio, AR) was obtained using the following equation: AR=CBFoccl/CBFnon-occl
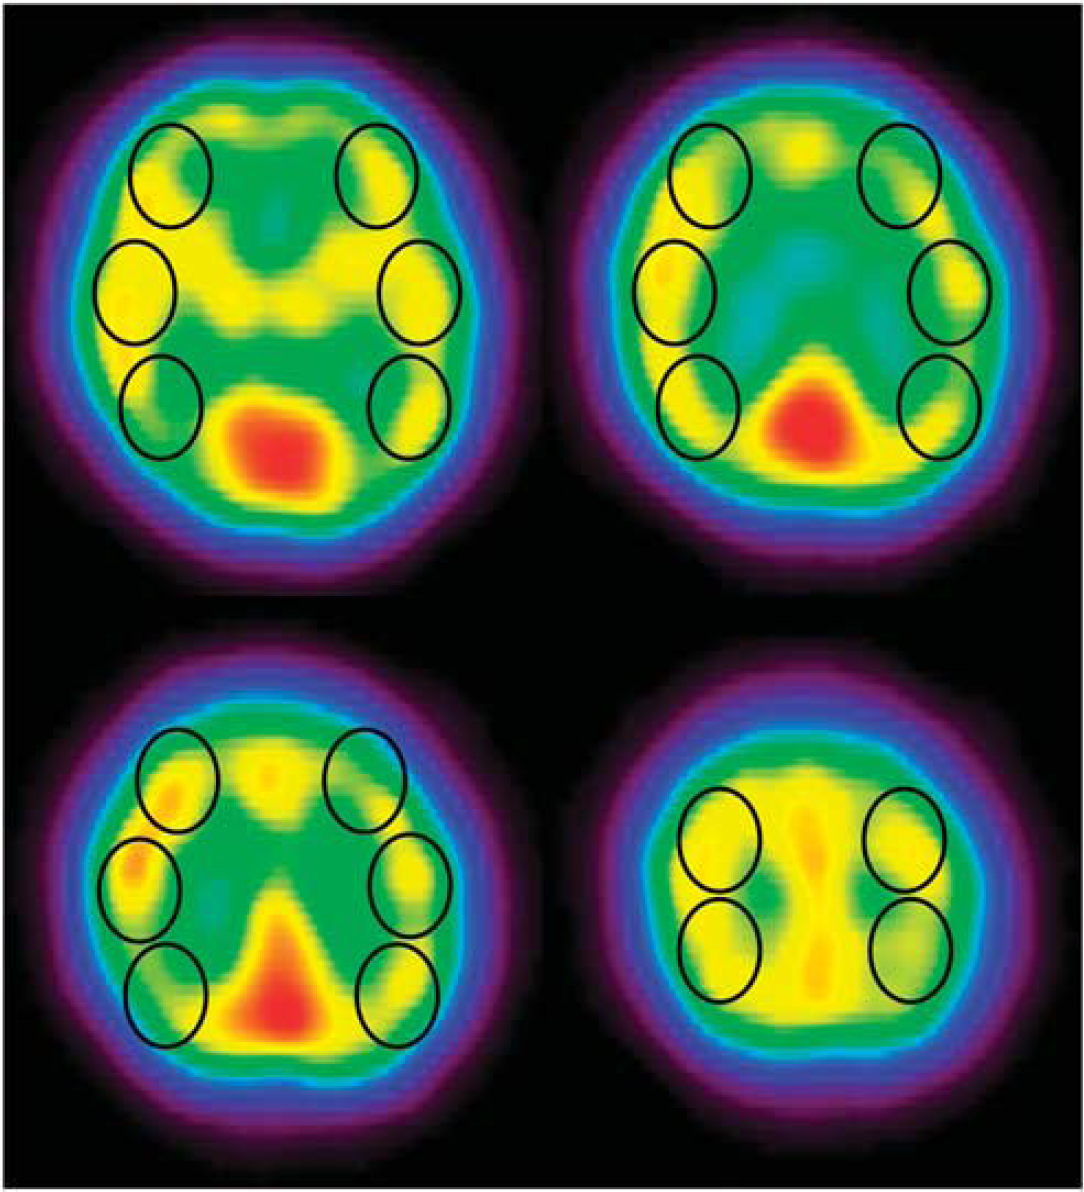
N-isopropyl [123I]-p-iodoamphetamine single-photon emission computed tomography (123I-IMP SPECT) images of patient 21. Four transaxial slices with regions of interest (ROIs). Twenty-two ROIs (black circles) were symmetrically placed on the cortex of the middle cerebral artery territory.
Normal CBF values were previously measured in our institute. Cerebral blood flow in the middle cerebral artery territory was 54.2±10.7 mL/100 g per minute (mean±s.d.) as determined in 12 normal individuals (7 men and 5 women) aged 40 to 70 years 18 using 133Xe SPECT according to the method of Kanno and Lassen. 19 It was 36.6±3.0 mL/100 g per minute as determined using the 123I-IMP-ARG method 20 in 10 normal individuals (5 men and 5 women) aged 56 to 65 years (unpublished data).
Hemispheric Circulation Time Measurements
To investigate the impact of BTO on HCT, ROI analysis of vessel optical density on angiograms was performed. Conventional angiographic image sequence data obtained during BTO were processed with ImageJ (NIH, Bethesda, MD, USA) to measure optical density as the contrast medium passed through the vessels at a rate of 2.5 frames per second. Regions of interest of 5.0 mm2 were drawn on the most proximal zone of the middle cerebral artery and on each of 6–7 prominent cortical veins draining from the middle cerebral artery territory (Figures 2 and 3). This setting of ROIs on the arterial side enables observers to compare the HCT in the same condition among patients with dominant collateral flows through the anterior or the posterior communicating artery. On the venous side, the mean timing of cortical venous opacification could be estimated separately in each hemisphere. We specially attempted to locate ROIs that are bilaterally symmetric without superimposition of adjacent vessels. In patients in whom the anterior communicating artery was dominant, the anteroposterior view obtained by contralateral ICA injection during BTO was used for analysis (Figure 2). In patients in whom the posterior communicating artery was dominant, the anteroposterior view obtained by dominant vertebral artery injection was compared with that of the contralateral ICA injection during the ipsilateral ICA occlusion (Figure 3). The time-density curve of each ROI was given as the mean of the optical density for all the pixels in the ROI (Figure 4). All ROIs were drawn by two radiologic technicians masked to clinical condition and SPECT image.
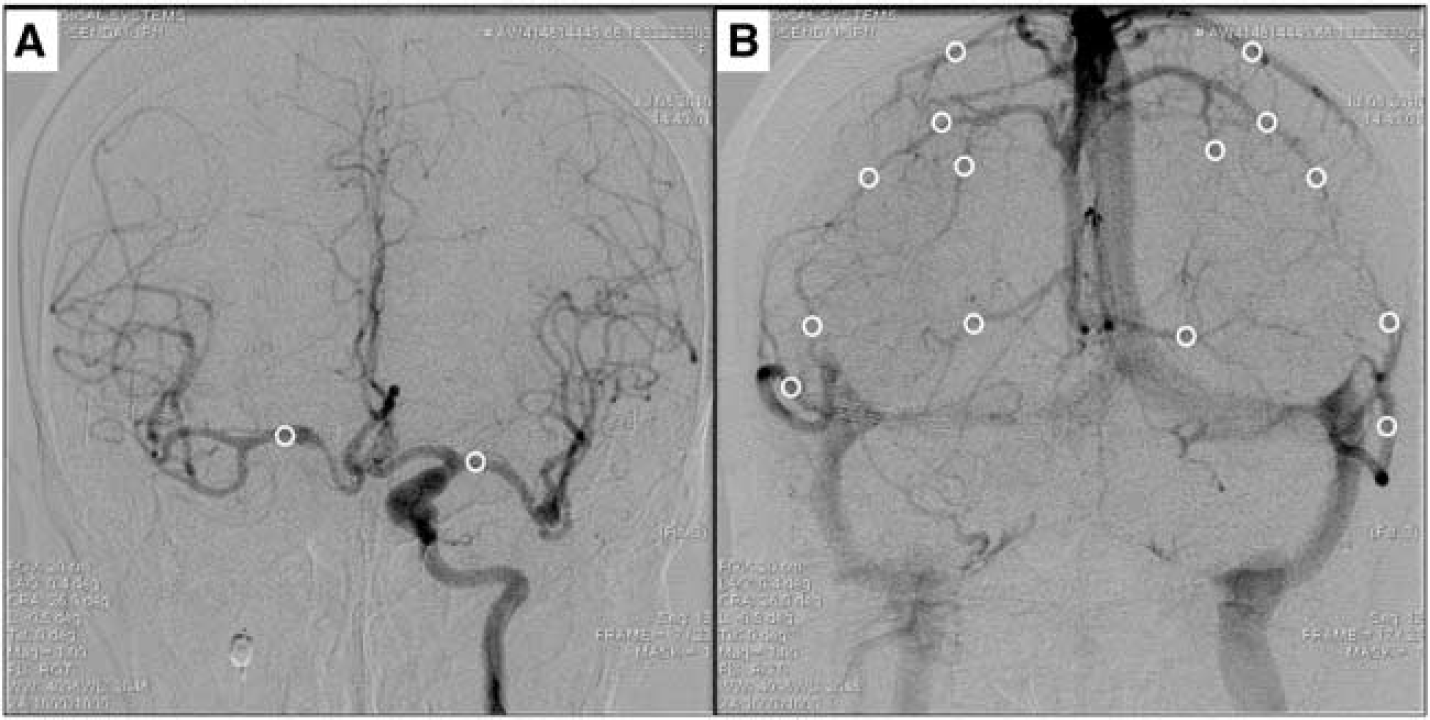
Anteroposterior angiogram views of patient 16. Arterial (
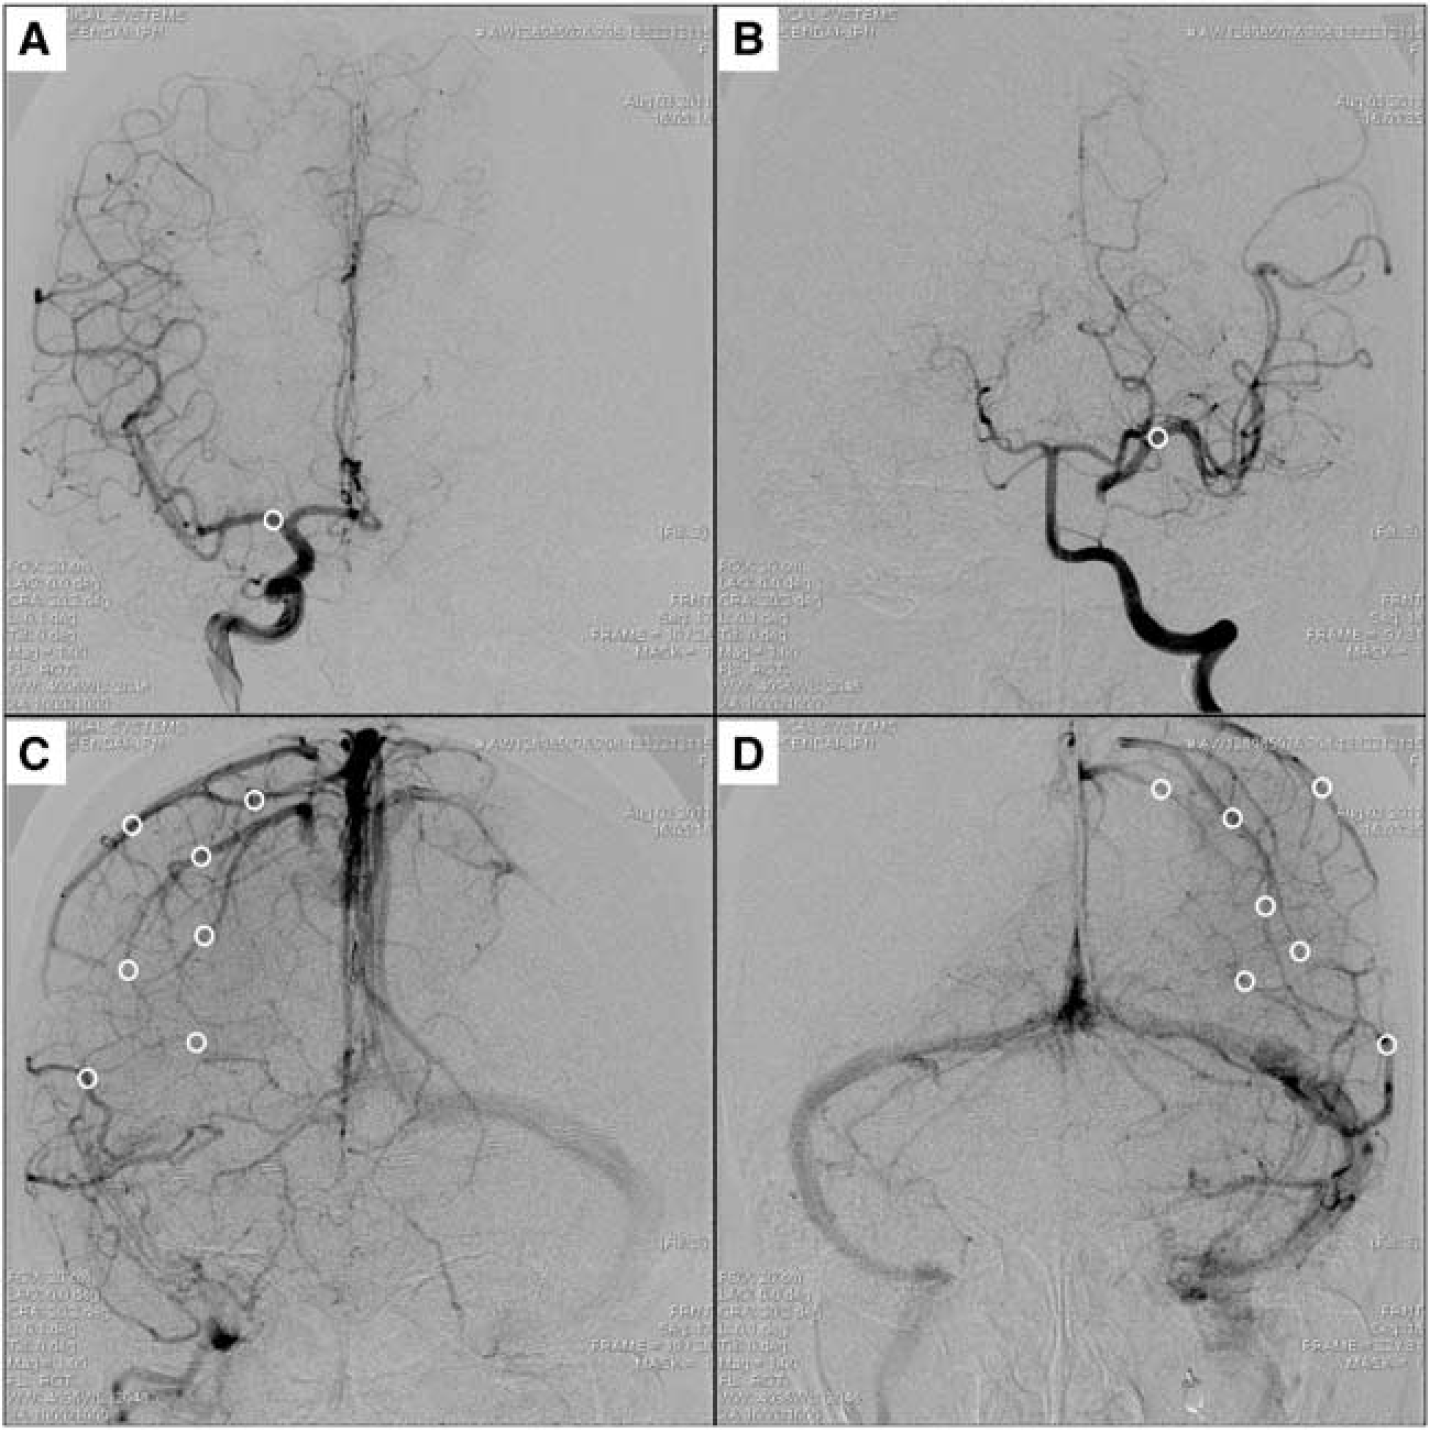
Anteroposterior angiogram views of patient 23. Arterial (
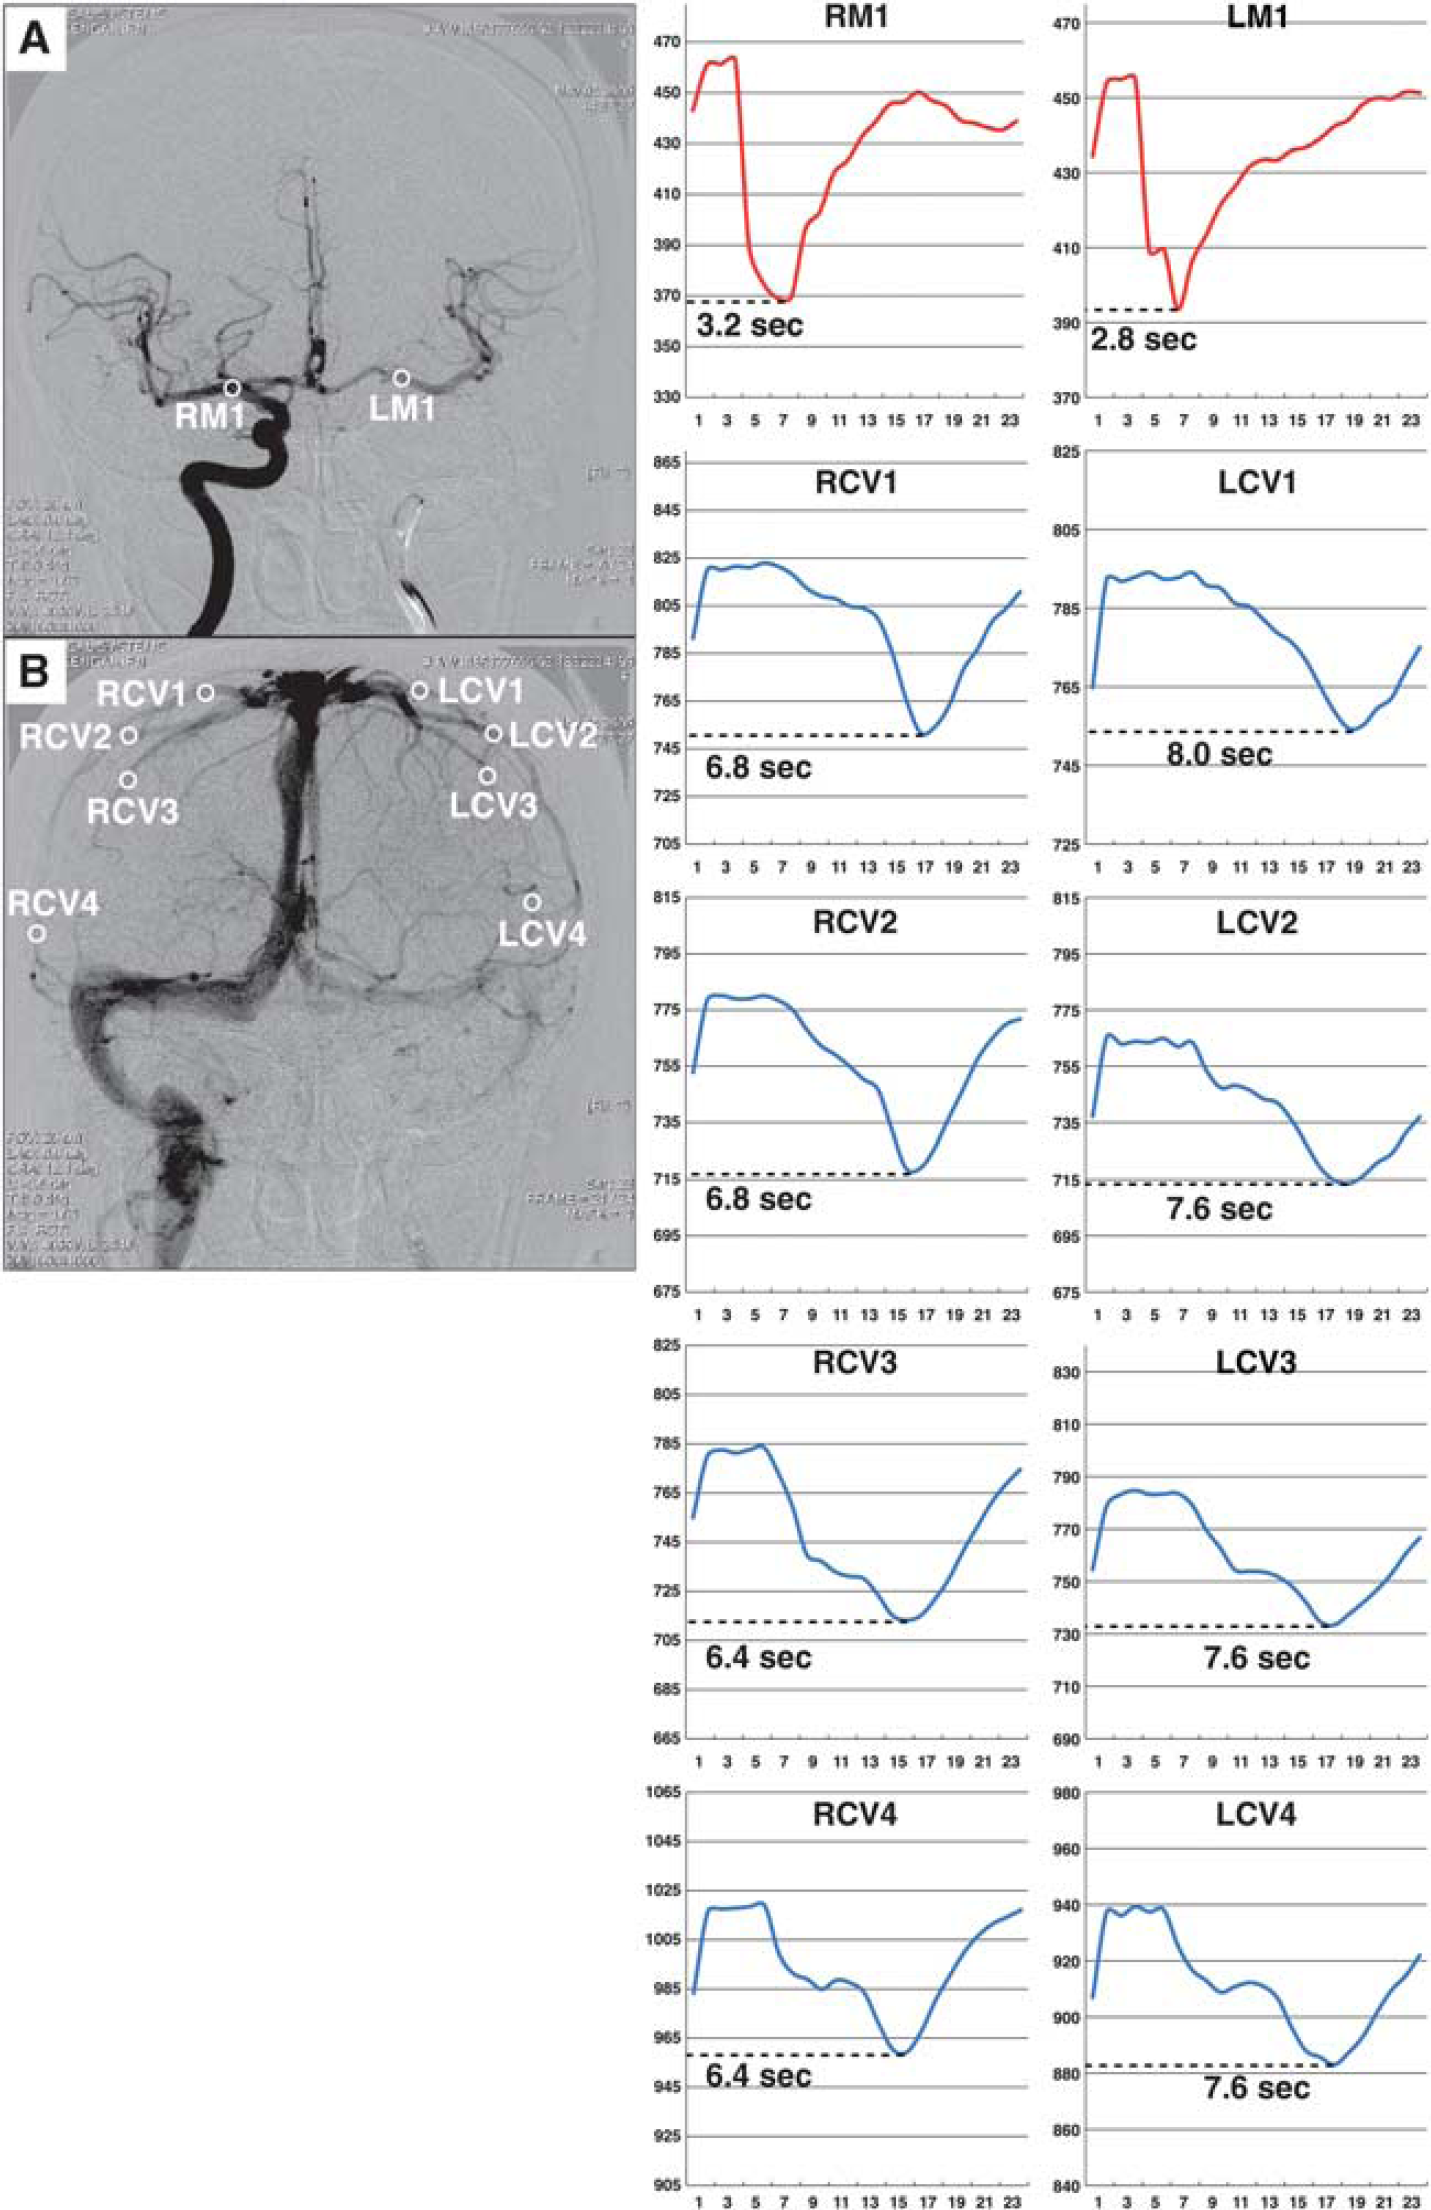
Illustrative case in the measurement of hemispheric circulation time (HCT) (patient 8). (
Hemispheric circulation time was defined as the mean of the interval between the time-to-peak in the proximal middle cerebral artery (TTPA) and the cortical veins (TTPV) in each hemisphere. Finally, the HCT difference (HCTdiff) between the occluded (HCToccl) and nonoccluded (HCTnonoccl) hemispheres of each patient was calculated with the following equations:
HCToccl (seconds)=mean of (TTPV of occl—TTPA of occl) HCTnonoccl (seconds)=mean of (TTPV of nonoccl—TTPA of nonoccl) HCTdiff (seconds)=HCToccl—HCTnon-occl
Analysis of Collateral Flow During Balloon Test Occlusion
We examined biplane views to assess the absence or presence of collateral circulation during BTO of the ICA. Collaterals were angiographically recognized by contrast filling via the anterior and/or posterior communicating artery (primary collateral circulation), or leptomeningeal anastomosis after contralateral ICA or dominant vertebral artery injection. Arterial supply to the middle cerebral artery territory via retrograde filling of the ophthalmic artery fed by branches of the ipsilateral external carotid artery was examined through the contrast injection from the guiding catheter during balloon occlusion. The appearance of collaterals was then graded on a 3-point scale according to the method of Henderson et al: 22 (1) Not reaching the middle cerebral artery territory; (2) partially covered in the middle cerebral artery territory; (3) fully covered in the middle cerebral artery territory. For the present study, grades 2 and 3 were combined to indicate the presence of collateral circulation. Collaterals were considered absent if they were not angiographically visualized (grade 0) or were assigned a grade of 1.
Statistical Analysis
Statistical analyses were performed using JMP software (Version 9; SAS Institute, Cary, NC, USA). Numerical data are expressed as mean±s.d., and comparisons between the occluded and the nonoccluded side were performed with paired t-tests. Correlations between HCTdiff and AR were determined using linear regression analysis. Group comparisons of categorical data were performed with Mann–Whitney U-tests. P<0.05 was considered statistically significant.
RESULTS
Table 1 presents the baseline characteristics and quantitative data of our study population. No procedural complications occurred during BTO. Among the 31 enrolled patients, 27 underwent both HCT and CBF assessment. The SPECT study could not be performed in two patients (patient 9 and 12) who exhibited new neurologic deficits after balloon occlusion. For these patients, angiographic findings and stump pressure values obtained before balloon deflation were used in subsequent studies. Complete resolution of their neurologic deficits was observed after balloon deflation. In patient 20, angiographic data were not available for the HCT measurement because of a motion artifact.
Baseline characteristics and quantitative data of the study population
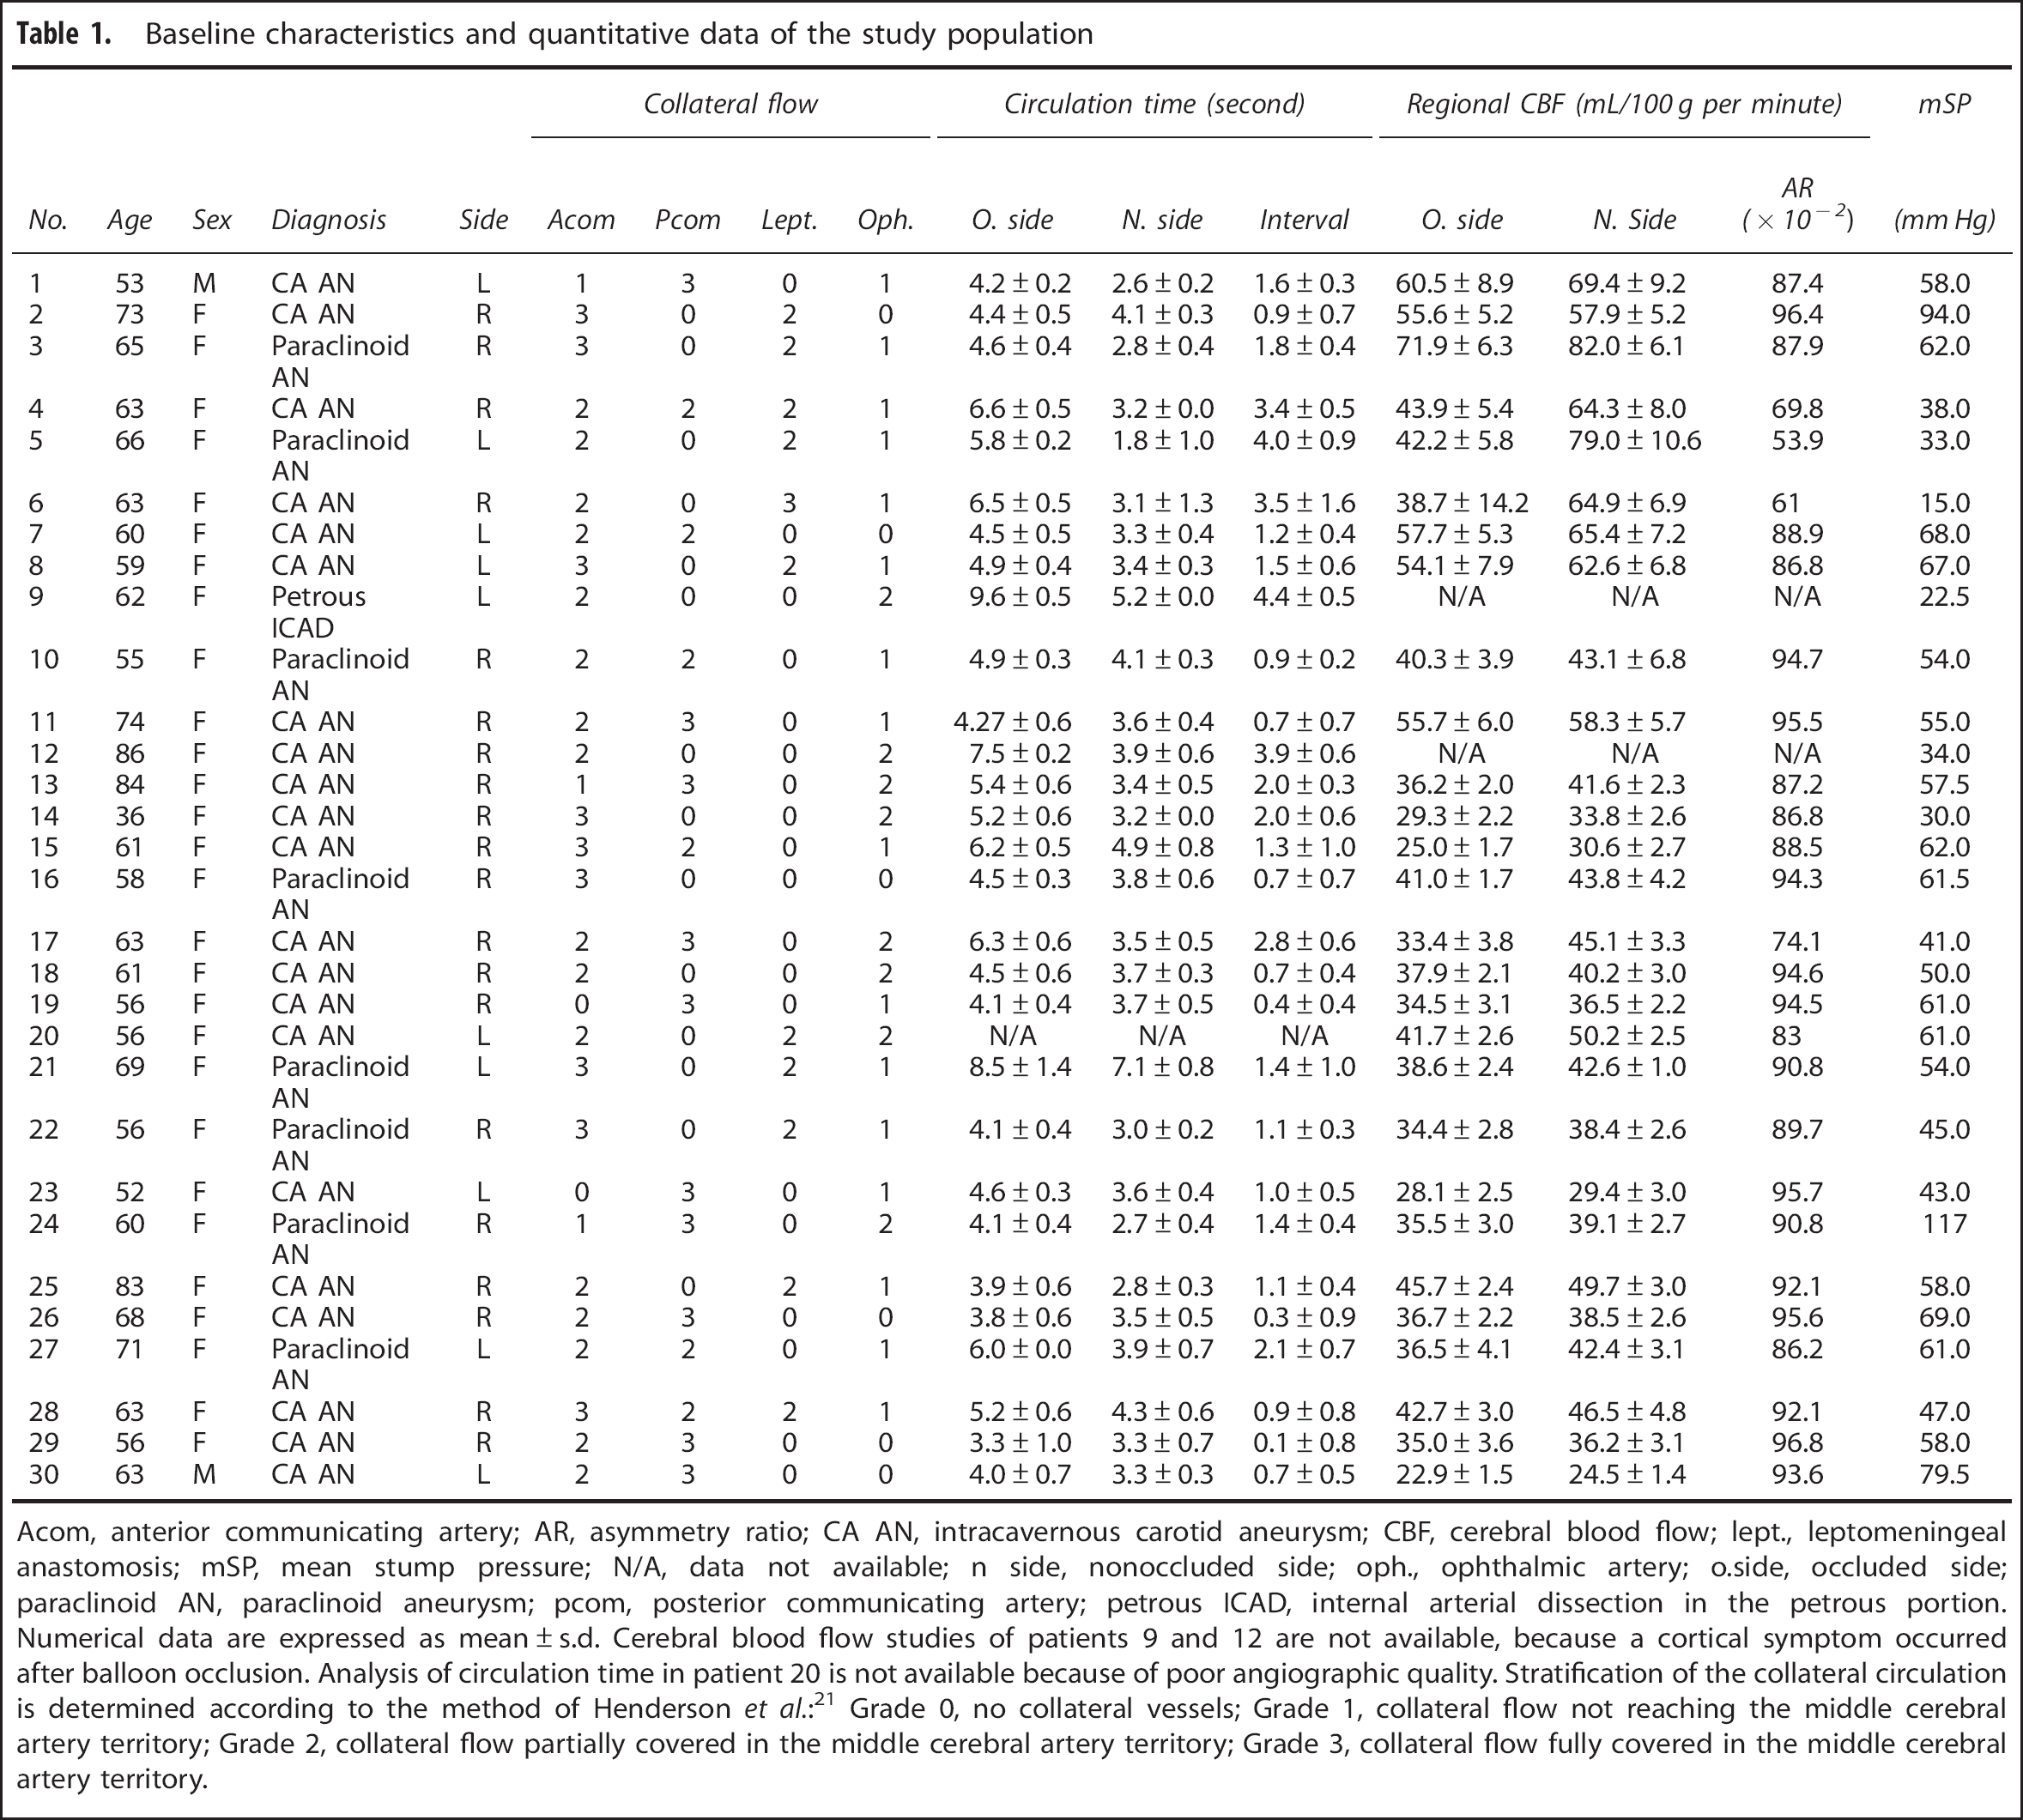
Acom, anterior communicating artery; AR, asymmetry ratio; CA AN, intracavernous carotid aneurysm; CBF, cerebral blood flow; lept., leptomeningeal anastomosis; mSP, mean stump pressure; N/A, data not available; n side, nonoccluded side; oph., ophthalmic artery; o.side, occluded side; paraclinoid AN, paraclinoid aneurysm; pcom, posterior communicating artery; petrous ICAD, internal arterial dissection in the petrous portion.
Numerical data are expressed as mean±s.d. Cerebral blood flow studies of patients 9 and 12 are not available, because a cortical symptom occurred after balloon occlusion. Analysis of circulation time in patient 20 is not available because of poor angiographic quality. Stratification of the collateral circulation is determined according to the method of Henderson et al.: 21 Grade 0, no collateral vessels; Grade 1, collateral flow not reaching the middle cerebral artery territory; Grade 2, collateral flow partially covered in the middle cerebral artery territory; Grade 3, collateral flow fully covered in the middle cerebral artery territory.
The mean HCT in the occluded side was significantly more extended than that in the nonoccluded side (5.2±1.5 versus 3.6±1.0 seconds, P<0.001). The mean CBF in the occluded side was significantly lower than that in the nonoccluded side (41.3±11.3 versus 48.4±14.9 mL/100 g per minute, P<0.001). Asymmetry ratios (ARs) were 0.81±0.15 with 133Xe SPECT, and 0.91±0.06 with 123I-IMP SPECT, and there was no significant difference between radiotracers used (P=0.250).
Comparison Between HCT diff and Asymmetry Ratio
Figure 5 shows the comparison of HCTdiff and AR in each patient. The fit of the values to the linear regression line was significant (r2=0.89, P<0.0001). According to this line, the AR values of patients who could not undergo the SPECT study (patient 9 and 12) could be estimated as 0.59 and 0.64, respectively (y=1.03–0.1x; y, AR; x, HCTdiff).
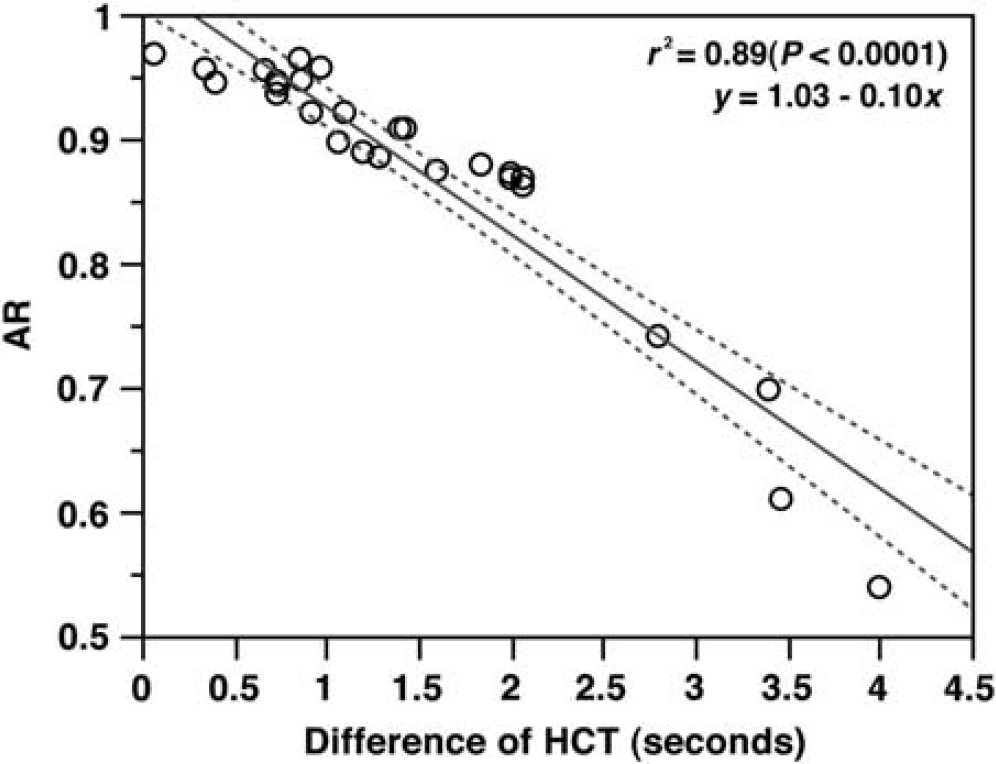
Linear regression analysis results. Regression line (solid line) and two-sided 95% confidence interval (dotted line). The abscissa and ordinate are the difference of hemispheric circulation time (HCT) and asymmetry ratio (AR), respectively (r2=0.89, P<0.0001).
Comparison of Collateral Circulation with HCT diff and Asymmetry Ratio
Table 2 shows the comparison of collateral circulation with HCTdiff and AR. HCTdiff was 1.8±1.3 seconds and AR was 0.87±0.11 in the 25 patients with a dominant anterior communicating artery (grade 2 or 3), and there was no significant difference compared with the 16 patients who had a dominant posterior communicating artery (HCTdiff, 1.3±0.9 seconds; AR, 0.90±0.08; P=0.389, P=0.489, respectively). In the 11 patients with both dominant communicating arteries, the HCToccl obtained by collateral circulation via the anterior communicating artery was not significantly different compared with the HCToccl obtained by collateral circulation via the posterior communicating artery. There was no significant difference in HCTdiff and AR between patients with (grade 2 or 3) and without (grade 0 or 1) opacification of leptomeningeal anastomosis during occlusion of the ipsilateral ICA (HCTdiff, 2.0±1.2 second versus 1.5±1.2 second, P=0.770; AR, 0.82±0.14 versus 0.91±0.06, P=0.240). However, HCTdiff was significantly more extended, and AR was significantly lower in patients with collateral circulation via the ophthalmic artery supplied by branches of the external internal artery during ipsilateral ICA occlusion than in patients without it (HCTdiff, 2.5±1.3 seconds versus 1.4±1.0 seconds, P=0.031; AR, 0.86±0.07 versus 0.88±0.11, P=0.031).
Comparison of collateral circulations with HCTdiff and AR
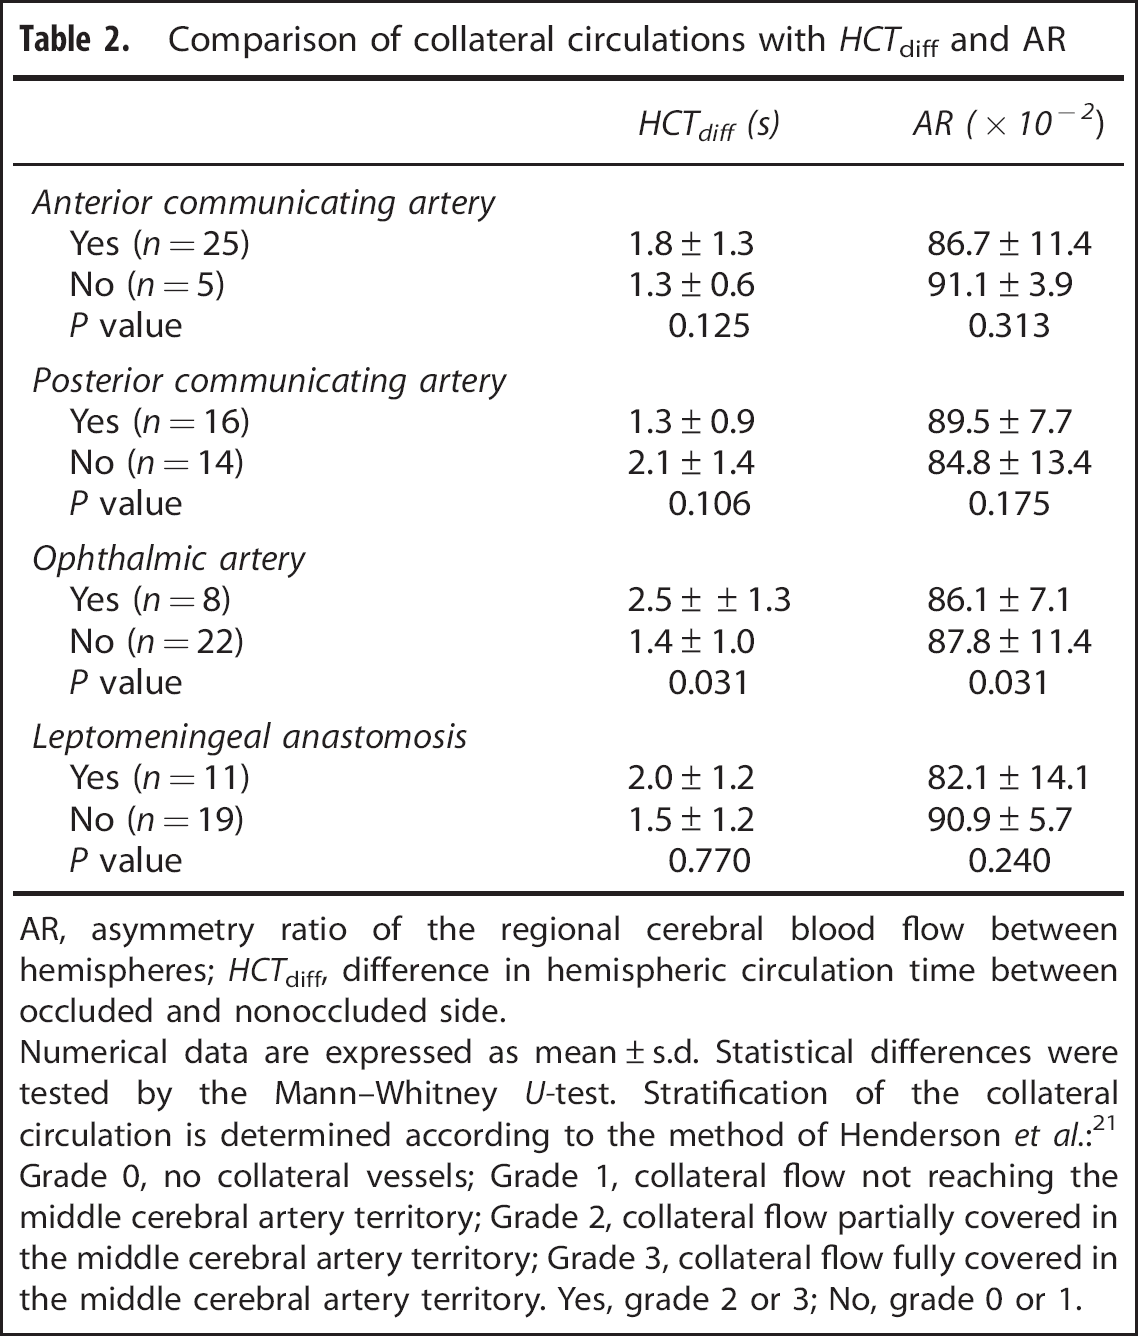
AR, asymmetry ratio of the regional cerebral blood flow between hemispheres; HCTdiff, difference in hemispheric circulation time between occluded and nonoccluded side.
Numerical data are expressed as mean±s.d. Statistical differences were tested by the Mann–Whitney U-test. Stratification of the collateral circulation is determined according to the method of Henderson et al.: 21 Grade 0, no collateral vessels; Grade 1, collateral flow not reaching the middle cerebral artery territory; Grade 2, collateral flow partially covered in the middle cerebral artery territory; Grade 3, collateral flow fully covered in the middle cerebral artery territory. Yes, grade 2 or 3; No, grade 0 or 1.
DISCUSSION
Angiographic-based BTO has been used to evaluate tolerance against carotid occlusion by measuring the time-lag in the opacification of cortical veins between the tested hemisphere and contralateral hemisphere during ipsilateral carotid occlusion by balloon catheter. Although thresholds for predicting hypoperfusion remain controversial among published protocols, this method has been widely used because of its simplicity, and has been proven safe when performed under general anesthesia, a beneficial option that permits intraoperative assessment for either planned therapeutic carotid occlusion or a bail-out strategy during complicated or deteriorating reconstructive aneurysm surgery.13, 14, 15, 16, 17 However, assessing synchronicity with venous filling by sight is subjective and obscure. Especially when collateral filling is via the posterior communicating artery, one has to assess the synchronicity between the venous phase of the tested hemisphere and that of the contralateral posterior circulation area on vertebral angiography. To what extent and which collaterals can modify the timing of the opacification of cortical veins during BTO are unknown. Perhaps surprisingly, the correlation of the HCT of the contrast medium with cerebral perfusion during BTO has not been proven.
In this study, we quantitatively evaluated cerebral circulation time in each hemisphere, namely HCT, by calculating the interval between time-to-peak in the proximal middle cerebral artery and the cortical veins on angiograms during BTO. The HCT difference between the occluded and nonoccluded hemisphere strongly correlated with side-to-side CBF asymmetry in the middle cerebral artery territory. The HCT difference was not associated with a dominant primary collateral pathway, but it was significantly extended in patients with secondary collateral circulation via the ophthalmic artery. These results suggest that the HCT difference between hemispheres could indicate asymmetric change of cerebral perfusion during BTO.
Although there are no strict criteria for perfusion abnormalities in BTO with SPECT, it is generally accepted that areas of diminished perfusion are abnormal when the radioactivity is less than 90% of normal. 23 When judging tolerance against carotid occlusion based on angiographic BTO, one should consider that 90% of contralateral CBF (AR=0.9) corresponds to 1.3 seconds in HCT difference according to this study (y=1.03–0.1x; y, AR; x, HCTdiff).
Greitz first described the method for evaluating cerebral circulation time by using cerebral angiography. 24 The time-lag from the maximum depiction time of the carotid siphon to that of the Rolandic vein was reported to be 3.5±0.5 seconds in 1,500 patients without neurologic deficit. Several previous studies demonstrated that the cerebral circulation time could reflect the state of cerebral perfusion and be one of the relevant parameters for cerebral hemodynamics.24, 25, 26, 27, 28 However, absolute values of cerebral circulation time cannot be used to define critical thresholds for cerebral perfusion because of great interpersonal variability and a host of multifactorial influences, such as the nature of contrast material, condition of injection, and the location of ROIs. 26 Cerebral circulation time is generally thought to be prolonged in the following scenarios: dilatation of the cerebral vascular bed, decrease of cerebral vascular resistance, and the decline in cerebral perfusion pressure.29, 30 Cerebral autoregulation is characterized by the physiologic mechanism that maintain CBF at an appropriate level during changes in blood pressure. This regulation is achieved primarily by small arteries and arterioles, which either dilate or contract under multiple complex physiologic control system, and can affect the cerebral circulation time.31, 32 Namely, cerebral circulation time may be prolonged despite a stable CBF level when cerebral autoregulation operates against a low perfusion pressure. This may be the main reason for the AR plateau that can be observed for HCT difference up to 1 s on Figure 5. With an HCT difference of >1 second, AR may start to decline because the autoregulation phenomenon may have reached a maximum level.
Approximately 55% of the cerebrovascular bed is thought to be composed of capillary vessels and veins, and 60% of cerebrovascular resistance is controlled by leptomeningeal arteries. 33 These data suggest that prolonged HCT due to reduced cerebral perfusion pressure mainly depends on a delay of the venous phase. Therefore, our results support the validity of angiographic BTO for measuring time-lag in the opacification of cortical veins.
Collateral circulation is the main mechanism of clinical tolerance of carotid occlusion. Primary collaterals include the arterial segments of the Circle of Willis, whereas the ophthalmic artery and leptomeningeal vessels constitute secondary collaterals. Secondary collateral pathways are presumed to be recruited once primary collaterals at the Circle of Willis have failed. 34 Although longitudinal studies have not chronicled this sequence of collateral failure, the presence of secondary collateral pathways is considered a marker of impaired cerebral hemodynamics. 35 This could be the main reason an extended HCT difference and the lower CBF AR were seen in patients with collateral flow via the ophthalmic artery, and likely but not statistically, in patients with leptomeningeal anastomosis.
The limitations of this study include the small number of patients and retrospective approach. We did not compare CBF and HCT between the before and after occlusion in the affected hemisphere. Cerebral hemodynamics may have already impaired at baseline, although no patient included in these analyses had abnormal cerebral parenchyma or stenoocclusive diseases on image studies. Measurement of HCT may involve large interobserver and interprocedural variability. More advanced approaches such as a stereotactic coordinates would be better suited for clinical applications. Because we were unable to simultaneously measure CBF and perform cerebral angiography, the variability may be due to measurements taken during different balloon inflations.
In conclusion, the present study can support the validity of angiography-based BTO and our findings are consistent with the notion that the difference of cerebral circulation time between hemispheres reflects asymmetric CBF distribution in the situation of abrupt carotid occlusion. These data can yield a meticulous assessment of the tolerance for carotid occlusion in an emergent or intraoperative condition, which is unsuitable for the use of quantitative CBF measurement modalities. A prospective randomized controlled study is warranted for testing the ability of HCT measurement during BTO to predict complications from permanent ICA occlusion.
Footnotes
The authors declare no conflict of interest.