
Abstract
Recent studies have challenged the prevailing view that reduced mitochondrial function and increased oxidative stress are correlated with reduced longevity. Mice carrying a homozygous knockout (KO) of the
INTRODUCTION
For the past four decades, reduced mitochondrial function has been regarded as one of the major factors promoting aging and age-related neurodegenerative disorders. 1 Mitochondrial dysfunction causes decreased energy (ATP) production, reduced oxygen consumption rate, and increased reactive oxygen species (ROS) generation. Reactive oxygen species are thought to cause oxidative stress, damage cellular structure, and ultimately lead to widespread cellular dysfunction and death. Preserved mitochondrial integrity, therefore, is generally presumed to be necessary for increased longevity as well as preserved brain functionality during aging.
Surprisingly, recent studies have suggested that decreased mitochondrial respiration and increased ROS generation are associated with extended lifespan in various organisms.2–5
The extension of lifespan in
In mammals, a correlation between reduced mitochondrial function and extended longevity was recently observed in mice in which the
MATERIALS AND METHODS
Animals
Male Surf1 KO mice 9 were generated from heterozygous crosses of Surfl+/− breeders in the C57/Bl6JxDBA2 background. Wild-type (WT) animals were littermates generated from the same crosses and served as controls. Mice were used at 6 to 7 months of age. All experiments were performed with approval by the IACUC (Institutional Animal Care and Use Committee) at the University of Texas Health Science Center at San Antonio.
Measures of Mitochondrial Function
Brain mitochondrial isolation
Whole brain mitochondria were isolated using differential centrifugation and Percoll gradients (
State 3 respiration
Mitochondrial oxygen consumption was measured using a Clark electrode (Oxytherm Oxygen Electrode Control Unit; Hansatech Instruments Ltd., Norfolk, UK) as described. 11 Briefly, mitochondria suspended in ROS buffer with 0.3% bovine serum albumin were used and glutamate (5 mmol/L)/malate (5 mmol/L) was the respiratory substrate. 12 State 3 respiration was induced with ADP (0.3 mmol/L).
ATP production
ATP production was measured in freshly isolated brain mitochondria using ATP Bioluminescence Assay Kit CLSII (Roche, Basel, Switzerland) and a fluorescent microplate reader. The substrates used were glutamate (2.5 mmol/L) and malate (2.5 mmol/L). 13
Complex IV activity
Complex IV activity was measured by monitoring the oxidation of cytochrome C 2 + at 550 nm using a spectrophotometer.
13
Mitochondria were prepared by suspending isolated brain mitochondria in ACA/BT buffer (750 mmol/L 6-aminocaprioic acid, 50 mmol/L Bis-Tris, pH 7.0) plus 1% n-dodecylmaltoside and 1 × protease inhibitors (Cocktail set III) for 45 minutes with constant agitation at 4°C. The suspension was then ultracentrifuged at 100,000 ×
Mitochondrial hydrogen peroxide production
Because hydrogen peroxide (H2O2) is a major contributor to oxidative damage, we used H2O2 as a measure of ROS production. The method we used was similar to that reported by Lustgarten
Blood lactate levels
Blood lactate levels were measured in blood collected from the tail using a Lactate Plus lactate meter (Nova Biomedical, Waltham, MA, USA) as per the manufacturer's instructions.
In Vivo Neuroimaging
Animal preparation for functional neuroimaging
Six mice per experimental group were used in imaging studies. Animals that were used for functional imaging did not undergo behavioral testing, and their brain tissues were not used for biochemical determinations. Mice were anesthetized with 4.0% isoflurane for induction, and then maintained in a 1.2% isoflurane and air mixture using a face mask throughout the scans. Respiration rate (90 to 130 b.p.m.) and rectal temperature (37±0.5°C) were continuously monitored. Heart rate and blood oxygen saturation level (SaO2) were recorded using a MouseOx system (STARR Life Science Corp., Oakmont, PA, USA) and maintained within normal physiologic ranges.
Cerebral metabolic rate of glucose measurements
Mice were anesthetized under 1.2% isoflurane throughout the measurements. In all, 0.5 mCi of 18FDG dissolved in 1 mL of physiologic saline solution was injected through the tail vein. Forty minutes were allowed for 18FDG uptake before scanning. The animal was then moved to the scanner bed (Focus 220 MicroPET; Siemens, Nashville, TN, USA) and placed in the prone position. Emission data were acquired for 20 minutes in a three-dimensional list mode with intrinsic resolution of 1.5 mm. For image reconstruction, three-dimensional positron emission tomography (PET) data were rebinned into multiple frames of 1 second duration using a Fourier algorithm. After rebinning the data, a three-dimensional image was reconstructed for each frame using a 2D filtered back projection algorithm. Decay and dead time corrections were applied to the reconstruction process. Because 18FDG is taken up by the whole body of the animal, we chose a ‘region of interest’ for our measurements that encompassed the whole brain, as outlined with a white line in Figure 2D, and determined cerebral metabolic rate of glucose (CMRGlc) for whole brain using the mean standardized uptake value (SUV) equation: SUV = (
Cerebral blood flow measurements
Quantitative CBF (mL/g per minute) was measured using magnetic resonance imaging-based continuous arterial spin labeling techniques17,18 on a horizontal 7T/30cm magnet and a 40-G/cm BGA12S gradient insert (Bruker, Billerica, MA, USA). Mice were anesthetized under 1.2% isoflurane. A small circular surface coil (internal diameter = 1.1 cm) was placed on top of the head and a circular labeling coil (internal diameter = 0.8 cm), built into the cradle, was placed at the heart position for continuous arterial spin labeling. The two coils were positioned parallel to each other, separated by 2 cm from center to center, and were actively decoupled. Paired images were acquired in an interleaved manner with field of view = 12.8 × 12.8 mm2, matrix = 128 × 128, slice thickness = 1 mm, 9 slices, labeling duration = 2,100 ms, repetition time = 3,000 ms, and echo time = 20 ms. Continuous arterial spin labeling image analysis used codes written in Matlab17,18 and STIMULATE software (University of Minnesota, Minneapolis, MN, USA) to obtain CBF. The resolution (0.1 mm) allowed CBF to be determined both globally and regionally. Regional determinations in this study were performed in hippocampus and cortex because of their involvement in memory.
Brain metabolite determinations
1H magnetic resonance spectroscopy (MRS) was acquired with a point-resolved spectroscopy PRESS sequence. Animals were anesthetized under 1.2% isoflurane. A single voxel (3.5 mm cube) was placed at the isocenter of the mouse brain (water linewidth = 17 Hz) to determine the global concentration of brain metabolites. Parameters are repetition time/echo time = 2,500/140 ms; with (256 averages) and without (4 averages) VAPOR water suppression and outer volume suppression techniques. Data were processed using Bruker TOPSPIN software (TopSpin 2.1, Bruker BioSpin, Billerica, MA, USA), including Fourier transformation, magnitude calculation, frequency correction, phase correction, and baseline correction. Lactate (1.33 p.p.m.),

where [
ATP concentrations
After completion of the 1H MRS scans, the surface coil was tuned to 31P Larmor frequency (121.6 MHz) and 31P MRS was acquired with an NSPECT sequence. Parameters are repetition time = 4,000 ms and 160 averages. An additional measurement was performed with a 10-mmol/L phosphocreatine (PCr) phantom as the external reference. ATP concentration ([ATP]) in brain was determined by Equation (1), where with
Behavioral Testing
Animals and conditions for behavioral testing
Ten mice per group were used for all tests. Animals that performed > 10 movements in the Y maze or did not engage in exploration of objects presented in the novel object recognition (NOR) task were excluded from the studies. Experiments were performed between 10:00 and 15:00 h. Whenever possible, animals were housed in groups with a maximum of four mice per cage. The same experimenter, blinded to genotype, performed all behavioral tests.
Y maze
We assessed working spatial memory in Surf1 KO mice and WT controls using the Y-maze task (see illustration in Figure 3A, left panel). Mice were placed at the middle of a Y-shaped maze and allowed to freely explore the three arms over an 8-minute period. The sequence and number of arm entries were recorded. The percentage of trials in which all three arms were represented was recorded as an alternation to estimate short-term memory of the last arms entered. The total number of possible alternations was calculated as the number of arm entries minus two. Unimpaired spatial working memory in rodents results in arm entry alternations at levels above chance. Total number of arm entries serve as a measure of spontaneous activity. Y maze tests were conducted in a standard procedure room with distinct features, which are expected to work as extramaze cues.
Novel object recognition
The NOR task was used to assess memory for interactions with novel objects. Animals tend to spend more time interacting with a new object rather than one they have previously encountered. 19 Experimental animals were habituated to the testing arena, a clean cage, 24 hours before training. On day 1, mice were presented with two different objects and allowed to explore them. On day 2, one of the objects was replaced with a new one (see illustration in Figure 3C). The amount of time mice spent exploring the novel and the previously encountered objects was recorded over 2 minutes. All objects were cleaned with 70% EtOH and allowed to completely dry between trials.
Elevated plus maze
Elevated plus maze (EPM) was used to assess basal anxiety levels, and to indirectly assess motivation. Mice were placed in the center of the maze and allowed to freely explore open and closed arms of the maze for 5 minutes. Mouse movements were recorded by a computer-based video tracking system (Maze2100; HVS Image, Mountain View, CA, USA). Activity levels were determined by measuring the total path length in the EPM, and the basal anxiety levels were determined by measuring the fraction of time spent in the closed arms of the EPM. Data were processed offline using HVS Image and then compiled with Microsoft Excel before statistical analyses.
Determinations of Protein Abundance
Western blotting
All biochemical determinations of relatively abundance of proteins of interest were performed using tissues from groups of mice that were neither used for behavioral testing, nor for functional imaging studies. Animals were euthanized by isoflurane overdose followed by cervical dislocation or by CO2 inhalation. Brain tissues were obtained and homogenized in ice-cold homogenization buffer (50 mmol/L HEPES (pH 7.6), 150 mmol/L sodium chloride, 20 mmol/L sodium pyrophosphate, 20 mmol/L β-glycerophosphate, 10 mmol/L sodium fluoride, 2 mmol/L sodium orthovanadate, 2 mmol/L EDTA, 1.0% Igepal, 10% glycerol, 2 mmol/L phenylmethylsulfonyl fluoride, 1 mmol/L MgCl2, 1 mmol/L CaCl2, and protease inhibitor cocktail). The homogenates were kept on ice for 30 minutes and then centrifuged at 20,000 × g. for 15 minutes. Protein concentrations in supernatants were determined using the Bradford method (Bio-Rad Laboratories, Hercules, CA, USA), which is linear with protein concentration in the ranges tested. 14 Equal amounts of total protein were loaded for all samples, resolved by sodium dodecyl sulfatepolyacrylamide gel electrophoresis, and transferred onto a nitrocellulose membrane. For HIF-1α immunoblots, membranes were stained with Ponceau-S before blocking to confirm equal loading. After blocking with 5% nonfat dry milk in Tris-buffered saline containing 0.1% Tween-20, the blots were probed with antibodies specific for P-CREB and CREB (Cell Signaling Technologies, Danvers, MA, USA) and HIF-1α (Cell Applications, San Diego, CA, USA). The membranes were then washed with Tris-buffered saline buffer with 0.5% Tween-20 and incubated with appropriate horseradish peroxidase-conjugated secondary antibodies (Santa Cruz Biotechnology, Santa Cruz, CA, USA). After washing with Tris-buffered saline buffer with 0.5% Tween-20, proteins were visualized by chemiluminescence using a Typhoon 8600 imager or by exposure to X-ray film (Kodak, Rochester, NY, USA). Densitometry was performed using Image Quant software (GE Healthcare) or NIH Image J (NIH, Bethesda, MD, USA). Total protein loaded in electrophoretic gels in all experiments were no saturating for the amounts of primary antibody used (antibody was in large excess). For all immunoblots, quantitations of optical density were performed in conditions of linearity for substrate oxidation by horseradish peroxidase (i.e., 4 to 5 minutes after initiation of the reaction). Light emission was measured within linear ranges either using multiple exposure times to X-ray film or by setting the Typhoon 8600 imager detector sensitivity such that no saturated pixels were present in the images in the conditions of the scans. Thus, as measured, optical densities were linear with oxidation of luminol to 3-aminophthalate by horseradish peroxidase for all proteins assayed.
Statistical Analyses
Statistical analyses were performed using GraphPad Prism (GraphPad, San Diego, CA, USA), Sigma Stat (Aspire Software International, Ashburn, VA, USA) or the R statistical language.
20
Significance of differences in means between two different groups was determined with Student's
RESULTS
Reduced Cytochrome C Oxidase Activity, Increased Hydrogen Peroxide Production, But Preserved ATP Levels in Mitochondria Isolated from Surf1 Knockout Mouse Brains
Mitochondria isolated from brains of Surf1 KO mice showed decreased COX activity (−49±7%,
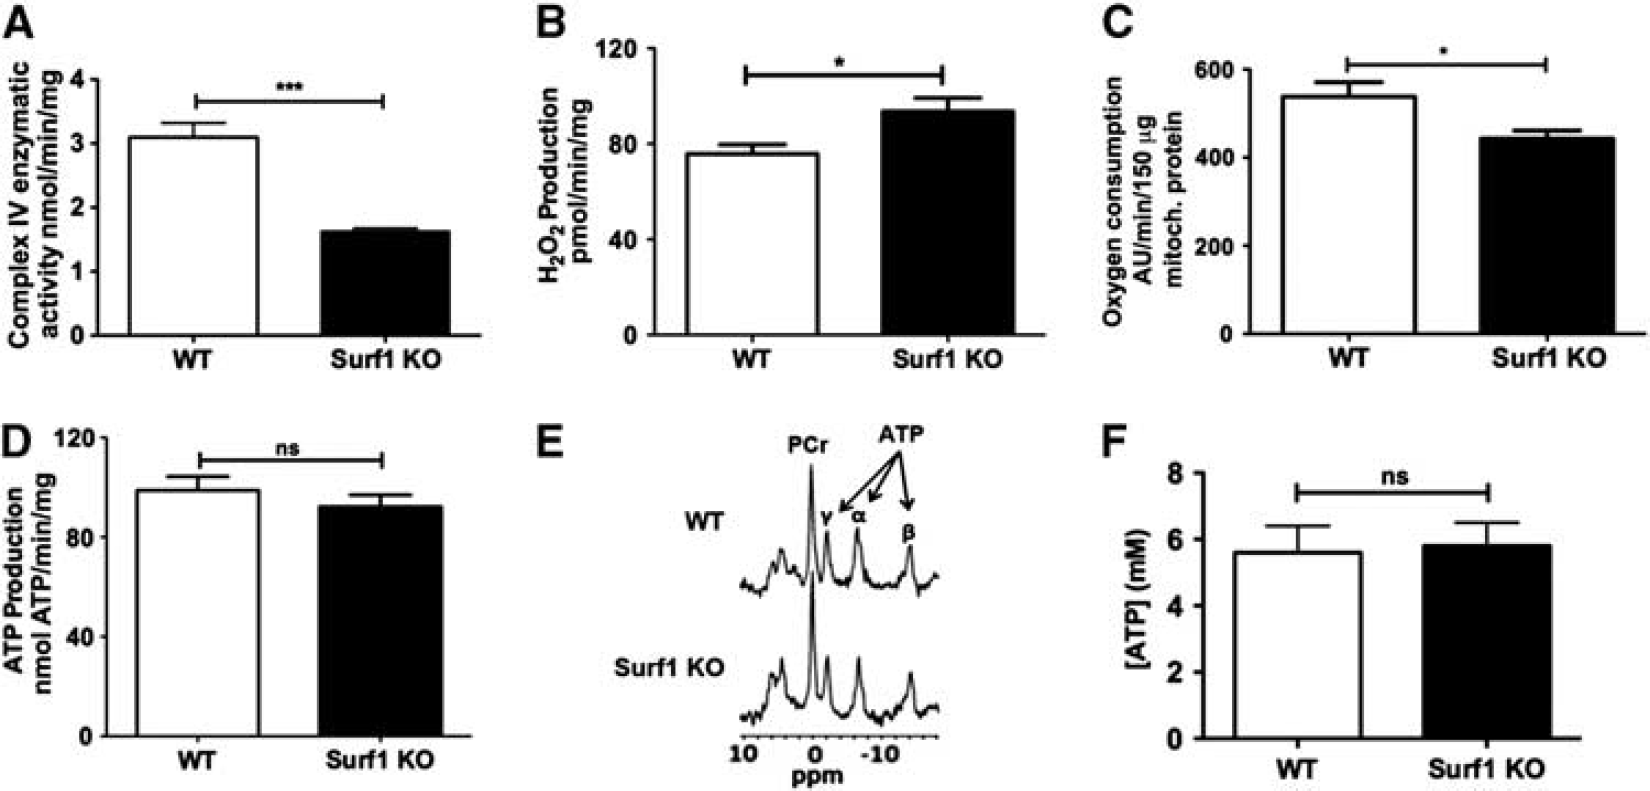
Lower cytochrome C oxidase (COX) activity and state 3 respiration with increased hydrogen peroxide (H2O2) generation, but preserved ATP levels, in mitochondria isolated from brains of Surf1 knockout (KO) mice. (
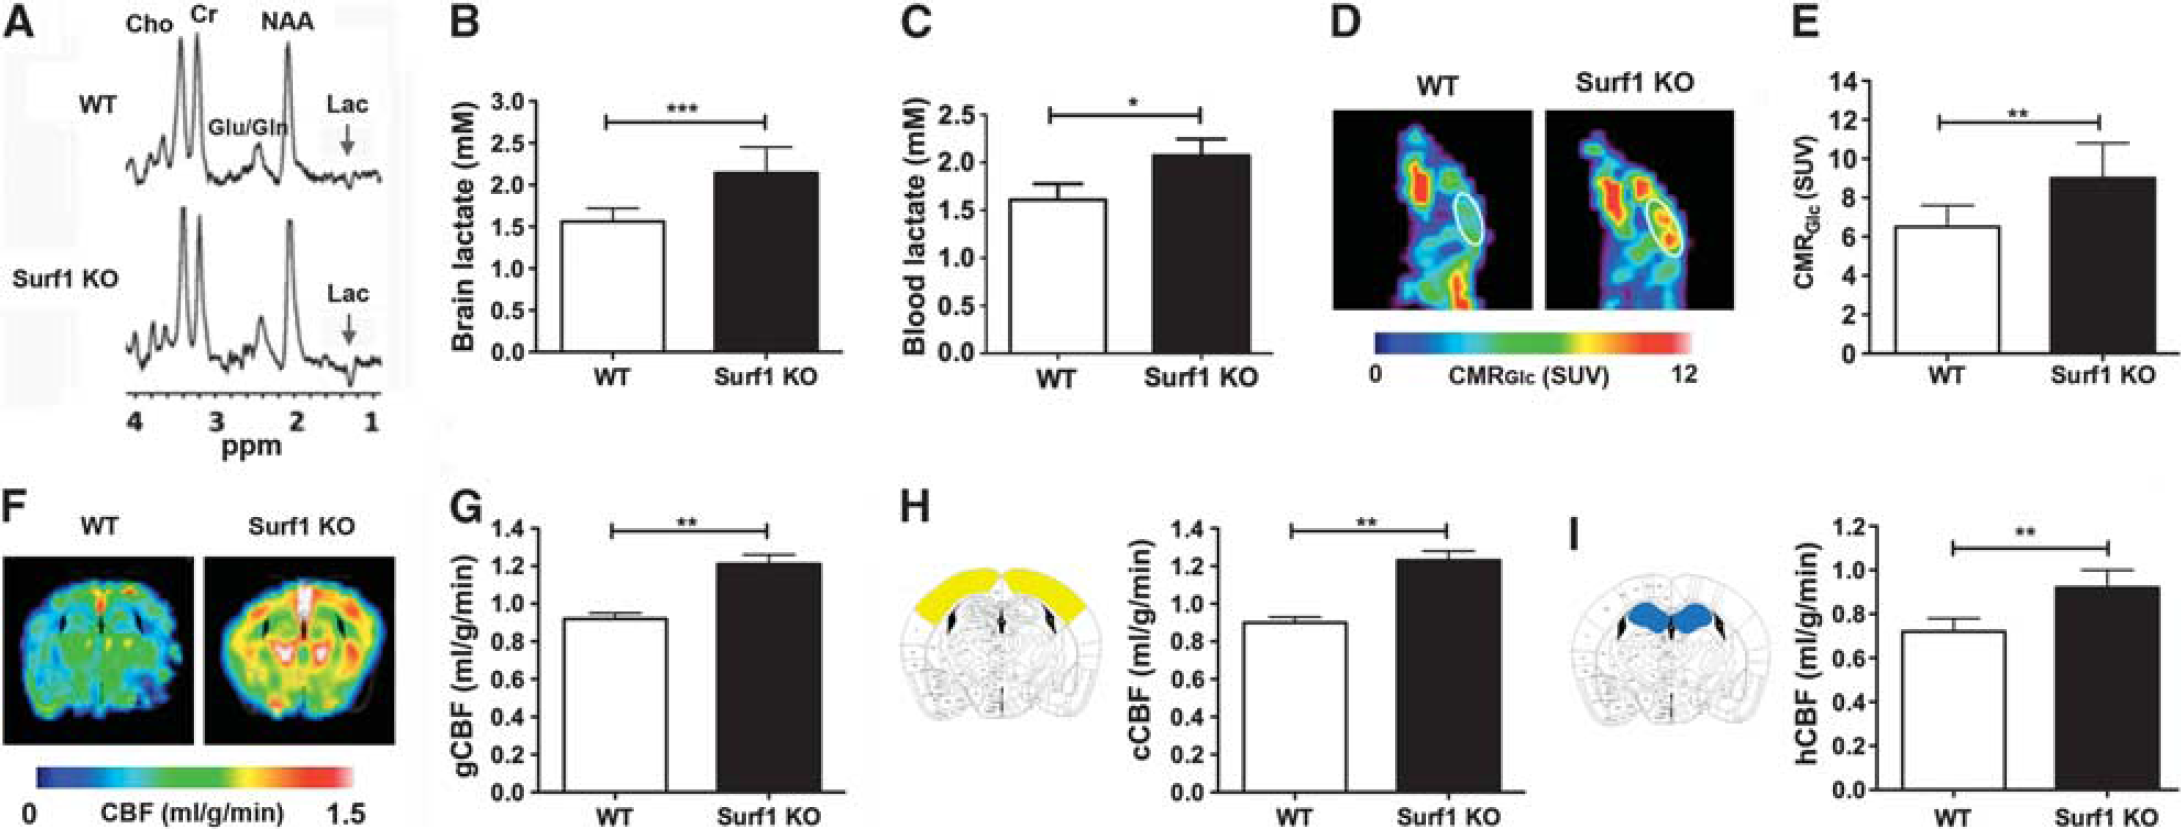
Increased lactate, cerebral metabolic rate of glucose (CMRGlc), and cerebral blood flow (CBF) in Surf1 knockout (KO) brains. (
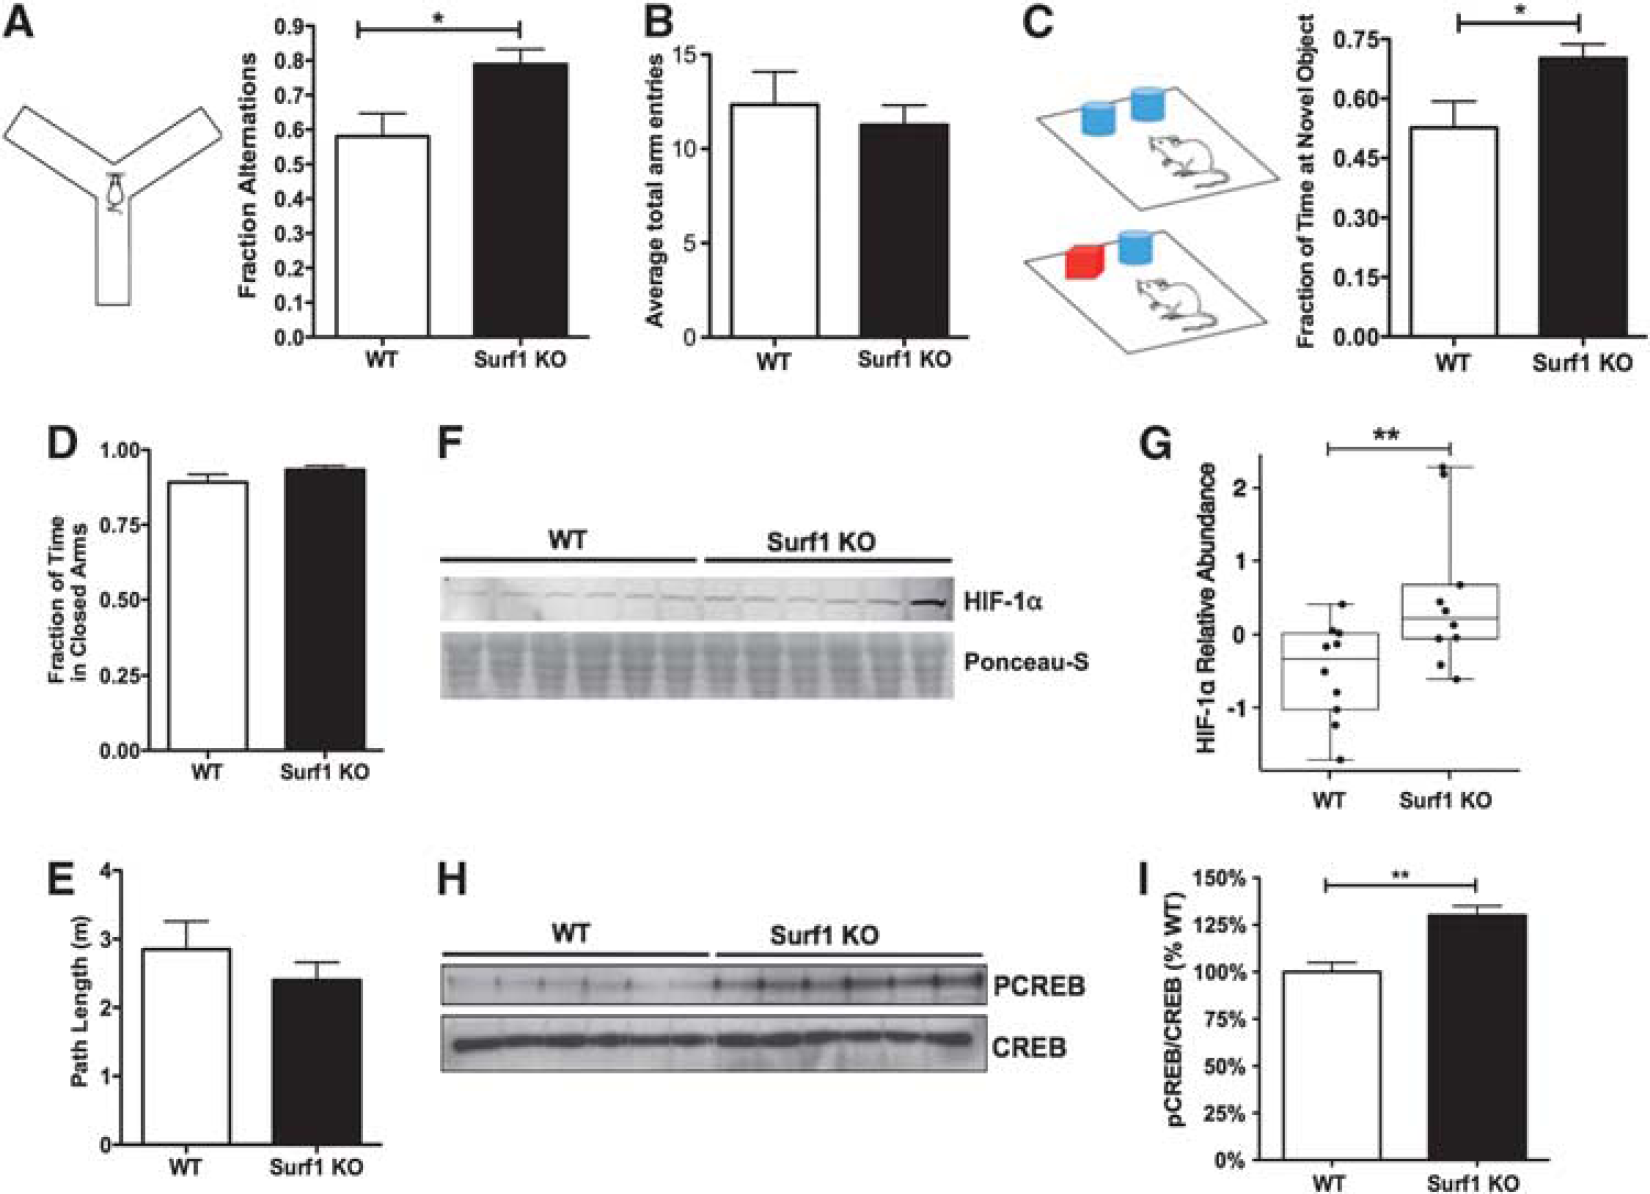
Enhanced memory and increased hypoxia-inducible factor 1 alpha (HIF-1α) and phosphorylated cyclic AMP response element binding (pCREB) in Surf1 knockout (KO) mice. (
Increased Global Lactate Levels and Glucose Metabolism in Surf1 Knockout Mouse Brains
We next used proton 1H MRS to determine lactate in brains of Surf1 KO and WT mice. Figure 2A shows representative 1H spectra and Figure 2B shows global lactate concentrations determined from 1H MRS. Surf1 KO mice showed significantly increased brain lactate concentrations (37±7%,
Increased Global and Regional Cerebral Blood Flow in Surf1 Knockout Mouse Brains
Because increases in glucose metabolism can be accompanied by increases in cerebral perfusion,
25
we used magnetic resonance imaging to determine CBF in Surf1 KO and WT control mice. Single-slice CBF maps of WT and Surf1 KO mice (Figure 2F) include cortex and hippocampus, and correspond to the atlas images in Figures 2H and 2I. Figure 2G shows quantitative global CBF values for both experimental groups. Global CBF was increased in Surf1 KO mice with respect to WT mice (32±6%,
Enhanced Working Spatial and Recognition Memory in Surf1 Knockout Mice
To determine whether the observed metabolic changes in Surf1KO mice were associated with changes in higher level processes, we assessed working spatial memory and recognition memory in Surf1 KO and WT mice using the Y maze and the NOR tasks. Surf1 KO mice showed significantly increased alternations in the Y maze compared with the WT group (38±8%,
Increased Hypoxia-Inducible Factor 1 Alpha and Phosphorylated Cyclic AMP Response Element-Binding in Surf1 Knockout Mouse Brains
Cytochrome C oxidase deficiency induced increased H2O2 production in mitochondria isolated from Surf1 KO brains (Figure 1B). Because increases in ROS have been shown to stabilize HIF-1α,3,26 we hypothesized that HIF-1α3,26 may be increased in brains of Surf1 KO mice. To test this hypothesis, we examined HIF-1α levels in brains of Surf1 KO mice and WT control littermates. Levels of HIF-1α in Surf1 KO mouse brain lysates were increased by 50±10% compared with WT brains (Figures 3F and 3G,
DISCUSSION
Our data show that long-lived 9 Surf1 KO mice have significantly enhanced CMRGlc, increased CBF, increased brain lactate, and increased levels of HIF-1α and pCREB, as well as enhanced working and recognition memory. ATP production in brain mitochondria isolated from Surf1 KO mice remained unchanged despite a 49% reduction in COX activity, a 24% reduction in state 3 respiration, and a 24% increase in H2O2 production. ATP levels were also unchanged in Surf1-deficient brains.
In agreement with prior studies,
9
blood lactate in Surf1 KO mice was higher than in WT mice, indicating a partial block in the aerobic metabolism of pyruvate in peripheral tissues.
9
Alterations in peripheral glucose metabolism may lead to changes in blood glucose levels, which could in turn alter the rates of transport and metabolism of 18F-FDG. Blood glucose levels in Surf1 KO mice, however, were not changed under fed conditions (in our studies) nor after short-term or long-term fasting in the studies of Deepa
The increase in CMRGlc in Surf1 KO brains indicates a moderate increase in brain glucose utilization. Lactate levels were also moderately increased in Surf1-deficient brains. Maintained ATP levels, however, argue against a significant block in respiration rates in Surf1 KO brains because of excess capacity of COX
Even though we cannot infer changes in H2O2 levels
The findings of this study are consistent with prior evidence from invertebrate models, suggesting that decreased mitochondrial respiration and increased ROS generation could have beneficial effects.3,4 Although it is well documented that exceedingly increased ROS can damage cellular structure/function and thus accelerate aging and shorten lifespan,
1
emerging evidence shows that
Taken together, our data indicate that Surf1-induced mitochondrial dysfunction could lead to physiologic adaptations that ultimately result in enhanced neuroprotection
9
and enhanced cognitive function. In agreement with this hypothesis, mice in which Coq7, a mitochondrial hydroxylase necessary for the synthesis of ubiquinone, is reduced by half (Mclk1
Another limitation of the present study is that we used isoflurane to anesthetize the animals during functional imaging experiments. This intervention may have lowered brain metabolism; and thus our measurements may not be representative of brain metabolism in the conscious state.
32
In addition, isoflurane anesthesia may, itself, disturb the tissue's metabolic profile, such as by increasing lactate, as compared with propofol anes-thesia.
33
To minimize these potential confounds, we used low concentrations of isoflurane for anesthesia and monitored respiration rates and rectal temperatures continuously for all experimental groups during functional imaging experiments. Although we cannot rule out a potential effect of isoflurane in our results, at the dose used, isoflurane anesthesia did not affect basic physiologic parameters for animals of either genotype while measurements were taken. Furthermore, and supporting the notion that our
In conclusion, the present studies show that reduced oxygen consumption and increased H2O2 generation without changes in ATP production by Surf1-deficient brain mitochondria
Footnotes
The authors declare no conflict of interest.
ACKNOWLEDGEMENTS
The authors are grateful to Drs Matthew Hart and Kathleen Fischer for reviewing the manuscript.