
Abstract
Multimodality molecular brain imaging encompasses
Introduction
The term multimodality imaging historically referred to imaging performed using different instrumentation platforms, although a given modality may provide multiple types of imaging outcomes. For brain imaging applications, example platforms include magnetic resonance imaging (MRI), computed tomography (CT), positron emission tomography (PET), single photon computed tomography (SPECT), optical, electroencephalography, and magnetoencephalography.
Instrumentation and software developments over the past 30 years have fueled advancements in multimodality imaging and combined assessments. Efforts by Hasegawa and colleagues in the late 1980s paved the way for combined SPECT/CT (in 1996) and PET/CT (in 1998) platforms for human imaging that generally facilitated sequential data acquisitions with high spatial correspondence of the multimodality data (Townsend, 2008). Simultaneous PET/MRI is now possible in humans (Catana et al, 2008; Herzog et al, 2011; Schlemmer et al, 2008) after an extensive technical development period that includes early study of magnetic field effects on positron range (Christensen et al, 1995; Iida et al, 1986) and subsequent development of a preclinical simultaneous PET/MR scanner by Cherry and colleagues (Townsend, 2008, for review). In the preclinical animal imaging arena, multimodality molecular imaging has been widely applied with dual and triple modality options (i.e., PET/MR, PET/SPECT/CT, or SPECT/CT/optical) possible or under development (Goorden and Beekman, 2010; Stout and Zaidi, 2009; Wehrl et al, 2009). Most preclinical systems in use require sequential imaging (Stout and Zaidi, 2009).
The term molecular imaging arose from early work in the ‘reporter’ gene technology field that utilized noninvasive
In 2007, the term further evolved to include the visualization, characterization, and measurement of biological processes at the molecular and cellular levels in humans and other living systems that typically consists of two- or three-dimensional imaging as well as quantification over time, and multiple imaging modalities that include radiotracer imaging in nuclear medicine, MRI, MR spectroscopy, optical imaging, ultrasound, and others (Mankoff, 2007).
This review emphasizes PET as a molecular imaging tool and MRI as a structural and functional imaging tool for human neuroscience research. Preclinical animal and optical imaging are briefly discussed in the context of molecular probe development. Example images are provided to exemplify complementary features and strengths of the imaging modalities and challenges that are relevant for both combined (sequential) and simultaneous multimodality imaging are discussed. Alzheimer's disease (AD) is emphasized because multimodality neuroimaging findings have begun to significantly impact the understanding and management of this disease.
Modalities
Optical Imaging
Optical imaging exploits the optical properties of tissue (i.e., absorption, scattering, luminescence, and fluorescence) to generate image contrast. Near infrared spectroscopy and diffuse optical imaging tomography allow functional brain imaging of hemodynamic parameters and neural activation based on the capability of these methods to study the dynamics of oxyhemoglobin and deoxyhemoglobin concentrations in the brain (Boas et al, 2004). Multiphoton microscopy applies a pulsed laser point source for the fluorescent excitation of molecules to achieve deeper penetration into scattering tissue than visible light microscopy and optical tomography but with a restricted excitation volume (Bacskai et al, 2002). This
Positron Emission Tomography Imaging
Positron emission tomography is an established molecular imaging tool that measures the radioactivity distribution of imaging agents labeled with positron-emitting radionuclides. After a positron is emitted from the nucleus of an atom, it travels a few mm in tissue (positron range) and interacts with an electron to generate two 511 keV photons (annihilation radiation) that are emitted ∼180° apart. Positron emission tomography scanners typically have multiple rings of scintillation detectors (e.g., bismuth germinate, BGO or lutetium oxyorthosilicate, LSO). The scanner registers an event when two photons are detected within a narrow few nanosecond time window (coincident event). The most widely used positron-emitting radionuclides for brain imaging are 15O (
Positron emission tomography offers a wide range of molecular imaging options (Table 1) that include numerous neuroreceptor system targets (e.g., presynaptic and postsynaptic neuroreceptors, transporter/reuptake sites, vesicular transporters), translocator proteins, and amyloid plaques. Positron emission tomography imaging of cellular processes, particularly relevant for neuro-oncology, include amino-acid uptake, hypoxia, protein synthesis, and cell proliferation. A unique strength of PET is its capability to perform quantitative
Example of PET molecular imaging options for neurodegeneration (ND) and other diseases/disorders of braina
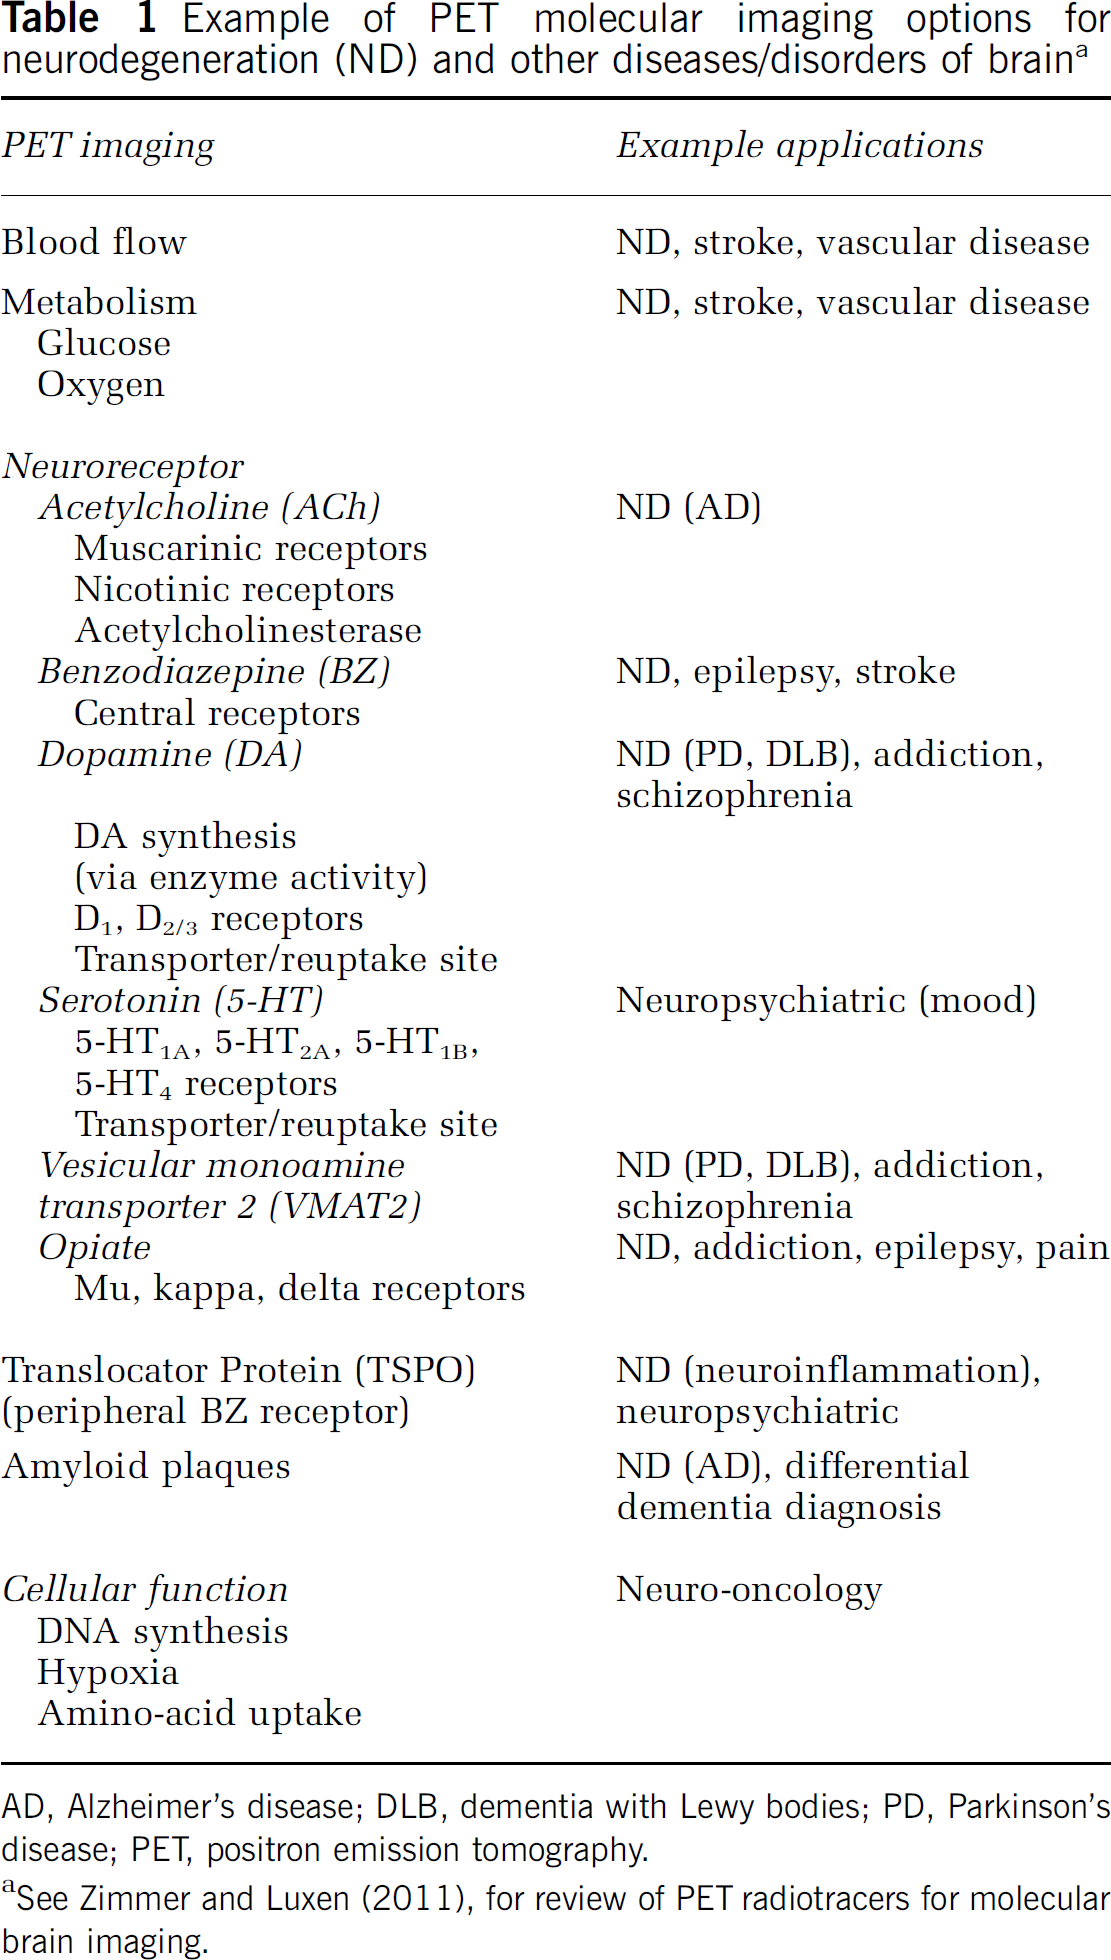
AD, Alzheimer's disease; DLB, dementia with Lewy bodies; PD, Parkinson's disease; PET, positron emission tomography.
See Zimmer and Luxen (2011), for review of PET radiotracers for molecular brain imaging.
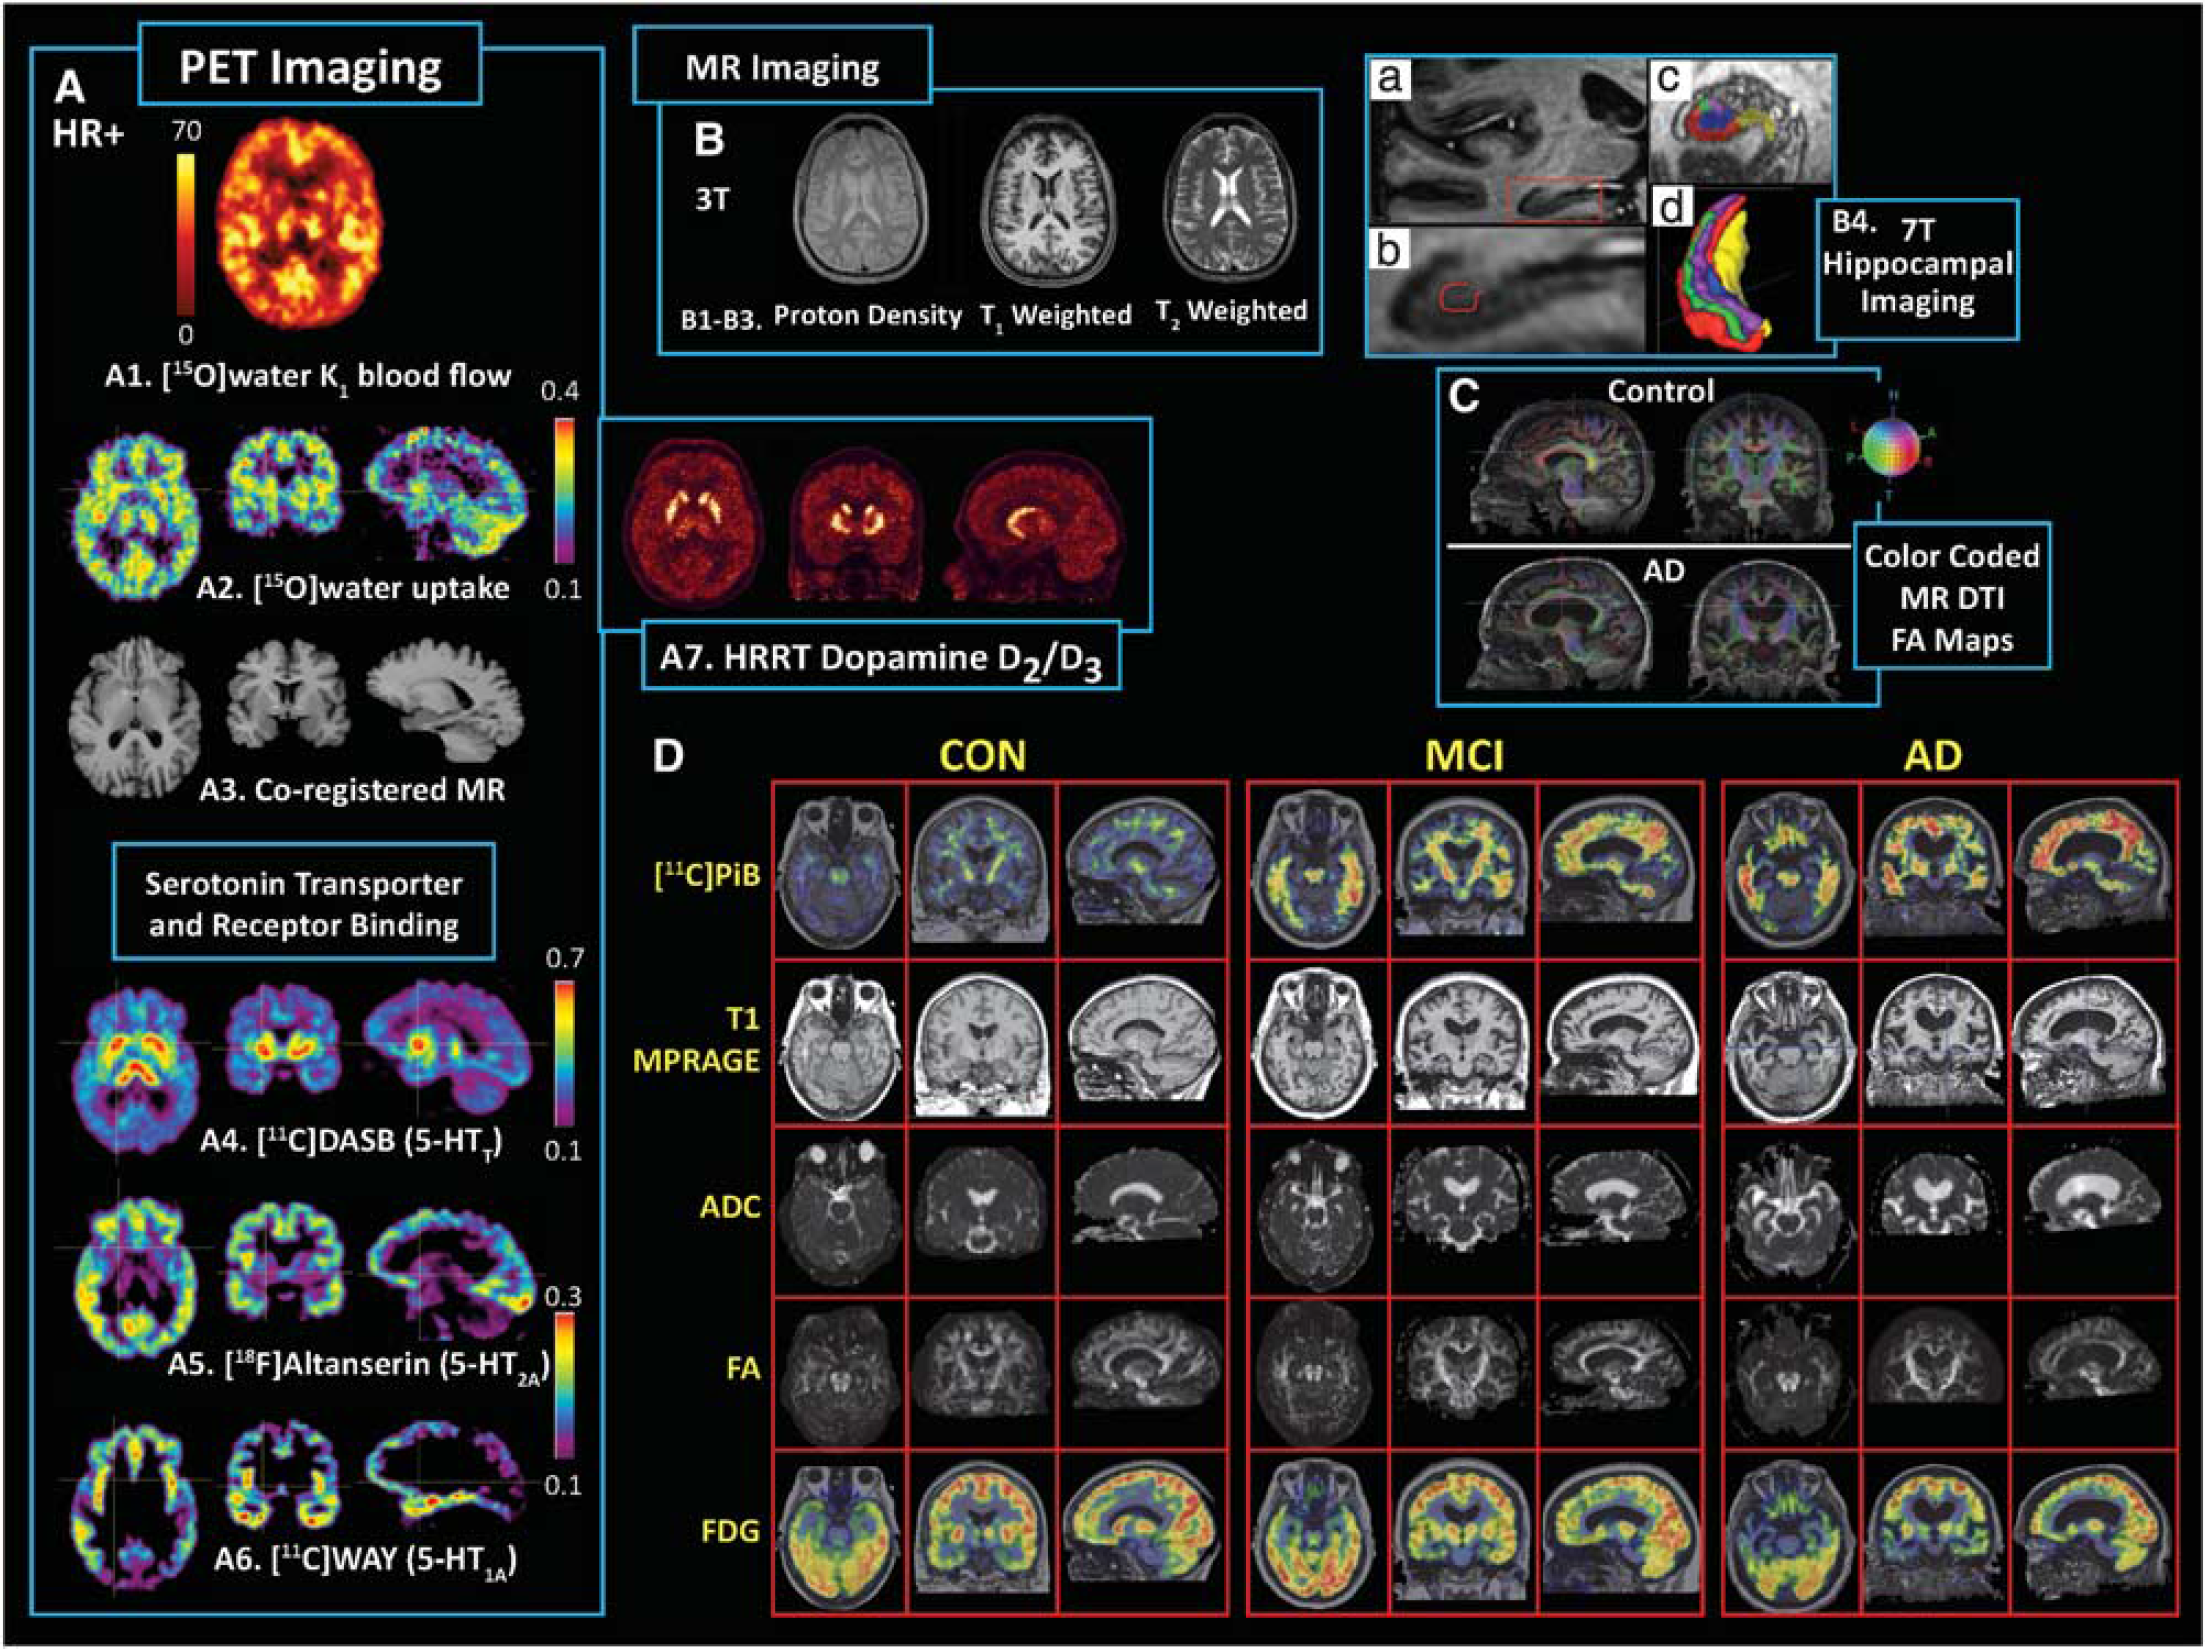
Composite survey of molecular positron emission tomography (PET) brain imaging targets and structural magnetic resonance imaging (MRI) correlates. (
Positron emission tomography has been widely applied to study
Magnetic Resonance Imaging
Magnetic resonance imaging offers exquisite structural imaging with strong functional and molecular options. Magnetic resonance imaging exploits the nuclear magnetic resonance properties of paramagnetic nuclei (e.g., 1H, 13C, 19F, 23Na, 31P). Magnetic resonance imaging is operated at various magnetic field strengths (B0) that range from about 1.5 to 7 T for most human studies. This modality uses external radiofrequency pulses to excite and manipulate the magnetic properties of tissue to generate tissue contrast. Magnetic resonance imaging parameters of interest include the longitudinal magnetization time constant, T1 (seconds, ‘spin-lattice’ relaxation/tissue recovery), transverse magnetization time constant, T2 (milliseconds, ‘spin–spin’ relaxation/spin dephasing), and time constant T2∗ that reflects variations in both B0 and local internal magnetic field inhomogeneities in the tissue (with T2∗ less than T2). Blood oxygenation level dependent (BOLD) contrast reflects variations in the concentration of oxygenated blood through T2∗ because deoxyhemoglobin is paramagnetic, while fully oxygenated hemoglobin is diamagnetic. Image contrast can also be achieved by the use of exogenous contrast agents.
Structural MRI for neuroimaging applications is often T1- and/or T2-weighted (Figures 1B and 1D, row 2) with related sequences optimized for imaging of vasculature and brain pathology (Frisoni et al, 2010; Tartaglia et al, 2011). Diffusion-weighted imaging reflects water diffusivity and diffusion tensor imaging (DTI) (e.g., apparent diffusion coefficient and fractional anisotropy) assessments of white matter integrity and axonal architecture have become more routine (Figures 1C and 1D, rows 3 and 4). Sophisticated 3D algorithms enable white matter tractography based on standard DTI or advanced hybrid methods (i.e., diffusion spectrum imaging, DSI) (Thomason and Thompson, 2011).
As summarized by Duyn and Koretsky (2011), there are many advantages to high field MRI (e.g., 7 T), such as a 10- to 100-fold improvement in sensitivity over early 0.15 to 1.5 T MR scanners, the increased use of T2∗-weighted contrast and study of gray and white matter substructure (e.g., cortical laminar structure; Figure 1-B4), such that high field methods allow sensitivity to microscopic variations in magnetic properties of tissue and exploitation of endogenous iron and myelin for imaging, and the use of exogenous contrast agents (e.g., manganese and iron oxide) to study neural connectivity, neuronal tract tracing, and tracking of cell migration
Blood oxygenation level dependent fMRI extends well beyond studies of neural activation and functional coupling and/or connectivity in humans, to include preclinical and human clinical applications, such as neurosurgical planning (Matthews et al, 2006). Magnetic resonance imaging of vascular hemodynamics (Zaharchuk et al, 1998) has undergone steady development with perfusion imaging most commonly performed by either dynamic susceptibility contrast or arterial spin labeling methods (Wolf and Detre, 2007).
Pharmacological MRI (phMRI) provides a functional assessment of pharmacological effects on brain function (Wise et al, 2002). An elegant validation of phMRI was performed early on for the DA system (e.g., amphetamine and DA transporter ligand administration) in rodents that included lesioning studies and assessment of vascular function, BOLD time course, physiological correlates, microdialysis, and behavioral outcomes (Chen et al, 1997). A wide range of phMRI studies has been performed (e.g., at rest and/or during stimulus/task), with strong interest in drug development (e.g., pain therapeutics). Most fMRI and phMRI studies utilize BOLD, although some also utilize arterial spin labeling (Newberg et al, 2005; Wang et al, 2011), such as the recent combined arterial spin labeling and BOLD study of the neural correlates induced by psilocybin (Carhart-Harris et al, 2012).
Molecular MRS (MRI spectroscopy) provides measures of important brain metabolites, such as
Multimodality Imaging
It is becoming more common to acquire multimodality neuroimaging data that include PET and fMRI, as well as other types of MR (and optical) outcomes (Apkarian et al, 2005; Catana et al, 2008; Dougherty et al, 2008; Herzog et al, 2011; Huppert et al, 2008; Newberg et al, 2005; Rabiner et al, 2011; Sperling et al, 2009; Tong et al, 2011). Combined fMRI and PET brain imaging will become even more commonplace with the increased availability of combined PET/MR imaging systems.
Challenges
Multimodality molecular imaging can be challenging because of the different nature of the imaging signals and analysis outcomes, pitfalls, and limitations. Many of these challenges are relevant for both combined sequential scanning and simultaneous scanning. Figure 1 exemplifies the complementary nature of PET and MRI in the context of information gained from combining molecular and structural imaging data to obtain a more comprehensive assessment of subject status. In addition to the serotonin imaging, Figure 1-D shows PET imaging of fibrillar amyloid plaques (row 1) in an elderly control, a subject with mild cognitive impairment (MCI) and an AD patient, along with anatomical and diffusion MRI outcomes (rows 2 to 4) and [18F]2-fluoro-2-deoxy-D-glucose (or FDG) metabolism (row 5). The limited spatial resolution of PET (relative to structural MR data) can be a serious issue for imaging of aging populations or in patients with severe disease, when substantial cerebral atrophy and cerebrospinal fluid (CSF) dilution of gray matter arises. Figure 1 shows a challenging example for an AD patient with extreme cerebral atrophy and advanced disease (Figures 1C and 1D).
Positron emission tomography resolution is generally limited by the scanner design and performance characteristics. The resolution of many PET scanners used for brain research is ∼5 to 6 mm (e.g., HR+ scanner). Partial volume averaging of the PET data (and lower resolution MRI outcomes) can complicate comparative image analyses. Issues to consider for PET drug challenges and/or measurement of endogenous neurotransmitter involve (1) efforts to minimize blood flow or radiotracer clearance confounds (i.e., bolus versus bolus+constant infusion radiotracer administration), (2) radiotracer half-life in the context of necessary study duration, (3) timing of drug/stimulus administration with respect to stability in drug response, and stability of receptor or target binding outcome, and (4) sufficient radiotracer-specific activity to ensure good signal-to-noise and to minimize contamination effects from carry-over of unlabeled ligand mass from baseline study to postintervention study when performed the same day.
A well-known challenge for fMRI is the incomplete understanding of the complex physiological changes caused by neural activation, such that the interpretation of BOLD signals, and other functional neuroimaging signals related to blood or tissue oxygenation, may be limited until it is possible to better understand brain oxygen metabolism and how it is related to blood flow (Buxton, 2010). Contamination of the BOLD signal by physiological noise can be a complicating factor (Tong et al, 2011). Technical challenges also can arise in the experimental fMRI paradigm (e.g., task, stimulus, pharmacologic challenge) and/or ‘resting state’ conditions. The choice of study design (i.e., event-related, block design, or mixed design) and the extent to which a block design may yield greater effect sizes (Friston et al, 1999) are important considerations. The spatial ‘functional’ resolution of fMRI (mm) depends on the voxel size. A larger image acquisition matrix (smaller voxels) improves spatial resolution but reduces the voxel signal, and short TR may improve temporal resolution but this depends on the temporal nature of the hemodynamic response function (HRF) (Huettel et al, 2009). Methods have been proposed to recover signal loss in fMRI, including the use of tailored radiofrequency pulses (Yip et al, 2006). Table 2 summarizes parameters for consideration for combined PET and fMRI.
Considerations for multimodality PET and MR brain imaging
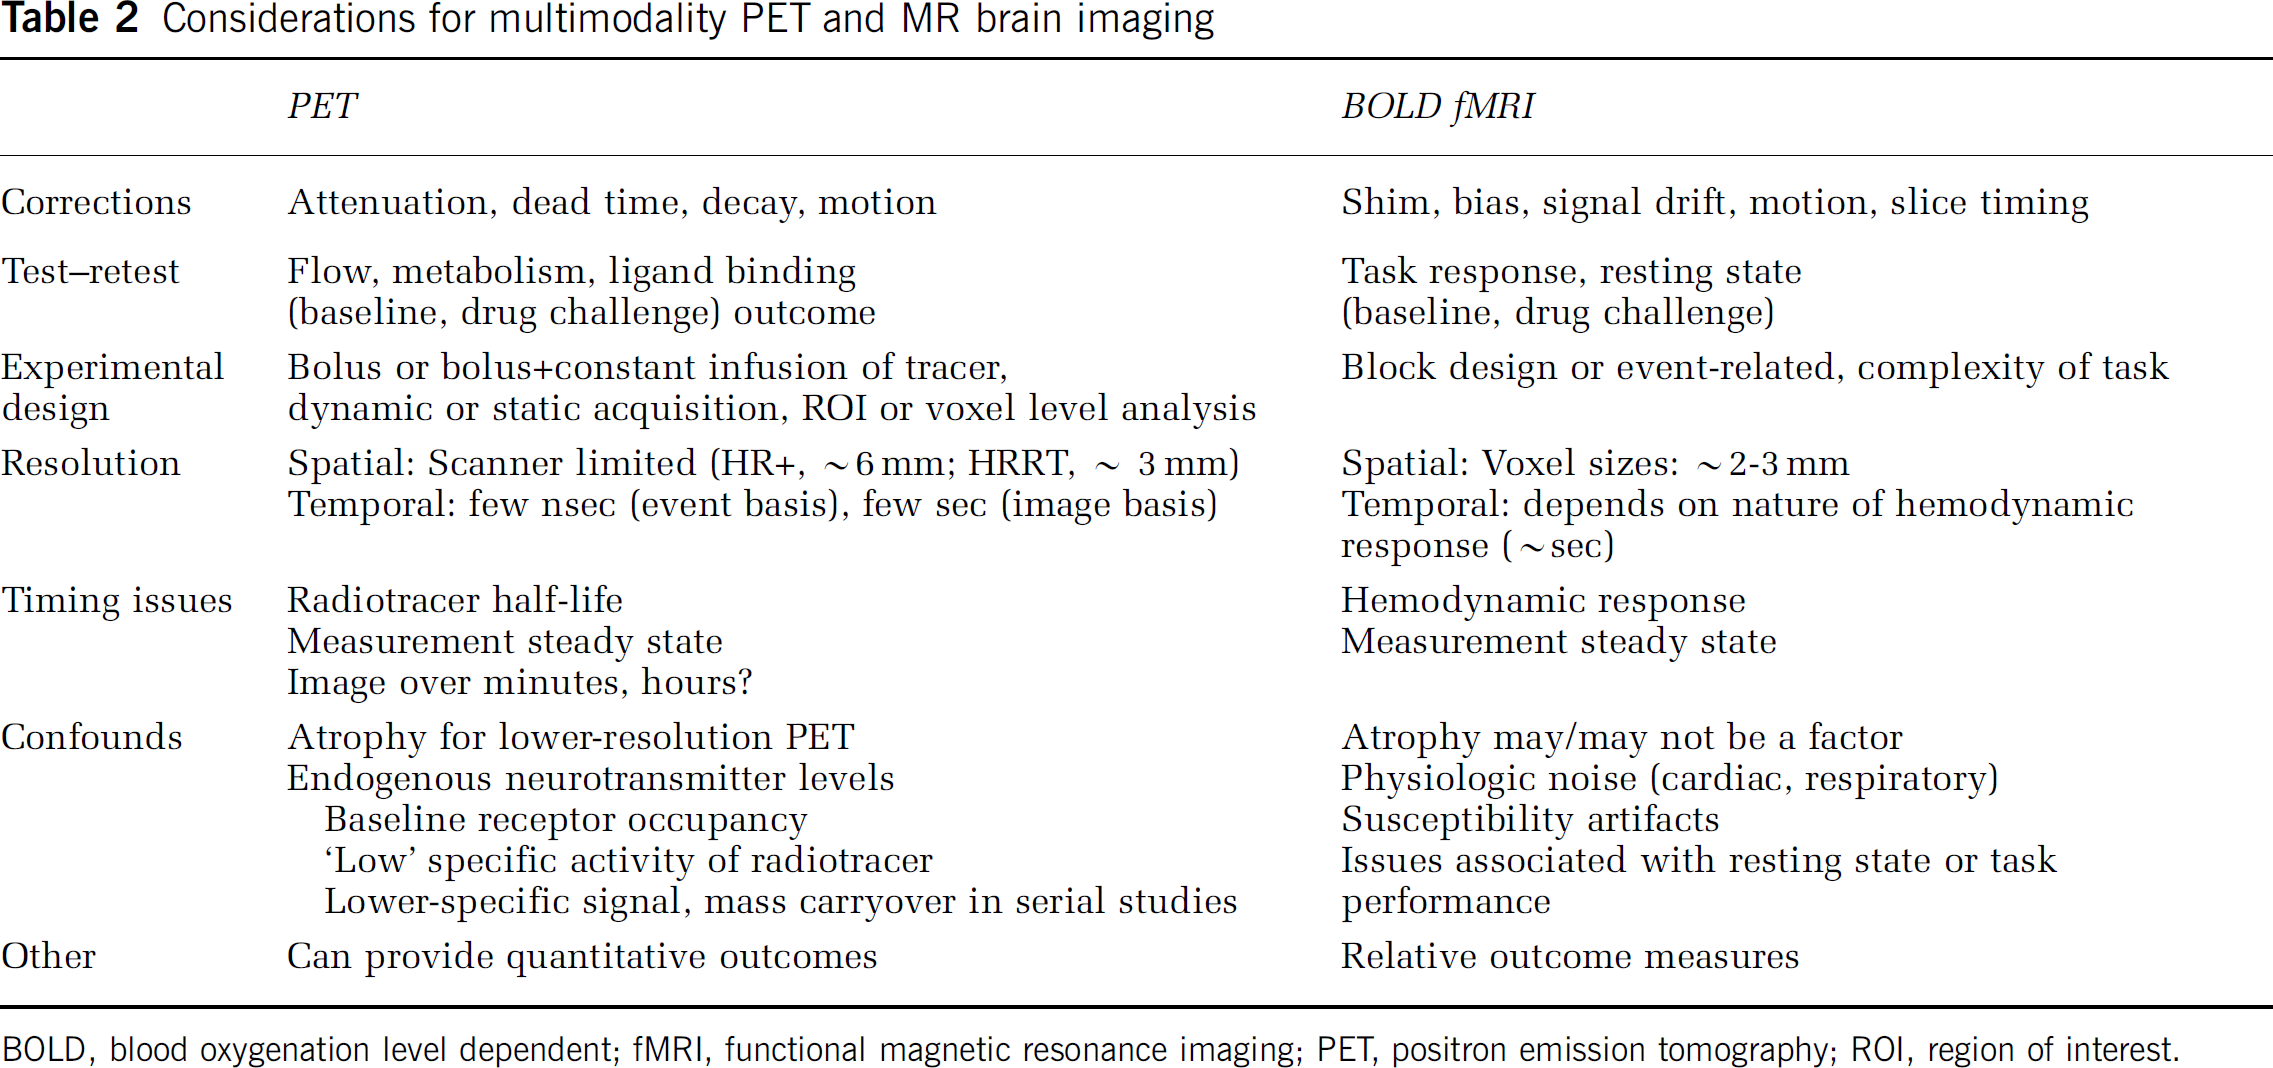
BOLD, blood oxygenation level dependent; fMRI, functional magnetic resonance imaging; PET, positron emission tomography; ROI, region of interest.
Analysis of multimodality studies can also be challenging, and knowledge of the technical and statistical strengths/weaknesses of the data can inform choice of analysis method. Multimodality outcomes, for example, can be related on an ROI (region of interest) basis, based on maps of statistical group differences, by categorizing subjects into molecular or fMRI outcome groups, or by incorporation of data from one modality into the analysis (or reconstruction) of another (Bayesian). It may be advantageous and more powerful to pursue an ROI-based approach when testing regionally specific hypotheses (Mitsis et al, 2008), although voxel-based and data-driven approaches are sometimes required (e.g., functional connectivity). Numerous methods have been used to enable the statistical analysis of multimodal and intramodal data sets that include statistical parametric mapping methods and specialized toolboxes with correlative, concordant, or integrative techniques and modeling-based approaches (Buckner et al, 2005; Casanova et al, 2007; Hayasaka et al, 2006; Krishnan et al, 2011; Ye et al, 2009). As an example, concordance–discordance analysis (Hayasaka et al, 2006) can be powerful for the comparison of group difference
Combined
A novel study design was recently implemented that combined molecular and functional imaging with
Simultaneous
The ability to perform true simultaneous molecular and structural/functional imaging in humans became possible with the prototype hybrid BrainPET insert within a 3T MR scanner. The BrainPET was operational at a limited number of sites, but the design was space limited and did not allow for a full range of neuroimaging options. The utility of the instrument was demonstrated (Schlemmer et al, 2008), particularly for neuro-oncology (Heiss et al, 2011). Figure 2 shows examples of simultaneous imaging in tumor patients and the suitability of hybrid imaging for monitoring of disease progression, treatment response, and fMRI assessment of motor function (Herzog et al, 2011).
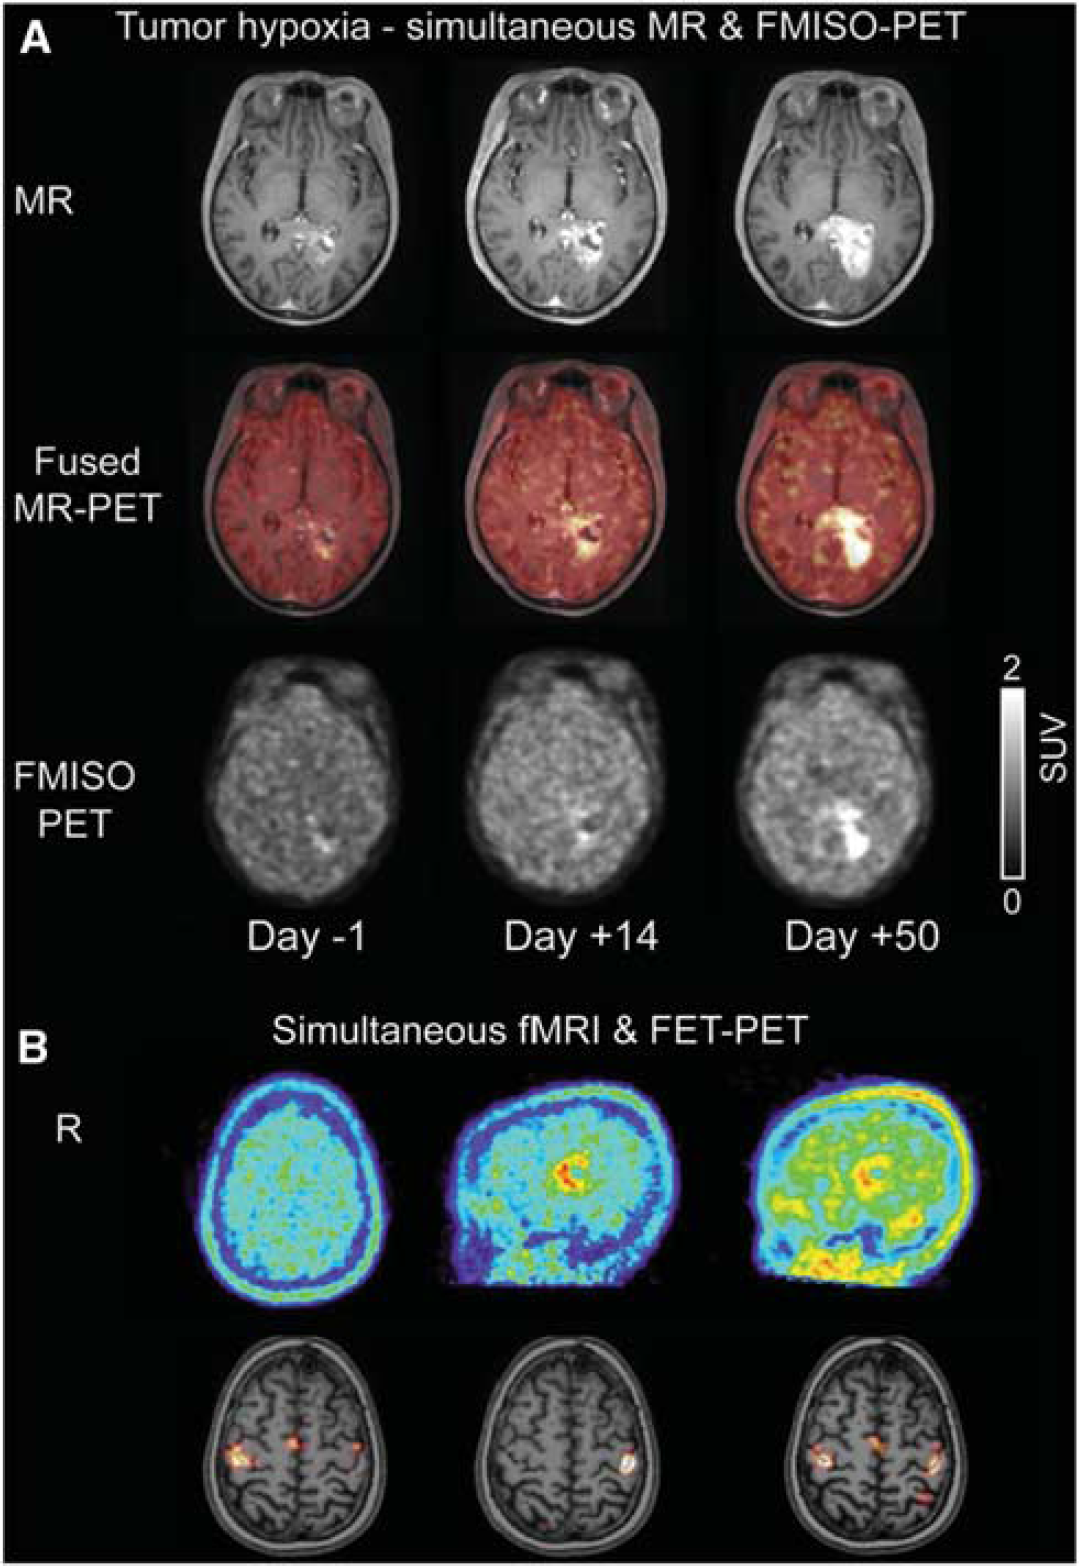
Examples of simultaneous magnetic resonance/positron emission tomography (MR/PET) imaging achieved using BrainPET insert. (
There is now the capability to perform simultaneous whole body PET/MR imaging (Delso et al, 2011). This platform will allow for the strengths of simultaneous imaging to be fully realized with capability that is well beyond that of sequential multimodality imaging. This platform enables multimodality imaging for the same drug challenge,
Multimodality Imaging in Alzheimer's Disease
Background
Alzheimer's disease is the most common type of dementia and it is estimated that AD accounts for 60% to 80% of dementia cases (Alzheimer's Association, 2010). Alzheimer's disease is characterized by the neuropathological accumulation of amyloid-
Amyloid plaques are composed primarily of aggregated A
Although the greatest risk factor for AD is age, there is a major susceptibility gene for late-onset sporadic AD that is the apolipoprotein E (ApoE) e4 allele. The ApoE gene (on chromosome 19) has a role in cholesterol transport, uptake, and redistribution and both ApoE and its receptor (low-density LRP (lipoprotein receptor-related protein)) are found in plaques in AD (Spires and Hyman, 2005, for review). There are also individuals with rare chromosomal mutations in regions that code for the amyloid precursor protein (APP) or the secretase complex (Presenilin 1 or 2) that yield a dominant inheritance pattern for AD that is 100% penetrant with early onset before the age of 65 (Pastor and Goate, 2004). Down's syndrome subjects who have an extra copy of chromosome 21 (codes for APP) exhibit A
Animal Imaging
Transgenic (Tg) mouse models serve as a major experimental tool for preclinical neuroimaging research in AD. Spires and Hyman (2005) provided a piece-wise summary of the molecular pathology of Tg animal models of AD, such that APP cleavage by
Positron emission tomography imaging in Tg mice has focused recently on imaging of A
Despite the multiphoton microscopy success, microPET imaging of transgenic mice yielded poor [11C]PiB retention in the brain (Klunk et al, 2005; Toyama et al, 2005). Klunk et al (2005) did not observe significant [11C]PiB retention (specific activity > 37 GBq/
Magnetic resonance imaging studies of Tg mice also include vascular imaging, hippocampal and ventricular volumes, DTI, fMRI, and MRS—with additional PET imaging of metabolism, acetylcholinesterase activity, and neuronal integrity via benzodiazepine receptor binding (Waerzeggers et al, 2010). It can be challenging to detect age- and neuropathology-related abnormalities in the small mouse brain. Magnetic resonance imaging requires high magnetic field strength and advanced imaging methods, while PET is limited by spatial resolution despite high sensitivity capabilities. Efforts are ongoing to achieve better correspondence between neuroimaging results in AD-Tg mouse models, relative to what is observed in human studies (Waerzeggers et al, 2010). Recent efforts report alternative MRI methods that enable detection of A
Human Imaging: Structural Magnetic Resonance Imaging, Functional Magnetic Resonance Imaging, and Molecular Positron Emission Tomography Imaging in Alzheimer's Disease
Structural Magnetic Resonance
Atrophy in the hippocampus and entorhinal cortex is a well-established imaging finding of AD-related neurodegeneration (De Leon et al, 1997; Jack et al, 1999, 2000). This atrophy can be highly correlated with severity of cognitive dysfunction. Significant reductions in the volume of the hippocampus and related structures have also been noted in MCI. In longitudinal studies, MRI-based measurements of hippocampal volume loss have been highly correlated with the conversion of MCI to AD. High interindividual variability in cerebral volume loss of normal aging has led to the development of brain-mapping techniques to further enable detection and tracking of atrophy in crosssectional and longitudinal studies (Thompson et al, 2004). Further comprehensive detail is available in recent reviews (Ewers et al, 2011a; Frisoni et al, 2010; Tartaglia et al, 2011).
Functional Magnetic Resonance Imaging
A large body of research has established functional alterations in brain areas linked with memory processing in AD, MCI and in some at risk for AD (APOE e4 carriers), with involvement of hippocampus and mesial temporal lobe (MTL) (Mevel et al, 2011; Tartaglia et al, 2011). In an example study, Dickerson et al (2005) applied a face-name encoding task and observed greater hippocampal activation in MCI subjects than controls, while hippocampal or entorhinal volumes were not different. The AD subjects, in contrast, showed reductions in activation and also atrophy in both brain areas, relative to controls. The authors concluded that there was a phase of increased MTL activation early in the course of prodromal AD that was followed by a subsequent decrease with disease progression. This work was one of several timely fMRI studies that probed memory function in AD at that time (see Sperling et al, 2009).
Studies of cortical function revealed a distributed network of regions that characterize a default mode network (Raichle and Snyder, 2007) that is more active during rest (nontask condition) than during active task condition. The default network is active when engaged in internally focused tasks including autobiographical memory retrieval, envisioning the future, and conceiving the perspectives of others, with an MTL subsystem and a medial prefrontal subsystem that converge on important nodes of integration (Buckner et al, 2008). This network includes posterior cingulate and parietal lobe (Buckner, 2004, 2005; Greicius et al, 2003, 2004; Wang et al, 2006). Greicius et al (2004) reported decreased default mode network activity in posterior cingulate and hippocampus of AD subjects that suggested disrupted connectivity between these areas. Wang et al (2006) reported disrupted connectivity between specific areas of hippocampus and prefrontal cortex, anterior cingulate, infero-temporal cortex, and cuneus that extended into precuneus and posterior cingulate areas.
Molecular Positron Emission Tomography Imaging
Early PET imaging in AD revealed alterations in SPECT blood flow and FDG metabolism that showed (1) parietotemporal hypoperfusion that sometimes coincided with frontal lobe hypoperfusion (Herholz et al, 2007; Jagust et al, 1997); (2) bilateral metabolic reductions in parietotemporal association cortices and relative sparing of primary neocortical and subcortical areas until later stages (Friedland et al, 1983); and (3) decreased posterior cingulate FDG metabolism that was more prominent than typical parietotemporal reductions (Minoshima et al, 1994). Metabolic reductions in posterior cingulate were found in cognitively normal subjects homozygous for the APOE e4 allele (Reiman et al, 1996, 2001). FDG PET can identify regional deficits in MCI subjects, relative to age-matched control subjects, and predict conversion of MCI subjects to AD (de Leon et al, 2007; Drzezga et al, 2005; Mosconi et al, 2008). Lastly, although a key neurodegenerative feature of AD is loss of cholinergic projections from the basal forebrain, PET imaging of neurotransmitter system dysfunction in AD has not been well established and is partly reflective of methodological limitations of available radiotracers for this system (Herholz et al, 2007).
With the advent of PET A
PiB retention in AD brain correlated with the rate of brain atrophy (Archer et al, 2006) and hypometabolism (Edison et al, 2007). In another study, specific PiB retention was observed in about 20% of normal elderly controls (Mintun et al, 2006) (e.g., Figures 3A and 3B) and correlated well with decreases in amyloid (A
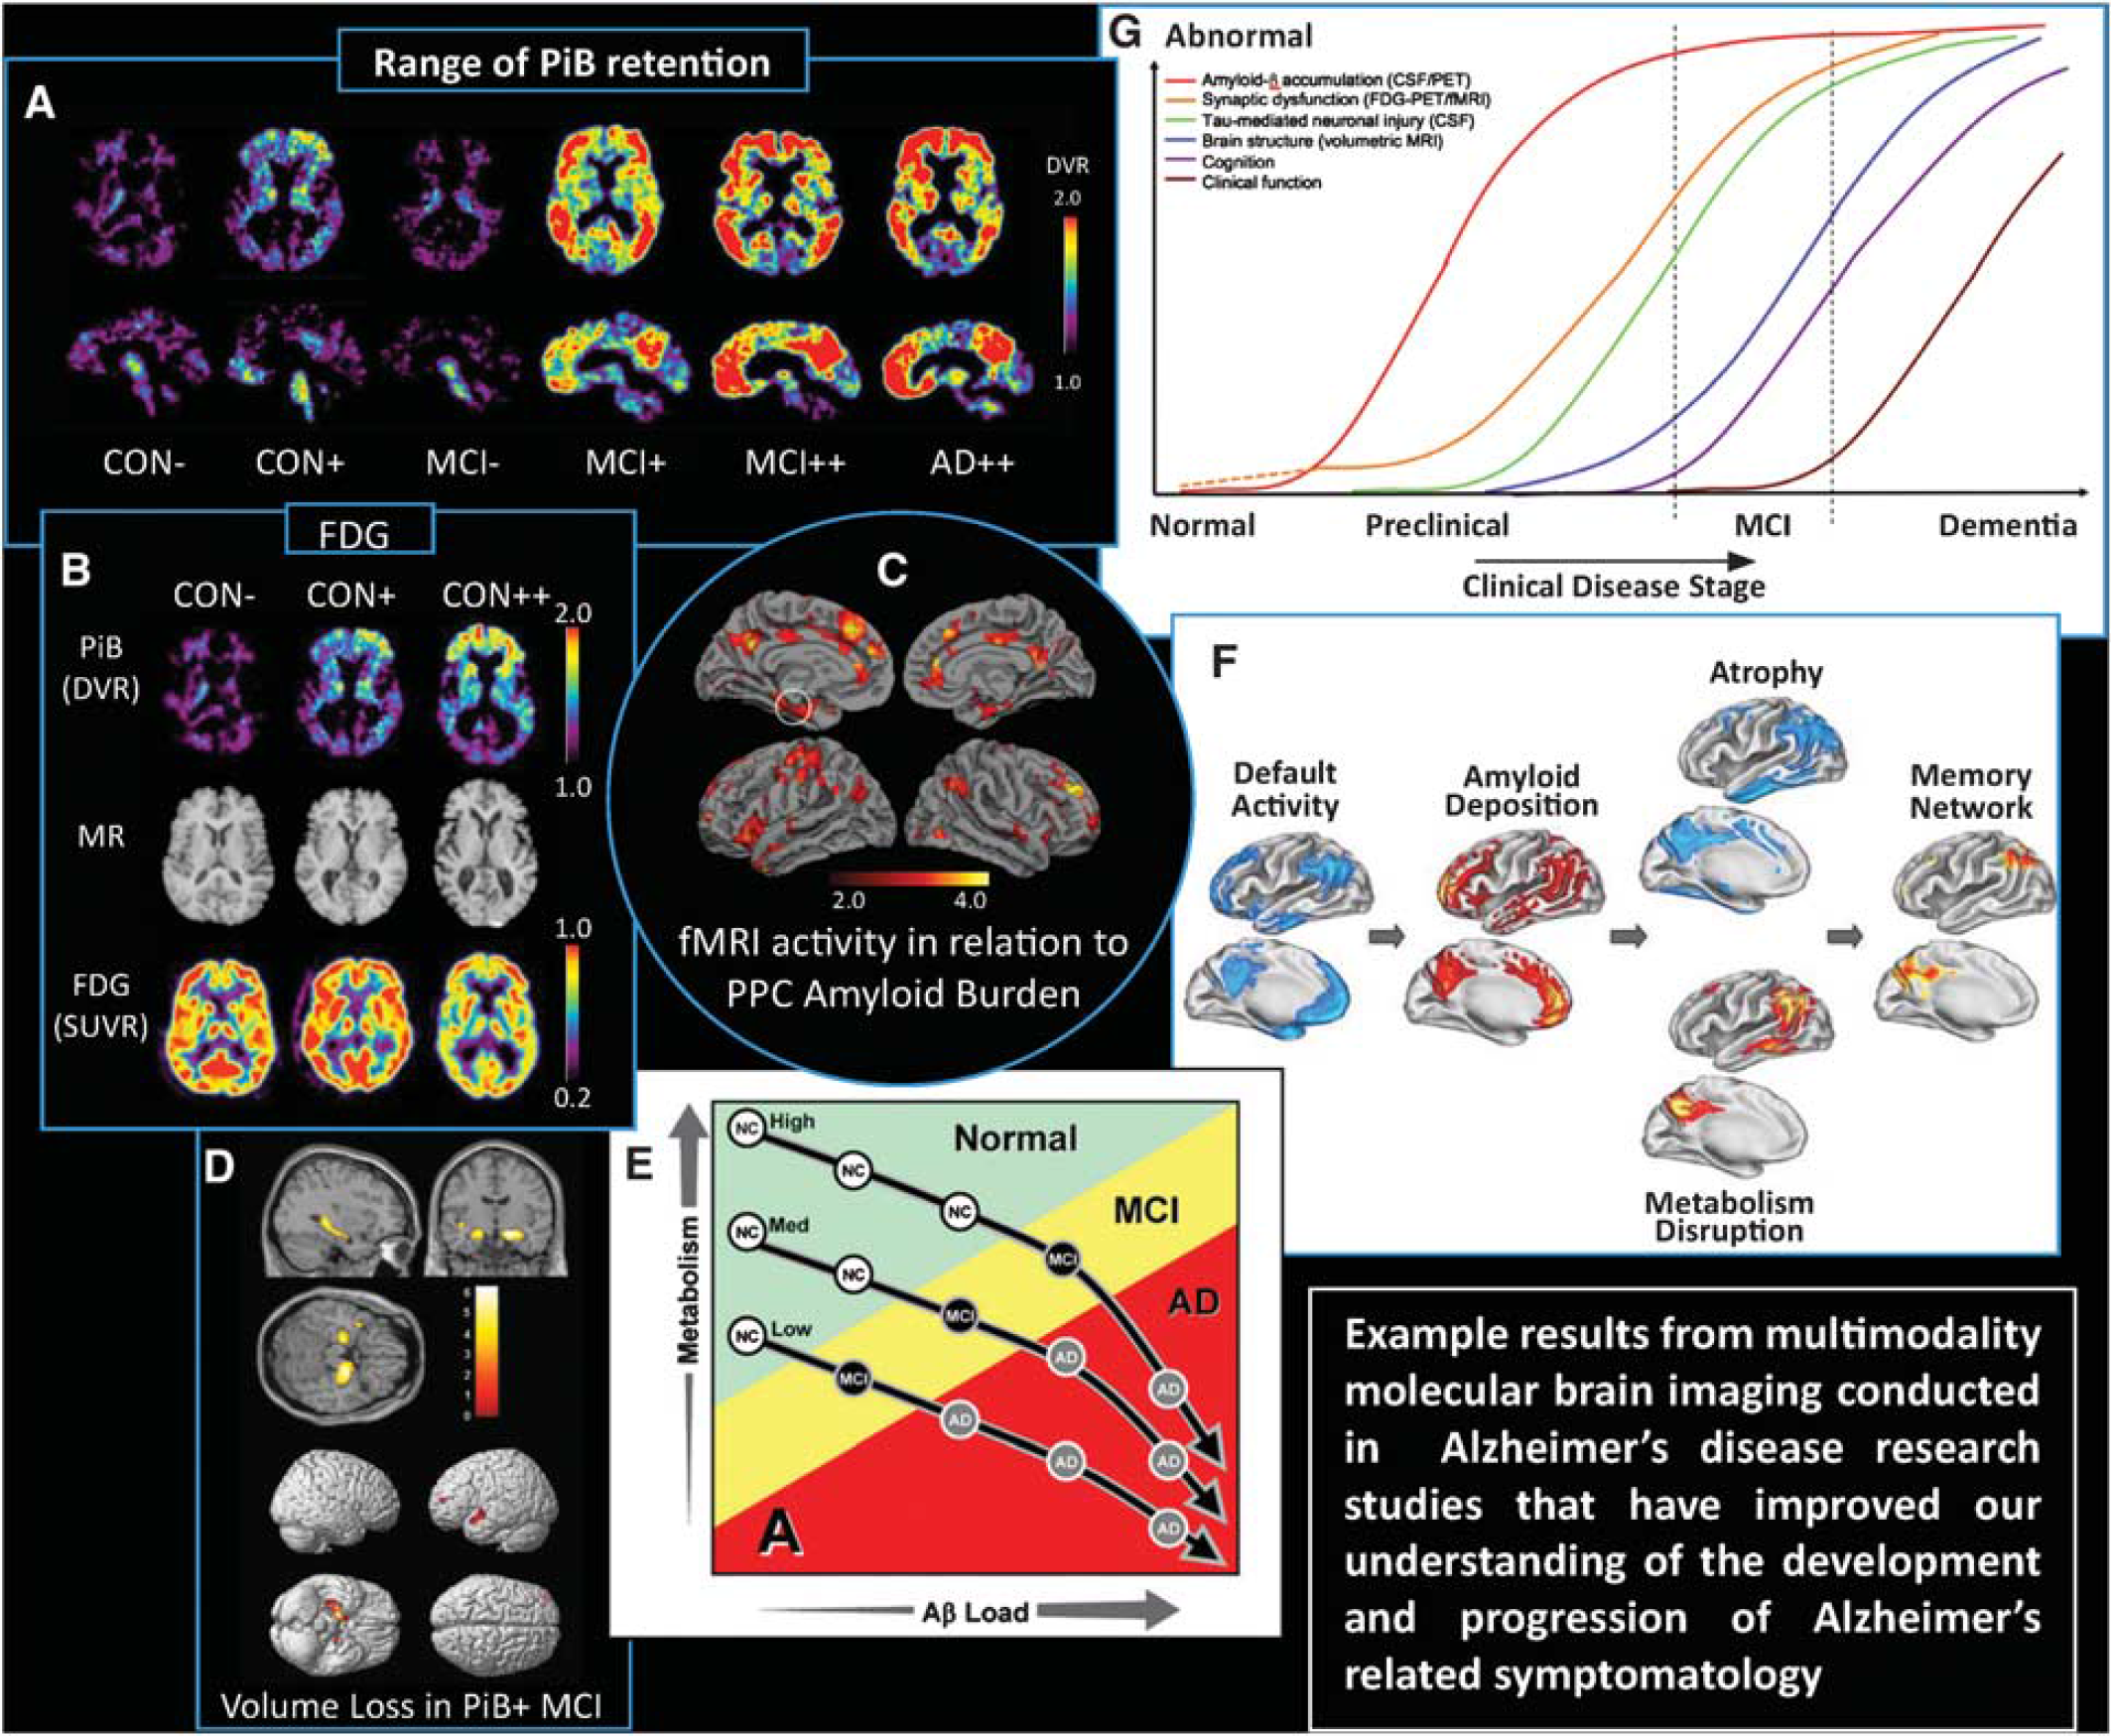
Composite figure showing examples of multimodality neuroimaging findings in Alzheimer's disease (AD)-related research that have advanced knowledge of normal aging, the natural history of amyloid deposition and the development of AD. (
A 2-year follow-up study found little progression of PiB uptake in symptomatic AD patients (Engler et al, 2006). Results emerging from this and other longitudinal studies (Villemagne et al, 2011; Weiner et al, 2010; Jack et al, 2009) are beginning to elucidate the sequence of pathological events in AD. At 20-month follow-up, Villemagne et al (2011), reported small significant increases in PiB uptake value ratios in AD and MCI groups, and in controls with high PiB retention at baseline. Lastly, PiB PET could detect posttreatment reductions in amyloid load in AD subjects who participated in a longitudinal antiamyloid therapeutic trial (Rinne et al, 2010).
Impact of Multimodality Neuroimaging on Alzheimer's Disease Hypothesis Development: Example Studies
Sperling et al (2009) noted that posterior components of the default network (i.e., precuneus and posterior cingulate (or PPC) were particularly vulnerable to early A
A recent comparison of PiB PET and structural MRI in 26 MCI patients who were amnestic (a-MCI) and nonamnestic MCI revealed a significant proportion of amyloid-positive (or A
Cohen et al (2009) explored associations of A
Buckner et al (2005) sought to better understand how cortical patterns of metabolic disruption relate to structural atrophy and MTL neuropathology in AD and to the observed correlation between A
Lastly, Jack et al (2009) submitted a hypothetical model of dynamic biomarkers of the AD pathological cascade that were based on a body of scientific research results from [11C]PiB PET, CSF A
This body of work led to a joint National Institute on Aging—Alzheimer's Association task force that established a process for revising diagnostic and research criteria for AD involving three workgroups that formulated new diagnostic criteria that incorporated biomarkers of the underlying disease state for three phases of AD (i.e., preclinical stages of AD (Sperling et al, 2011), MCI due to AD (Albert et al, 2011); and dementia due to AD (McKhann et al, 2011)). The core clinical criteria regarding AD dementia and MCI due to AD were intended to guide diagnosis in the clinical setting, while the preclinical AD recommendations were intended purely for research purposes (Jack et al, 2011). As an example, the ‘MCI due to AD’ criteria (Albert et al, 2011) listed biomarkers under investigation for AD in the order of (1) A
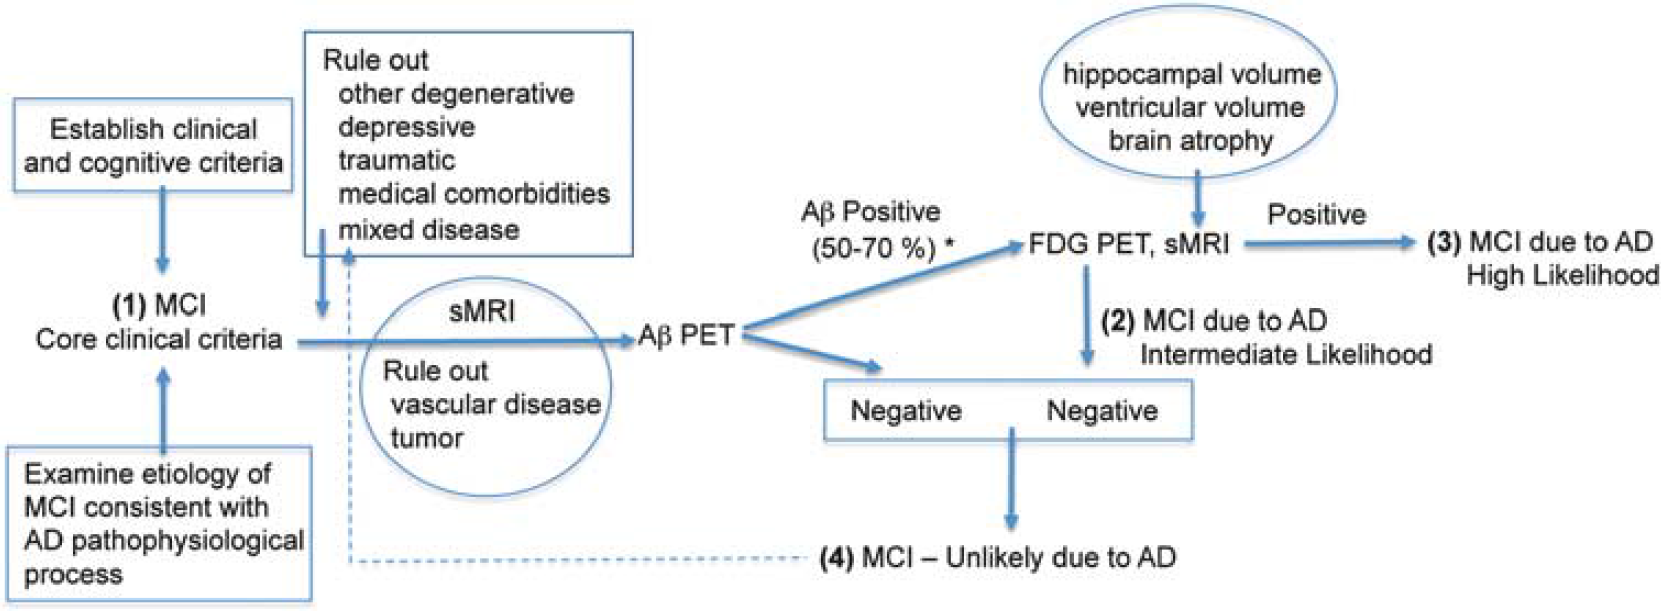
Example neuroimaging ‘decision tree’ scheme for mild cognitive impairment (MCI). This scheme was derived to be consistent with the role of neuroimaging in the list of biomarkers under investigation for Alzheimer's disease (AD) described by Albert et al (2011) in the National Institute of Aging—Alzheimer's Association workgroup criteria for MCI to AD (Albert et al, 2011, Tables 1 and 2). The final set of criteria for MCI due to AD has four levels of certainty that are depicted in the scheme. The certainties are based on the outcomes of various biomarkers that include structural magnetic resonance imaging (sMRI), positron emission tomography (PET) amyloid imaging (A
Future directions
The brain mapping field rapidly expanded with the availability of BOLD contrast fMRI methods in the 1990s and multimodality imaging became commonplace in clinical settings with the availability of the combined PET/CT scanner over the last decade. It is possible that true simultaneous PET/MRI will enable similar advances in multimodality molecular brain imaging methods, research, and clinical applications. Future directions for molecular brain imaging include the development of multimodality nanoparticle hybrids (De et al, 2011), application of hyperpolarization for MRI (i.e., to enhance the signal of nuclei, such as 13C (Viale et al, 2009)), continued development of optical contrast agents, and identification of new PET imaging targets and validation of novel radiotracers. This raises exciting new possibilities for molecular imaging in the multimodality era.
Footnotes
Acknowledgements
The author thanks all those who provided example figures or permission for figure reuse (Drs H Aizenstein, R Buckner, C Catana, A Cohen, H Herzog, C Leroy, C Meltzer, B Rosen, R Sperling, and D Wolk) and to Drs C Mathis and W Klunk for additional supportive resources. The author thanks all those who commented on this work including W Bi, Y Chen, and Dr J Mountz, and to C Matan for help with the figures. Lastly, the participation of research study volunteers and their families is gratefully acknowledged.
Disclosure/conflict of interest
The author declares no conflict of interest.