
Abstract
Impaired energy metabolism in neurons is integral to a range of neurodegenerative diseases, from Alzheimer's disease to stroke. To investigate the complex molecular changes underpinning cellular adaptation to metabolic stress, we have defined the proteomic response of the SH-SY5Y human neuroblastoma cell line after exposure to a metabolic challenge of oxygen glucose deprivation (OGD)
INTRODUCTION
Impaired energy metabolism in neurons is integral to many central nervous system diseases. An acute, intense metabolic challenge during conditions such as stroke and brain trauma can induce irreversible neuronal damage. 1 By contrast, age-related chronic metabolic impairment is thought to contribute to the evolution of neurodegenerative diseases such as Alzheimer's disease, Parkinson's disease, and Huntington's disease.2,3 Neurochemical cascades initiated by both acute and prolonged metabolic challenges can induce cell death via an elevation of proapoptotic proteins. These metabolic challenges can also activate genomic and proteomic responses promoting cell survival in the immediate phase as well as preparing the cell to deal with similar challenges in the future (conditioning). 4
Subcellular organelles display complex proteomic responses to impaired energy metabolism, with these responses ultimately determining the death or survival of the cell. In mitochondria, metabolic stress can disrupt energy generation, provoke mitochondrial swelling, and initiate apoptosis, all with potentially lethal consequences.
5
In response to cell stress, the endoplasmic reticulum (ER) detects and reconfigures misfolded proteins in a process known as the unfolded protein response (UPR). The UPR is integral to cell survival as excessive accumulation of these damaged proteins in the ER lumen can result in the suppression of protein synthesis and irreversible pathology.
6
In the nucleus and ribosomes, metabolic stress leads to a genomic response and the synthesis of proteins such as heat-shock proteins and trophic factors, which contribute to protein repair and neuronal survival.
7
The genomic response to metabolic challenge has been well characterized both
Oxygen glucose deprivation (OGD) induces metabolic stress in neurons in culture.11,12 The intensity of the metabolic challenge can be controlled by adjusting experimental conditions such as the choice of cell line and alterations in the duration of OGD. Mass spectrometry-based proteomics provides an excellent platform to quantify OGD-dependent protein changes and to gain a fresh perspective on adaptations that occur within the proteome in response to metabolic stress. 13 We have used human SH-SY5Y neuroblastoma cells and label-free liquid chromatography mass spectrometry (LC-MS) to define the integrated proteomic response to metabolic stress that induces severe mitochondrial dysfunction but only limited cell death. The majority of proteins analyzed (800 out of 1,000) were not significantly altered by OGD.
Protein increases after OGD was more than twice as frequent as was decreases, consistent with an integrated cellular survival response. Protein interactomes highlight coordinated proteomic responses after OGD in relation to mitochondrial energy production, ER stress, and ribosomal dysfunction.
MATERIALS AND METHODS
Reagents
All standard growth media used was obtained from Invitrogen (Paisley, UK), unless otherwise stated, and all procedures were conducted in compliance with all relevant legislation in the United Kingdom. Cells were routinely maintained in standard 75 cm2 cell culture-treated flasks (Greiner Bio One, Stonehouse, UK) within a continuous flow incubator at 37°C, with 5% CO2 in fully humidified air. All growth media and solutions were prewarmed to 37°C before contact with cells, unless otherwise stated. The acetonitrile and water used in the LC-MS buffer solutions were of HPLC grade (Fisher, Loughborough, UK). Formic acid was of 98% to 100% purity (Merck, Darmstadt, Germany) and trifluoroacetic acid was 99% sequencing grade (Sigma-Aldrich, Gillingham, UK). All other chemicals used in the processing of the protein samples were of reagent grade or better. The trypsin used for protein digestion was from Promega (Southampton, UK).
Cell Culture and Oxygen Glucose Deprivation
SH-SY5Y cells (ATCC, Manassas, VA, USA) were cultured in Dulbecco's Modified Eagle Medium: Nutrient Mixture F12 (DMEM/F12) supplemented with 2 mmol/L L-Glutamine, 100 U/mL Penicillin, 100 mg/mL Streptomycin, and fetal bovine serum. Cells were routinely maintained at 37°C, 5% CO2, with culture medium replaced biweekly. Oxygen glucose deprivation (for 3, 6, 9, 12, and 18 hour durations) was achieved through incubation of the cells at 37°C in 95% N2:5% CO2. Aglycemia was induced by replacing standard culture medium with glucose-free DMEM supplemented with fetal bovine serum, after a glucose-free wash step. Control cells underwent the same glucose-free wash step, followed by incubation with glucose containing media (4,500 mg/L glucose). The osmolality of the DMEM solutions used was within the range of 300 to 340 mOsm/kg for the no glucose solutions, and 320 to 360 mOsm/kg for the glucose containing media. All media were equilibrated overnight before experimentation in either normoxic or anoxic chambers. Oxygen content in the media was recorded in preliminary studies using a fiber optic dual oxygen-temperature sensing probe (OxyLite 2000 E Series, Oxford Optronix, Oxford, UK). A rapid oxygen depletion phase was recorded, with oxygen partial pressure falling exponentially from 140 to 7 mm Hg over the initial 3 hours of OGD. Oxygen depletion plateaued and remained severely hypoxic between 4 and 18 hours with a recorded average partial pressure of 2 mm Hg.
Assessment of Mitochondrial Function (MTS Assay)
Cells were seeded onto poly-D-lysine coated flat-bottomed 96-well plates at a density of 125,000 cells per well overnight. After OGD, glucose-free DMEM was replaced with 200 μL glucose-containing DMEM and cell viability was assessed using 20 μL of CellTiter 96 AQueous One Solution Cell Proliferation Assay (MTS) (Promega, Madison, USA) as per the manufacturer's guidelines. Cells were incubated for 2 hours in glucose containing, normoxic media (37°C, 5% CO2) to allow residual mitochondrial function after OGD to be assessed using a Dynex MRX plate reader (Dynex Technologies Ltd., Worthing, UK) at 490λ.
Assessment of Global Cell Death (Trypan Blue)
Trypan blue staining was carried out to assess the extent of cell death occurring after each OGD time point. Cells were collected immediately at the end of each time point by trypsinization, centrifugation (200
Preparation of Protein Samples for Liquid-Chromatography Mass Spectrometry
SH-SY5Y cells were treated with 6 hours OGD (
Liquid Chromatography Mass Spectrometry
Label-free intensity-based LC-MS was used to identify proteins differentially expressed after 6 and 18 hours OGD relative to time-matched controls. Capillary LC-MS data were acquired on an online system consisting of a micro-pump (1200 binary HPLC system, Agilent, Edinburgh, UK) coupled to a hybrid LTQ-Orbitrap XL instrument controlled through Xcalibur 2.0.7 (Thermo-Fisher). Peptides were reconstituted in 20 μL of loading buffer before injection and 8 μL was loaded. The HPLC separation was provided by a gradient between buffer A (97.5% H2O, 2.5% acetonitrile, 0.1% formic acid) and buffer B (90% acetonitrile, 10% H2O, 0.025% trifluoroacetic acid, 0.1% formic acid). The peptide mixture was separated on a 140-minute gradient. The mass spectrometer was operated in ‘data-dependent mode’, with a single MS scan (400 to 2,000
Protein Identification and Quantification
All LC-MS runs were analyzed using a label-free intensity-based approach with Progenesis (version 4.0 Nonlinear Dynamics, Newcastle, UK), under randomized conditions. The MS/MS data were searched using MASCOT versions 2.3 (Matrix Science Ltd, London, UK) against a human subset of the NCBI database (downloaded on 12 January 2011) with 34,281 sequences using a maximum missed-cut of 2. Variable methionine oxidation, STY phosphorylation, protein N-terminal acetylation, and fixed cysteine carbamidomethylation were used in all searches.
LC-MS label-free quantification was performed using Progenesis 4.0 (Nonlinear Dynamics). Protein conflict (peptides shared between different proteins) was solved as followed: conflict resulting from multiple sequence assignment to the same peak; we kept only the sequence having the highest score. Conflict resulting from same peptide sequences assigned to different proteins, the assignment was singly attributed to the protein that had the highest number of peptides. Regarding the label-free quantitation, the total number of Features (i.e., intensity signal at a given retention time and
Analysis of Protein Subcellular Localization
All 958 proteins identified by LC-MS by at least two or more peptides were uploaded to the Database for Annotation, Visualization and Integrated Discovery (DAVID) (http://david.abcc.ncifcrf.gov
15
) to determine subcellular localization based on gene ontology (GO). Protein clusters founded on subcellular localization with DAVID scores >2 were used. Proteins significantly altered (
Interactome Analysis of Proteins Altered with Oxygen Glucose Deprivation
Protein identifiers of all the proteins significantly altered after 18 hours OGD (
Subcellular Morphology with Electron Microscopy
SH-SY5Y cells were exposed to OGD using the same paradigm as the LC-MS study. Samples were collected immediately after 3, 9, and 18 hours of OGD and fixed for a minimum of 20 hours in aldehyde fixative (4% paraformaldehyde and 5% glutaradehyde in 0.08 M sodium cacodylate buffer, pH 7.2). Once fixed, cells were centrifuged at 100
The EM sections were evaluated on a JEOL CX-100 II transmission electron microscope (Tokyo, Japan). The evaluator was blinded to the treatment condition of all samples. Cells were chosen from grid squares in a predetermined pattern. Fifty cells were assessed from each treatment. For each cell, the condition of mitochondria and rough ER was assessed. Mitochondria were graded as ‘
RESULTS
Mitochondrial Function, Cell Viability, and Ultrastructure after Oxygen Glucose Deprivation
Normal mitochondrial function was significantly reduced in SH-SY5Y cells after OGD relative to time-matched control cells (
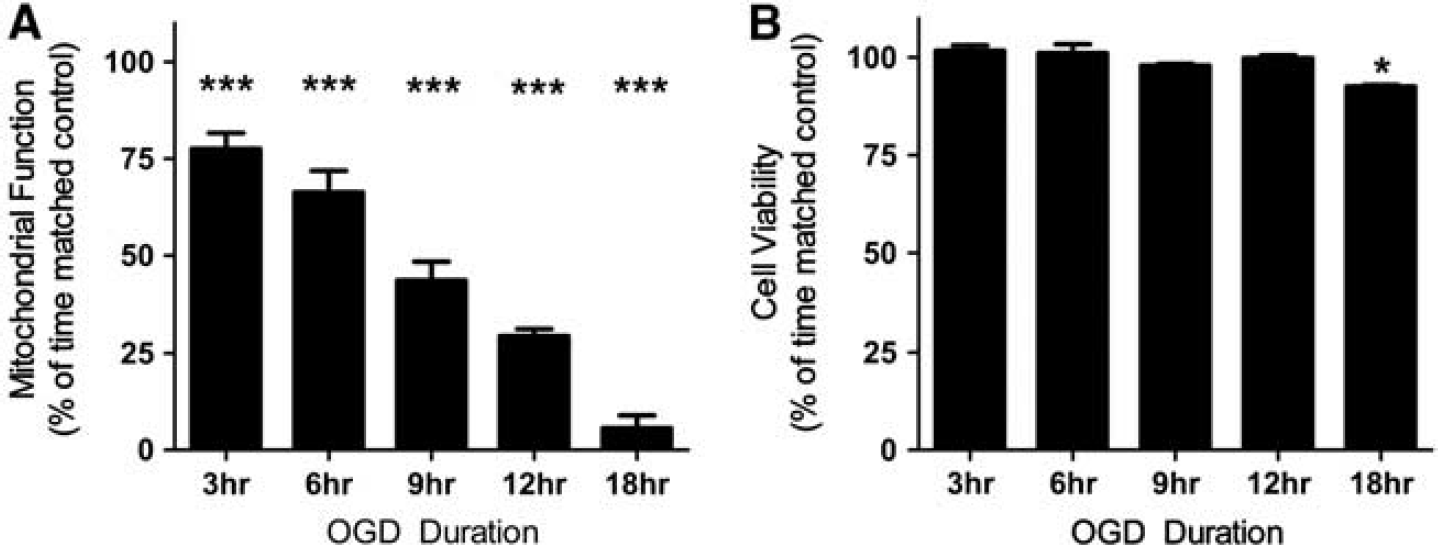
Mitochondrial function decreases after oxygen glucose deprivation (OGD), whereas cell viability is largely maintained. (
Ultrastructural morphologic changes in subcellular organelles were analyzed relative to time-matched controls by EM after OGD. With increasing OGD duration, the number of cells displaying abnormal ER was significantly increased (Chi-Square,
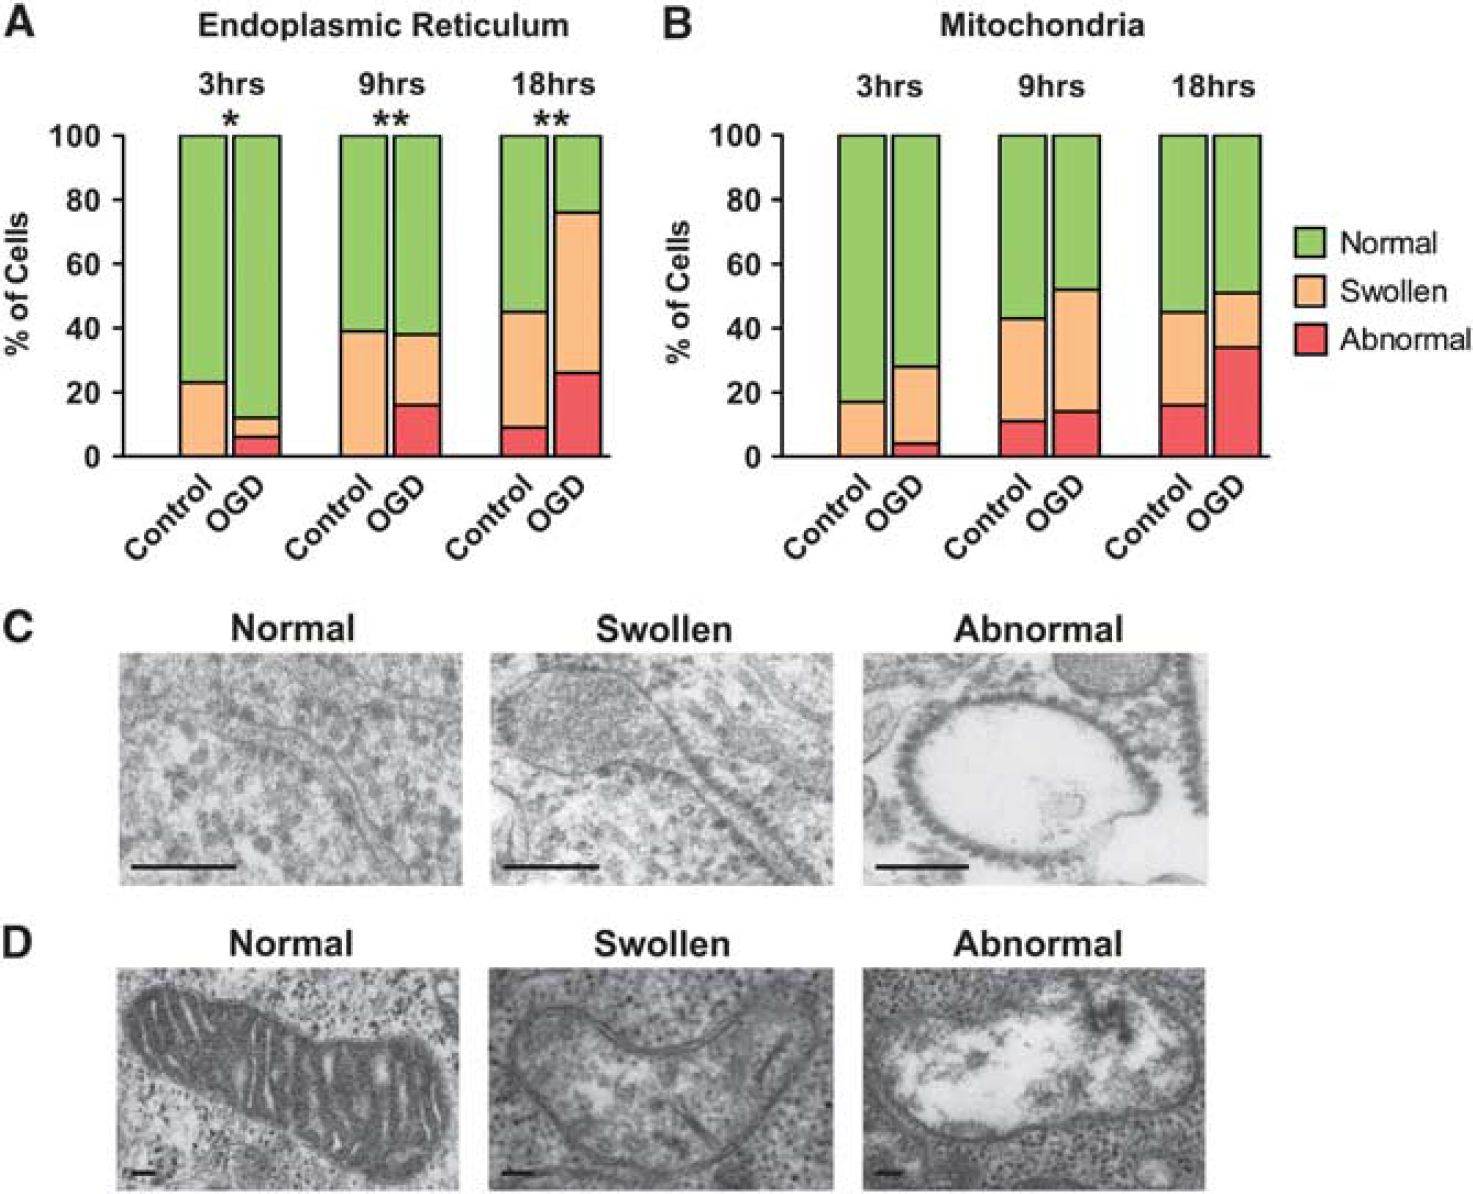
The endoplasmic reticulum (ER) and mitochondria display progressive morphologic changes after oxygen glucose deprivation (OGD). (
Global Proteomic Response after Oxygen Glucose Deprivation (6 and 18 hours)
A total of 958 proteins were identified across all samples with two or more peptides by LC-MS (Supplementary Table 1). Minimal protein changes were observed after 6 hours OGD, with only 14 proteins significantly altered in expression level (
Proteins significantly increased with OGD (18 hours)
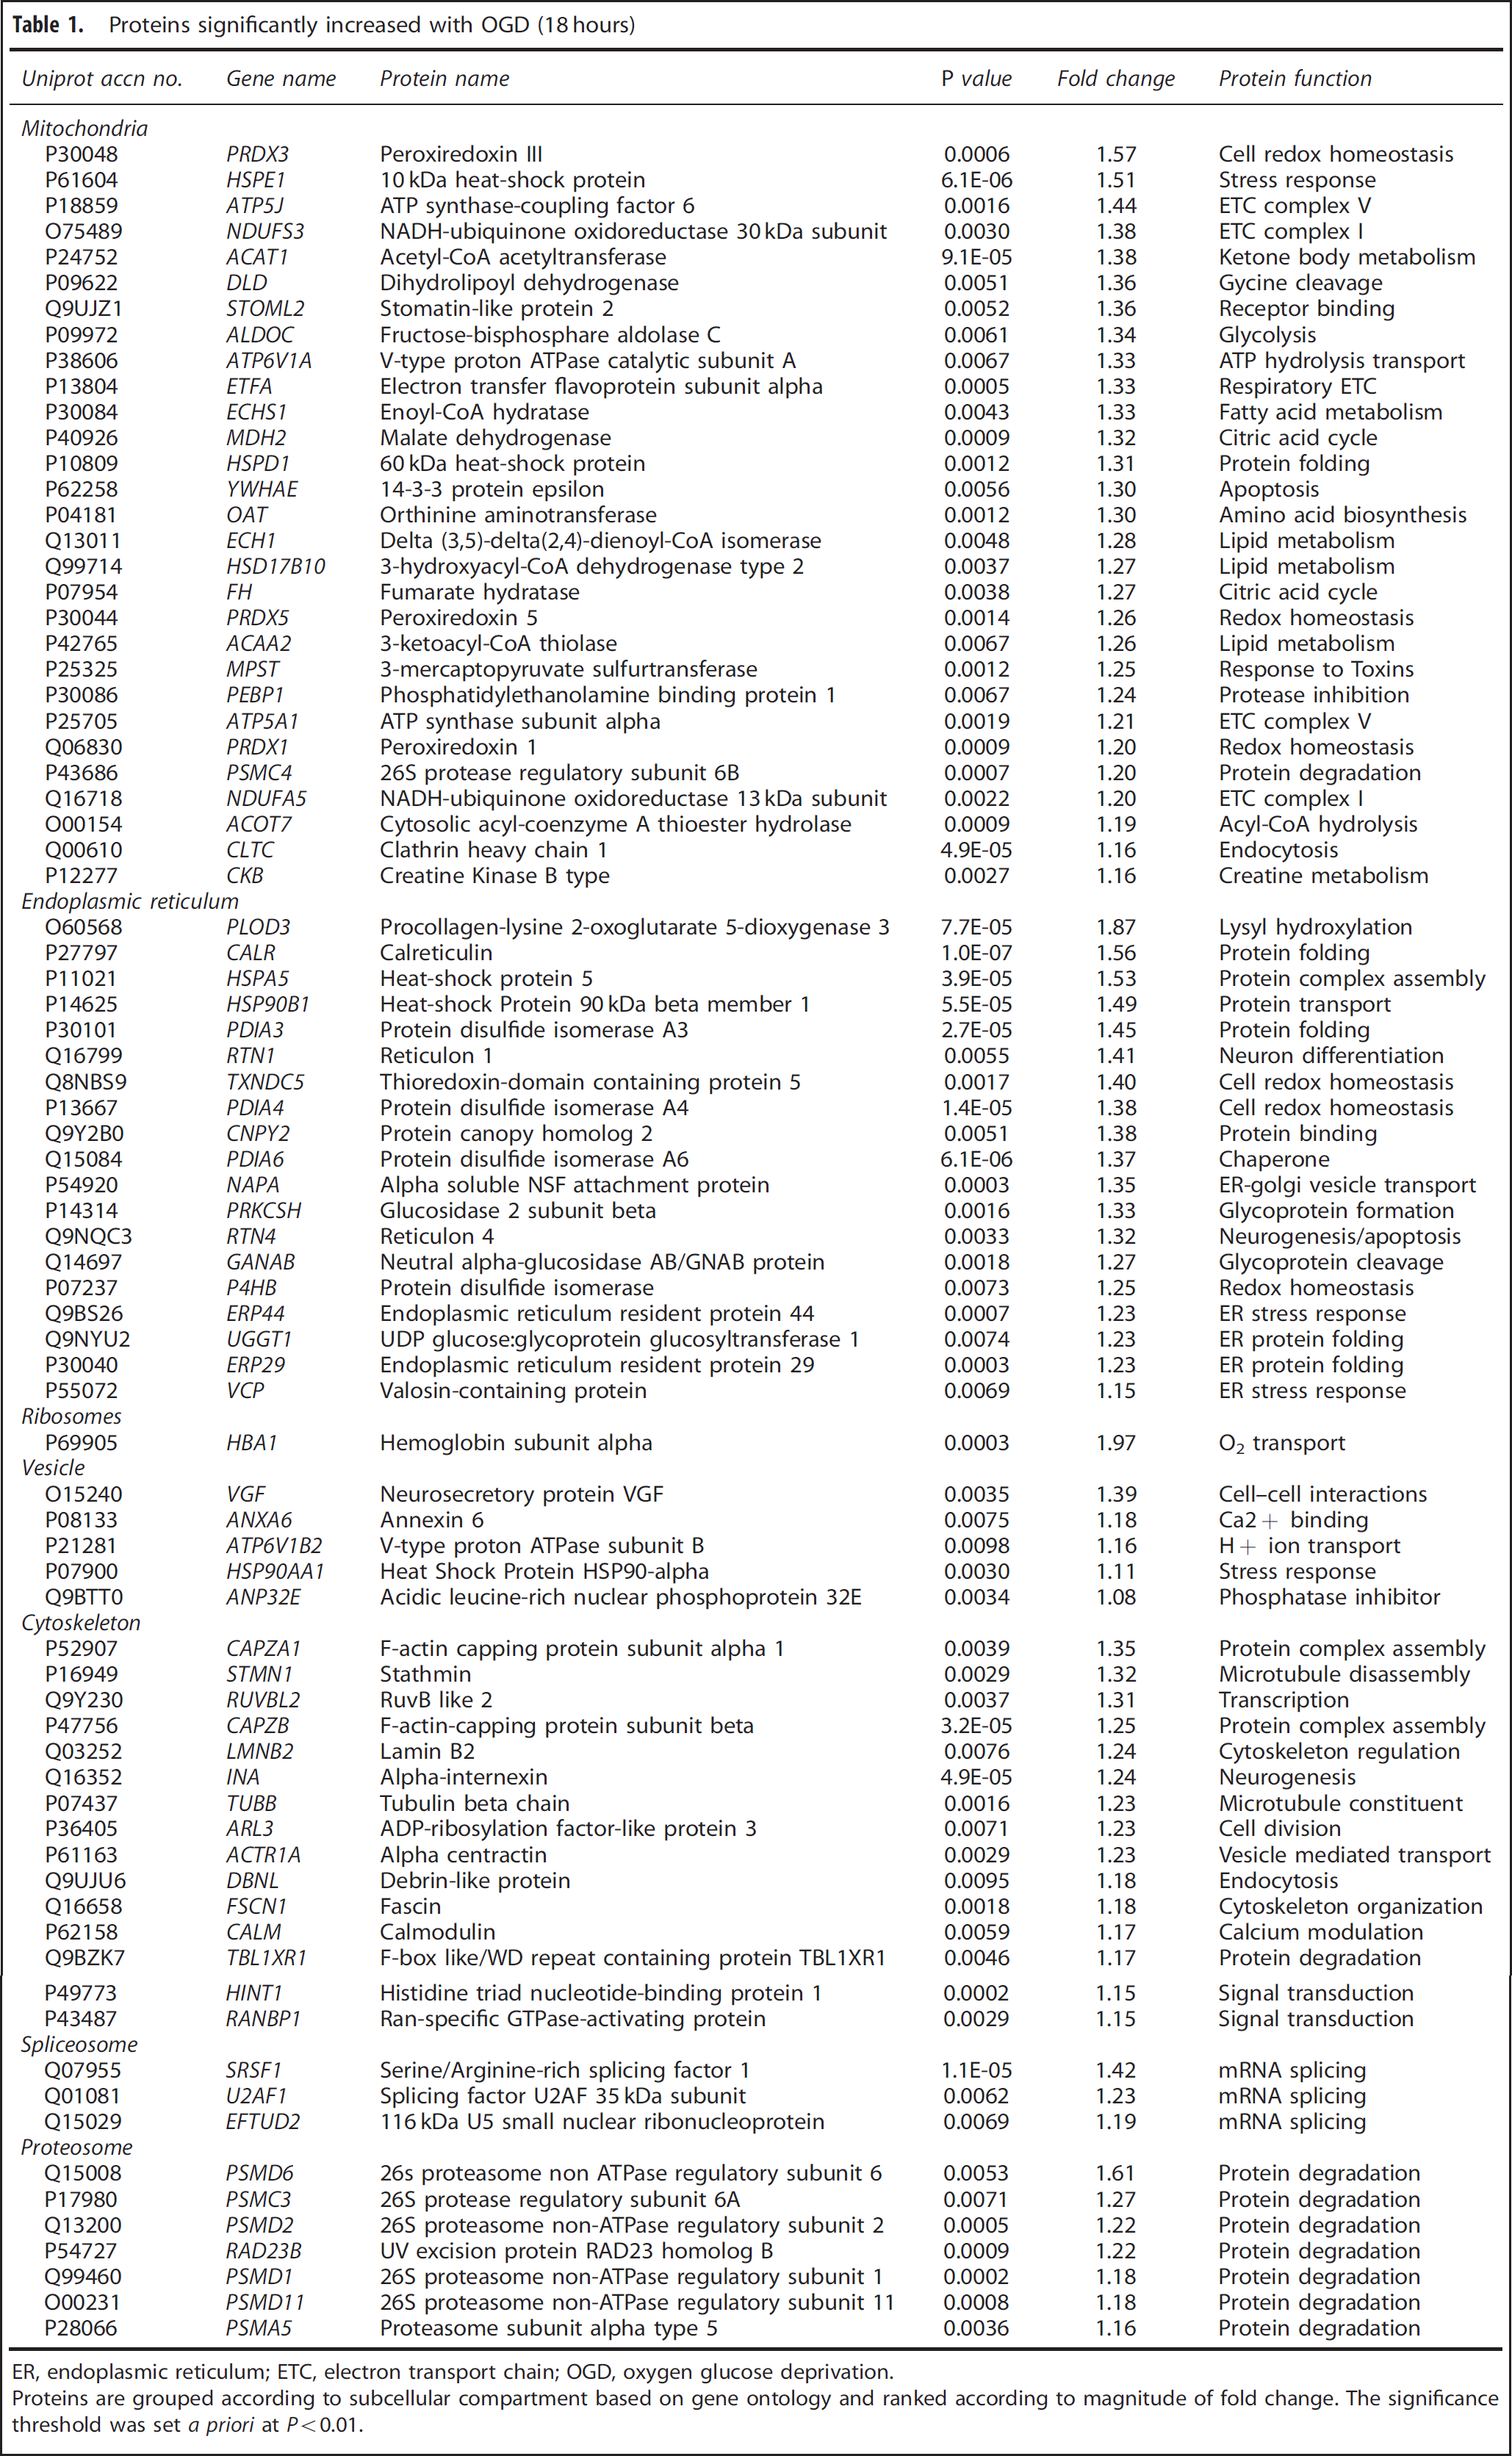
ER, endoplasmic reticulum; ETC, electron transport chain; OGD, oxygen glucose deprivation.
Proteins are grouped according to subcellular compartment based on gene ontology and ranked according to magnitude of fold change. The significance threshold was set
Subcellular distribution of all the 958 proteins identified by LC-MS was examined using DAVID software. Proteins were detected from across many subcellular compartments, including the nuclear lumen, cytoskeleton, mitochondria, ER, golgi apparatus, ribosomes, and vesicles (Figure 3A).
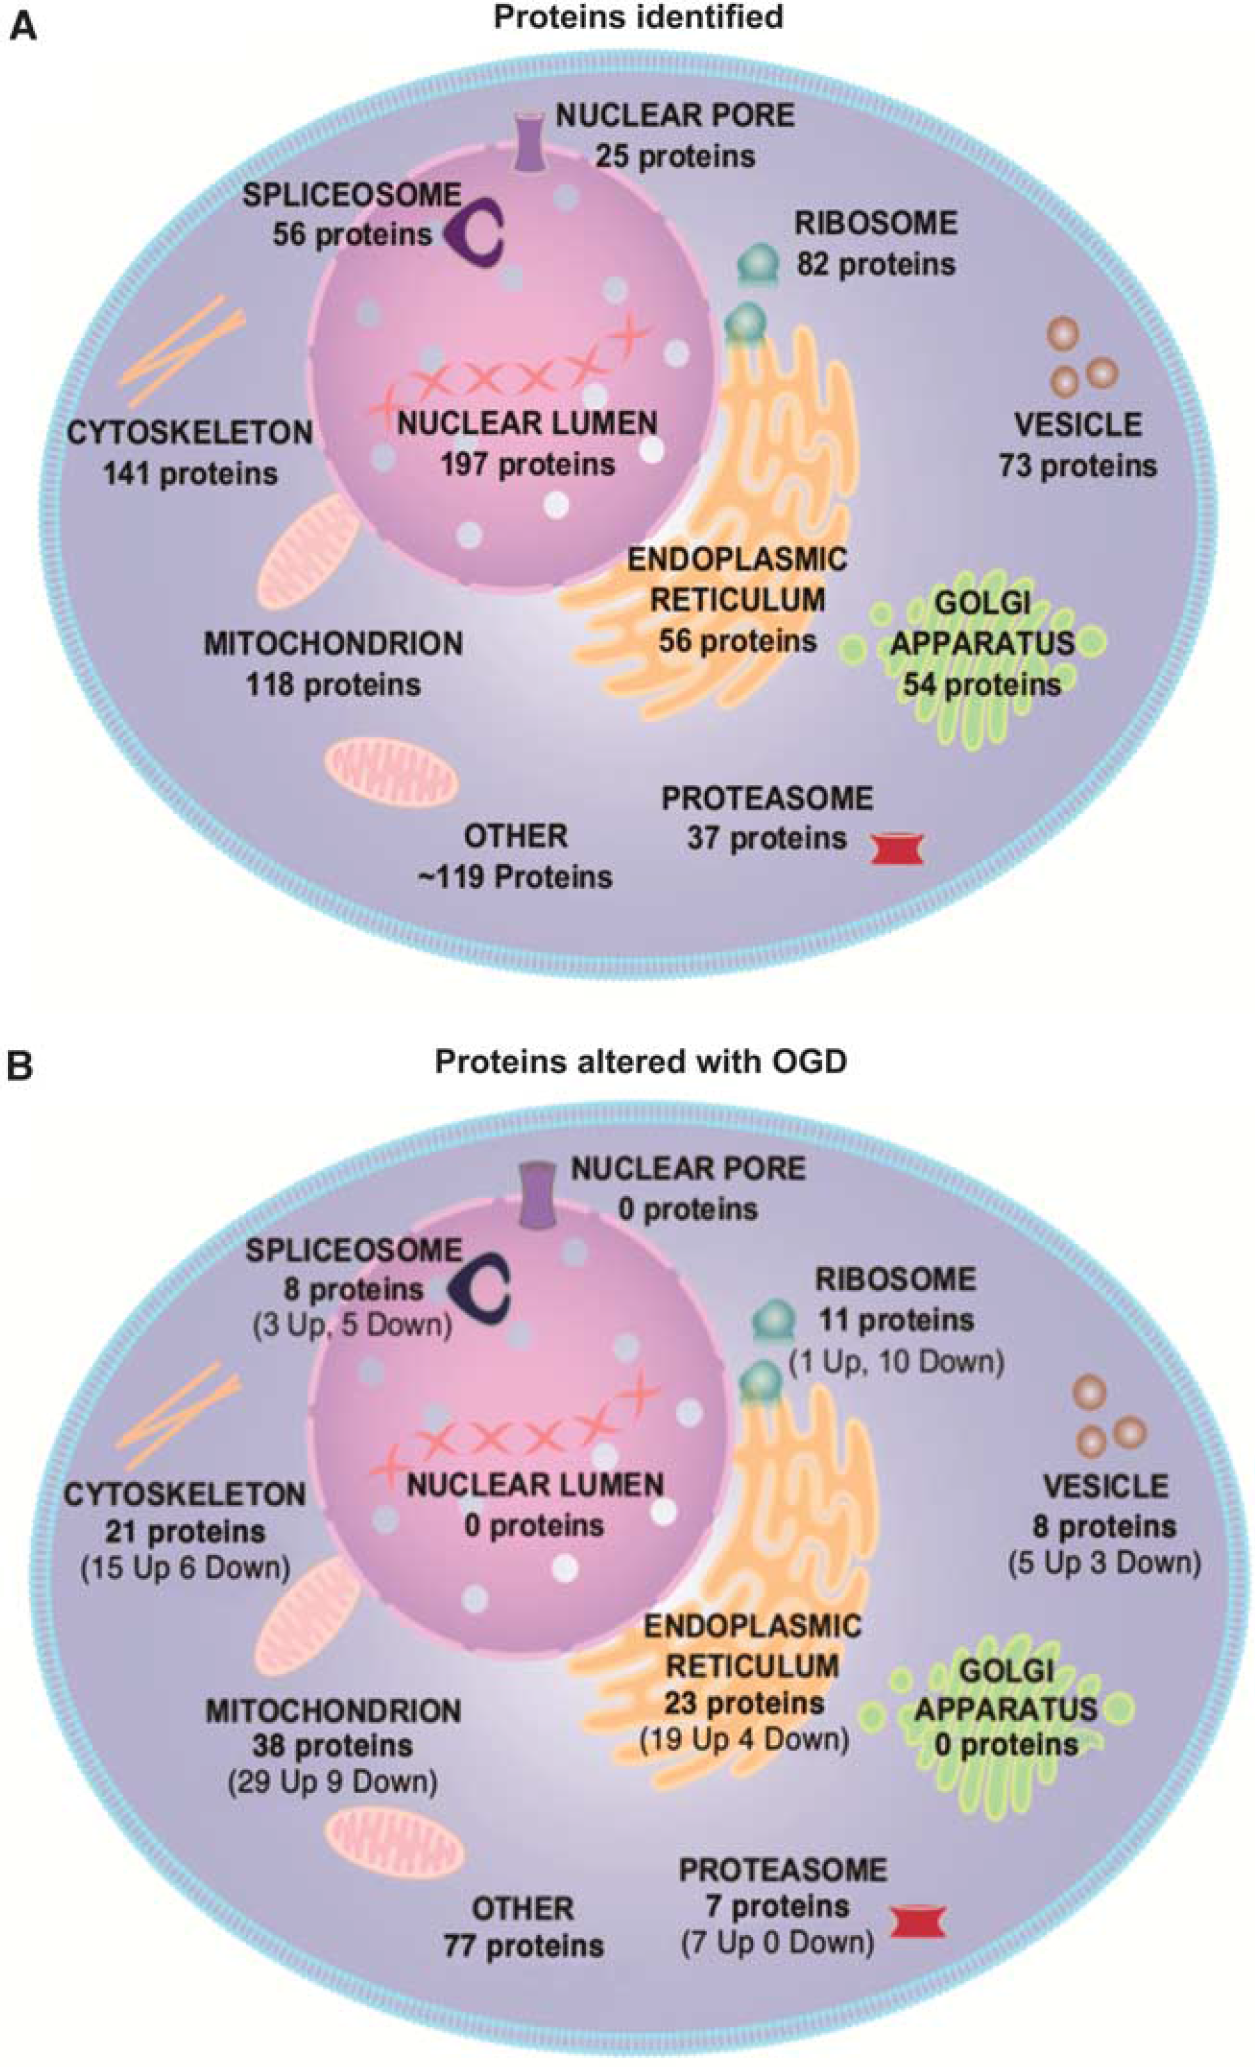
Subcellular distribution of detected proteins contrasted with subcellular distribution of proteins significantly altered after oxygen glucose deprivation (OGD). Proteins were ascribed to subcellular compartment by DAVID software based on gene ontology. Proteins were significantly altered after OGD (
The ascribed subcellular locations of the significantly altered proteins with OGD (18 hours) indicate that organelles are not uniformly affected by the metabolic challenge. None of the 197 detected nuclear lumen proteins were significantly altered after OGD, while 41% of the 56 detected ER proteins and 32% of the 118 detected mitochondrial proteins were significantly altered (Figure 3B). The significantly increased and decreased proteins after OGD (18 hours) are listed by subcellular location in Table 1 and Table 2, respectively.
Proteins Significantly Decreased with OGD (18 hours)
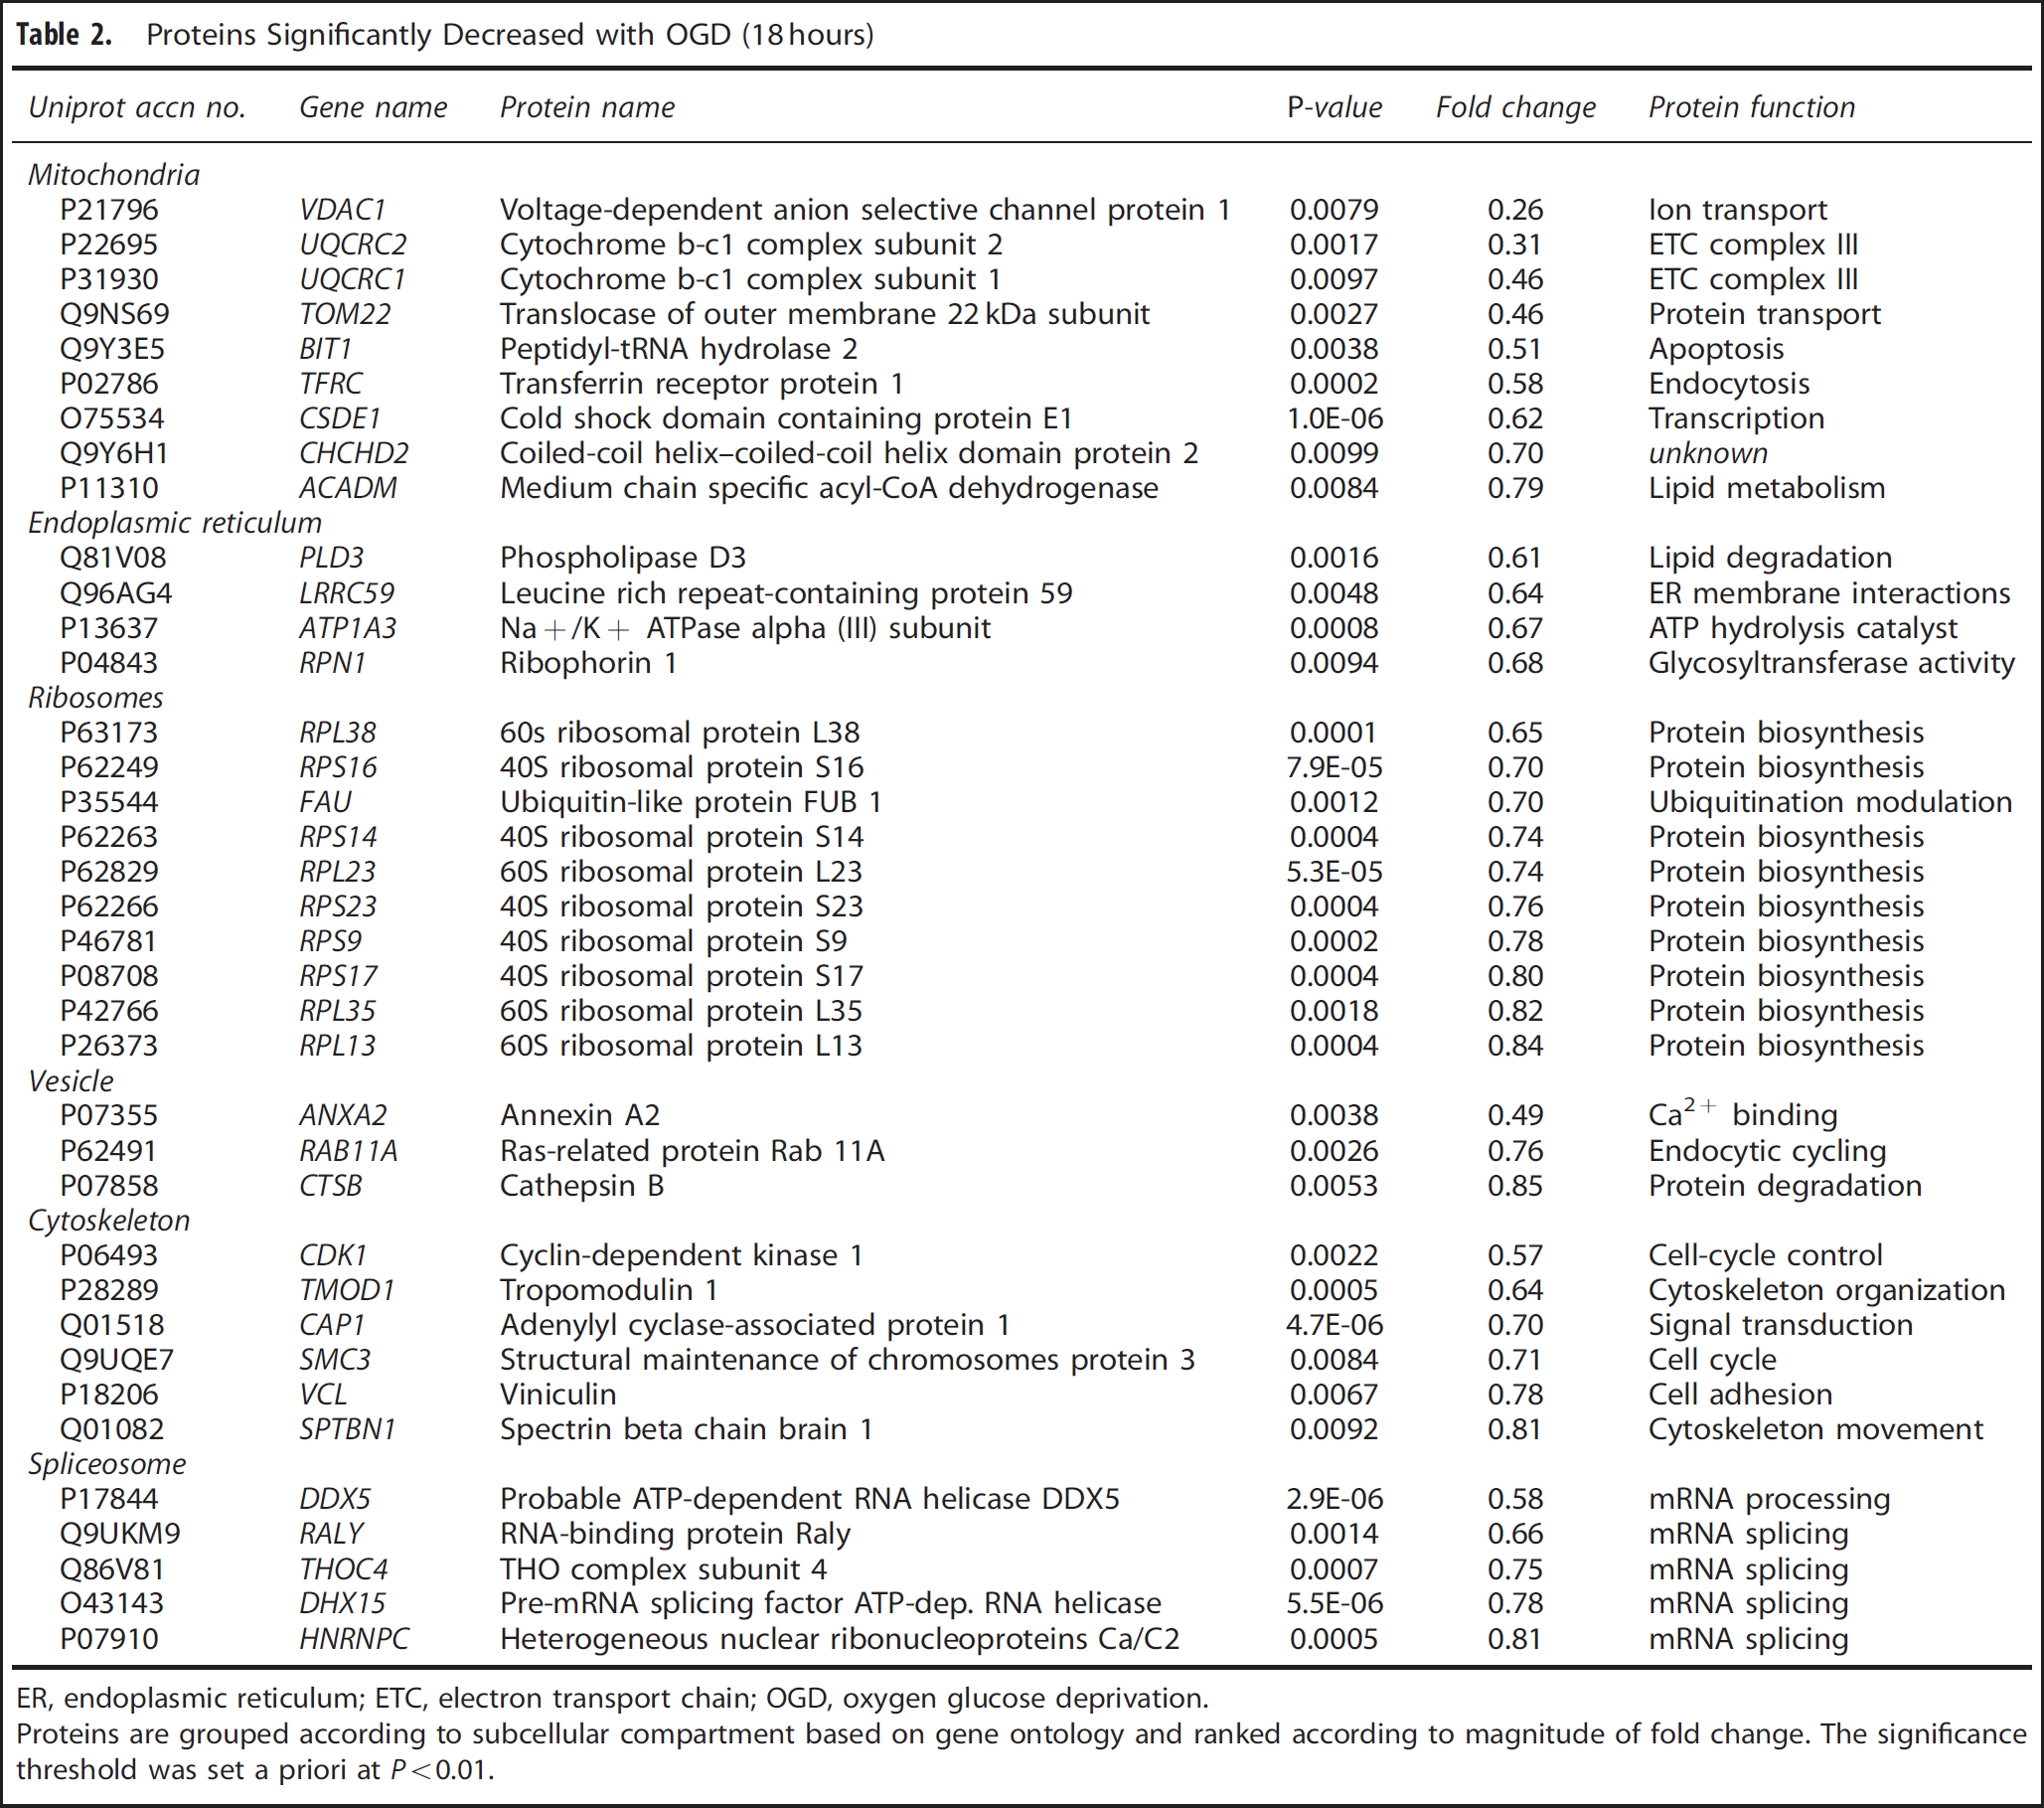
ER, endoplasmic reticulum; ETC, electron transport chain; OGD, oxygen glucose deprivation.
Proteins are grouped according to subcellular compartment based on gene ontology and ranked according to magnitude of fold change. The significance threshold was set a priori at
Functional protein–protein interactions for the 193 proteins altered with 18 hours OGD were defined using IPA software. IPA-generated 10 protein interactomes (Supplementary Table 2) and three high-scoring interactomes (IPA scores >40) are discussed in context below. These interactomes highlight a shift in mitochondrial energy production, enhanced ER stress, and ribosomal dysfunction.
Mitochondrial Protein Alterations after Oxygen Glucose Deprivation (18 hours)
In all, 38 mitochondrial proteins (out of 118 detected; assigned using the GO term
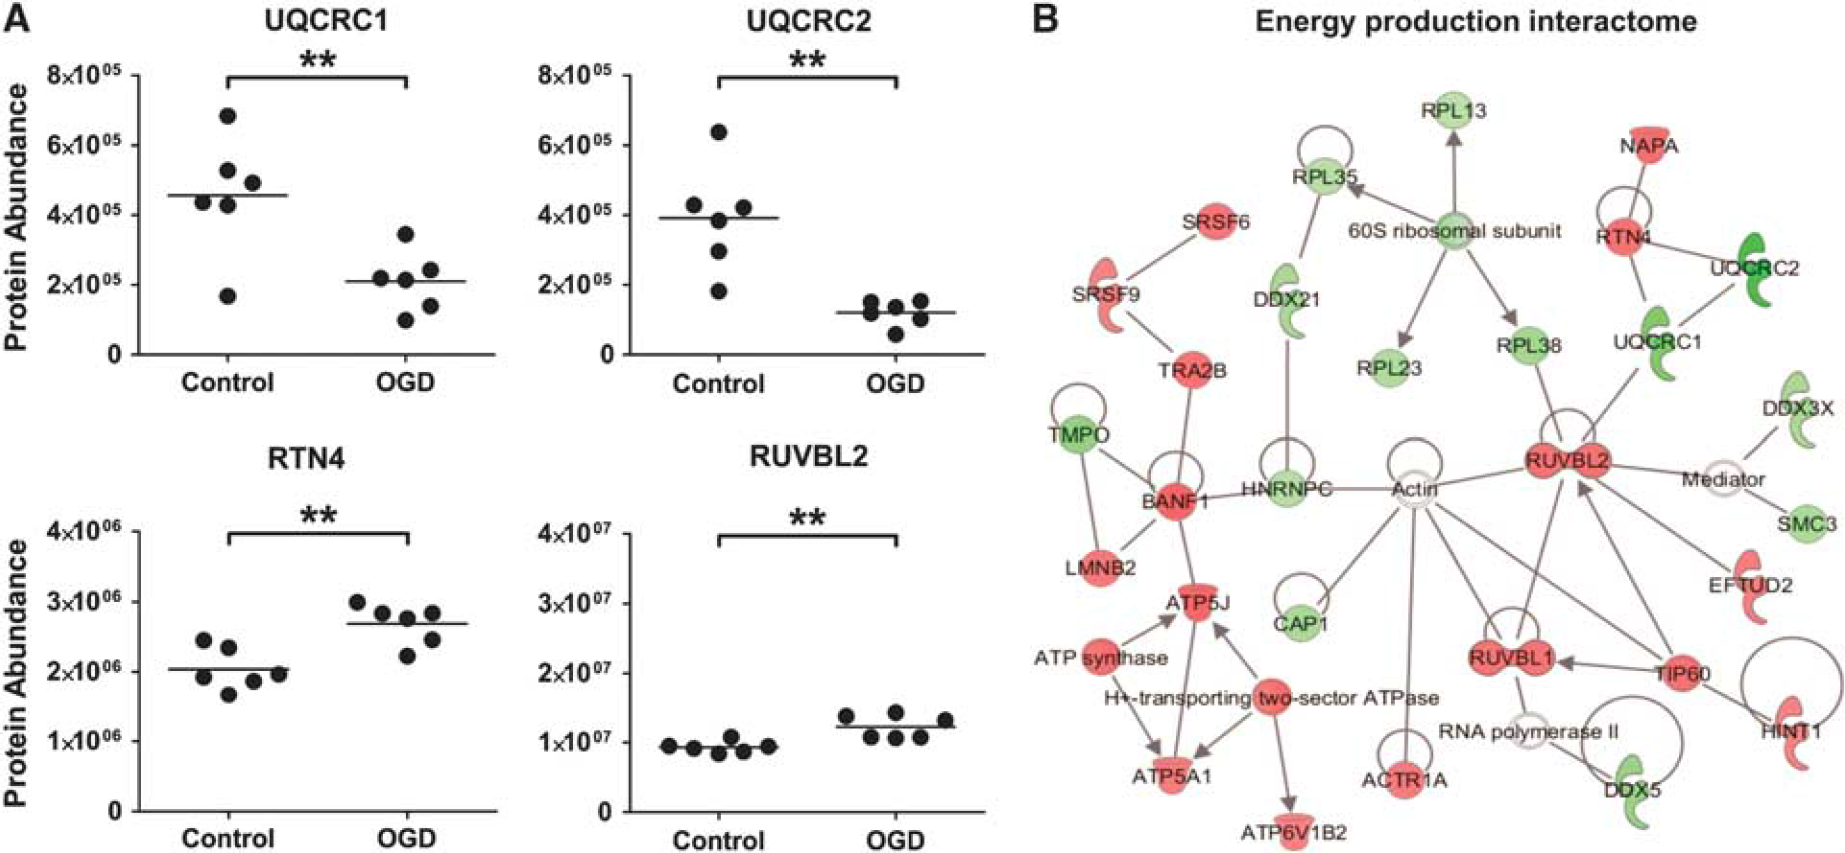
Mitochondrial energy production proteins and associated interacting partners are affected by oxygen glucose deprivation (OGD). (
Numerous mitochondrial proteins that have a role in lipid metabolism were also found to be altered after 18 hours OGD. ACADM, the enzyme involved in the first step of fatty acid beta oxidation was significantly decreased (
The highest scoring protein interactome generated by IPA features some of the alterations in energy production described above, namely increases in Complex V proteins (including ATP5J and ATP5A1) and decreases in Complex III proteins (UQCRC1 and UQCRC2) (Figure 4B). This
Endoplasmic Reticulum Protein Alterations after Oxygen Glucose Deprivation (18 hours)
In all, 23 ER proteins (out of 56 detected; assigned using the GO term
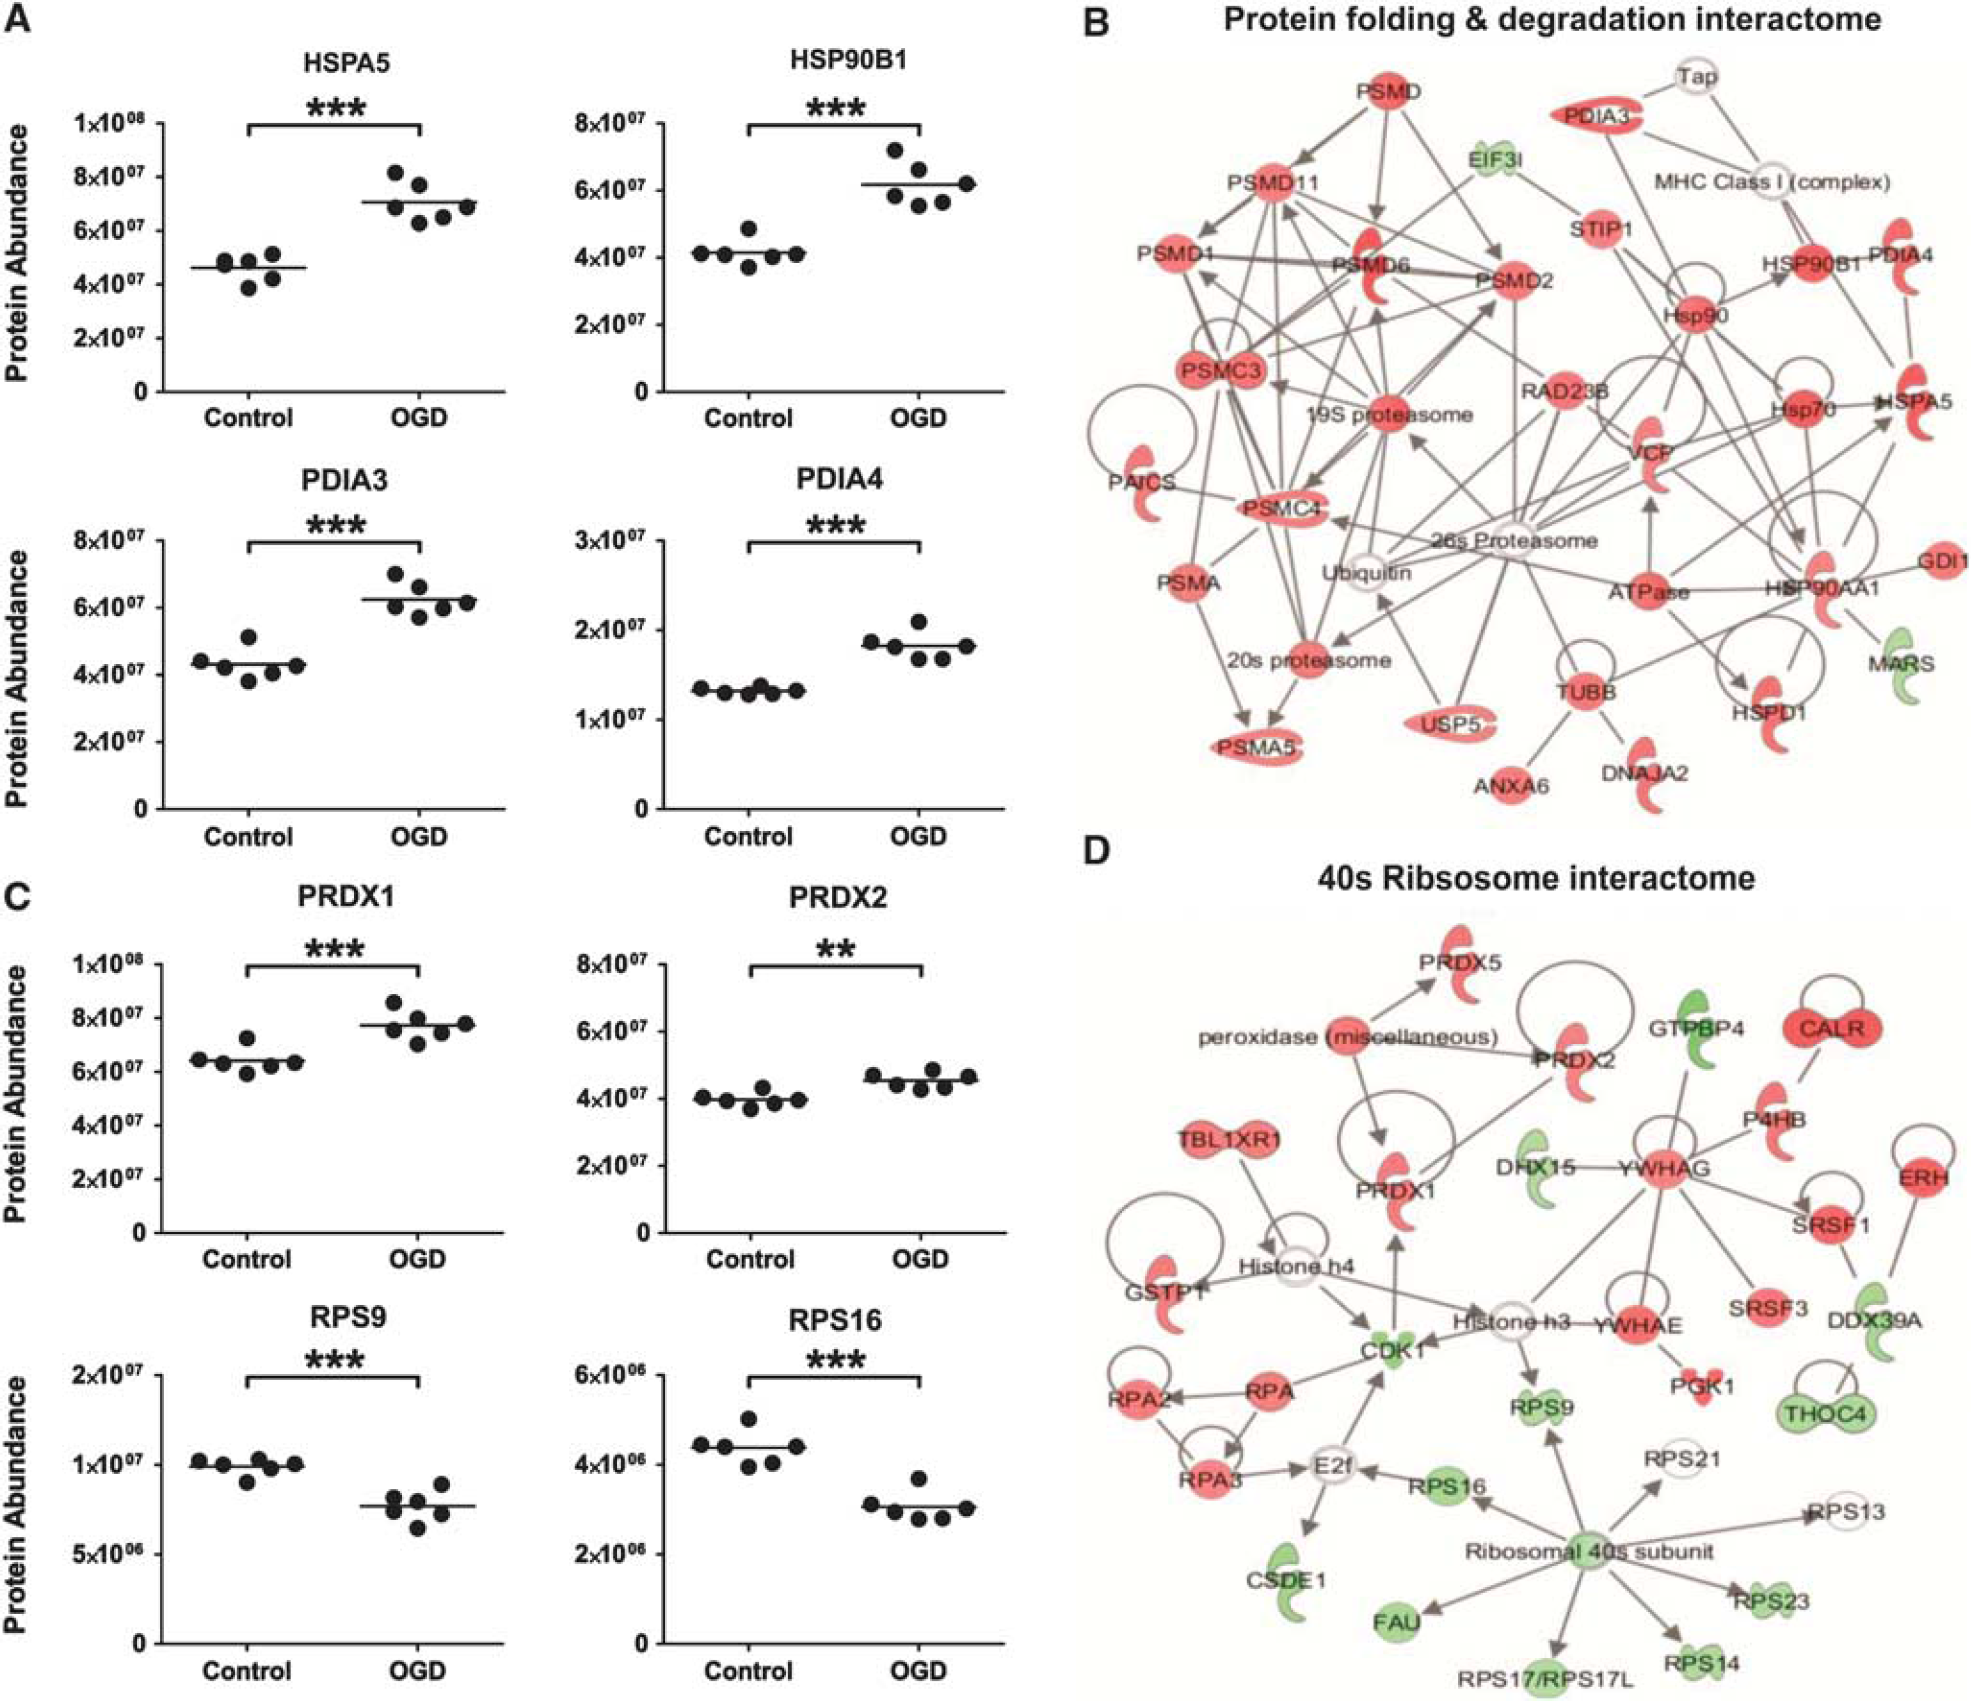
Protein production, folding, and degradation pathways are affected by oxygen glucose deprivation (OGD). (
Multiple proteins that have a role in protein degradation were significantly altered after OGD (18 hours). Protein subunits of the 20S and 19S core structures of the 26S proteasome (PSMA5, PSMC3, PSMC4, PSMD1, PSMD2, PSMD6, and PSMD11) were increased. These proteasomal proteins, along with proteins involved in the UPR and heat-shock response after OGD dominate the high scoring,
Ribosomal Protein Alterations after Oxygen Glucose Deprivation (18 hours)
In all, 11 ribosomal proteins (out of 82 detected; assigned using the GO term
DISCUSSION
This study provides the first comprehensive analysis of the proteomic and morphologic response of human SH-SY5Y cells to prolonged metabolic challenge. The robustness of SH-SY5Y cells to external stressors has allowed the evolving proteomic changes occurring in response to OGD induced metabolic stress to be defined, in the absence of cell death. The observed protein changes provide insight into the complex molecular alterations underpinning cellular adaptation to metabolic stress. The lack of acute ischemic cell death in our
Proteomics has showed alterations and interactions in mitochondrial, ER, and ribosomal proteins after OGD. The ETCproteins displayed bidirectional changes (Complex I and V proteins increased and Complex III proteins decreased) in response to OGD. Other mitochondrial proteins involved in lipid and ketone metabolism, including AD-related HSD17B10 (more commonly known as ABAD), were also increased after OGD (18 hours). The ER stress response proteins along with proteins involved in proteasomal/ubiquitination degradation also formed an important part of the upregulated proteomic response to the metabolic challenge of OGD.
A significant mitochondrial proteomic response was observed after OGD. Two of the most markedly decreased proteins after 18 hours OGD were subunits 1 and 2 (UQCRC1 and UQCRC2) of ETC complex III. Complex III is the third component of the ETC located within the inner mitochondrial membrane. Complex III mediates the transfer of electrons from ubiquinone to cytochrome C, and in doing so translocates a proton into the inner-membrane space and contributes to the generation of the electrochemical gradient used for the production of ATP.
19
Complex III is also intrinsically involved in the generation of reactive oxygen species from the mitochondria during hypoxia, and these reactive oxygen species work to stabilize HIF1α and initiate protein transcription.
20
A significant decrease in UQCRC1 and UQCRC2 might be an attempt by the cells to reduce the production of reactive oxygen species from the mitochondria under stress conditions. Interestingly, UQCRC1 has also been recorded as significantly decreased in the brains of AD patients.
21
The similar decrease in UQCRC1 expression observed in AD patients and cells
The
Mitochondrial complex I and V proteins were significantly increased in expression after OGD in sharp contrast to the reduction in complex III proteins after OGD. Complex I is the first protein complex of the ETC and initiates the transfer of electrons required for oxidative phosphorylation. The process is initiated through binding and oxidation of NADH, with the concurrent transfer of two electrons from NADH to ubiquinone, and the translocation of four protons into the intermembrane space.
24
An increase in Complex I proteins after OGD may reflect a compensatory mechanism to counteract the impact of decreased complex III proteins on energy production. Similarly, the increase in Complex V proteins may reflect a compensation for downregulated Complex III proteins or a general remodeling of the ETC, as has previously been shown in studies investigating ischemic preconditioning.
25
Functional assays of the five complexes that constitute the ETC, in ischemic conditions will need to be carried out to confirm whether such remodeling occurs. Determining the regulatory mechanisms of these protein changes could provide valuable insight that would allow therapeutic intervention to alter the course of mitochondrial dysfunction after OGD and metabolic challenges
Concurrent with the dysregulation of the oxidative phosphorylation pathway, OGD (18 hours) induced an increase in mitochondrial proteins involved in lipid and ketone metabolism. The increase in these proteins (ACAT1 in ketone metabolism, and ACADM, ECH1, HSD17B10, and ACAA2 in lipid metabolism) indicates a shift toward using lipid and ketone bodies as alternative sources of energy for SH-SY5Y cells faced with glucose restriction. The availability of such alternative energy sources is likely to be important in preventing cells hitting the point where energy provision is insufficient for cell survival, leading to a downward spiral of metabolic and cognitive decline. A recent study using a triple transgenic model of AD showed an induction of ketogenesis after a 2-deoxy-D-glucose diet was introduced. This correlated with an increase in nonamyloidogenic APP processing pathways, reduced AD pathology and reduced oxidative stress, 26 indicating a potential therapeutic role for enhanced ketone metabolism.
To use ketones as an alternative energy source in the brain, acetoacetate and β-hydroxybutyrate (the main ketone bodies used for energy) need to be synthesized from acetyl-coA. Acetyl-coA is released after beta oxidation of fatty acids, a four step process within the mitochondrial matrix requiring beta-oxidation enzymes at each stage (namely, ACAD, ECH1, HSD17B10, and ACAA2). Each of these beta-oxidation enzymes, as noted above, was significantly altered after 18 hours OGD. Of note, the third beta-oxidative enzyme HSD17B10 (ABAD) is now emerging as an important player in AD. ABAD has been shown to directly interact with Aβ in the mitochondria of AD patients and AD transgenic mouse models. Inhibition of the ABAD-Aβ interaction suppresses induced apoptosis by increasing levels of Aβ, and conversely overexpression of ABAD in transgenic mice with high levels of Aβ has been shown to cause heightened neuronal oxidative stress and memory impairments. 27 The direct involvement of ABAD in AD pathophysiology makes ABAD an interesting candidate to investigate further in terms of its upregulation upon metabolic challenge.
Pore forming proteins VDAC1 and TOM22 were significantly downregulated after OGD. VDAC1 is thought to be involved in the formation of the mPTP, which in turn allows calcium and solutes <1.5 kDa to pass across the mitochondrial membranes, resulting in osmotic swelling, loss of the mitochondrial membrane potential, and damage to the electron transport respiratory chain. 28 Mitochondrial swelling after OGD was clearly showed in the human cells under the electron microscope (Figure 2D). The role that these mitochondrial pore forming proteins have in mediating mitochondrial swelling after OGD needs to be defined to facilitate the discovery of novel pathways that might be manipulated to restore mitochondrial normality.
A major proteomic response in the ER was identified after OGD. The ER stress response (also known as the unfolded protein response, UPR) is a cellular reaction activated to clear misfolded proteins that accumulate upon ER stress, thus returning the cell to a state of proteostasis.
29
Two central molecular chaperones, HSPA5 and HSP90B1, involved in the early and late stages of the UPR respectively were upregulated after OGD in SH-SY5Y cells (as well as numerous other UPR proteins and ER stress proteins) (Figure 5A). These data are consistent with recent results from OGD in mixed primary cortical cultures where increases in both HSPA5 and HSP90B1 were detected.
30
The induction of the UPR in response to OGD was also implied in the electron microscopic data. The ER showed a progressive morphologic swelling that significantly increased after longer durations of OGD exposure compared with time-matched controls (
In accord with activation of the UPR, an upregulation of numerous proteins involved in proteasomal degradation was highlighted by the
A coordinated response after OGD (18 hours) was also observed in the ribosomal proteome. Numerous ribosomal proteins that constitute the core ribosomal machinery were downregulated, and in line with this, several eukaryotic initiation factors central to protein synthesis were also decreased. It is well established that cells undergoing severe metabolic stress experience a downregulation of protein translation, which can be reversible in more resistant brain areas, and irreversible in vulnerable regions. 36 Further work involving a recovery phase would need to be undertaken to understand whether the decrease in protein synthesis machinery is a survival mechanism to conserve energy, or whether it ultimately pushes the cells down a cell death route. The proteomic data does suggest that activation of the UPR correlates with a decrease in global protein synthesis, perhaps to deal with the accumulation of misfolded proteins. 37
Substrate deprivation both
Additional proteomic and biochemical analyses (not just LC-MS as in the present study) including protein–protein interaction assays, membrane potential recordings, and
DISCLOSURE/CONFLICT OF INTEREST
The authors declare no conflict of interest.
Footnotes
References
Supplementary Material
Please find the following supplemental material available below.
For Open Access articles published under a Creative Commons License, all supplemental material carries the same license as the article it is associated with.
For non-Open Access articles published, all supplemental material carries a non-exclusive license, and permission requests for re-use of supplemental material or any part of supplemental material shall be sent directly to the copyright owner as specified in the copyright notice associated with the article.