
Abstract
Recovery from stroke is rarely complete as humans and experimental animals typically show lingering deficits in sensory function. One explanation for limited recovery could be that rewired cortical networks do not process sensory stimuli with the same temporal precision as they normally would. To examine how well peri-infarct and more distant cortical networks process successive vibrotactile stimulations of the affected forepaw (a measure of temporal fidelity), we imaged cortical depolarizations with millisecond temporal resolution using voltage-sensitive dyes. In control mice, paired forepaw stimulations (ranging from 50 to 200 milliseconds apart) induced temporally distinct depolarizations in primary forelimb somatosensory (FLS1) cortex, and to a lesser extent in secondary FLS (FLS2) cortex. For mice imaged 3 months after stroke, the first forepaw stimulus reliably evoked a strong depolarization in the surviving region of FLS1 and FLS2 cortex. However, depolarizations to subsequent forepaw stimuli were significantly reduced or completely absent (for stimuli ≤100 milliseconds apart) in the FLS1 cortex, whereas FLS2 responses were relatively unaffected. Our data reveal that stroke induces long-lasting impairments in how well the rewired FLS1 cortex processes temporal aspects of sensory stimuli. Future therapies directed at enhancing the temporal fidelity of cortical circuits may be necessary for achieving full recovery of sensory functions.
INTRODUCTION
Accurate perceptions of tactile stimuli require our somatosensory system to detect and encode stimulus features that are separated in both space and time.1,2 For example, haptic sensing of flutter or grooved surfaces triggers volleys of afferent sensory impulses 3 that are relayed to the primary and secondary somatosensory cortex. In the cortex, populations of neurons fire synchronously with relatively sharp temporal precision to maintain and convey fine aspects of the tactile stimulus. 1 For most of us, we take these sensory abilities for granted. However, it has been estimated that at least 50% of stroke survivors have impaired tactile sensation that shows some, albeit limited recovery.4–6 Consistent with clinical research, a number of animal studies have found incomplete recovery of sensory-related functions after the induction of stroke using middle cerebral artery occlusion,7,8 endothelin injection,9,10 or photothrombosis.11,12
Thus far, most experimental studies examining recovery of sensory function after stroke have focused on spatial aspects of brain activation after stroke. For example, imaging studies have shown that cortical stroke leads to a reduction in cortical responsiveness to sensory stimuli (at 7 days recovery) that progressively recovers and re-emerges in peri-infarct regions over several weeks time.13–15 In parallel with the reorganization of peri-infarct cortex, brain regions more distant but functionally related to the site that was damaged, also show changes in activation patterns.16–20 Collectively, these findings suggest that sensory deficits and their spontaneous recovery correlate with new patterns of functional brain activation in the damaged and undamaged hemisphere. Unfortunately though, the majority of previous imaging studies did not or could not adequately assess cortical responsiveness on millisecond timescale. In the present study, we hypothesized that stroke leads to long-lasting impairments in how well populations of somatosensory cortical neurons process temporal aspects of sensory stimuli. To test this hypothesis, we used in vivo voltage-sensitive dye (VSD) imaging to optically record sensory-evoked depolarizations in the somatosensory cortex of mice subjected to unilateral ischemic stroke. Voltage-sensitive dye imaging is a useful tool for addressing such questions because it offers millisecond temporal resolution of sensory evoked depolarizations over a large region of cortex.21,22 Furthermore, because the signal to noise ratio of this imaging technique is quite good relative to intrinsic signal optical imaging, functional magnetic resonance imaging, or surface electroencephalography (EEG) electrodes, one can examine cortical response patterns with relatively few stimulus trials. Our data show that although sensory-evoked cortical responsiveness had clearly returned to the peri-infarct region 3 months after stroke, there remain significant deficits in the temporal processing of sensory information.
MATERIALS AND METHODS
Animals
Two- to three-month-old C57BL/6 mice expressing green or yellow fluorescent protein (GFP-M or YFP-H line) were used in this study. 23 Data from 2 control and 4 stroke-recovered mice (out of 18 mice in total) were also used in a recently published study. 12 However, this recent study did not present any data regarding the temporal fidelity of sensory responses to paired forepaw stimuli. Mice were group housed in standard laboratory cages in a temperature-controlled room (23 °C) set on a 12-hour light/dark cycle, and provided standard mouse diet and water ad libitum. All the experiments were approved by the University of Victoria's Animal Care Committee and adhered to the guidelines set by the Canadian Council for Animal Care and ARRIVE (Animal Research: Reporting In Vivo Experiments).
Induction of Photothrombotic Stroke
A surgical plane of anesthesia was achieved using 1.5% isoflurane gas mixed with oxygen. Mice were placed into a custom-built stereotaxic frame where body temperature was maintained at 37°C. The skull overlying the primary forelimb somatosensory (FLS1) cortex was then carefully thinned with a high-speed dental drill. As described previously, 24 the right FLS1 cortex was identified and mapped onto the cortical surface using transcranial intrinsic signal optical imaging. Photothrombotic stroke was then targeted specifically to the FLS1 cortex by illuminating the surface vessels with a collimated green laser beam for 15 minutes after injecting 1% Rose Bengal dye (110 mg/kg, intraperitoneally) dissolved in 0.9% saline. 25 Sham stroke control mice were exposed to either the laser or rose Bengal dye but not both. Mice were allowed to recover after surgery under a heating lamp and then returned to their home cages.
Voltage-Sensitive Dye Imaging
Three months after the induction of stroke, mice were anaesthetized with 1 to 1.5% isoflurane, fitted into a custom-built stereotaxic frame where body temperature was maintained at 37°C. To prevent any movement during imaging, the skull was secured to a metal plate using cyanoacrylate glue and dental cement, which was fastened to the surgery stage. Mice were administered 0.15 mL of 20 mmol/L glucose dissolved in water every 2 hours to maintain proper hydration and glucose levels. A large (~5 × 5 mm) region of the skull and dura overlying the right cerebral hemisphere was drilled and carefully removed. The exposed cortex was then bathed in RH1692 dye 26 dissolved in HEPES-buffered ACSF for 75 to 90 minutes (1 mg/mL passed through 0.22 μm syringe filter). After staining, the cortical surface was extensively washed, covered with 1.3% low-melt agarose dissolved in a HEPES-buffered ACSF and sealed with a glass cover slip. The surgery stage was then mounted underneath an upright Olympus (Tokyo, Japan) BX51 microscope for imaging.
For VSD imaging, 12-bit image frames (184 × 124 pixels) were captured every 4 milliseconds using a MiCAM02 camera (SciMedia, Costa Mesa, CA, USA). RH-1692 dye was excited with Luxeon K2 red LED (627 nm, ~20 mW at back aperture, Phillips Lumileds Lighting Co, San Jose, CA, USA) that was passed through a Cy5 filter cube (exciter: 605 to 650 nm, emitter: 670 to 720 nm). Red light was focused 200 to 300 μm below the cortical surface using an Olympus XFluor 2 × objective (NA = 0.14). The forepaw was mechanically stimulated by gluing a pencil lead to the left forepaw, which was connected to a piezoelectric wafer (Q220-AY-203YB, Piezo Systems, Woburn, MA, USA; ~300 μm deflection). Auditory evoked cortical depolarizations were eliminated by occluding both ears with low-melt agarose and Vasoline. For each trial, images were collected 250 milliseconds before a single or paired deflection of the forepaw and then 550 milliseconds afterwards. To correct for dye bleaching, stimulation trials were divided by null stimulation trials. This process was repeated 12 times for each condition with a 10-second interval between each stimulation. To examine temporal aspects of sensory processing, paired forepaw stimuli were delivered 50, 75, 100, 125, 150 and 200 milliseconds apart. These parameters were chosen based on previous electrophysiological studies examining frequency-dependent cortical responses to sensory stimuli,27,28 as well as pilot imaging experiments where control mice showed paired responses to inter-stimulus intervals (ISIs) greater than 75 to 100 milliseconds, but not typically at shorter intervals. Cortical depolarizations are expressed as the percent change in VSD fluorescence (DF/Fo) relative to prestimulation fluorescence (100 milliseconds before stimulation). Montages of cortical responses were generated by mean filtering DF/Fo image stacks (radius = 2) and then binning two 4 milliseconds frames in time.
Data Analysis
For quantification of infarct volume, 50 μm thick coronal brain sections were cut with a vibratome, mounted onto charged glass slides and stained with cresyl violet. Sections were imaged under brightfield illumination and quantified using Image J software (version 1.44, NIH, Bethesda, MD, USA). The area of infarction was measured in each section by a masked observer, and an estimate of volume was calculated by summing up the infarct area for each section multiplied by the distance between each section.
Forelimb-evoked depolarizations were analyzed from DF/Fo image stacks using Image J software. Responses in FLS1 and secondary FLS (FLS2) cortex were quantified within a 400-μm diameter circular region of interest. For stroke-recovered mice, the FLS1 cortex was defined as the remaining area of FLS1 cortex that showed the shortest latency to respond. The peak amplitude, time to peak amplitude, and half-width (i.e., duration) of forelimb-evoked signals in the first 120-milliseconds after stimulation were measured with Clampfit 9.0 software (Molecular Devices, Sunnyvale, CA, USA). To generate a ‘tuning’ curve for the percentage of mice in each group that showed a significant cortical depolarization to the second forepaw stimulus, we first measured ‘noise’ levels by calculating the standard deviation of ΔF/Fo values 100 milliseconds before the first forepaw stimulation. In order for a cortical depolarization to the second forepaw stimulus to be classified as significant or not, the peak amplitude of the second depolarization had to be 2.5 s.d. above noise levels. Using this criterion meant that there was only a 1 in 81 (or 1.23%) possibility of obtaining a significant cortical depolarization by chance alone. Paired pulse ratios were generated by dividing the peak ΔF/Fo cortical response to the second forepaw stimulus divided by the peak ΔF/Fo associated with the first stimulus. Data are expressed as means ± s.e.m.
Statistics
Student's t-tests were used to analyze group differences in peak amplitudes, time to peak, and half-width of cortical depolarizations. A χ 2 analysis was used to test the hypothesis that the temporal fidelity of cortical responses to successive forepaw stimulations is impaired after stroke (see Figure 4). This statistic was selected because of the binomial nature of our data, that is, cortical depolarizations to the second forepaw stimulation in each mouse were scored as either above or below background noise levels. P ≤ 0.05 were considered statistically significant.
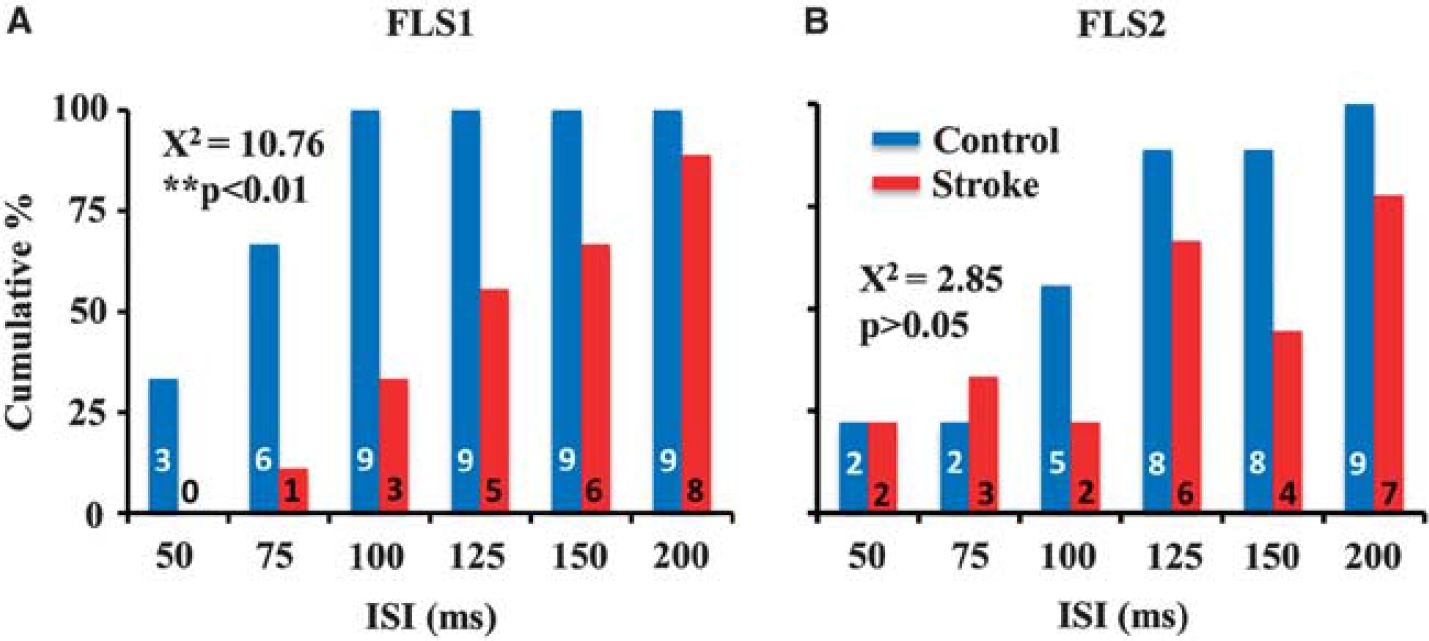
Histogram indicates the cumulative % and number of mice in each group (see numbers shown inside each bar) that showed a significant primary forelimb somatosensory (FLS1) (
RESULTS
Mice subjected to sham stroke showed no signs of cortical damage, whereas mice that recovered for 3 months after stroke in FLS1 cortex had a distinct infarct that extended through all cortical layers and included part of the white matter (Supplementary Figure 1) with an average infarct volume of 1.0 ± 0.13 mm3 (n = 6 mice). Voltage-sensitive dye imaging revealed that a single 5-milliseconds stimulation of the forepaw in sham stroke control mice elicited a rapid and localized depolarization in both the FLS1 and FLS2 cortex (Figure 1A). In agreement with recently published studies,13,14 forepaw stimulation in stroke-recovered mice induced a depolarization in surviving fragments of the FLS1 and more distant FLS2 cortex (Figure 1B). We should note that we did not image mice in the acute stages of stroke (≤7 days) because previous studies have shown that peri-infarct cortical responses to sensory stimuli are dampened at that stage.13,29
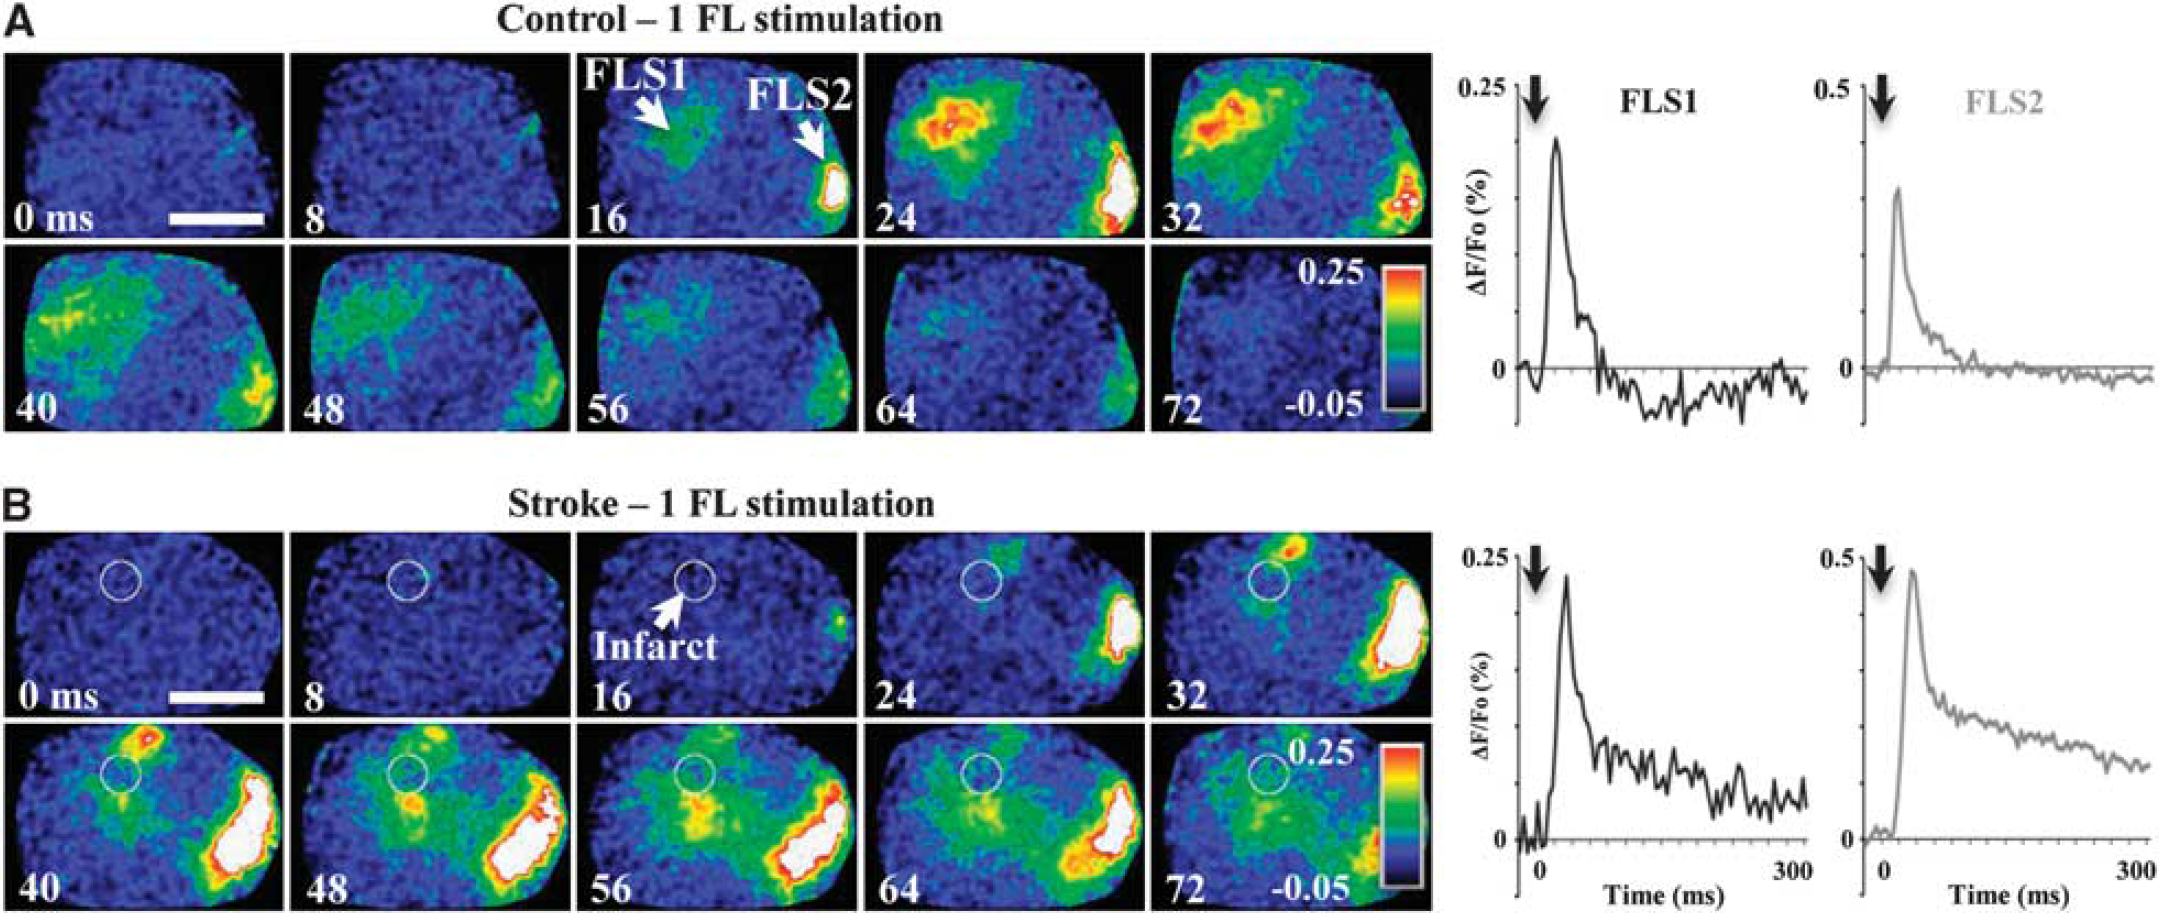
Montages show the spatio-temporal dynamics of cortical depolarizations to a single forepaw stimulus (delivered at 0 milliseconds, see black arrows) in a control (
Quantitatively, the peak amplitude of FLS1 cortical responses to a single forepaw stimulation were not significantly different between control and stroke-recovered mice (peak amplitude in control: 0.22 ± 0.03% vs. stroke: 0.19 ± 0.05%, t(14) = 1.76, P = 0.29). Despite inter-animal variability in response amplitude, we did not find a significant correlation between infarct size and peak response amplitudes in FLS1 cortex (r = 0.18, P = 0.64). The time to peak and half-width (duration of responses at 50% maximum amplitude) of FLS1 depolarizations were longer in stroke-recovered mice (time to peak in control: 22.5 ± 1.3 milliseconds vs. stroke: 32.4 ± 3.6 milliseconds; t(10) = 1.81, P < 0.05; half-width of control: 23.6 ± 2.2 milliseconds vs. stroke: 32.9 ± 2.5 milliseconds; t(14) = 1.81, P < 0.05). Consistent with previous work, 12 the peak amplitude of FLS2 cortical responses was significantly greater in stroke affected mice (control: 0.25 ± 0.04% vs. stroke: 0.46 ± 0.04%, t(15) = 3.8, P < 0.01), whereas there were no significant differences in the time to peak amplitude (control: 27.5 ± 0.9 milliseconds vs. stroke: 25.8 ± 0.9 milliseconds; t(16) = 1.39, P = 0.09) or half-width of FLS2 responses (control: 26.5 ± 4.1 milliseconds vs. stroke: 18.7 ± 1.2 milliseconds; t(9) = 1.82, P = 0.051).
Next, we assessed the temporal fidelity of the stroke-recovered FLS1 cortex by examining cortical depolarizations to forepaw stimuli (5 milliseconds duration) that were delivered at various ISIs (between 50 and 200 milliseconds). In the majority of paired stimulation trials (control = 80% vs. stroke = 82.6% of trials pooled across all ISIs), cortical depolarizations to the second forepaw stimulus were attenuated with shorter ISIs (Figure 2A and 2B), which is consistent with optical and electrophysiological recordings in barrel cortex to paired whisker stimulations.30,31 The attenuation of secondary cortical depolarizations to paired stimuli was reflected in paired pulse ratios <1 for both control and stroke-recovered mice at each ISI (Supplementary Figure 2). As shown in Figures 2A and 3A (which display group data and a single experiment, respectively), the majority of control animals showed a significant FLS1 cortical response to paired stimuli ≥75 milliseconds apart. By classifying cortical depolarizations as ‘significant’ or not (based on the peak amplitude of the second depolarization relative to noise levels, see Materials and Methods), we found that 3/9 controls responded to stimuli separated 50 milliseconds apart, 6/9 responded to stimuli 75 milliseconds apart and 9/9 controls responded to stimuli ≥100 milliseconds apart (Figure 4A). For stroke-recovered mice, the temporal fidelity of cortical responses to successive forepaw stimulations was impaired relative to controls. Despite showing a strong FLS1 cortical depolarization to the first forepaw stimulation, mice often failed to show a distinct response to the second forepaw stimulation (Figures 2A and 3B), even in some cases when the stimulus was delivered at the longest ISI (200 milliseconds, see Supplementary Figure 3). This is manifested in the fact that 0/9 stroke mice responded to stimuli separated 50 milliseconds apart, 1/9 responded to stimuli 75 milliseconds apart and 3/9 responded to stimuli 100 milliseconds apart (see Figure 4A for all ISIs). χ 2 analysis of the cumulative response distribution (Figure 4A) revealed that stroke significantly degraded cortical responsiveness to paired forepaw stimuli relative to controls (χ 2 = 10.76, P < 0.01). We should note that infarct size was not correlated with how well each mouse responded to successively shorter intervals between forepaw stimulations (r = 0.21, P = 0.60).
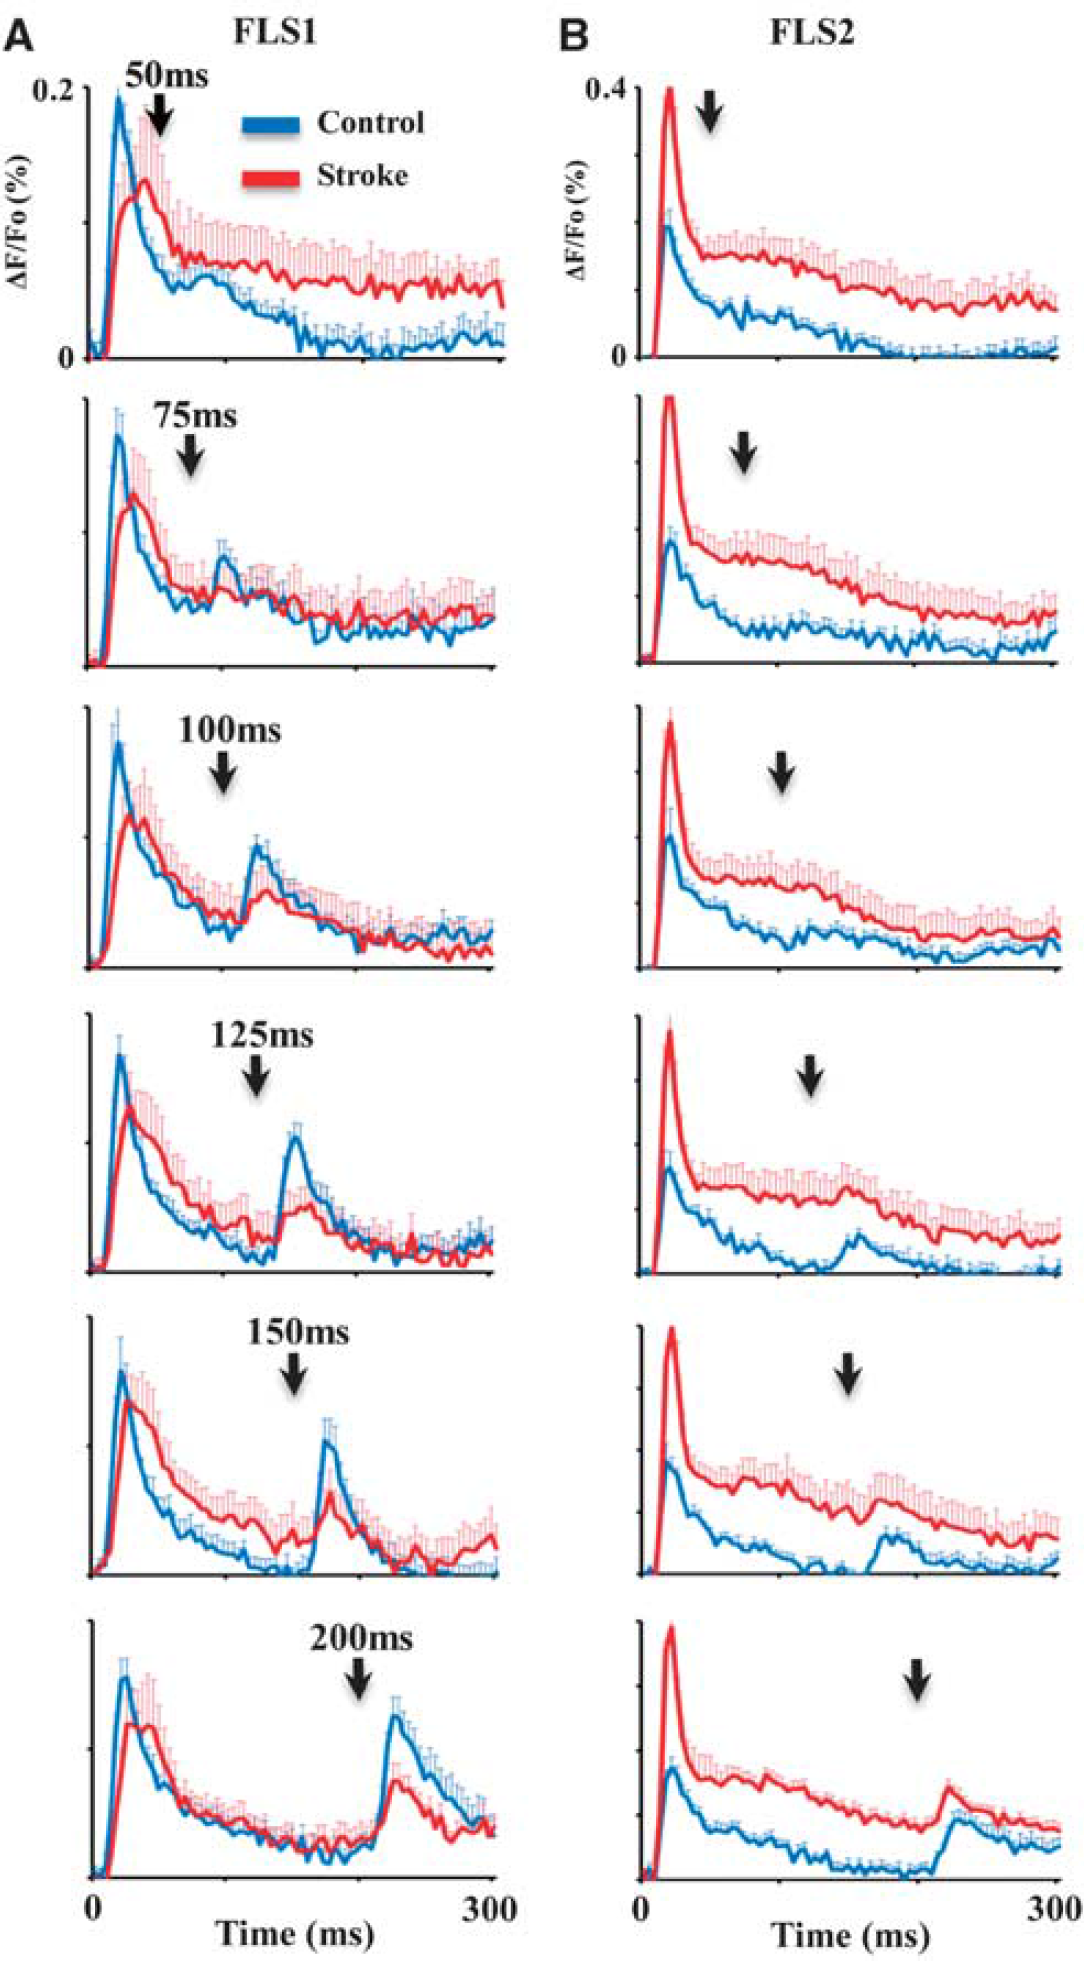
Plots show the average primary forelimb somatosensory (FLS1) (
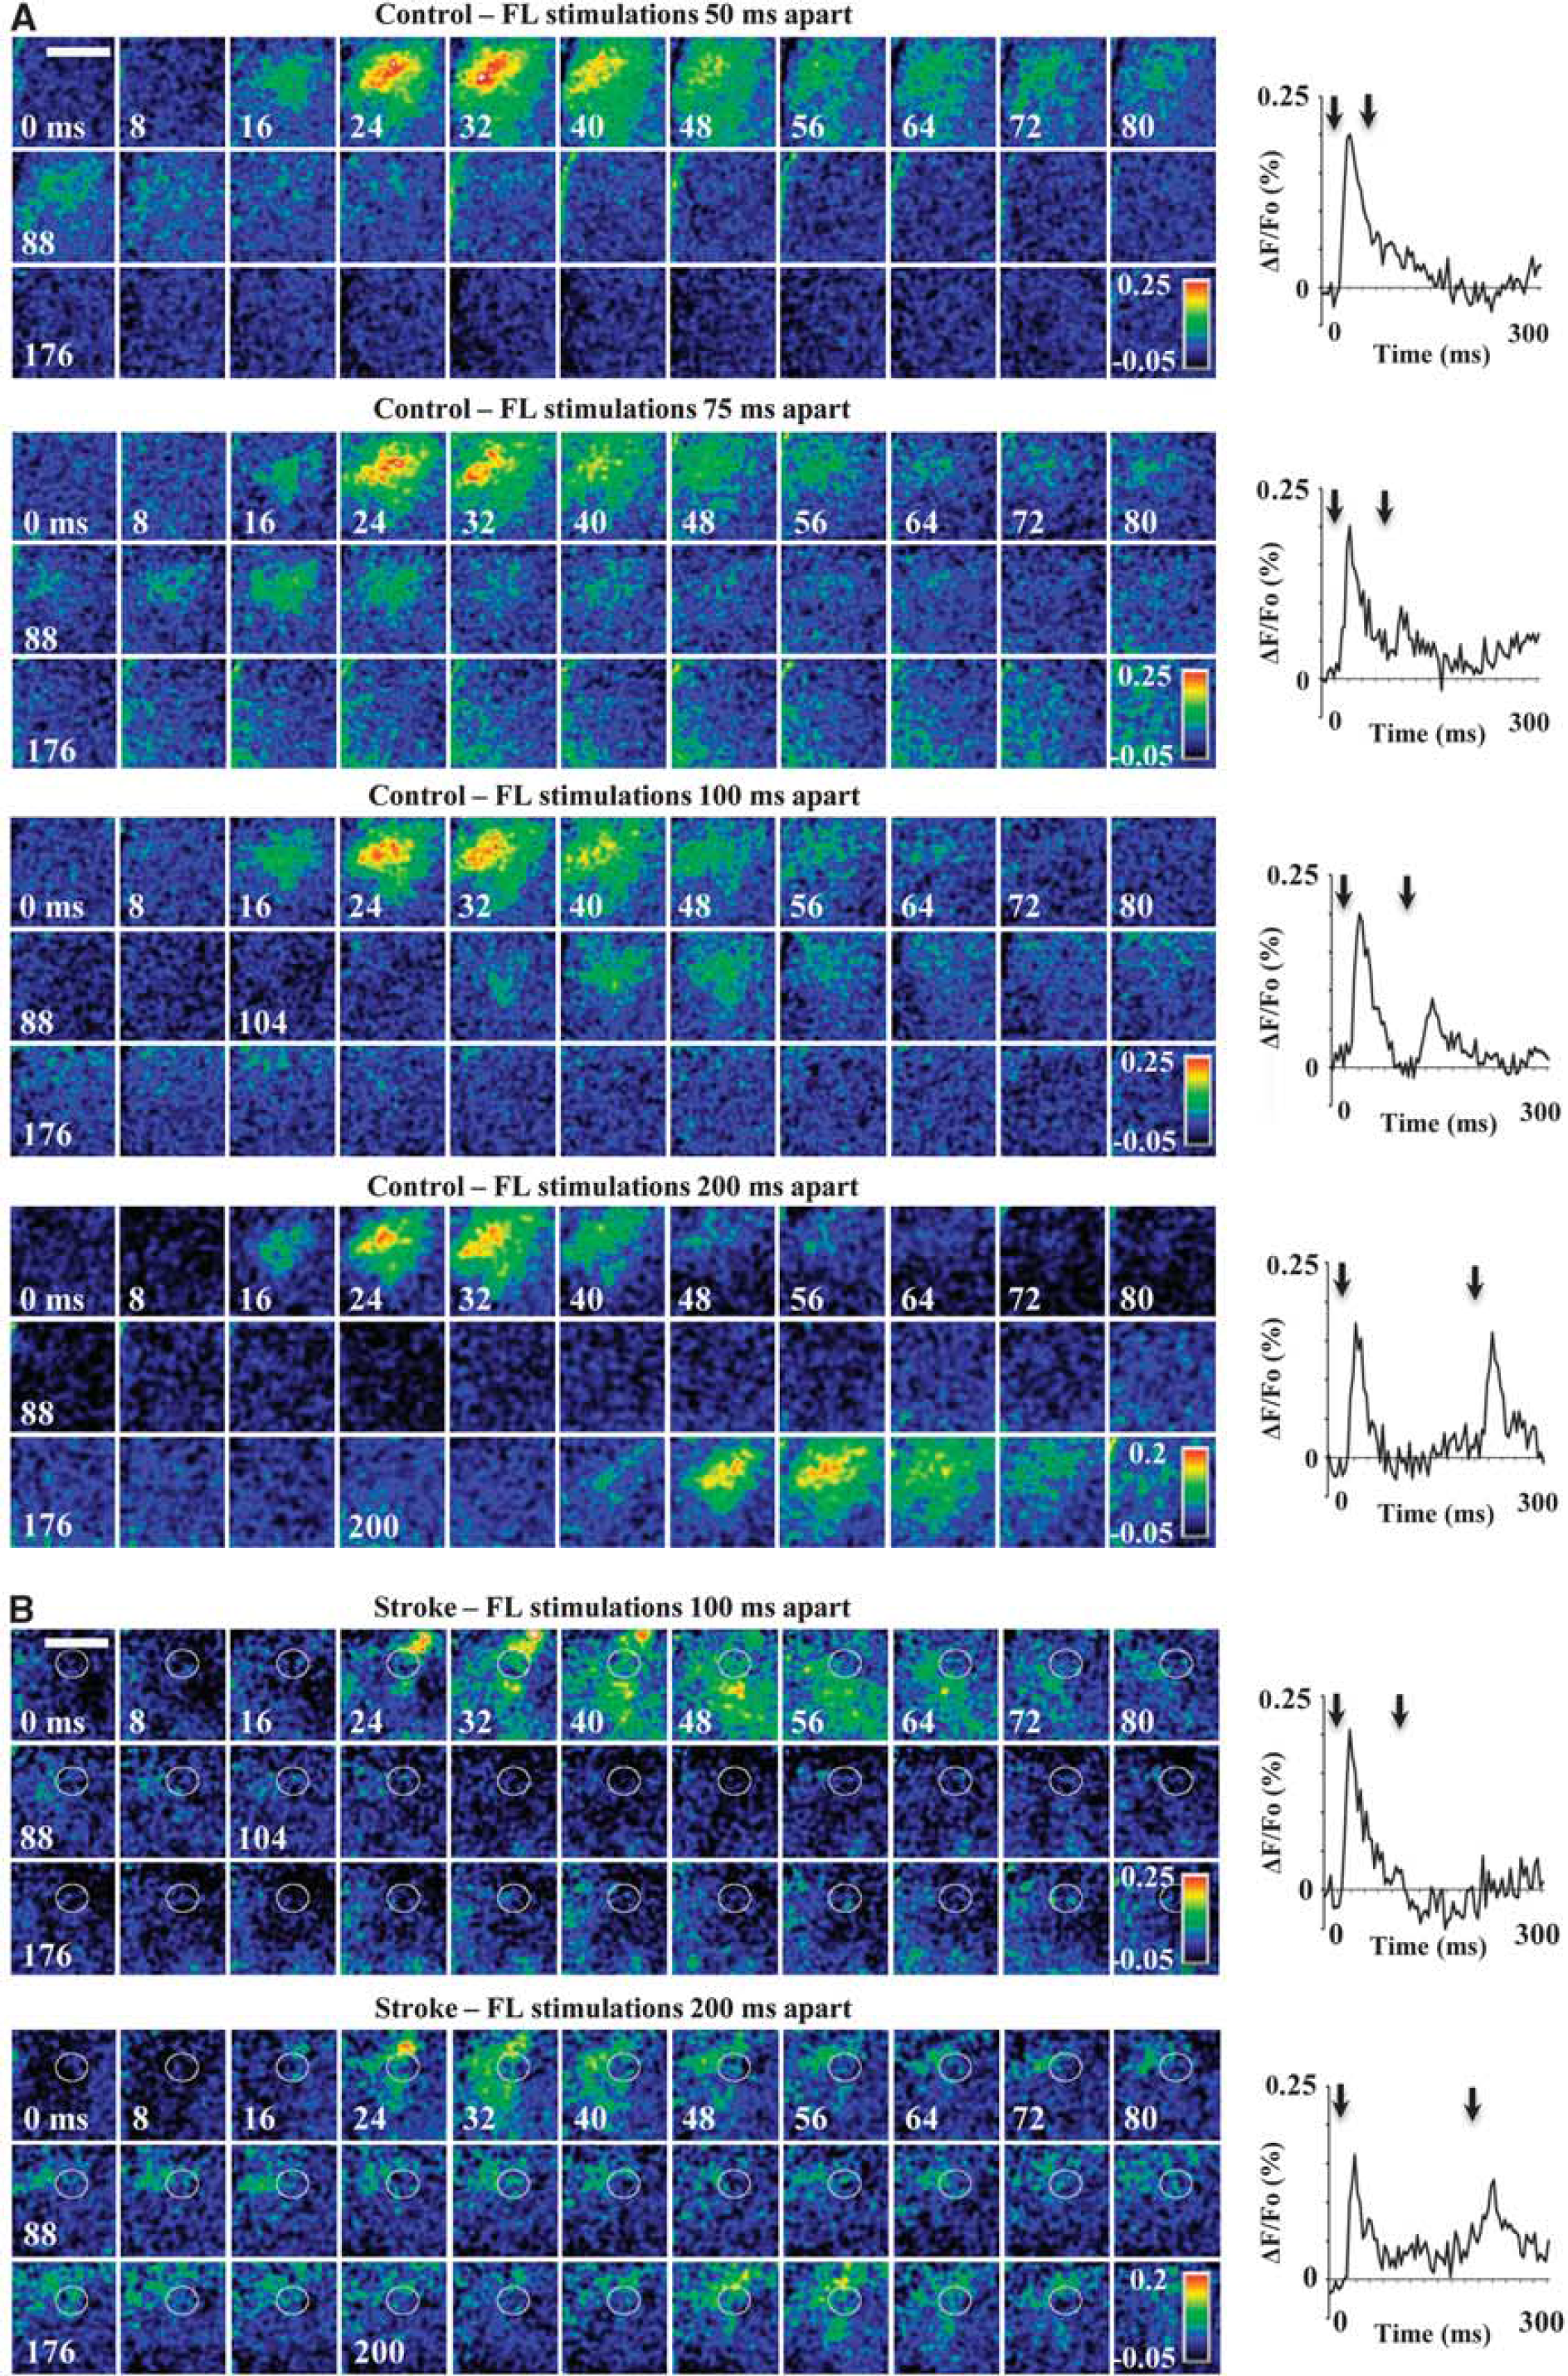
Montages and ΔF/Fo plots show depolarizations in primary forelimb somatosensory (FLS1) cortex after paired forepaw stimuli (black arrows signify timing of first and second stimulus). Each image montage was generated from an average of 12 stimulus trials. To the right of each montage is a ΔF/Fo plot showing the kinetics of depolarizations measured in FLS1 (peri-infarct) cortex. (
Considering that FLS2 cortex was significantly more responsive to forepaw stimulation 3 months after stroke (see Figure 2B), we wanted to know if there were any changes in the temporal fidelity of FLS2 cortical circuits that might compensate for the impairments found in FLS1 cortex. In contrast to our findings for the FLS1 cortex, stroke did not significantly shift the percentage of mice that exhibited a significant FLS2 cortical depolarization to the second forepaw stimuli (Figures 4B, χ 2 = 2.85, P > 0.05). These results suggest that stroke selectively impairs temporal aspects of sensory processing in the peri-infarct FLS1, but not FLS2 cortex.
DISCUSSION
It is well established that ischemic damage to the somatosensory cortex leads to significant impairments in tactile sensation, discriminative touch, vibration/flutter detection, and proprioception5–7,10,32 that show some, albeit not complete recovery over time. Correlating with these changes in sensory function, our group and others have found that the forelimb or hand representation of the somatosensory cortex progressively reorganizes in the stroke-affected hemisphere.13–15,33 One interesting finding from the present study was that single forelimb-evoked depolarizations in peri-infarct cortex appeared quite sharp at 14 weeks recovery (see Figure 1) relative to shorter (8 week) recovery periods where cortical responses are generally prolonged. 13 This observation suggested that over longer recovery periods, peri-infarct cortex might be more able to respond to tactile stimuli delivered in short succession. Contrary to this, we found that peri-infarct responses to paired forepaw stimuli were significantly attenuated or absent for ISIs ≤100 milliseconds. To our knowledge, this is one of the first studies to report such a deficit. This finding does, however, contrast with those from previous studies who found enhanced cortical excitability and neuronal spiking after brain injury.27,34–36 Given that changes in VSD fluorescence faithfully mirror voltage changes observed with electrical recordings,21,37 it is unlikely that the discrepancy between our data and that of the previous studies is related to the choice of recording (optical vs. electrical). A more likely explanation is that two of the previous in vivo studies27,35 examined cortical responses in the first 6 hours after cortical damage, whereas our data were generated 3 months after stroke. An interesting idea that has emerged over the last couple years is that stroke leads to excessive inhibition in peri-infarct cortex. 11 This enhancement in inhibition (or other changes in cortical and thalamic excitability) likely takes several hours to days to develop and may explain why cortical responses can be easily evoked in peri-infarct cortex in the first couple hours after stroke,35,38 but less so at later periods of recovery.13,39
One other explanation that could account for discrepancies in the data is the type of experimental preparation. Some of the previous studies34,36,40 examined peri-infarct cortical excitability in brain slices, whereas ours used in vivo recordings. It is possible that excitability may be enhanced in the cortex but attenuated in subcortical structures such as the thalamus, which would be absent in brain slices. Normally during paired sensory stimulation, the first stimulus will generate synchronous responses in thalamic relay neurons in the ventroposteriolateral nucleus (VPL) that ultimately propagate to the FLS1 cortex. 1 Corticothalamic neurons in FLS1 can then project back to the inhibitory reticular nucleus of the thalamus that determines whether VPL neurons will respond to, and propagate subsequent stimuli to the cortex. 41 Indeed, a previous study in humans has shown that stroke can alter the manner with which the thalamus gates sensory-driven cortical activity. 42 Furthermore, Paz et al, 43 found long-lasting changes in the morphology and excitability of thalamic reticular neurons projecting to the VPL after photothrombotic damage to the somatosensory cortex. Therefore, it is possible that cortical damage induces long-lasting changes in the sensory gating mechanism of the thalamus, thereby shunting cortical depolarizations to tactile stimuli delivered in short succession.
If stroke induces long-lasting deficits in the temporal fidelity of forepaw evoked cortical depolarizations, could this have functional consequences for the organism such as a persistent impairment in tactile sensation? Although we did not behaviorally assess mice, a study run in parallel to this one 12 using photothrombosis to induce damage in FLS1 cortex found partial, but not complete recovery of forepaw function. Ideally, future behavioral studies that examine flutter perception in mice would be most informative. For example, Romo et al 44 have shown that primates can clearly discriminate vibrotactile stimuli ranging from 5 to 50 Hz. Single unit recordings in these animals suggest that the perception of flutter was coded by the periodicity and rate of neuronal firing in primary and secondary somatosensory cortex.1,45 In the present study, we imaged the collective membrane potentials of a few thousand neurons in superficial layer 2/3 in FLS1 and FLS2 cortex (estimate based on a 400-μm diameter ROI used to analyze cortical depolarizations 46 ). As we did not perform single unit recordings, we do not know if poor temporal fidelity (found with VSD imaging) is manifested in spiking deficits at the single cell level, or perhaps a disruption in the synchronization of individual neurons. Nevertheless, it is conceivable that impairments in cortical responsiveness to paired forepaw stimuli (delivered between 5 and 20 Hz) could represent one manifestation of the lingering deficits in somatosensation that are commonly found after stroke. Future studies correlating perceptual tactile discriminations in stroke-affected animals with peri-infarct cortical responses would be necessary to shed light on this complex issue.
DISCLOSURE/CONFLICT OF INTEREST
The authors declare no conflict of interest.
Footnotes
References
Supplementary Material
Please find the following supplemental material available below.
For Open Access articles published under a Creative Commons License, all supplemental material carries the same license as the article it is associated with.
For non-Open Access articles published, all supplemental material carries a non-exclusive license, and permission requests for re-use of supplemental material or any part of supplemental material shall be sent directly to the copyright owner as specified in the copyright notice associated with the article.