
Abstract
Measurement of glutathione concentration for the study of redox status in subjects with neurological disease has been limited to peripheral markers. We recruited 19 subjects with large strokes. Using magnetic resonance spectroscopy we measured brain glutathione concentration in the stroke region and in healthy tissue to calculate a glutathione-ratio. Elevated glutathione-ratio was observed in subacute (<72 hours) subjects without hemorrhagic transformation (mean = 1.19,
INTRODUCTION
Oxidative stress has a pathological role in a large number of neurological diseases, including stroke, amyotrophic lateral sclerosis, schizophrenia, Alzheimer's, Parkinson's, and Huntington's disease. Glutathione is a ubiquitous tripeptide thiol compound, which has a major role in the defense against reactive oxygen species and oxidative stress. In its reduced form (γ-L-glutamyl-L-cysteinglycine—GSH) it acts as non-enzymatic scavenger.
1
In addition it acts as an electron donor for glutathione peroxidase in the enzymatic detoxification of hydrogen peroxide, and in the process is converted to its oxidized form, glutathione disulfide.
2
Within the brain it has been detected in both neurons and glial cells.
3
Although animal stroke studies of brain GSH have used techniques such as enzymatic assays of brain homogenates acquired after euthanasia,4,5 these are clearly incompatible with the study of human subjects
The feasibility of measuring GSH with magnetic resonance spectroscopy (MRS)
8
has already been demonstrated. Measurement of GSH by MRS has been reported in neurological diseases including epilepsy and psychosis/schizophrenia. Our group has validated a technique using single voxel MRS with a modification of a spectral editing technique involving a novel spectral alignment method.
9
In this study we use this to provide the first report of
MATERIALS AND METHODS
SUBJECTS
Subjects with anterior circulation ischemic stroke and who were consented into our Natural History of Stroke protocol, which has been reviewed by the Institutional Review Board at the National Institute of Neurological Diseases and Stroke, were considered. Although there was no specific neurological deficit required for inclusion, we targeted subjects with large stroke lesions on either perfusion weighted image (PWI) or diffusion weighted (DWI) images. We excluded subjects when there was a non-index chronic stroke or hemorrhagic transformation (HT) of parenchymal hematoma type within the region of the index stroke or ipsilateral hemisphere.
Imaging and Post-Processing
Details of imaging sequences, post-processing and quantification of metabolites have previously been described. 9 All sequences were performed on a 3-Tesla Philips MR scanner (Philips Medical Systems, Best, Netherlands). Subjects previously had baseline stroke protocol MR sequences performed for clinical purposes, including PWI when not contra-indicated.
A 5 × 3 × 3 cm3 single voxel was manually placed over the stroke region as visualized on either DWI or Fluid Attenuated Inversion Recovery maps. Another voxel was then placed in the ‘mirror’ region of the contralateral hemisphere. A J-difference editing pulse sequence with a data acquisition time of 8.5 minutes per voxel was employed to produce an unedited and an edited spectrum. The unedited spectrum was subtracted from the edited spectrum to yield the difference spectrum, in which the GSH peak at 2.95 p.p.m. was unmasked as a consequence of large overlapping peaks (e.g., creatine [Cr] peak at 3.03 p.p.m.) being canceled out by the subtraction. The average of the edited and unedited spectra was termed the ‘averaged spectrum’. γ-L-Glutamyl-L-cysteinglycine was quantified using the difference spectrum. Lactate was quantified using the unedited spectrum because its signal in the edited spectrum was affected by the GSH editing pulse. Lesion lactate concentration was calculated by using the contralateral creatine concentration as a reference that was assumed to be 7.1 mmol/L. 10
Statistical Analysis
Statistical calculations were performed with StatsDirect 2.7.2 (www.statsdirect.com). Relative concentrations of GSH and other metabolites were derived by calculating a ratio of the value of GSH in the lesion compared with the corresponding measurement from the contralateral hemisphere. A single sample
RESULTS
SUBJECTS
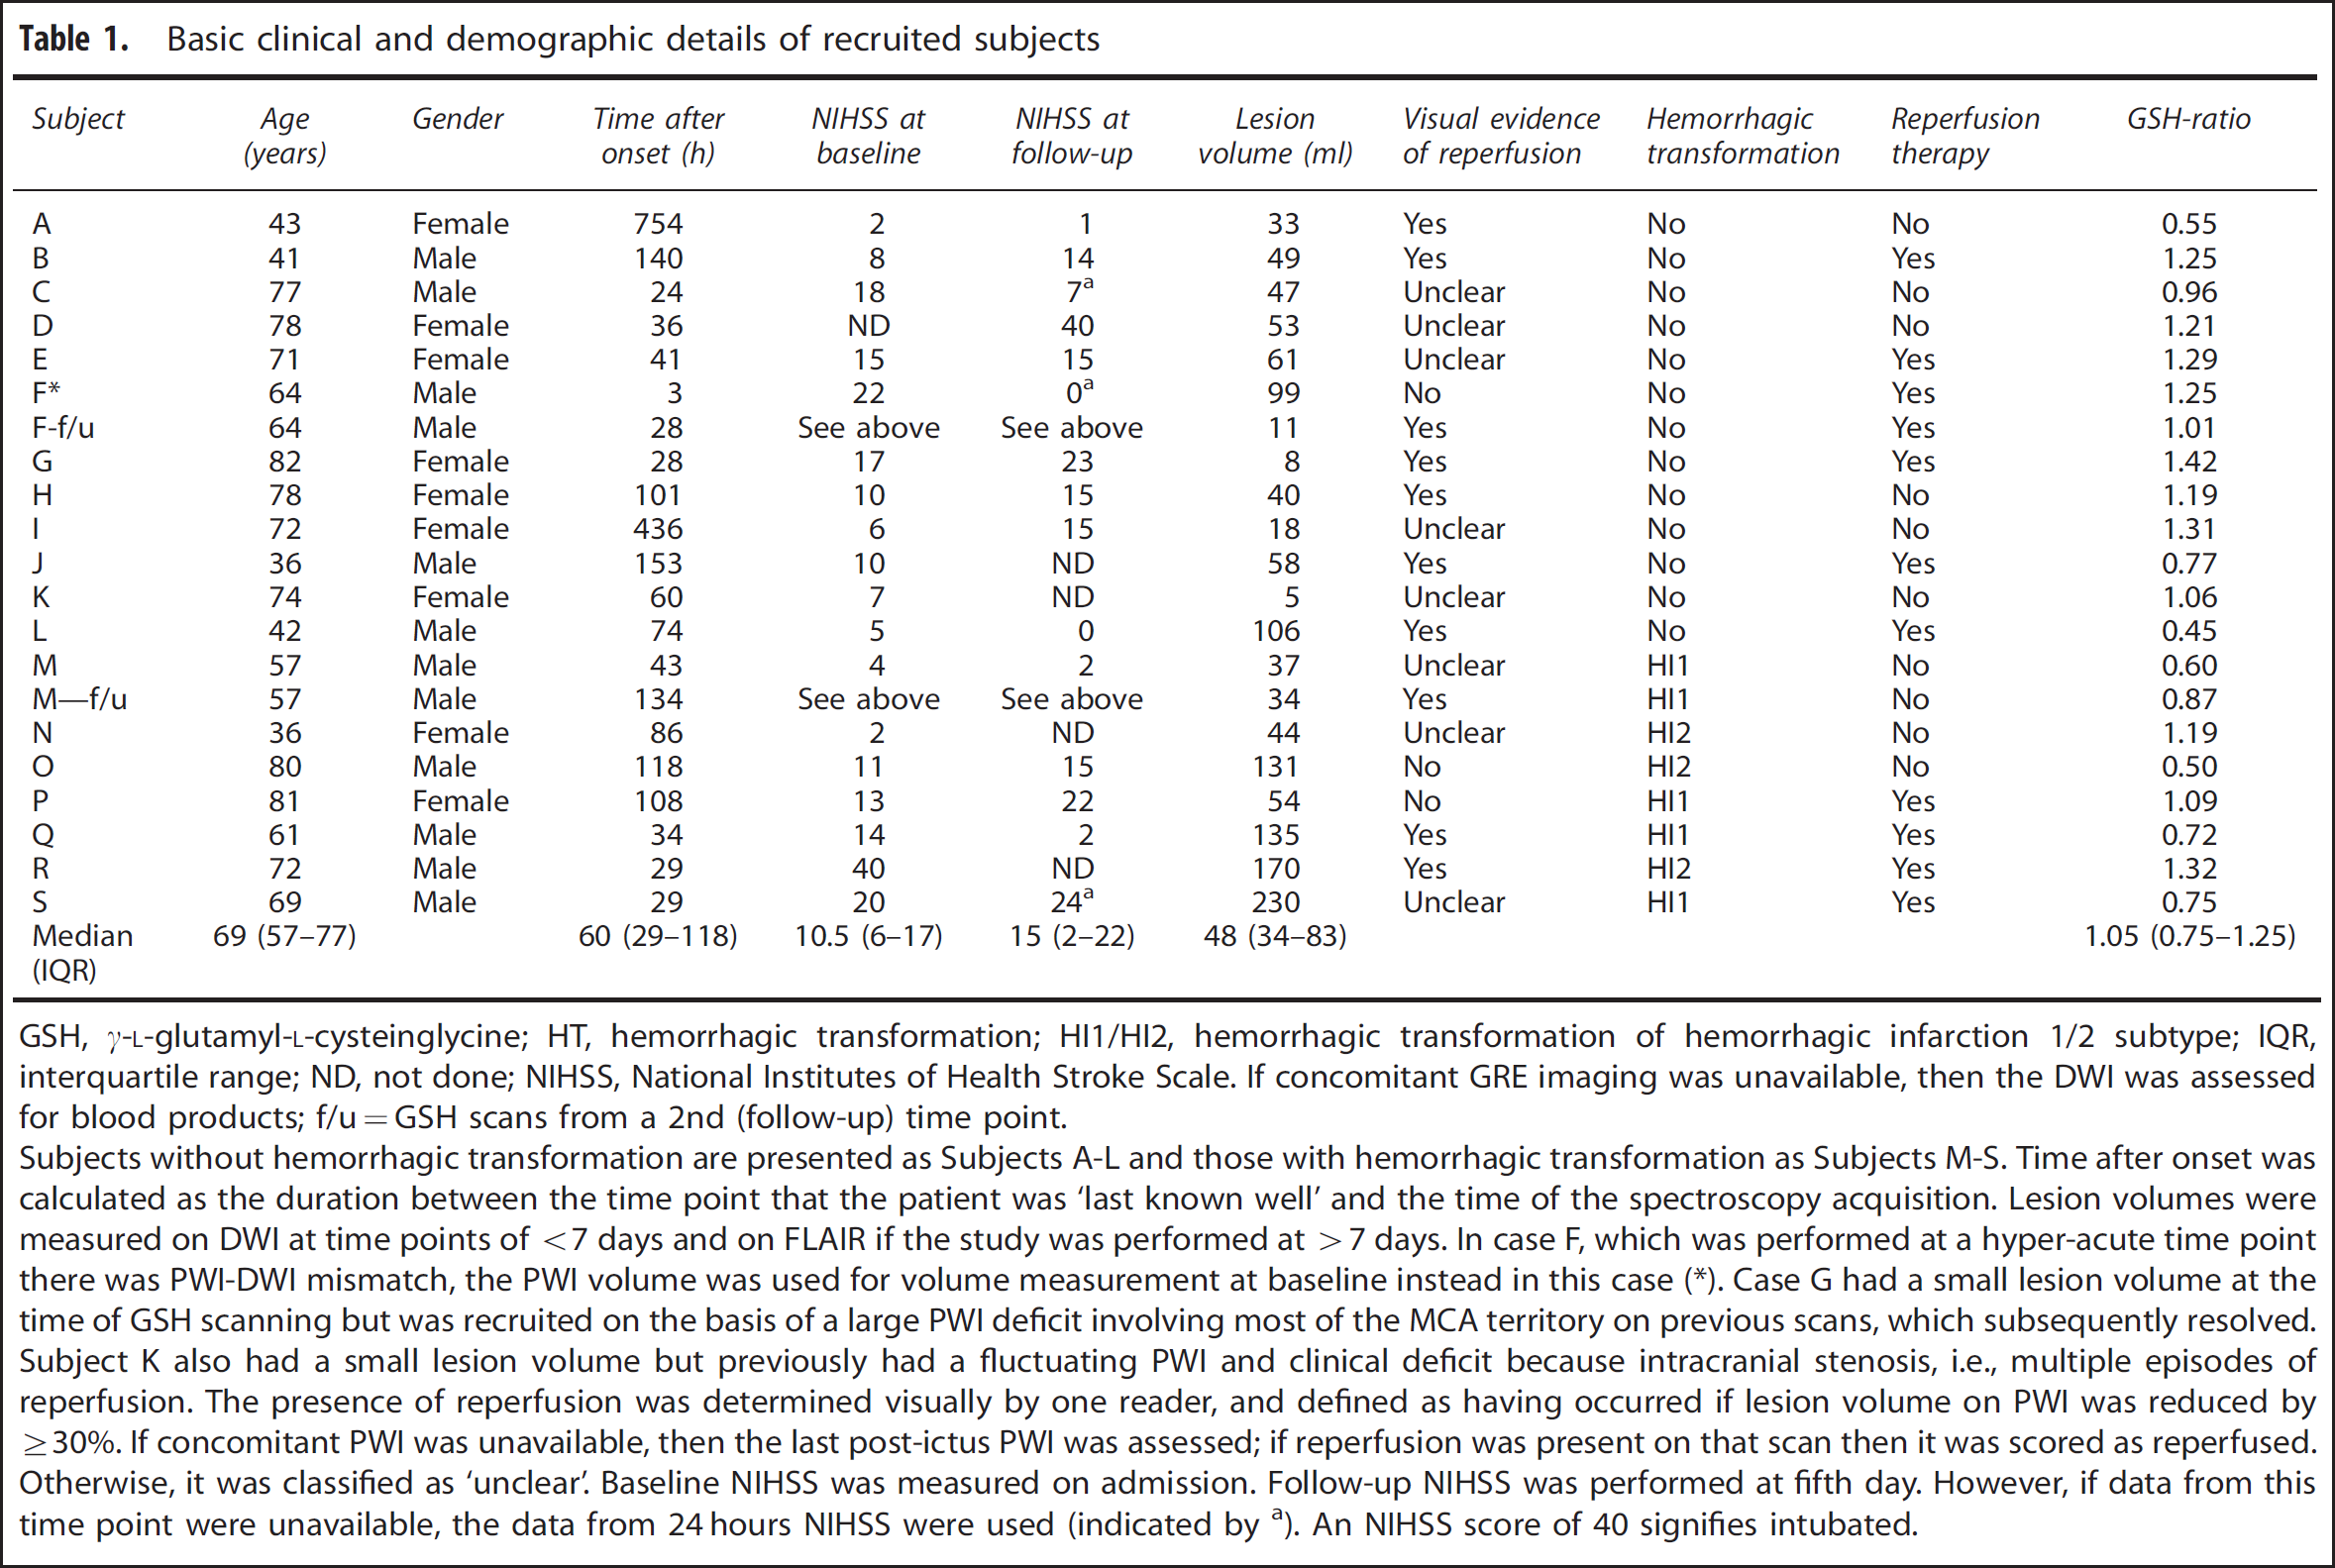
Table 1 details basic demographic and clinical variables of the 19 recruited subjects. Note that in ‘Subject F’, scanned at 3 hours, the lesion volume on PWI exceeded that on DWI.
Basic clinical and demographic details of recruited subjects
GSH,
If concomitant GRE imaging was unavailable, then the DWI was assessed for blood products; f/u=GSH scans from a 2nd (follow-up) time point.
Subjects without hemorrhagic transformation are presented as Subjects A-L and those with hemorrhagic transformation as Subjects M-S. Time after onset was calculated as the duration between the time point that the patient was ‘last known well’ and the time of the spectroscopy acquisition. Lesion volumes were measured on DWI at time points of <7 days and on FLAIR if the study was performed at >7 days. In case F, which was performed at a hyper-acute time point there was PWI-DWI mismatch, the PWI volume was used for volume measurement at baseline instead in this case.
Case G had a small lesion volume at the time of GSH scanning but was recruited on the basis of a large PWI deficit involving most of the MCA territory on previous scans, which subsequently resolved. Subject K also had a small lesion volume but previously had a fluctuating PWI and clinical deficit because intracranial stenosis, i.e., multiple episodes of reperfusion. The presence of reperfusion was determined visually by one reader, and defined as having occurred if lesion volume on PWI was reduced by ≥30%. If concomitant PWI was unavailable, then the last post-ictus PWI was assessed; if reperfusion was present on that scan then it was scored as reperfused. Otherwise, it was classified as ‘unclear’. Baseline NIHSS was measured on admission. Follow-up NIHSS was performed at fifth day. However, if data from this time point were unavailable, the data from 24 hours NIHSS were used (indicated by a). An NIHSS score of 40 signifies intubated.
Response of GSH to Stroke
Two measurements from each hemisphere were available from 9 of 11 healthy volunteers from our previous report. 9 When the two repeated measurements were averaged, the mean left:right hemisphere GSH-ratio was 1.07 (s.d. = 0.08), thus validating our assumption that a GSH-ratio of 1.0 should be expected.
GSH-ratio was variable when considering the whole group (range = 0.45 to 1.41) and did not demonstrate a particular trend. Six subjects without any HT were scanned <72 hours (median time to scan 32 hours, range 3 to 60 hours); in this cohort GSH-ratio was significantly elevated (mean ratio 1.19,

Averaged spectra for six subjects without hemorrhagic transformation imaged within the first 3 days after stroke. In this subgroup the γ-L-glutamyl-L-cysteinglycine (GSH)-ratio was significantly elevated in the lesion compared with the contralateral hemisphere. The reduction in lesion NAA did not reach statistical significance (
Evidence of reperfusion alone did not predict GSH-ratio. When evidence of reperfusion within the first week was demonstrated in those who did not have HT, there were three cases (subjects B, G, and H) of elevated GSH-ratio and two cases (subjects J and L) where there was decreased GSH-ratio. However, the subjects in whom GSH-ratio was elevated all demonstrated a worsening on the National Institutes of Health Stroke Scale (NIHSS) of at least five points, whereas the two subjects in whom GSH-ratio decreased both demonstrated an improvement of NIHSS of at least five points. We performed follow-up measurements on two subjects (subjects F and M). Subject F was scanned in the hyperacute phase (3 hours post-ictus) and demonstrated a large PWI-DWI mismatch associated with elevated lactate and GSH. Follow-up imaging at 28 hours demonstrated predominantly salvage of the mismatch region associated with reduction of the GSH-ratio (GSH-ratio reduced from 1.25 to 1.01). This was associated with a reduction in calculated lactate concentration from 2.1 to 1.4 mmol/L.
DISCUSSION
We used MRS to provide the first description of
The response of the glutathione system after stroke is complex and multi-faceted. First, animal models suggest that brain GSH synthetase (which facilitates GSH synthesis) may be increased after stroke
11
suggesting an adaptive response to oxidative stress. Glutathione peroxidase that converts GSH to oxidized glutathione may also be increased.
12
However, GSH concentration itself is often reported to decrease as a function of time after focal ischemia in animal models.
13
In humans, Ozkul
This study has implications for clinical trial design. For example, neuroprotectant trials have previously suffered from an inability to demonstrate that the agent has been successfully delivered to, and had an effect on, the target tissue. The ability to demonstrate an effect of a given drug on GSH, and by implication, tissue redox status, may allow improved efficiency of trial design.
The strengths of this study include the use of a validated MRS technique, 9 which we have previously shown to provide reliable measurements in volunteers and stroke patients. The non-invasive nature allowed us to measure GSH without disturbing tissue physiology or redox status. Moreover, GSH could be measured in the brain, rather than from peripheral tissues. Limitations include the clinical heterogeneity of the cohort about lesion volume, neurological deficit, time after onset, and reperfusion status. Second, we used the contralateral hemisphere as an internal control. We could not guarantee that the tissue from the ‘mirror’ region had exactly the same tissue characteristics about the relative proportions gray/white matter and cerebrospinal fluid and redox state. Third, the proportion of lesion within the voxel inevitably varied between subjects. This was partly because of a large voxel size, which we chose to maximize signal-to-noise ratio, but which may have compounded problems relating to partial volume effects. Potential modifications to increase signal-to-noise ratio could be the use of a higher B0 (7.0 T), more sensitive radio-frequency receiver coils (e.g., 32 elements) and the use of multiple element transmission coils. Fourth, metabolite measurements from subjects with HT should be viewed with caution in case of disrupted signal measurement because of paramagnetic blood products. Fifth, we did not perform repeated measures of GSH concentration, and therefore do not have a measure of the error for these data. However, data from our previous study shows the measurement errors to be acceptable (average GSH concentration in the stroke lesion was 1.19 ± 0.24 mmol/L. 9 Finally, the GSH measurements recorded by our technique provide only a measure of ‘average’ GSH concentration for the voxel, and give no indication of differential GSH concentrations in neurons and glia in intra- and extracellular locations, and in different anatomical regions within the voxel.
In summary, we provide the first report of
DISCLOSURE/CONFLICT OF INTEREST
The authors declare no conflict of interest.