
Abstract
The effects of oxygen availability on neurovascular coupling were investigated using simultaneous electroencephalography (EEG) and functional magnetic resonance imaging (fMRI), in addition to the monitoring of physiological parameters, in 16 α-chloralose-anesthetized rats. Mild hypoxic hypoxia (oxygen saturation=83.6±12.1%) induced significant reductions in fMRI responses (P<0.05) to electrical stimulation in the forepaw, but EEG responses remained unchanged. In addition, the changes in oxygen saturation were linearly correlated with the changes in the fMRI responses. These data further emphasize the importance of oxygen availability, which may regulate neurovascular coupling via the oxygen-dependent enzymatic synthesis of messenger molecules.
Keywords
Introduction
The coupling between increased neuronal activity and cerebral blood flow (CBF), known as neurovascular coupling, is a highly regulated phenomenon that forms the basis of functional magnetic resonance imaging (fMRI) signals. A growing body of evidence suggests that neurovascular coupling is highly sensitive to baseline physiological parameters and is likely disrupted in pathological conditions (Girouard and Iadecola, 2006). Oxygen availability in the brain, which is determined by CBF, hemoglobin concentration, and oxygen saturation, has a crucial role in neurovascular coupling (Lindauer et al, 2010; Mishra et al, 2011) and profoundly influences vascular response to neuronal activity. In a recent seminal study, Gordon et al (2008) found that in brain slices, a rise in oxygen (95%) induces vasoconstriction after synaptic activation, whereas a decrease in oxygen (20%) induces vasodilation through elevated calcium signaling in astrocytes associated with arterioles. However, the extrapolation of these findings to in vivo conditions should be considered with caution due to the inherent and critical limitations of brain slice studies, such as the lack of vessel or myogenic tone, artificial activation procedures, and oxygen being supplied from the surface rather than from vessels (Iadecola and Nedergaard, 2007). Over the last decade, various groups have reported that a decrease in oxygen saturation reduced fMRI responses under an event-related stimulation paradigm (Rostrup et al, 2005; Tuunanen and Kauppinen, 2006; Ho et al, 2008); however, they did not observe the perturbations in neuronal activity or the influence of physiological parameters on the fMRI responses. In general, hypoxia induces a variety of side effects (i.e., physiological compensations), such as alterations in neuronal activity, increases in basal CBF, hyperventilation, hypotension, and hypocapnia (Siesjö, 1978). Therefore, it is difficult to conclude whether the changes in fMRI responses are derived from neuronal, hemodynamic, or physiological consequences. In this study, to examine the influence of oxygen availability on neurovascular coupling together with concurrent monitoring of the neuronal activity and several physiological parameters, we combined the following experimental settings: (1) simultaneous electroencephalography (EEG) and fMRI recording in α-chloralose-anesthetized rats under mechanical ventilation; (2) concurrent monitoring of physiological parameters, such as the partial pressure of arterial oxygen (PaO2), the partial pressure of arterial carbon dioxide (PaCO2), pH, mean arterial blood pressure (MABP), heart rate, and arterial oxygen saturation (SaO2), through the femoral artery; and (3) the use of mild hypoxic hypoxia for inducing a decrease in PaO2 and SaO2 while maintaining the other physiological parameters within a normal physiological range. In addition, we observed changes in the basal CBF using a FAIR (flow sensitive alternating inversion recovery) protocol in a separate animal group.
Materials and methods
All experimental procedures were performed in agreement with the policies established by the Animal Care Committee at Tohoku University (approval code: 2011AcA-40 and 2012AcA-50).
Animal Preparation
The experiments were conducted on 22 male Wistar rats weighing 227±23 g. Each rat was anesthetized with isoflurane during surgery. The tail vein and left femoral artery were catheterized for drug delivery and physiological monitoring, respectively. After oral intubation, each rat was placed on an MRI bed and was mechanically ventilated at ∼60 breaths per minute. After surgery, the anesthetic was switched to α-chloralose (80 mg/kg as an initial bolus, followed by a constant infusion of 26.7 mg/kg per hour) with a muscle-relaxing agent (pancuronium bromide, 2.0 mg/kg per hour). The core body temperature was maintained at 37.0±1 °C throughout the entire experiment. A pair of small needle electrodes was inserted under the skin of the left forepaw for electrical stimulation. The digitized arterial blood pressure was analyzed using LabChart 6 (ADInstruments, Colorado Springs, CO, USA) to obtain the MABP and heart rate values, while the blood extracted from the femoral artery (∼0.3 mL) was analyzed with Rapidlab 248 (Siemens, Munich, Germany) to obtain the of PaO2, PaCO2, pH, and SaO2 values.
Data Acquisition
For simultaneous EEG and fMRI recording, an EEG mini-cap compatible with the MRI environment and specially designed for rodents was prepared (Sumiyoshi et al, 2011). The EEG data were collected using a 32-channel MR-compatible BrainAmp system (Brain Products, Munich, Germany). The MRI data were acquired using a 7.0-T Bruker PharmaScan system (Bruker Biospin, Ettlingen, Germany). The fMRI signals were obtained using GE-EPI with the following parameters: repetition time=2,000 ms, echo time=15 ms, voxel size=200 × 200 × 1,500 μm3, and the number of volumes=370. Basal CBF images were obtained using FAIR-EPI (imaging parameters: echo time=16 ms and voxel size=340 × 340 × 2,000 μm3; inversion parameters: slab thickness=4 mm and inversion recovery time=31.5, 100, 200, 300, …, 1,800, 1,950, 2,100, 2,300 ms). The EPI images with selective and nonselective inversions (22 images in each) were acquired in an interleaved mode. The total scanning time for EEG–fMRI and CBF recording was ∼12 and 10 minutes, respectively.
Experimental Design
The EEG–fMRI experiments (n=16) were performed using the following procedure: (1) EEG–fMRI recording under normoxia 1 hour after α-chloralose anesthesia induction; (2) blood gas sampling; (3) induction of mild hypoxic hypoxia by reducing the concentration of inspired oxygen from the mechanical ventilation from 40% to 21%, i.e., FiO2 is reduced from 36% to 18%, as measured with a small animal Gas Analyzer (ML206; ADInstruments); (4) EEG–fMRI recording after 20 minutes of mild hypoxic hypoxia; and (5) blood gas sampling. After the experiment, each rat was euthanized with a lethal dose of pentobarbital. During the EEG–fMRI experiment, a block-design stimulation paradigm consisting of 10 blocks was used in which each block induced a 30-second forepaw stimulation (3 Hz, 2 mA, and 0.3 ms width) followed by a 40-second resting condition. The basal CBF recordings (n=6) were performed using the above procedure, but without blood gas sampling.
Data Analysis
The procedures for the EEG and fMRI data analysis were the same as those used in our previous study (Sumiyoshi et al, 2012). In this study, the time series of both the EEG and fMRI data were expressed in units of standard deviation in the prestimulus period (EEG: −50 to 0 ms; and fMRI: −10 to 0 seconds). In addition, the areas under both the EEG and fMRI response curves (ΣEEG and ΣfMRI), which include both the positive and negative amplitudes, were computed for each experiment to concomitantly evaluate the amplitude and latency of the response curve. The CBF data were analyzed using the ParaVision software (Bruker Biospin). The details of the data analysis are provided in Supplementary information.
Statistical Analysis
Because the data for the physiological parameters, ΣEEG, and ΣfMRI were obtained at two points in the same animal (one for normoxia and the other for hypoxia), a linear correlation analysis between the change in each physiological parameter and the change in either ΣEEG or ΣfMRI was performed with a significance level of 0.05. This analysis was performed in an absolute way (i.e., comparing absolute values). In addition, for the group comparisons between the normoxia and hypoxia conditions, a paired t-test was performed with a significance level of 0.05.
Results
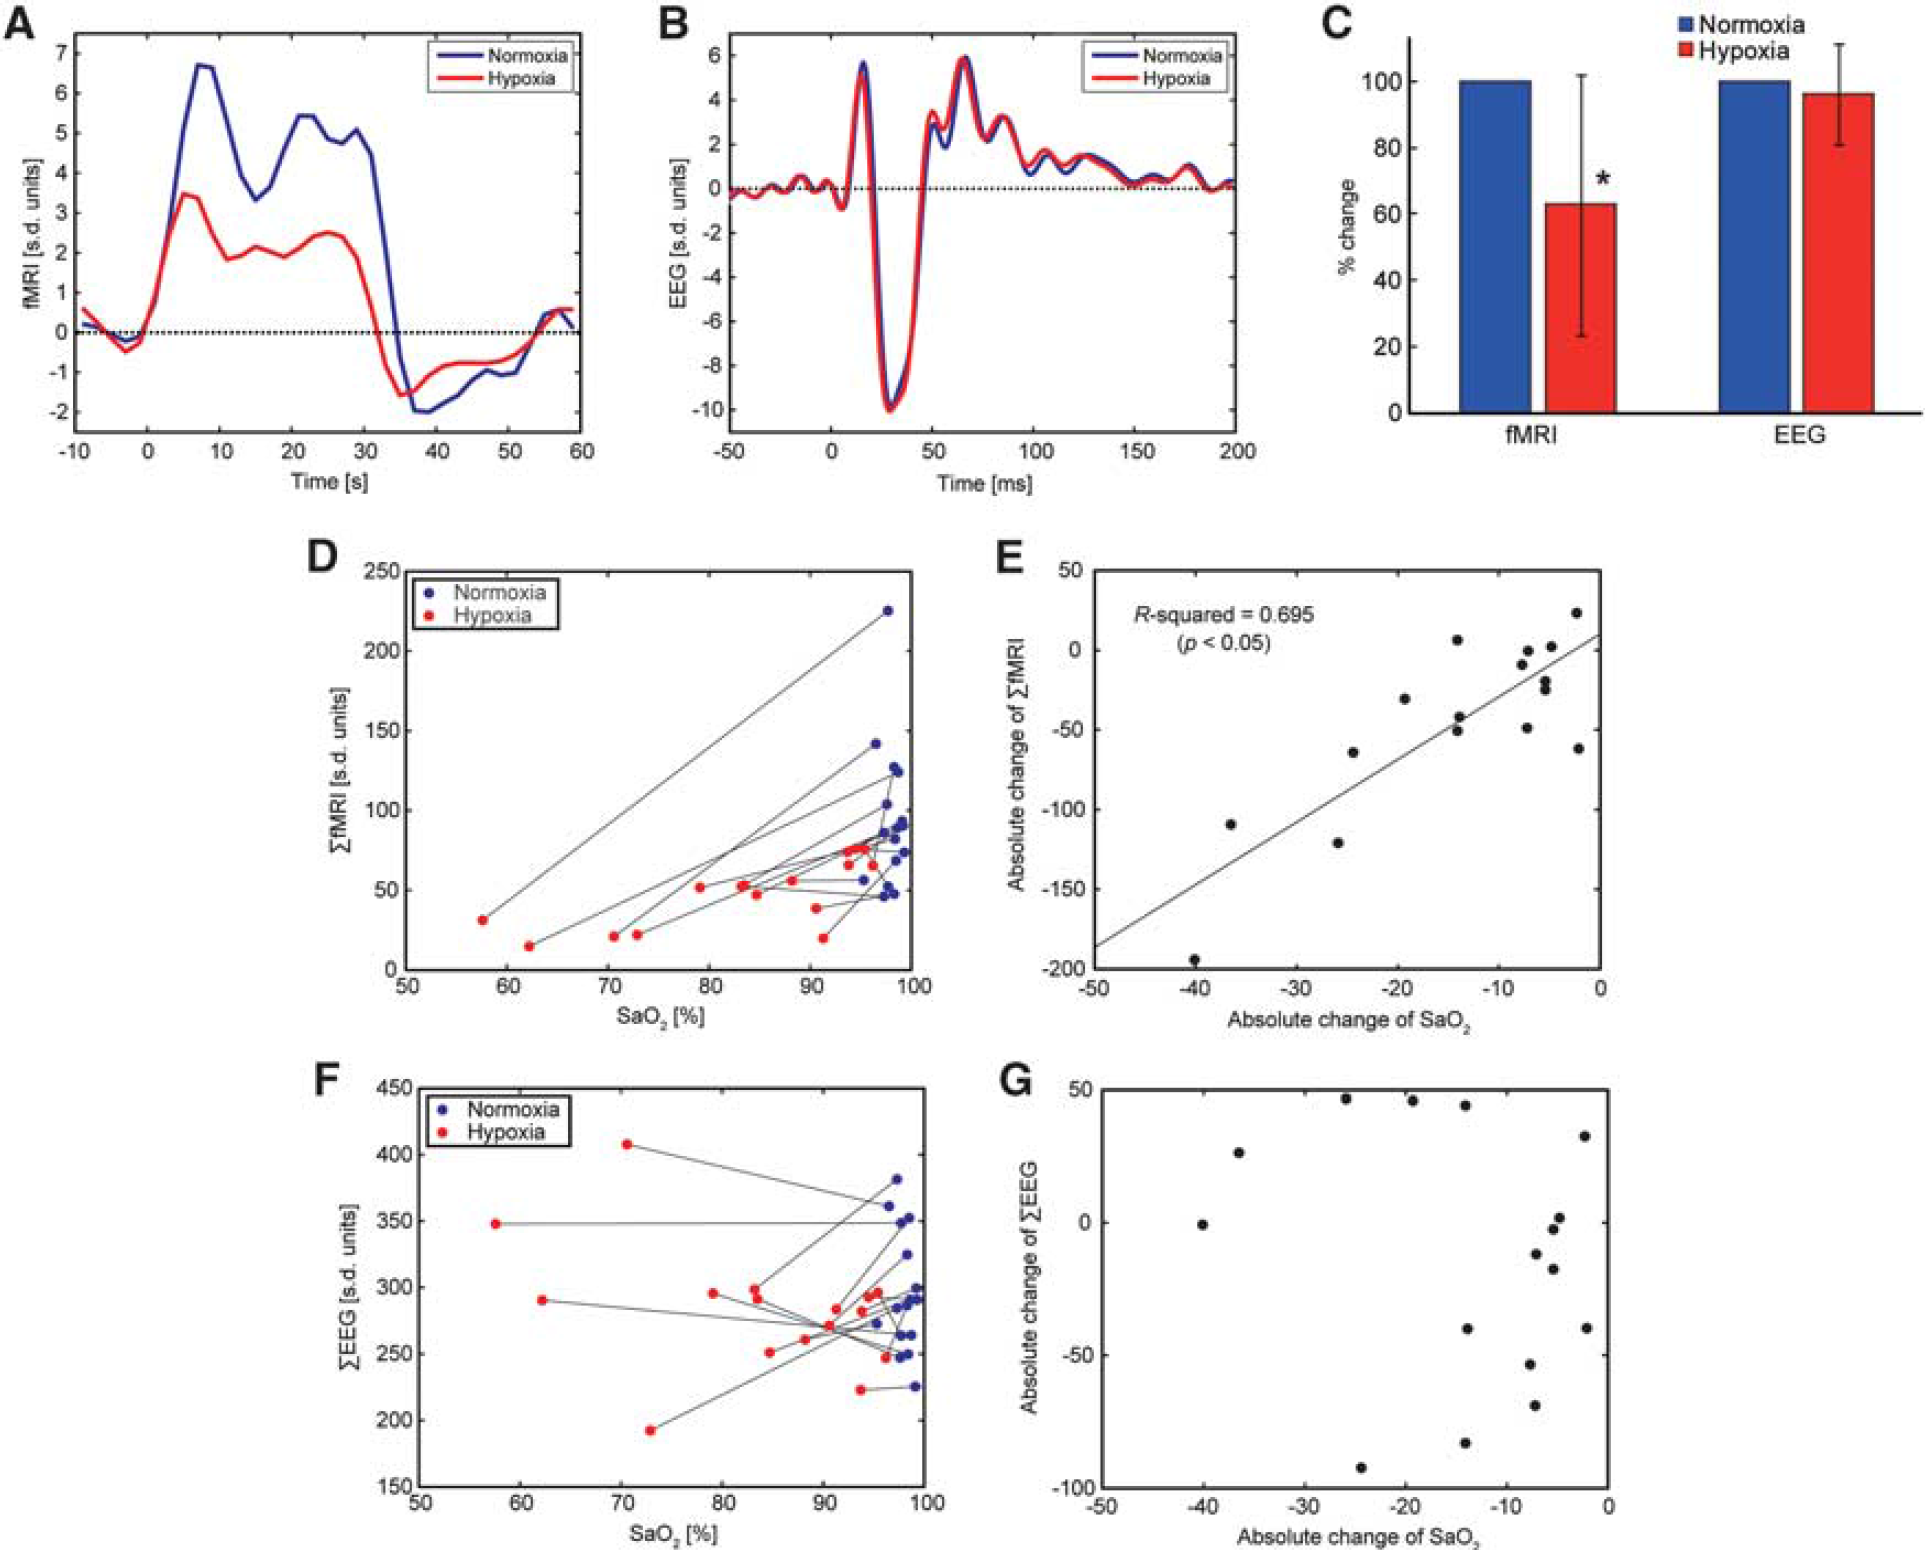
A representative result from the EEG–fMRI experiment in an individual rat is shown in Figures 1A and 1B. Both the fMRI and the EEG signals showed robust event-related responses during the electrical forepaw stimulation under normoxia (blue line). However, the fMRI response under hypoxia was attenuated, while the EEG response remained unchanged (red line). The fMRI results for all other animals are provided in Supplementary information. In the group analysis of the percent changes, the fMRI responses were significantly reduced under hypoxia (n=16, P<0.05), while the EEG responses remained unchanged (Figure 1C). When returned to normoxia after hypoxia, the posthypoxia fMRI responses were equivalent to the prehypoxia responses (n=3 among n=16, see Supplementary information), thus ruling out the possibility of a run-down phenomenon in the fMRI responses. In addition, the changes in ΣfMRI were linearly correlated with the changes in SaO2 (P<0.05, n=16; Figures 1D and 1E), while the changes in ΣEEG were not (Figures 1F and 1G). The results of the correlation analyses between other physiological parameters and either ΣfMRI or ΣEEG are summarized in Table 1 (see also Supplementary information). Although the paired t-test of the values between normoxia and hypoxia conditions revealed significant differences in PaO2, pH, MABP, and SaO2 (P<0.05, n=16), the changes in PaO2 and MABP showed no significant correlation with the changes in either ΣfMRI or ΣEEG. Only the changes in SaO2 and pH showed a significant dependence on the changes in ΣfMRI. In addition, the basal CBF values under normoxia and hypoxia in the primary somatosensory cortex were 36.3±8.1 and 38.6±9.2 mL/100 g per minute, respectively, and were not significantly different between the conditions (n=6, P>0.05, see also Supplementary information). The CBF finding is consistent with the results observed in a similar experimental set-up in anesthetized rats (Wegener and Wong, 2008).
Summarized results of statistical analyses (n=16)
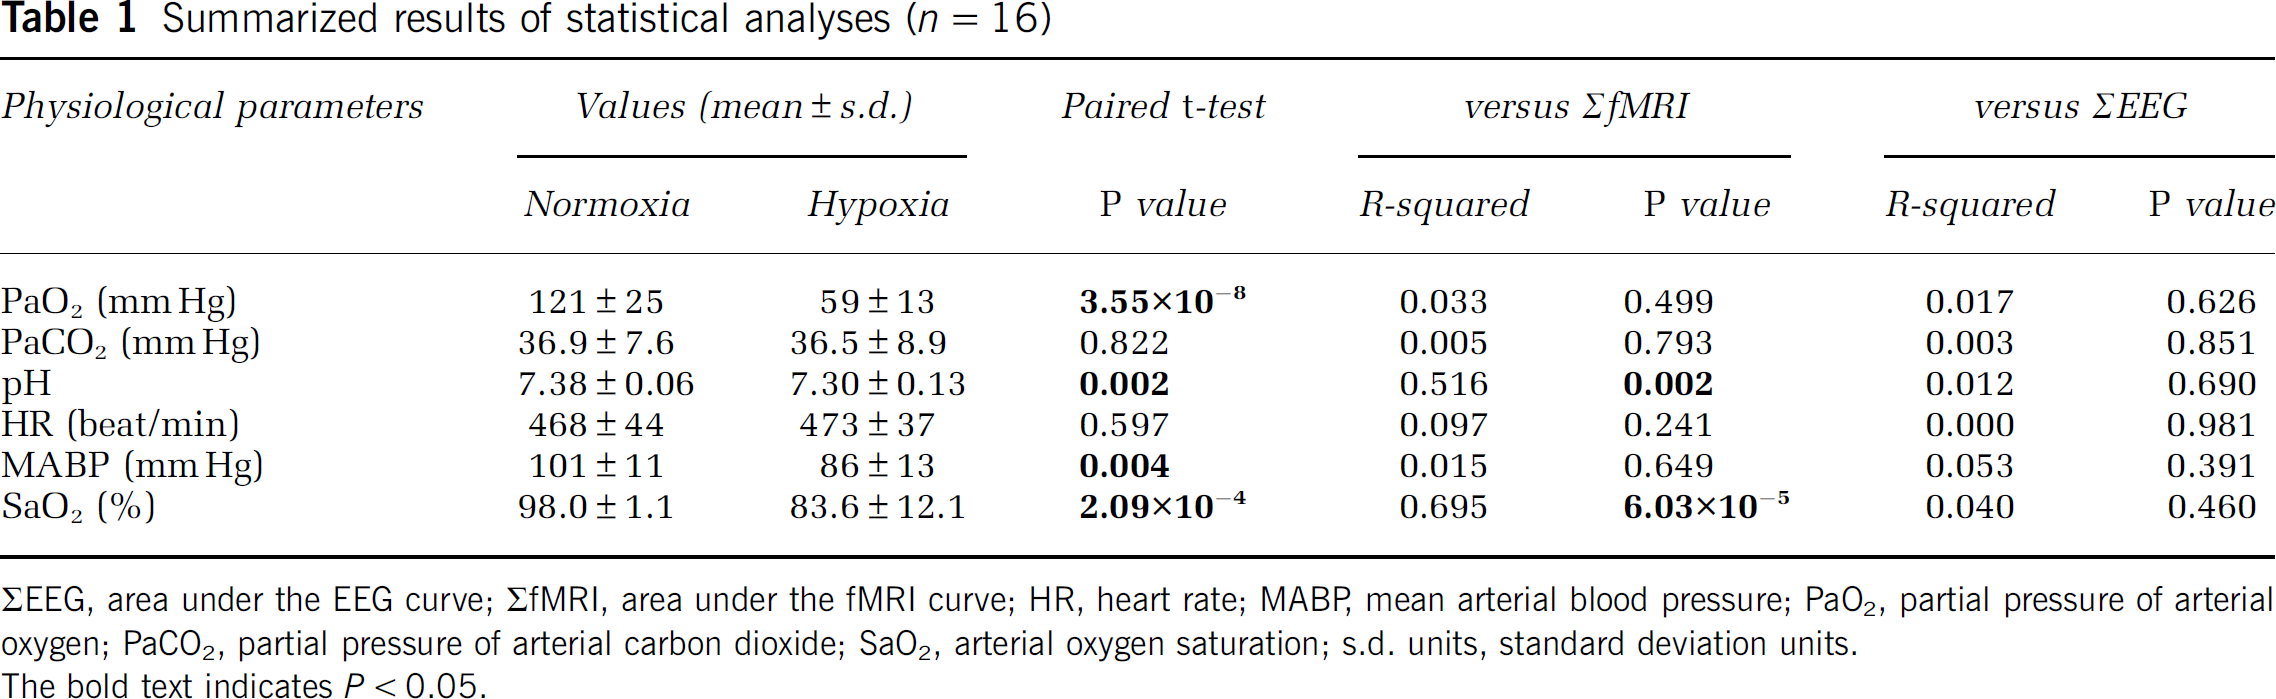
ΣEEG, area under the EEG curve; ΣfMRI, area under the fMRI curve; HR, heart rate; MABP, mean arterial blood pressure; PaO2, partial pressure of arterial oxygen; PaCO2, partial pressure of arterial carbon dioxide; SaO2, arterial oxygen saturation; s.d. units, standard deviation units.
The bold text indicates P<0.05.
(
Discussion
In this study, we investigated the influence of mild hypoxic hypoxia on fMRI responses during the electrical forepaw stimulation in α-chloralose-anesthetized rats while concurrently monitoring the EEG responses and several physiological parameters. Our findings are as follows: (1) the fMRI responses, but not the EEG responses, were significantly reduced under hypoxia; (2) PaO2, pH, MABP, and SaO2, but not PaCO2 and heart rate, were significantly reduced under hypoxia; (3) the changes in SaO2 and pH significantly correlated with the changes in the fMRI responses; and (4) the basal CBF was not influenced by hypoxia. Although the proper functioning of brain cells relies on an abundant supply of oxygen (Siesjö, 1978), recent studies have shown that mild hypoxic hypoxia (SaO2 >60%) appears to be well tolerated in terms of the neuronal responses under an event-related stimulation paradigm (whisker barrel cortex in rat: Lindauer et al, 2003; visual cortex in human: Tuunanen et al, 2006; and somatosensory cortex in rat: Takuwa et al, 2010). Such sustained neuronal activities could be interpreted in relation to the stable brain energy supply being used to power postsynaptic currents and action potentials. Siesjö and Nilsson (1971) reported that the tissue concentration of ATP, ADP, or AMP in postmortem brain samples remained unchanged until the PaO2 fell below 25 mm Hg. These results were later reproduced in vivo using 31P nuclear magnetic resonance spectroscopy in dogs (Nioka et al, 1990). Thus, it is not surprising that we observed no significant reduction in the EEG responses under mild hypoxic hypoxia. We believe that, except under severe hypoxia and/or ischemia, the neuronal responses (i.e., the neuronal workload in the sensory cortex during the event-related stimulation paradigm) remain unchanged and are independent of the level of hypoxia. Among the observed physiological parameters, PaO2, pH, MABP, and SaO2 showed a significant reduction under mild hypoxic hypoxia in α-chloralose-anesthetized rats. These results, especially for the MABP, were expected because Duong (2007) found that the MABP was markedly reduced in isoflurane-anesthetized rats under graded hypoxia but was maintained in awake rats, suggesting that the hypoxia-induced compensatory control of the systemic blood pressure was compromised by the anesthesia. However, the changes in the MABP were not significantly correlated with the changes in ΣfMRI in this study. Therefore, we conclude that the effects of changes in MABP on the fMRI responses were rather limited. In contrast, the changes in pH and SaO2 were significantly correlated with the changes in ΣfMRI. The increase/decrease of pH (i.e., H+ ion) has a vessel dilation/constriction effect in the rat cerebral arterioles due to changes in the membrane potential of the vascular smooth muscle cells (Dietrich and Dacey, 1994). Therefore, the fluctuations in pH may influence the basal CBF and/or cerebral blood volume. These findings may provide a rational explanation for the reduction in fMRI responses, such as those observed in hypercapnia (Zappe et al, 2008). Increased basal CBF could attenuate further fMRI responses. However, we believe that the effects of pH on the fMRI responses were limited for the following reasons: (1) we observed that the basal CBF was not influenced by hypoxia, implying that the values of pH under hypoxia (pH=7.30±0.13) were within the normal physiological range; (2) we have shown that the effects of pH on neurovascular coupling are less important than other physiological parameters under the same experimental set-up (Sumiyoshi et al, 2012); and (3) we cannot rule out the possibility of the concomitant effects of α-chloralose anesthesia, which is known to induce metabolic rather than respiratory acidosis (Shukla and Shukla, 1983), even though the detailed mechanism of H+ ion homeostasis is not clear. Therefore, the reduction in fMRI responses observed in this study is more likely attributable to the reduction of oxygen availability in the brain tissue. Attwell et al (2010) suggested that oxygen variations in the brain tissue modulate neurovascular coupling via the oxygen-dependent enzymatic synthesis of glial or neuronal messengers, such as nitric oxide, prostaglandin E2, and epoxyeicosatrienoic acids. Taking into account the Michaelis constant (nitric oxide, 350 μmol/L; prostaglandin E2, 10 μmol/L; and epoxyeicosatrienoic acids, <10 μmol/L) for brains in vivo (Attwell et al, 2010), nitric oxide seems to be more vulnerable than the other two messengers. Several pharmacological approaches combined with optical imaging of the oxygen concentration and/or pressure (Sakadzić et al, 2010) will help clarify the relative contribution of each messenger involved. There are a few limitations in this study. First, the off period of 40 seconds in the block-design paradigm may not be long enough for the fMRI signal to return to baseline, likely attenuating the response on the subsequent block. Mandeville et al (1998) reported that the poststimulus undershoot of the fMRI response in α-chloralose-anesthetized rats can persist up to 60 seconds after cessation of the electrical forepaw stimulation, indicating that the off period should be longer than 60 seconds. However, in this study, we did not find any significant reductions of the fMRI response in the subsequent block (analysis of variance, P>0.05, see Supplementary information). These results suggest that the undesirable effects of the relatively shorter off period on the subsequent block are limited. A possible explanation for the discrepancy with the literature is that the temporal stability of the fMRI signal could be compromised (i.e., the higher standard deviation in the temporal domain) in the presence of the EEG mini-cap (Sumiyoshi et al, 2011). The platinum electrodes, EEG paste, skin and wire loops may form an antenna that pick up external radio frequency energy and thus could lead to the temporal fluctuations in the observed fMRI signal. Second, we evaluated the time series of both the EEG and fMRI data using the area under curve, which includes both the positive and negative amplitudes. As for the components in the EEG response (P1, N1, and P2), Franceschini et al (2008) suggested that P1 originates in layer IV directly from thalamocortical afferents, while N1 and P2 originate in layers I and II and reflect the majority of local cortico-cortical interactions. As for the fMRI signal, the positive amplitude during the stimulation period reflects the increase in CBF, blood volume, and oxygen metabolism, while the poststimulus undershoot is attributable to the temporal mismatch between changes in CBF and blood volume, and not the oxygen metabolism (Mandeville et al, 1999). Therefore, we believe that the decomposition into positive and negative components in both the EEG and fMRI data could provide the detailed information necessary to understanding the mechanism behind the neurovascular coupling and/or uncoupling, but these issues are beyond the scope of this study. Third, the data from subjects that were under hypercapnic (i.e., PaCO2 >45 mm Hg) and hypocapnic (i.e., PaCO2 <25 mm Hg) conditions are included (see Supplementary information). In addition, the absolute changes in PaCO2 between normoxia and hypoxia conditions ranged from −15 to 10 mm Hg (see Supplementary information). These results suggest that the mechanical ventilation may not work properly due to the human error (i.e., the set-up of the ventilator) and thus lead to the nonisocapnic condition throughout the experiment. Duong (2007) found that CBF decreased monotonically with decreasing PaCO2 in spontaneously breathing rats under graded hypoxia, suggesting that the fluctuations in PaCO2 have an impact on the basal CBF as well as the event-related fMRI response (Zappe et al, 2008). However, we believe that the impacts of the changes in PaCO2 are limited in this study for the following reasons: (1) we did not find the significant differences in PaCO2 and basal CBF between normoxia and hypoxia conditions in the group comparison analyses; and (2) we did not find the significant relationship between the absolute changes in PaCO2 and ΣfMRI. Clearly, more studies are needed to validate the above-mentioned hypothesis; however, we believe that our findings provide novel insights into the relationship between oxygen availability and neurovascular coupling in vivo under physiological control and monitoring.
Footnotes
Acknowledgements
The authors would like to thank all of our colleagues at Tohoku University for their tremendous support.
Disclosure/conflict of interest
The authors declare no conflict of interest.