
Abstract
Accurate imaging of the ischemic penumbra is a prerequisite for acute clinical stroke research. T*2 magnetic resonance imaging (MRI) combined with an oxygen challenge (OC) is being developed to detect penumbra based on changes in blood deoxyhemoglobin. However, inducing OC with 100% O2 induces sinus artefacts on human scans and influences cerebral blood flow (CBF), which can affect T*2 signal. Therefore, we investigated replacing 100% O2 OC with 40% O2 OC (5 minutes 40% O2 versus 100% O2) and determined the effects on blood pressure (BP), CBF, tissue pO2, and T*2 signal change in presumed penumbra in a rat stroke model. Probes implanted into penumbra and contralateral cortex simultaneously recorded pO2 and CBF during 40% O2 (n = 6) or 100% O2 (n = 8) OC. In a separate MRI study, T*2 signal change to 40% O2 (n = 6) and 100% O2 (n = 5) OC was compared. Oxygen challenge (40% and 100% O2) increased BP by 8.2% and 18.1%, penumbra CBF by 5% and 15%, and penumbra pO2 levels by 80% and 144%, respectively. T*2 signal significantly increased by 4.56% ± 1.61% and 8.65% ± 3.66% in penumbra compared with 2.98% ± 1.56% and 2.79% ± 0.66% in contralateral cortex and 1.09% ± 0.82% and −0.32% ± 0.67% in ischemic core, respectively. For diagnostic imaging, 40% O2 OC could provide sufficient T*2 signal change to detect penumbra with limited influence in BP and CBF.
Introduction
Stroke is the second most common cause of death worldwide (Donnan et al, 2008) and a major cause of severe disability (Bonita et al, 1990). Determining potentially salvageable ischemic penumbra, hypoperfused brain tissue with preserved oxygen metabolism and an increased oxygen extraction fraction (OEF) (Astrup et al, 1981), is of key clinical importance. Early restoration of blood flow can lead to penumbral salvage and improved neurologic outcome in acute stroke patients (Christou et al, 2000). However, penumbral tissue has a limited lifespan and without timely intervention becomes incorporated into the irreversibly damaged ischemic core.
The amount and rate at which penumbra is lost varies widely among stroke patients. Consequently, dynamic brain imaging to accurately detect penumbra is crucial in providing key information regarding a patient's suitability for intervention therapies such as thrombolysis. A number of imaging techniques exist for identification of penumbra. Positron emission tomography characterizes penumbral tissue as hypoperfused but metabolically active tissue (Baron, 1999). For magnetic resonance imaging (MRI), the mismatch between the perfusion deficit (from perfusion-weighted imaging, PWI) and the irreversibly damaged ischemic core (from diffusion-weighted imaging, DWI) serves as a surrogate marker of penumbra (Baird et al, 1997). However, routine clinical use of these two imaging modalities is hampered by recognized economic (PET) and diagnostic (MRI) limitations (Heiss, 2010).
Our group are developing a novel MRI technique that uses a period of normobaric hyperoxia (oxygen challenge, OC) to detect penumbra (Santosh et al, 2008; Dani et al, 2010). T*2-weighted MRI combined with 100% O2 inhalation (OC) detects penumbra based on its increased OEF and consequent higher blood deoxyhemoglobin levels.
The T*2 OC technique is being translated for use on clinical scanners and has shown potential clinical utility in stroke patients (Dani et al, 2010). However, some limitations of using 100% O2 have been identified: 100% O2 produces artefacts around the air sinuses on human brain T*2 maps, which precludes analysis of brain regions anterior to the lateral ventricles. Given the heterogeneity of human stroke and varied vessel occlusion sites, it is important that the T*2 OC technique can detect penumbra throughout the brain. The technique uses blood oxygen level-dependent (BOLD) T*2-weighted imaging, which is influenced by a number of physiological factors. In addition to blood deoxyhemoglobin:oxyhemoglobin ratio, tissue pO2, cerebral blood volume (CBV), and cerebral blood flow (CBF) have all been shown to affect T*2 signal (Ramsay et al, 1993). Therefore, to improve the utility and accuracy of the T*2 OC technique, it is important to identify and minimize the influence of factors, other than tissue metabolism, on T*2 signal change. Consequently, we have investigated the potential to use lower levels of oxygen to induce OC to establish if ability to detect penumbra can be achieved while minimizing imaging artefacts.
In the present study, we have characterized the influence of 40% O2 on the following parameters in rats exposed to middle cerebral artery occlusion (MCAO): mean arterial blood pressure (MABP), CBF, pO2, MRI T*2 signal change in presumed penumbra, and contralateral cortex and compared this with the responses generated by 100% O2. The development of imaging techniques such as T*2 OC that more precisely identify penumbra on the basis of ongoing metabolism would greatly aid in improving patient selection for thrombolysis and patient recruitment into clinical trials of new therapeutic agents.
Materials and methods
All experiments were performed under a UK Home Office license and were subject to the Animals (Scientific Procedures) Act, 1986. Male Sprague-Dawley rats (300 to 350 g Harlan, UK) had free access to food and water and were maintained on a 12-hour light–dark cycle.
Model of Middle Cerebral Artery Occlusion
Isoflurane in N2O:O2 (70%:30%) was used for induction (5%), surgery (2.5% to 3%), and maintenance (2% to 2.5%) of anesthesia. N2O:O2 was replaced with medical air supplemented with ~5% O2 (26% O2) following surgery. Animals were artificially ventilated and body temperature maintained at 37°C. Femoral arteries were cannulated for MABP measurement and blood gas analysis. Mean arterial blood pressure and heart rate were continuously recorded (AcqKnowledge, Biopac Systems, CA, USA). Middle cerebral artery occlusion was induced with an intraluminal filament (Longa et al, 1989). A 3.0 uncoated nylon monofilament (0.2 to 0.25 mm in diameter) with a heat-induced bulb at the tip (~0.3 mm in diameter), was advanced along the left internal carotid artery for ~20 to 21 mm from the bifurcation of the external carotid artery. Successful MCAO was confirmed from CBF data or histology postmortem. Sham rats had carotid arteries exposed but no filament introduced.
Experimental Protocol
In study 1, animals were randomly assigned to one of four hyperoxic groups for measurement of brain tissue O2 (pO2) and relative CBF (rCBF) measurement during OC: 40% O2 sham (n = 6), 40% O2 MCAO (n = 6), 100% O2 sham (n = 8), or 100% O2 MCAO (n = 8). In study 2, animals were randomly assigned to two hyperoxia groups for MRI T*2 OC studies: 40% O2 MCAO (n = 6), 100% O2 MCAO (n = 6). Approximately 90 minutes after MCAO or sham procedure, animals were exposed to OC. Arterial blood samples were collected for blood gas analysis immediately before the 5-minute baseline and toward the end of the hyperoxic challenge (approximately
Study 1
Stereotaxic surgery: Magnetic resonance imaging PWI/DWI mismatch scans from a previous study were used to calculate stereotaxic coordinates for Oxylite/Oxyflo (Oxford Optronics, Oxford, UK) optode measurement of tissue oxygen levels and rCBF within cortical penumbra (Figure 1A). Rats were secured in a stereotaxic frame (Kopf Instruments, Tujunga, CA, USA), the skull exposed, and Oxylite/Oxyflo optodes implanted into presumed penumbra and contralateral cortex at 0.5 mm anterior and 2 mm lateral to bregma, depth 2.5 mm (retracted 0.5 mm to reduce pressure around the probe tip).
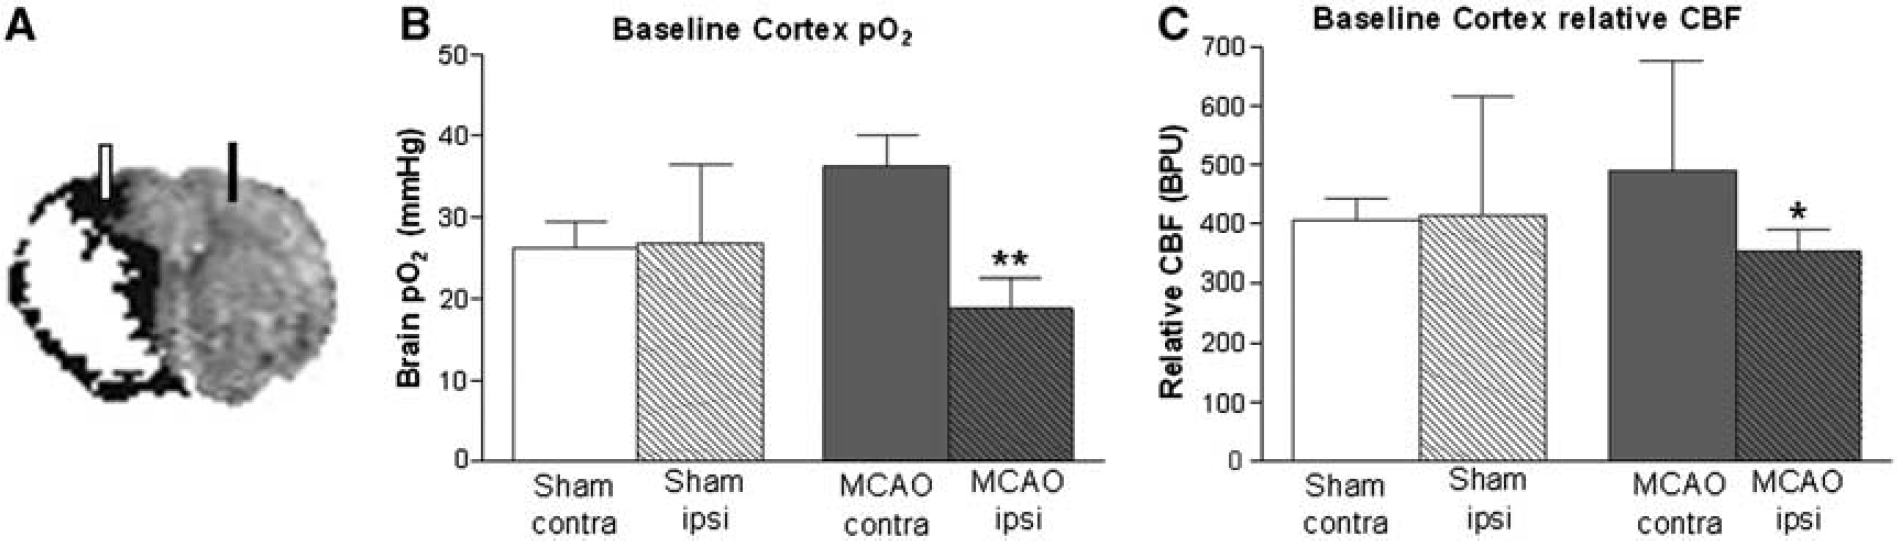
Representative composite magnetic resonance imaging (MRI) image revealing position of optodes in relation to penumbra (black). Ischemic injury (diffusion-weighted imaging (DWI), white) superimposed onto perfusion deficit (perfusion-weighted imaging (PWI), black) reveals PWI/DWI mismatch (presumed penumbra) ~90 minutes post-middle cerebral artery occlusion (MCAO); baseline tissue pO2 (
Measurement of tissue pO2 and relative cerebral blood flow: Dual Oxylite/Oxyflo optodes simultaneously measure brain tissue pO2 and rCBF from the same brain region. The Oxylite probe measures the partial pressure of tissue oxygen based on the principle of fluorescence quenching (Collingridge et al, 1997) and the Oxyflo probe records rCBF via laser Doppler flowmetry (http://www.oxford-optronix.com/combinedsys.htm). Precalibrated, stereotaxically implanted optodes detected the effect of OC (40% O2 or 100% O2) on tissue oxygenation and rCBF in presumed penumbra and contralateral cortex following MCAO. Optodes were left to stabilize for 30 minutes following implantation before making measurements.
Histology: At the end of the Oxylite/Oxyflo recording period, animals were culled by anesthetic overdose, the brain removed and placed in isopentane (−35°C) for 15 minutes. Coronal cryostat sections (30 μm) were collected within MCA territory and stained with hematoxylin and eosin to confirm correct optode placement. Anatomical location of optodes was identified using light microscopy at × 20 magnification.
Study 2
Magnetic resonance imaging scanning: Magnetic resonance imaging was performed on a Bruker Biospec 7-T/30-cm system with a gradient coil (internal diameter 121 mm, 400 mT/m) and a 72-mm birdcage resonator. An actively decoupled linear surface receiver coil (2 cm diameter) was used for brain imaging. After MCAO surgery, animals were placed in a rat cradle, with the head secured by ear and tooth bars to limit movement and the surface coil placed above the head.
The paradigm for T*2-weighted OC was 5 minutes air ventilation, 5 minutes 40% O2 (n = 6) or 100% O2 (n = 6), followed by a return to air ventilation. The T*2 sequence used was a single shot, gradient echo (echo planar imaging) sequence (TE: 20 milliseconds, TR: 10 seconds, matrix 96 × 96, field of view: 25 × 25 mm, eight contiguous slices, 1.5 mm thick, two averages, temporal resolution 20 seconds, 75 repetitions). Two coronal slices within MCA territory were selected for analysis.
Images of penumbra, defined using the alternative PWI–DWI mismatch technique, were prepared for comparison with T*2-defined penumbra using the following sequences: DWI (spin-echo planar imaging TE: 43 milliseconds, TR: 4,000 milliseconds, in plane resolution 260 μm, three directions: x, y, z, B values: 0, 1,000 s/mm2, 8 × 1.5 mm thick slices) and PWI using a form of pseudo-continuous ASL (Moffat et al, 2005): (echo planar imaging module, TE: 20 milliseconds, TR: 7,000 milliseconds, matrix 96 × 96, field of view: 25 × 25 mm, slice thickness 1.5 mm, 16 averages, four shots) preceded by 50 hyperbolic secant inversion pulses in a 3-second train.
Image analysis: T*2 OC percentage signal change maps were generated using Image J software (http://rsb.info.nih.gov/ij/). Penumbral tissue was defined by thresholding T*2 signal change maps to two s.d. above the mean contralateral signal. T*2 signal change was also analyzed in regions of interest (ROIs). T*2 OC percentage signal change was taken as the peak signal during OC and expressed as a percentage of the mean signal during baseline.
Regions of interest: Circular ROIs were selected according to specific features on the images. To ensure placement solely within the areas of interest and uniformity in ROI size, ROIs were chosen manually (spanning 80 pixels). Magnetic resonance imaging-based ROIs were defined and placed within (1) ischemic core in caudate nucleus within the thresholded apparent diffusion coefficient (ADC) lesion; (2) its mirror contralateral region manually designated by researcher; (3) penumbra as defined by thresholded T*2 percentage signal change; and (4) its mirror contralateral cortex region. The ROIs were selected and analyzed on two coronal slices within the MCA territory. The value for T*2 percentage signal change for each ROI was then averaged over the two slices.
Statistical Analysis
Statistical analysis was performed using GraphPad Prism (Version 4.03, San Diego, CA, USA). Data are presented as mean ± s.d. Comparison of physiological variables before and during OC, rCBF and pO2 between ipsilateral and contralateral cortex and T*2 signal change intensities between penumbra, contralateral cortex, and ischemic core were assessed using a two-tailed paired Student's t-test. Data from different groups were assessed using a two-tailed unpaired Student's t-test. P < 0.05 was considered statistically significant.
Results
Study 1: Changes in Tissue pO2 and Relative Cerebral Blood Flow During Oxygen Challenge
Mortality and exclusions: In the 100% O2 sham group, one animal died under procedure. Postmortem analysis revealed a mucus plug in the tracheal tube as the likely cause of death. Exclusion criteria covered incorrect placement or evidence of hemorrhage around the optode tip, determined from histological sections. Two animals in the 100% O2 MCAO group were excluded. In one animal, pO2 recordings were uncharacteristically low and a large cortical hemorrhage was found around the ipsilateral optode, which would have severely impacted on recording accuracy. In the other, the ipsilateral optode was incorrectly positioned (striatum).
Baseline brain pO2 and relative cerebral blood flow: Under air ventilation, basal brain pO2 was 47% lower (P < 0.0005) and rCBF 28% lower (P < 0.05) in ipsilateral cortex (presumed penumbra) compared with contralateral cortex in MCAO rats (n = 14; Figures 1B and 1C). There was no hemispheric difference in baseline brain pO2 or rCBF in shams (n = 14).
Oxygen challenge-induced changes in physiological parameters: Pre-OC, blood gases, pH, and MABP did not differ significantly between groups (Table 1).
Physiological parameters before (baseline) and during oxygen challenge (OC)
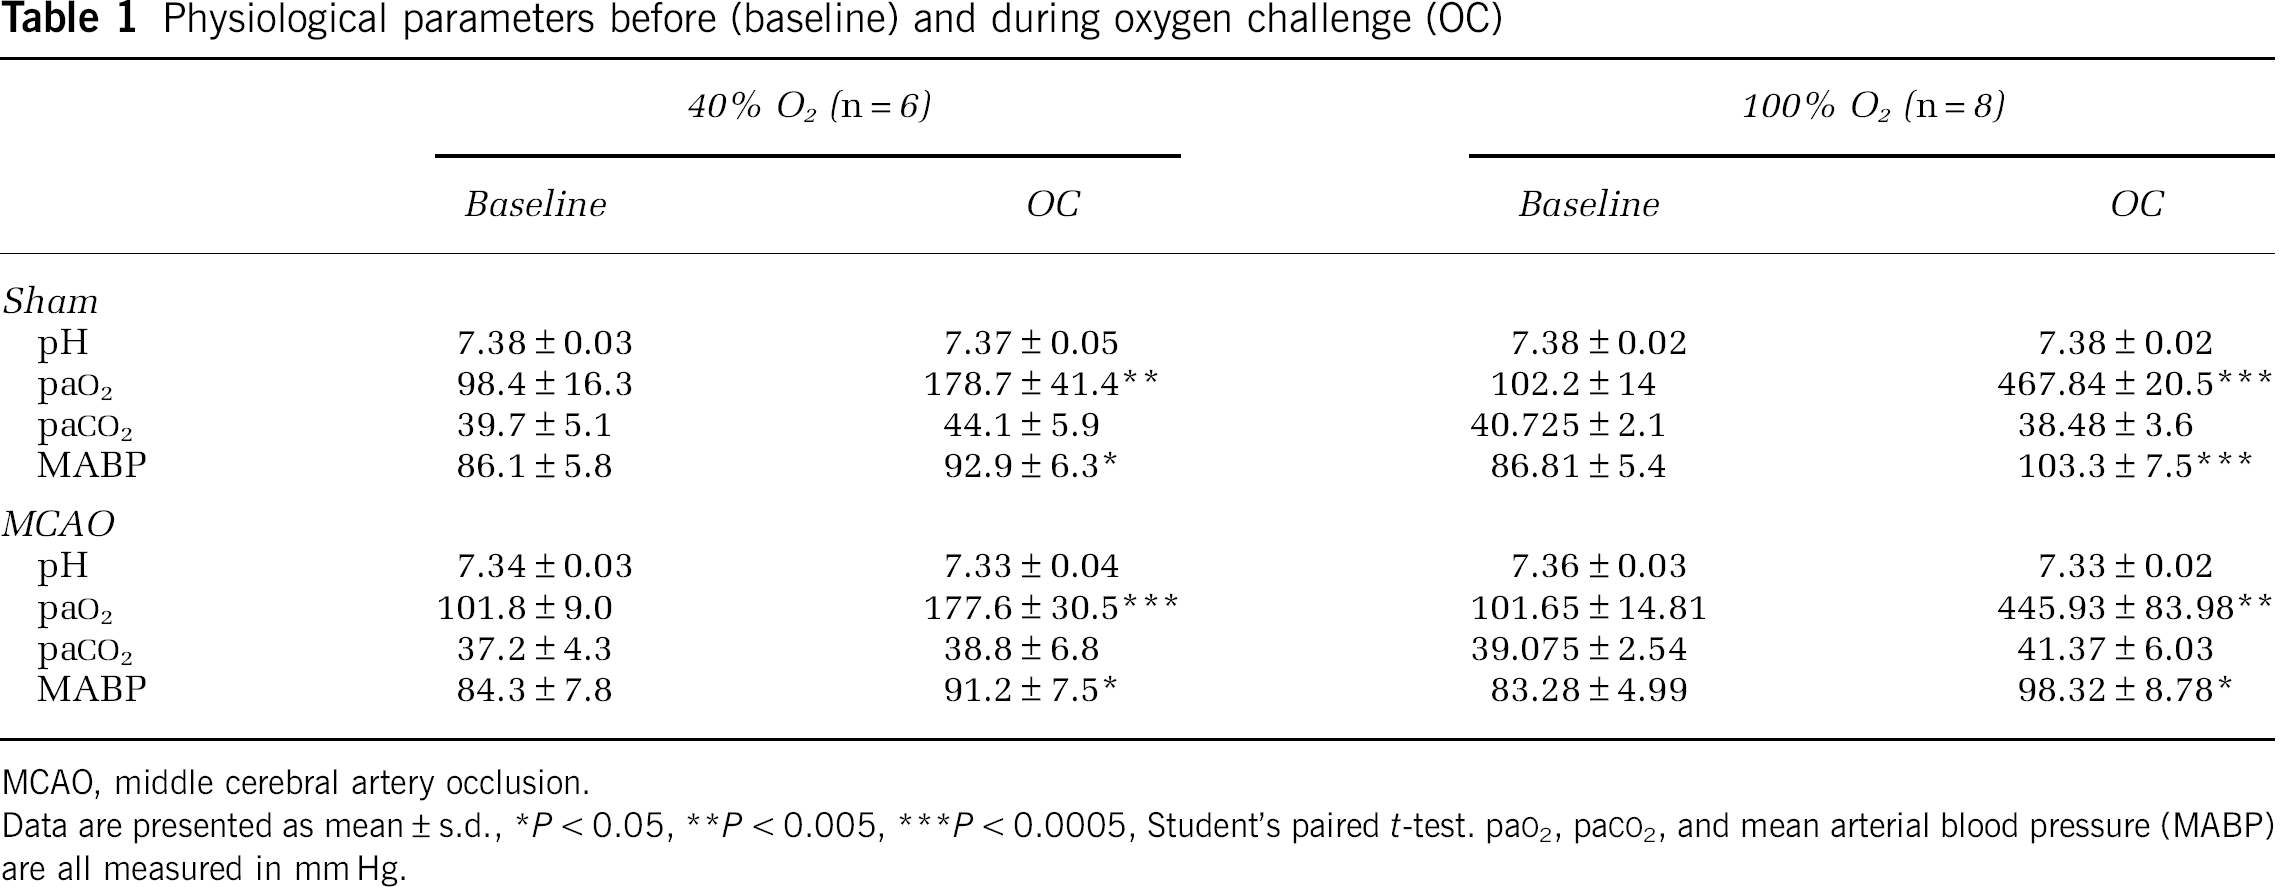
MCAO, middle cerebral artery occlusion.
Data are presented as mean ± s.d., *P < 0.05, **P < 0.005, ***P < 0.0005, Student's paired t-test. paO2, paCO2, and mean arterial blood pressure (MABP) are all measured in mm Hg.
Oxygen challenge, started 90 minutes post-MCAO, significantly increased arterial paO2 in sham and MCAO rats: 40% O2 by 83% ± 44% and 74% ± 18%; and 100% O2 by 363% ± 48% and 337% ± 57%, respectively. No significant changes in pH or paCO2 were detected during OC in any group.
Oxygen challenge transiently increased MABP in sham and MCAO rats: 40% O2 by 8% ± 5% and 8% ± 6%, and 100% O2 by 19% ± 8% and 19% ± 15%, respectively (Table 1; Figure 2A).
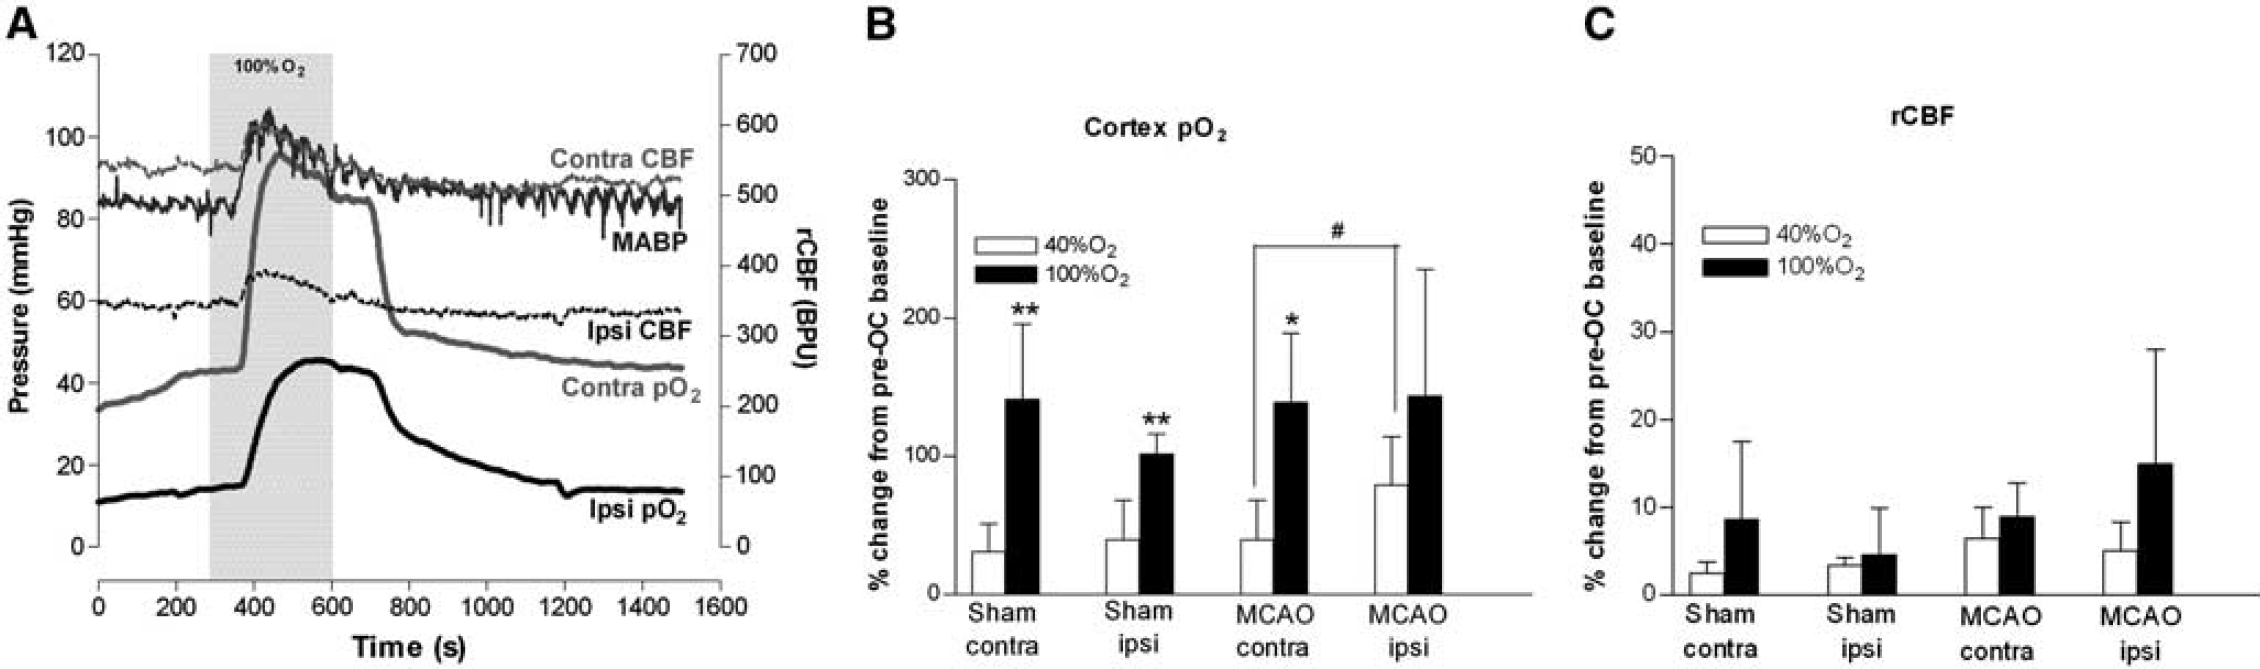
Representative traces of mean arterial blood pressure (MABP), presumed penumbra (ipsilateral) and contralateral cortex pO2 and relative cerebral blood flow (rCBF) from a middle cerebral artery occlusion (MCAO) rat during oxygen challenge (OC) (shaded box); (
Effect of oxygen challenge on cortical pO2: Brain pO2 levels increased markedly and remained elevated during 100% O2 OC (Figure 2A). Responses to 40% O2 were smaller in magnitude with a similar time course (data not shown).
The magnitude of increases in cortical pO2 to 100% O2 were similar across hemispheres and between groups with penumbral pO2 increased above control baseline levels (Table 2; Figure 2B). With 40% O2, cortical pO2 was significantly increased in both hemispheres of sham animals and the contralateral hemisphere of MCAO rats. Penumbral pO2 in MCAO rats was increased, bringing it to a value equivalent to baseline (sham) values and not statistically different from baseline MCAO contralateral values (Table 2). With 40% O2 the greatest percentage increase in pO2 was recorded in penumbra (MCAO ipsi, P < 0.05, versus contralateral cortex).
Effect of OC on cortex pO2 (mm Hg)
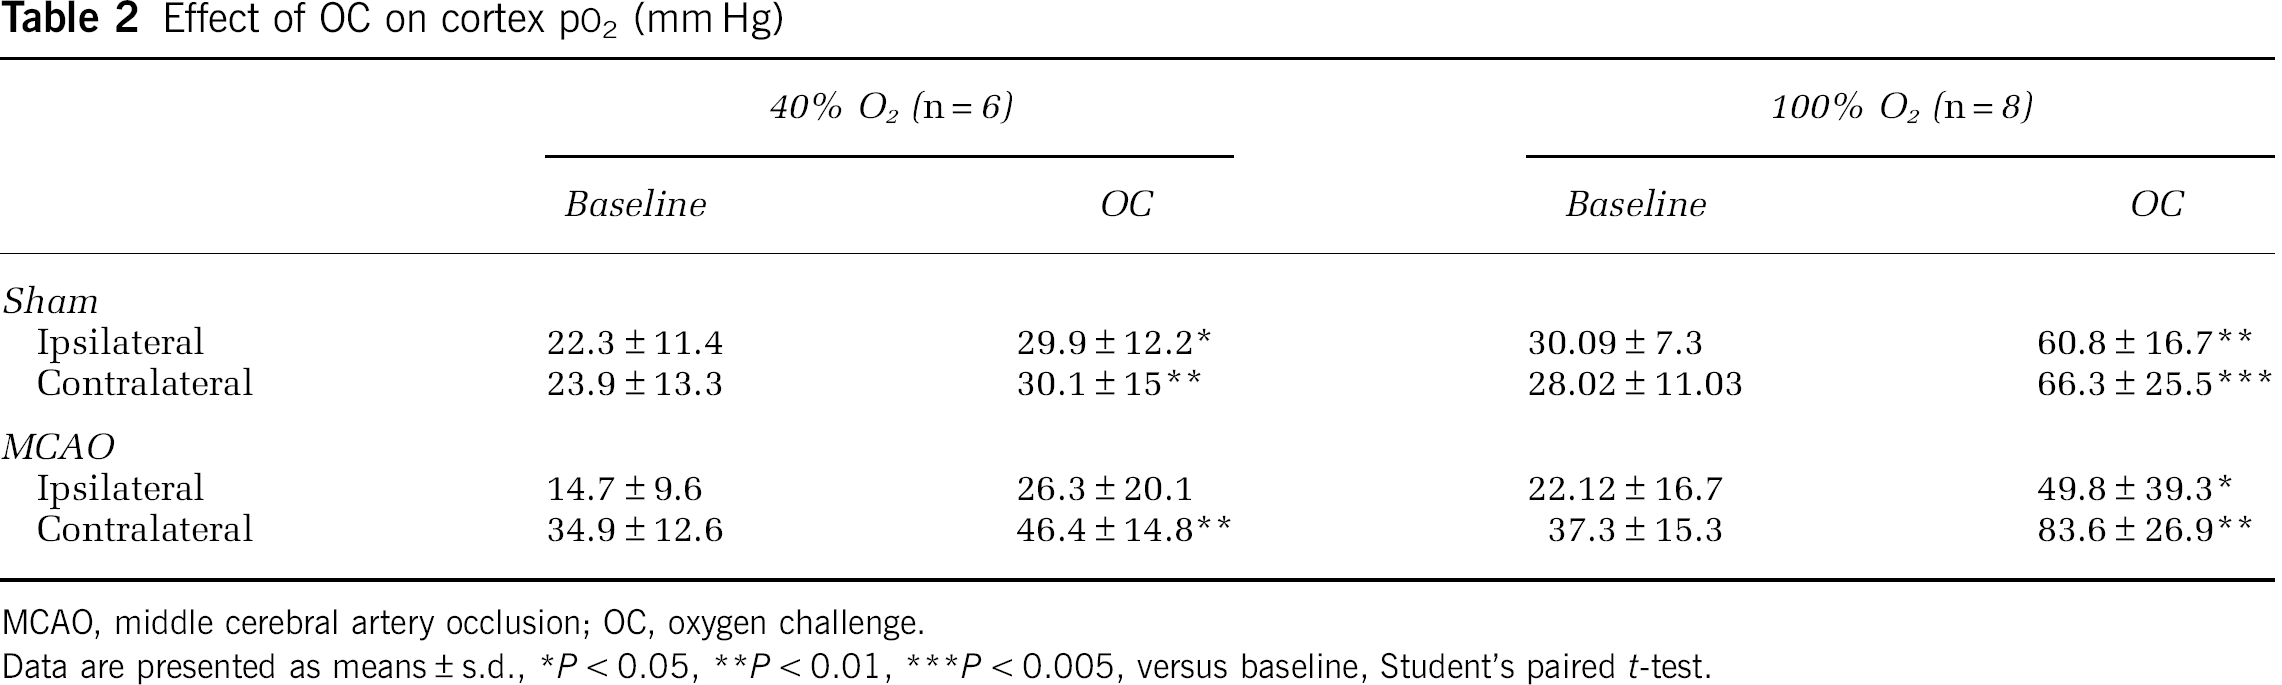
MCAO, middle cerebral artery occlusion; OC, oxygen challenge.
Data are presented as means ± s.d., *P < 0.05, **P < 0.01, ***P < 0.005, versus baseline, Student's paired t-test.
Effect of oxygen challenge on relative cerebral blood flow: Oxygen challenge induced small, transient changes in rCBF in all groups relative to pre-OC values (Figures 2A and 2C). With 100% O2, this reflected an increased rCBF in 6/8 sham rats, no change in 1/8 shams, reduced rCBF in 1/8 shams and an increased rCBF in all MCAO rats. Mean increases from pre-OC baseline were 9% ± 4% and 15% ± 13%, in contralateral and ipsilateral cortex of MCAO rats, respectively (Figure 2C). With 40% O2, OC induced smaller, nonsignificant increases in rCBF (Figure 2C).
Study 2: T*2 Percentage Signal Change to Oxygen Challenge
Oxygen challenge (100% O2 and 40% O2) induced increases in T*2 signal, which were greatest in magnitude in dorsolateral cortex corresponding approximately to penumbra as defined by PWI/DWI mismatch (Figure 3C) and in large veins. 100% O2 induced a greater T*2 signal change in penumbra (P < 0.05) but the signal achieved with 40% O2 was sufficient to discriminate penumbra from surrounding tissue on thresholded T*2 maps (Figure 3C). For 100% and 40% O2 OC, the T*2 signal change was greater in penumbra (8.65% ± 3.66% and 4.56% ± 1.61%, respectively) than in ischemic core (−0.32% ± 0.67% and 1.09% ± 0.82%, respectively, P < 0.005 for both 100% O2 and 40% O2 groups) and contralateral cortex (2.79% ± 0.66% and 2.98% ± 1.56%, respectively, P < 0.05 for both 100% O2 and 40% O2 groups). The smaller changes in T*2 signal in the ischemic core and contralateral hemisphere were of similar magnitude for 100% O2 and 40% O2 (Figure 3B).
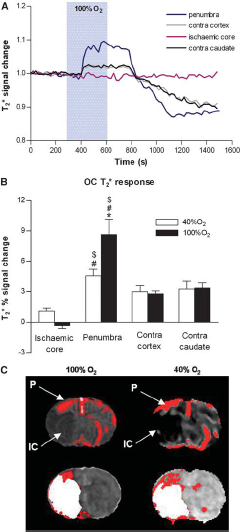
Representative trace of time course of T*2 signal change in penumbra, ischemic core, equivalent contralateral cortex, and contralateral caudate nucleus during oxygen challenge (OC). (
Discussion
Imaging of the moderately hypoxic, hypoperfused yet metabolically active penumbra is of key importance when determining a patient's suitability for intervention therapies such as thrombolysis, which carries a risk of hemorrhage. Accurate assessment of penumbral tissue will also be required for future drug trials so that only patients who stand to benefit from treatment are recruited. Detection of oxidative metabolism from transient administration of an OC combined with T*2-weighted imaging, represents a novel noninvasive method of imaging penumbra with potential clinical utility in acute stroke (Santosh et al, 2008; Dani et al, 2010). Oxygen extraction fraction is increased in the hypoperfused penumbra, resulting in a higher deoxy/oxyhemoglobin ratio in the blood. The reduction of deoxyhemaglobin during an OC produces an increase in T*2 signal in penumbra, which is significantly greater than in surrounding tissue, allowing it to be detected on T*2 signal change maps (Figure 3C). However, using 100% O2 gives rise to artefacts within the brain (frontal lobes) in human scans due to increased susceptibility effects from the paragmanetic oxygen within the nasal passages and the paranasal sinuses (Dani et al, 2010). In addition, inhalation of 100% O2 can influence cerebral hemodynamics, which could confound interpretation of tissue metabolism using T*2 signal change (Corfield et al, 2001). Consequently, we have investigated the possibility of using lower levels of oxygen to detect penumbra using OC T*2-weighted MRI and compared pO2 and CBF responses with 40% and 100% O2 OC in penumbra and contralateral cortex.
With a 40% O2 OC, the T*2 signal change in penumbral tissue was significantly greater than in ischemic core and nonischemic cortex, allowing penumbra detection on thresholded T*2 percentage signal change maps. Transient cardiovascular and cerebrovascular effects of OC were also reduced compared with 100% O2 OC (Table 1 and Figure 2C).
To our knowledge, this is the first report of simultaneous CBF and tissue oxygenation recording in presumed penumbra during hyperoxia. Inhalation of 100% O2 increased BP in anesthetized rats in agreement with a previous report (Lu et al, 2009), and this was matched by a transient increase in rCBF in ischemic and nonischemic cortex. In nonischemic brain, 100% O2 is reported to induce vasoconstriction causing a 4% to 15% reduction in CBF in humans and rats (Lu et al, 2009; Bulte et al, 2007; Shin et al, 2007). This is due in part to decreased paCO2 as well as a direct effect on the cerebral vasculature. In the current study, OC (100% O2)-induced increases in CBF in nonischemic cortex were transient in nature and most likely a consequence of the rapid increase in MABP, which occurred when gases were switched from air to 100% O2 (Figure 2A). Mean arterial blood pressure and rCBF responses followed similar time courses and returned to baseline within the 5-minute time period of OC. This is in contrast to the T*2 response, which remained elevated throughout the OC. These cardiovascular and cerebrovascular responses to gas switching were reduced when the hyperoxia level was reduced to 40% O2 (8% and 5% of baseline, respectively). It is possible that if the hyperoxia challenge had been extended beyond 5 minutes, we may have observed a subsequent decrease in CBF in nonischemic tissue as reported by Liu et al (2006) and Lu et al (2009). However, not all papers report hyperoxia-induced reductions in CBF. Shin et al (2007) did not detect a reduction in CBF to 100% O2 in nonischemic tissue of MCAO mice, although they did detect a 9% reduction in sham mice.
Hyperoxia can have opposite effects on CBF in oligemic tissue, increasing CBF in penumbra in rodents and humans (Liu et al, 2006; Shin et al, 2007; Singhal et al, 2002, 2005). Our data are consistent with these reports, showing a 5% and 15% increase in penumbral CBF during 40% O2 and 100% O2 OC, respectively. However, the observed increases were transient in nature, following a similar profile and time course to nonischemic tissue and the OC-induced increase in BP (8% and 19%, respectively; Figure 2A; Table 1).
Penumbral pO2 was increased by 79% and 144% from pre-OC baseline values in animals breathing 40% O2 and 100% O2, respectively. In experiments using 40% O2, the percentage increase in tissue pO2 was comparatively greater in the penumbra (MCAO ipsi, 79%) than in other regions examined (MCAO contra, 35%; sham ipsi, 40%; sham contra, 31%), with tissue oxygen levels in the penumbra approaching control baseline values (Figure 2B; Table 2). During 100% O2 inhalation, the percentage increase in penumbral pO2 was similar to that in other brain regions examined (Figure 2B), with penumbral pO2 levels exceeding the baseline values recorded in sham and contralateral MCAO (Table 2).
With the Oxylite Oxyflo system, baseline pO2 measurements in nonischemic hemispheres of the different groups ranged from 24 to 37 mm Hg. This could be due to small regional differences in optode placement or the oxygen-dependent fluorescence quenching abilities of the optode being affected by tissue trauma following insertion. The optode sample volume (0.25 to 0.35 m3) is also comparatively smaller than for other tissue oxygenation monitoring methods (O'Hara et al, 2005). Despite this, our baseline pO2 values were not significantly different between groups and were similar to those published by others using the same method (O'Hara et al, 2005).
The increased BOLD T*2 MRI signal to hyperoxia is derived from blood deoxy/oxyhemoglobin ratio, CBF, CBV, and cerebral metabolic rate of oxygen (Corfield et al, 2001; Lu et al, 2009). The T*2 OC technique is based on the premise that hyperoxia will lead to an amplified BOLD T*2 signal within the hypoxic penumbra, due to its increased OEF (Heiss, 2000; Baron, 1999) and greater deoxyhemoglobin/oxyhemoglobin ratio compared with nonischemic tissue. Thresholded maps reveal a region of high T*2 signal change in the dorsolateral cortex, corresponding approximately to penumbra, as defined by PWI/DWI mismatch (Figure 3C). Although the magnitude of the T*2 signal change was smaller using 40% O2, the signal was significantly greater in penumbra than in ischemic core and control (contralateral) cortex, showing the ability to identify penumbra on thresholded T*2 maps using lower levels of O2 (Figure 3C).
As the BOLD MRI signal is also sensitive to changes in CBF and CBV (Corfield et al, 2001; Lu et al, 2009), it was important to consider changes in these parameters during OC to confirm that they did not confound interpretation of T*2 signal change. As mentioned above, Oxylite/Oxyflo probes detected small, transient increases in penumbral CBF during both hyperoxic regimes (5% and 15% for 40% O2 and 100% O2 OC, respectively). Published studies using hypercapnia to increase CBF provide information on the contribution a change in CBF has on the BOLD signal (Rostrup et al, 2000; Lu et al, 2009). Increasing CBF increases the size of the BOLD signal, nonlinearly (Kruger et al, 2000; Miller et al, 2001). In the anesthetized rat, hypercapnia (5% CO2) induces ~60% increase in cortical CBF, which leads to ~2% change in the BOLD signal from baseline in this region (Lu et al, 2009). In the current study, the T*2 signal increase with OC in cortical penumbral tissue was ~9% and 5% with associated transient CBF increases of 15% and 5% for 100% and 40% O2 OC, respectively. Using the data from Lu et al as a reference, and assuming a linear response, this would suggest the hyperoxia-induced CBF increase could be responsible for ~0.5% (100% O2) and ~0.2% (40% O2) of the increase in the BOLD T*2 signal during OC. Cerebral blood flow therefore appears to account for a small (4% to 6%) component of the absolute T*2 response to hyperoxia in penumbra. We acknowledge that this calculation represents an approximation and is based on a number of assumptions. Indeed, Kruger et al (2000) and Miller et al (2001) have shown that the BOLD signal as a function of CBF is nonlinear, showing decreasing slope with increasing CBF. Hence, the above calculation is likely to overestimate rather than underestimate the CBF contribution to the response. It is therefore unlikely that the small, transient flow augmentations observed in our study had a significant confounding effect on penumbra detection using the T*2 OC technique. Even when correcting for such effects, the increased T*2 signal to 40% O2 OC allowed penumbra to be clearly delineated from ischemic core and nonischemic tissue on T*2 maps. Furthermore, time course data from this study display a sustained T*2 signal increase during OC, which more closely matched the cortical pO2 time course than the rCBF time course (Figures 2A and 3A).
The T*2 signal time course data also reveal a post-OC undershoot once hyperoxia was discontinued, which was most pronounced in penumbra (Figure 3A). The physiological basis for this is not yet clear. One possible explanation is that on switching back to normoxic conditions, there is a reduction in CBF and/or CBV, giving rise to an increase in tissue OEF. This would lead to an increase in the deoxy/oxyhemoglobin ratio and a consequent decrease in T*2 signal. Within the penumbra, OC could lead to a resumption of aerobic metabolic activity with increased extraction of oxygen from hemoglobin and a consequent reduction in T*2 signal. However, further studies are required to elaborate on this.
In the clinical setting, before recanalization, the T*2 response to OC should be greatest in penumbra when compared with nonischemic tissue or ischemic core, thereby making it possible to delineate this salvageable tissue. Displacement of an arterial occlusion or partial spontaneous thrombolysis may give rise to recovery of flow and penumbra salvage, reperfusion of irreversibly damaged ischemic core, or areas of luxury perfusion, where oxygen delivery exceeds the oxygen requirements of the tissue. In viable penumbra tissue, reperfusion will restore oxygen delivery to the tissue, OEF should return toward normal levels and deoxy/oxyhemoglobin ratio in the blood should reduce. Therefore, the OC T*2 response in reperfused penumbra should return to levels similar to nonischemic cortex. Reperfusion of irreversibly damaged ischemic core will result in oxygen delivery to tissue that is no longer metabolic. If there is no uptake of oxygen, hemoglobin within the blood will remain in the oxyhemoglobin form. Further introduction of oxygen during OC should therefore either have a minimal effect on T*2 or decrease T*2 in ischemic core. In tissue with luxury perfusion, again supply of oxygen will exceed demand so T*2 should display minimal change during OC.
In conclusion, hyperoxia is inexpensive, readily available and easily administered as an OC during MRI scanning. Combined with BOLD T*2-weighted imaging it could deliver a novel mode of metabolic imaging in acute stroke. Our data show that a 40% O2 and 100% O2 OC induce a stepwise increase in penumbra pO2 and MRI T*2 signal allowing delineation of this tissue compartment from the surrounding tissue. Cerebral blood flow increases to OC were transient, small and unlikely to confound the ability of the BOLD T*2 signal to identify penumbra based on oxygen extraction. Susceptibility artefacts limit the utility of 100% O2 but 40% O2 appears effective in distinguishing different metabolic compartments within hypoperfused tissue. Human studies, using 40% O2 in combination with T*2 MRI, are now required to confirm its diagnostic capabilities.
Footnotes
The authors declare no conflict of interest.