
Abstract
Arterial spin labelling (ASL) can noninvasively isolate the MR signal from arterial blood water that has flowed into the brain. In gray matter, the labelled bolus is dispersed within three main compartments during image acquisition: the intravascular compartment; intracellular tissue space; and the extracellular tissue space. Changes in the relative volumes of the extracellular and intracellular tissue space are thought to occur in many pathologic conditions such as stroke and brain tumors. Accurate measurement of the distribution of the ASL signal within these three compartments will yield better understanding of the time course of blood delivery and exchange, and may have particular application in animal models of disease to investigate the relationship between the source of the ASL signal and pathology. In this study, we sample the transverse relaxation of the ASL perfusion weighted and control images acquired with and without vascular crusher gradients at a range of postlabelling delays and tagging durations, to estimate the tricompartmental distribution of labelled water in the rat cortex. Our results provide evidence for rapid exchange of labelled blood water into the intracellular space relative to the transit time through the vascular bed, and provide a more solid foundation for cerebral blood flow quantification using ASL techniques.
Keywords
Introduction
Arterial spin labelling (ASL) MRI (Detre et al, 1992) is increasingly being used to measure cerebral perfusion noninvasively with good spatial and temporal resolution (Thomas et al, 2000). Perfusion is defined as the rate of delivery of blood to the capillary bed. This nutritive supply is essential to maintain healthy tissue and is an important indicator of viability and function; accurate measurement is of great utility in the study and diagnosis of acute and chronic brain disorders. In ASL, a bolus of arterial blood is magnetically labelled in the feeding arteries and then imaged in the brain. Though such measurements are most commonly used to estimate the rate of delivery of blood to the capillaries, the labelled bolus of arterial blood water becomes distributed between several cerebral and vascular compartments before image acquisition. In gray matter, these can be broadly separated into three main compartments: (i) the intravascular (IV—arterioles, capillaries, venules) compartment; (ii) the extravascular, intracellular (IC) tissue space; (iii) the extravascular, extracellular (EC) tissue space. Changes in the relative volume of the extra- and intracellular tissue space (EC relative to IC) are thought to occur in many common pathologic conditions such as stroke (Moseley et al, 1990) and brain tumors (Bakay, 1970). Noninvasive estimation of this parameter using MRI may lead to a better understanding of disease processes. Earlier studies have observed multiexponential transverse (T2) decay in skeletal muscle, attributing the slow relaxation component to the extracellular space (Belton et al, 1972; Hazlewood et al, 1974; Gambarota et al, 2001). Further studies provide evidence that the transverse decay of extravascular rat brain tissue is biexponential due to a marked difference between the T2 of the IC (fast transverse relaxation) and EC (slow transverse relaxation) compartments (Haida et al, 1987; Matsumae et al, 2003; Lascialfari et al, 2005). Another study observed slow exchange between the IC and EC space in the in vivo rat brain relative to the timescale of T2 measurement (Quirk et al, 2003). In Matsumae et al (2003), the volume of the extracellular space, as estimated from the T2 relaxation curve, was found to be in good agreement with electron microscopy imaging experiments. In this current work, we measure the transverse decay of the ASL perfusion-weighted signal to estimate the origin (EC relative to IC) of nutritive blood flow-related signal that has exchanged into the tissue. Such measurements could lead to better understanding of the time course of blood delivery and exchange and may have particular application in animal models of disease to investigate the relationship between the IC/EC origin of the ASL signal and pathology.
The distribution of ASL-labelled water within the three compartments during image acquisition will also have direct implications for cerebral perfusion quantification. For example, perfusion may be overestimated by standard quantification methods if a significant proportion of the tagged spins reside in the intravascular compartment, as this blood may still be in transit to its eventual location for oxygen and nutrient delivery and exchange (Silva et al, 1997a). Several studies have attempted to address this uncertainty by estimating the proportions of labelled spins in the vascular space relative to the tissue space (IV relative to (EC+IC)) using a variety of methods that take advantage of differences in apparent diffusion, the effect of contrast agents, or magnetization transfer in the two compartments (Silva et al, 1997a, 1997b; Wang et al, 2003; Wang et al, 2007; Zaharchuk et al, 1998; Kim and Kim, 2006). Recently, initial data have been presented investigating the potential use of T2 differences to observe compartmentation of the ASL signal in the human brain using an FAIR-CPMG approach (He and Yablonskiy, 2007).
A common approach to ASL cerebral blood flow (CBF) measurement is to acquire multiple images at a range of inflow times and fit the dynamic time-course data to a model for cerebral parameter quantification. An assumption of this approach is that the T2 of the labelled water is constant and is independent of the postlabelling delay (PLD) (Buxton et al, 1998; Petersen et al, 2006; Petersen and Golay, 2008; Francis et al, 2008). Marked sensitivity of the T2 of the tagged bolus to the PLD will influence the accuracy of the estimates. Indeed, a recent study cited T2 as an explanation for CBF quantification errors (Kober et al, 2008) but, unlike T2∗ effects (St Lawrence and Wang, 2005), this potential source of error has not been previously examined.
In this study, we present a novel technique to estimate noninvasively the proportion of the ASL perfusion-weighted signal originating from the three distinct cerebral–vascular compartments (IV, EC, and IC). We sample the transverse relaxation of the perfusion-weighted and control images acquired with a range of PLDs and labelling durations (τ) with and without vascular crusher gradients (VCGs) in the rat brain. It is known that the T2 of arterial blood is significantly greater then that of the cerebral parenchymal tissue (Stanitz et al, 2005). Earlier, we have used this T2 difference to estimate the cerebral blood volume using a double echo pulsed ASL approach (Thomas et al, 2001). In this work, we extend this concept using a multiecho continuous arterial spin labelling (CASL) sequence to examine the possibility that the T2 of the ASL signal is a sensitive indicator of the intra-vascular to extravascular (IC and EC) ratio when compared with the more established diffusion-sensitized ASL measurements. (Silva et al, 1997a). Furthermore, we acquire multiecho ASL data (with VCGs to eliminate any IV contribution) to estimate the proportion of the perfusion-weighted signal originating from the intra- and extra-cellular tissue space. The measurements are also used to estimate the T2 of labelled blood in the vessels, which may provide a surrogate index of the intra-vascular blood oxygen saturation (Turner et al, 1998; Golay et al, 2001). By acquiring images at a range of PLDs and τ we can follow the dynamic changes in these parameters as the labelled bolus is delivered to the brain. In this way, we provide further insight into the time course of blood delivery and exchange within cerebral tissue, and demonstrate the proof of principle of this method for possible future application in brain pathology. Finally, by investigating the dependence of the T2 of the ASL and control signal on τ and PLD we examine the possible implications on the accuracy of standard CBF quantification methods (e.g., Buxton et al, 1998).
Materials and methods
Animal Preparation
Nine male Sprague Dawley rats (182 to 242 g) were used in this study. Anesthesia was induced using 3% halothane in 100% O2 and was maintained through a nose cone at 2% halothane in 100% O2 while the animal was placed on a custom designed Perspex probe. The rodent's head was secured using ear bars to minimize motion during the acquisitions. Once the probe was fixed in the scanner, the halothane concentration was reduced to 1.25% in 60% N2O and 40% O2. Body core temperature was measured throughout using a rectal thermometer and maintained at 36.5±0.5°C using a heated blanket during preparation and warm air flow into the magnet throughout the acquisitions.
MRI Hardware
MRI studies were performed using a 2.35T horizontal magnet with a 120 mm clear bore (Oxford Instruments Eynsham, UK), interfaced to a Surrey Medical Imaging Systems (SMIS, UK) console. A volume coil (60 mm length) was used to transmit radiofrequency excitation pulses. The magnetic resonance signals were detected using a passively decoupled, single loop, surface coil of 1 cm diameter positioned on the dorsal aspect of the head.
Continuous Arterial Spin Labelling
A CASL sequence (Alsop and Detre, 1996) was implemented with an alternating adiabatic spin tagging pulse to minimize eddy current effects. The offset frequency of the labelling pulse oscillated in accordance with the slice select gradient to maintain a constant tagging plane. The labelling pulse was applied 2 mm caudal to the cerebellum, perpendicular to the carotid and vertebral arteries, to ensure efficient spin tagging.
To monitor the progression of labelled water within the cerebral vessels and tissue, the tagging pulse duration was varied over the range of values: 500, 750, 1,000, and 3,000 ms. After a PLD, single slice coronal images were then acquired 0.3 mm caudal to the bregma using a multiecho spin echo half-Fourier Echo Planar Imaging (EPI) sequence to produce four images in a single shot. This was twice repeated, with different sequence timings to achieve a total of 12 echo times (29, 41, 53, 68.2, 80.2, 92.2, 107.4, 119.4, 131.4, 146.6, 158.6, and 170.6 ms). A slice selective 90° to 180° pulse combination was used to generate the first spin echo and subsequent echoes were generated using nonselective adiabatic BIR-4 pulses, to ensure efficient spin refocusing and accurate T2 measurements. The PLD was 50 ms, and was also extended for additional acquisitions at 300, 700, and 1,200 ms after the 3 secs labelling pulse to investigate the provenance of the ASL signal further downstream, an approach commonly used to negate possible confounding transit time effects (Alsop and Detre, 1996). The protocol was then repeated with the addition of monopolar diffusion gradients around the first 180° refocusing pulse in the slice select direction. The time delay between diffusion gradients was 16 ms, resulting in a b-value of 40 secs/mm2. Diffusion weighting is frequently used to attenuate signal from the labelled spins in the vasculature to avoid overestimating perfusion and earlier work has shown diffusion gradients of similar separation and b-value to achieve effective vascular suppression in the rat brain (Silva et al, 1997b; Neil et al, 1991). The entire set of acquisitions were repeated for a total of 30 averages at each echo time, τ/PLD combination, with VCGs on and off. Other acquisition parameters were: interexperiment delay time=4 secs; half-Fourier matrix size =36 × 64; FOV=32 × 32 mm; slice thickness=2 mm.
Phase cycling and spoiler gradients applied along the slice select axis (modulated as a function of echo number using the scheme recommended in Poon and Henkelman (1992)) were implemented for all the acquisitions. This is designed to remove spurious magnetization pathways arising from a succession of imperfect radio frequency (RF) pulses.
Image Analyses
Images were first averaged in k-space and then reconstructed to 64 × 64 using the POCS algorithm (Liang and Lauterbur, 2000; Liang et al 1992). The images were masked and independent component analysis (ICA) was applied to the subtracted images to reduce random errors (Wells et al, 2007). The mean signal of the ASL difference image (ΔM) within a cortical region of interest (ROI) was taken (see Figure 2) and the data were fitted to a monoexponential model. A monoexponential model was used to yield a single apparent T2 estimate (T2appΔM) reflecting the contribution to the total ASL signal from the different cerebral compartments, each with their associated T2 constants. T2appΔM provides a simple summary measure, that is the apparent T2 of the ASL signal with minimal interpretation. Monoexponential fits were also applied to the multiecho ASL control images (giving T2appCtrl) to investigate differences in T2app between the ASL ΔM signal and the control images (which represent the mean T2 of all the tissue in the ROI). A balanced one-way ANOVA with correction for multiple comparisons was performed to determine the probability that the means of the T2app values with the different sequence parameters (τ, PLD, VCGs-on, VCGs-off, ΔM, ASL control image) were significantly different. For visualization of spatial variations in T2appΔM, maps were also generated. After independent component analysis denoising, T2appΔM was calculated on a pixel-by-pixel basis by fitting to a simple monoexponential model.
The fraction of the ASL signal from the intravascular compartment (ΦIVΔM) was estimated for each animal at each τ and PLD using

from the perfusion-weighted images acquired at the earliest echo time (29 ms) and assuming the VCGs crushed the entire vascular signal (Silva et al, 1997a).
To estimate the T2 values of the intra- and extracellular compartments (T2IC and T2EC) the mean cortical signal from the control images acquired with VCGs at each of the different τ and PLD times and for each nine subjects was fitted to a biexponential model with no fixed or bound parameters:
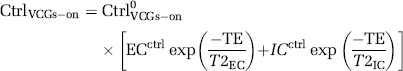
where ECctrl is the proportion of the CtrlVCGs-on signal deriving from the extracellular compartment with transverse decay constant T2EC, ICctrl is the proportion of the CtrlVCGs-on signal originating from the intracellular compartment with transverse decay constant T2IC and Ctrl0VCGs-on is the CtrlVCGs-on signal at TE=0 ms.
The 95% confidence intervals of the fitted T2IC and T2EC values showed marked imprecision in these estimates (see Results). This reflects the difficulty of fitting experimental data to a biexponential decay model (with no fixed parameters), and is a problem that has been encountered earlier in the MR literature, for example in the context of IVIM for perfusion imaging, which uses a biexponential model for diffusion to differentiate the intravascular and extravascular compartments. As shown by King et al (1992), the problems associated with obtaining reliable parameter estimates from the data fitting process are such that precision of parameter estimation is limited in practice, despite the validity of the model. Given the uncertainty in the estimated T2EC and T2IC values from fitting our data in this way (see Results) we use T2IC and T2EC values from an earlier study that was specifically designed to estimate these decay constants with some precision (Haida et al, 1987; Matsumae et al, 2003; Lascialfari et al, 2005). Matsumae et al, estimated the T2IC and T2EC of a 6-week-old rat midbrain to be 53 and 133 ms, respectively (Matsumae et al, 2003). Given that these estimates fall within the 95% confidence intervals of the T2IC and T2EC values generated from the control images in our study (unlike the estimated T2IC and T2EC values in Haida et al (1987) and Lascialfari et al (2005) we assume T2IC and T2EC to be 53 and 133 ms, respectively from earlier work that validated their T2IC and T2EC measurements using electron microscopy imaging experiments (Matsumae et al, 2003). These values are now referred to as T2IC53 and T2EC133 to emphasize that they are assumed to be constant and are taken from the literature.
The proportion of intra- to extracellular ASL signal is then estimated by fitting the ΔMVCGs-on observations to a biexponential model:
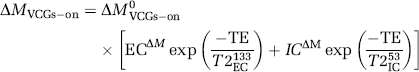
where ECΔM is the proportion of the ΔMVCGs-on signal deriving from the extracellular compartment with transverse decay constant T2EC133 (133 ms), ICΔM is the proportion of the ΔMVCGs-on signal originating from the intracellular compartment with transverse decay constant T2IC53 (53 ms) and ΔM0VCGs-on is the ΔMVCGs-on signal at TE=0 ms. These estimates were then multiplied by the ΔMVCGs-on/ΔMVCGs-off measurements (1-ΦIVΔM) to calculate the overall fraction of the total ASL signal (ΔMVCGs-off) from labelled water in the extra- and intracellular tissue space at a range of PLD and τ for each of the nine experiments (ΦECΔM and ΦICΔM, respectively). The same analyses were performed on the control images to give the equivalent fractional contributions to these images (i.e ΦIVCtrl, ΦECCtrl, and ΦICCtrl). As a three-compartment model was assumed, the following equalities apply: ΦIVΔM+ΦECΔM+ΦICΔM=1; ΦIVCtrl+ΦECCtrl+ΦICCtrl=1.
To estimate the T2 of the vascular compartment (T2IV) we fitted the perfusion-weighted signal acquired without VCGs (ΔMVCGs-off) to a triexponential model assuming labelled blood water is in slow exchange between each of the vascular and the intra- and extracellular compartments in the tissue (Quirk et al, 2003; Eichling et al, 1974):
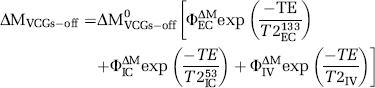
As above, T2EC133 and T2IC53 were assumed to be 133 and 53 ms, respectively, and the values of ΦECΔM, ΦICΔM, and ΦIVΔM calculated above were used. The fit therefore estimated two parameters: T2IV and ΔM0VCGs-off.
In summary, the calculations used to estimate the tricompartmental origin of the ASL and control signal (and T2IV) were as follows:
Calculate the proportion of intravascular signal using data acquired with and without VCGs at the earliest echo time (Equation 1).
Estimate ECΔM and ICΔM by fitting data acquired with VCGs to a biexponential model (Equation 3).
Calculate ΦECΔM and ΦICΔM by multiplying the ECΔM and ICΔM estimates by 1-ΦIVΔM.
Estimate T2IV using the ΦIVΔM, ΦECΔM, and ΦICΔM measurements and fitting the data acquired without VCGs to a triexponential model (Equation 4):
The mean cortical signal in the perfusion-weighted images acquired with VCGs at τ=3,000 ms and PLD=700 ms were used to estimate CBF for each experiment based on Alsop and Detre (1996).
Results
The mean CBF across the nine experiments (±1 s.e.m.) was 233±12 mL/mins/100 g, in good agreement with earlier ASL measurements in rat cortex made in our laboratory using a similar approach (Thomas et al, 2006). Figure 1 shows typical perfusion-weighted images acquired over a range of τ and PLD, with and without the application of VCGs, together with calculated T2appΔM maps. The SNR of the base images at the maximum TE (176.6 ms) was considerably greater than 3 in all of the experiments. Therefore, random noise in the cortex was assumed to be Gaussian (Gudbjartsson and Patz, 1994), with negligible noise rectification within the ROI of the subtracted images. Figure 2 shows the mean cortical transverse decay of the ASL signal from the same experiment.
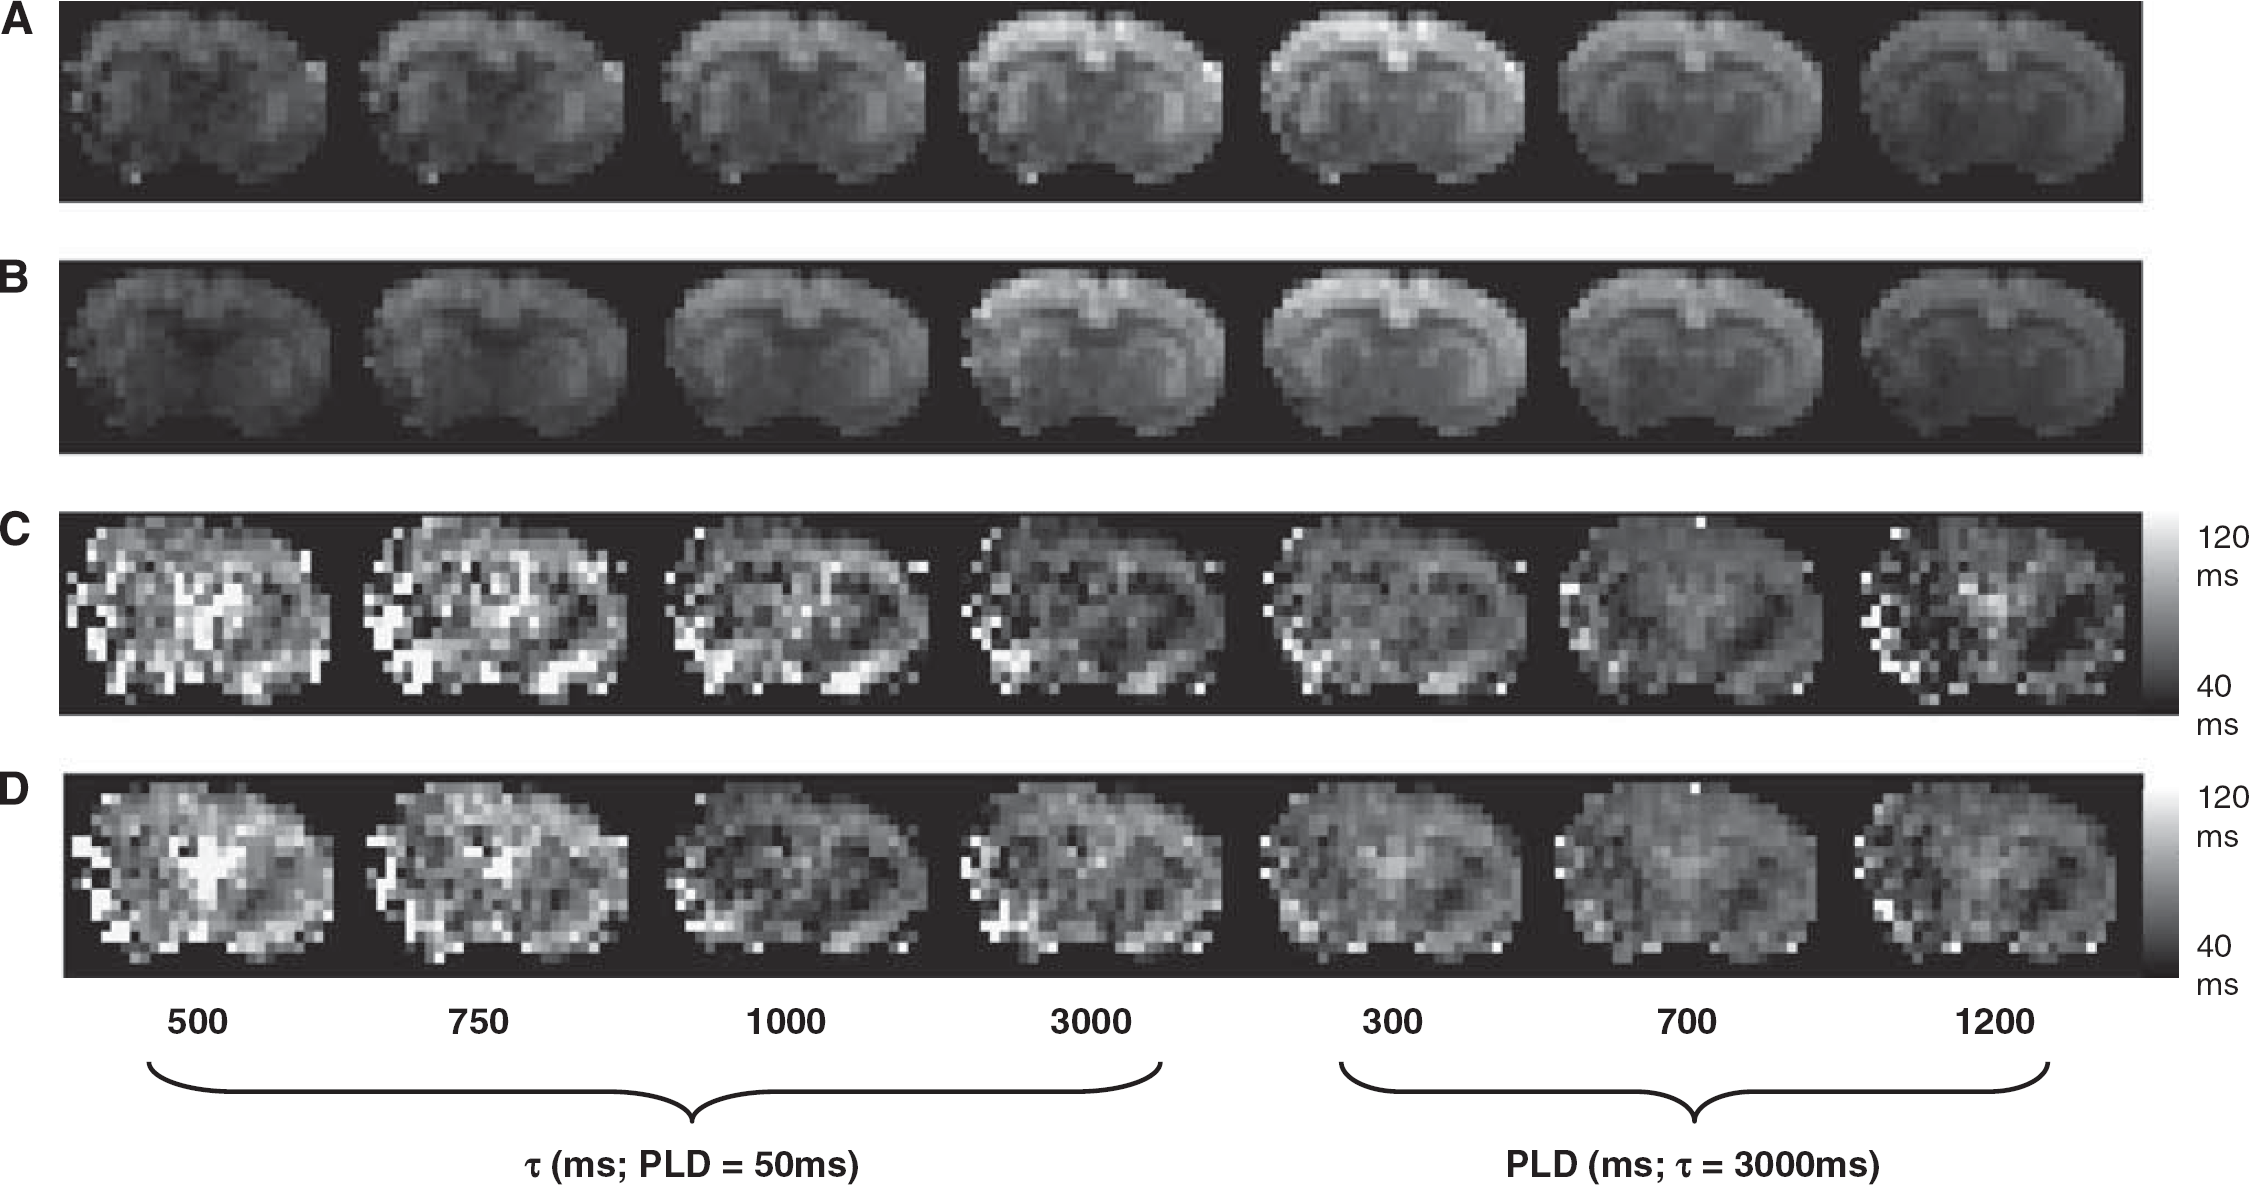
Typical perfusion-weighted images (number of averages=30) acquired at the shortest TE (29 ms) and the PLD/τ combinations shown below the respective images without (
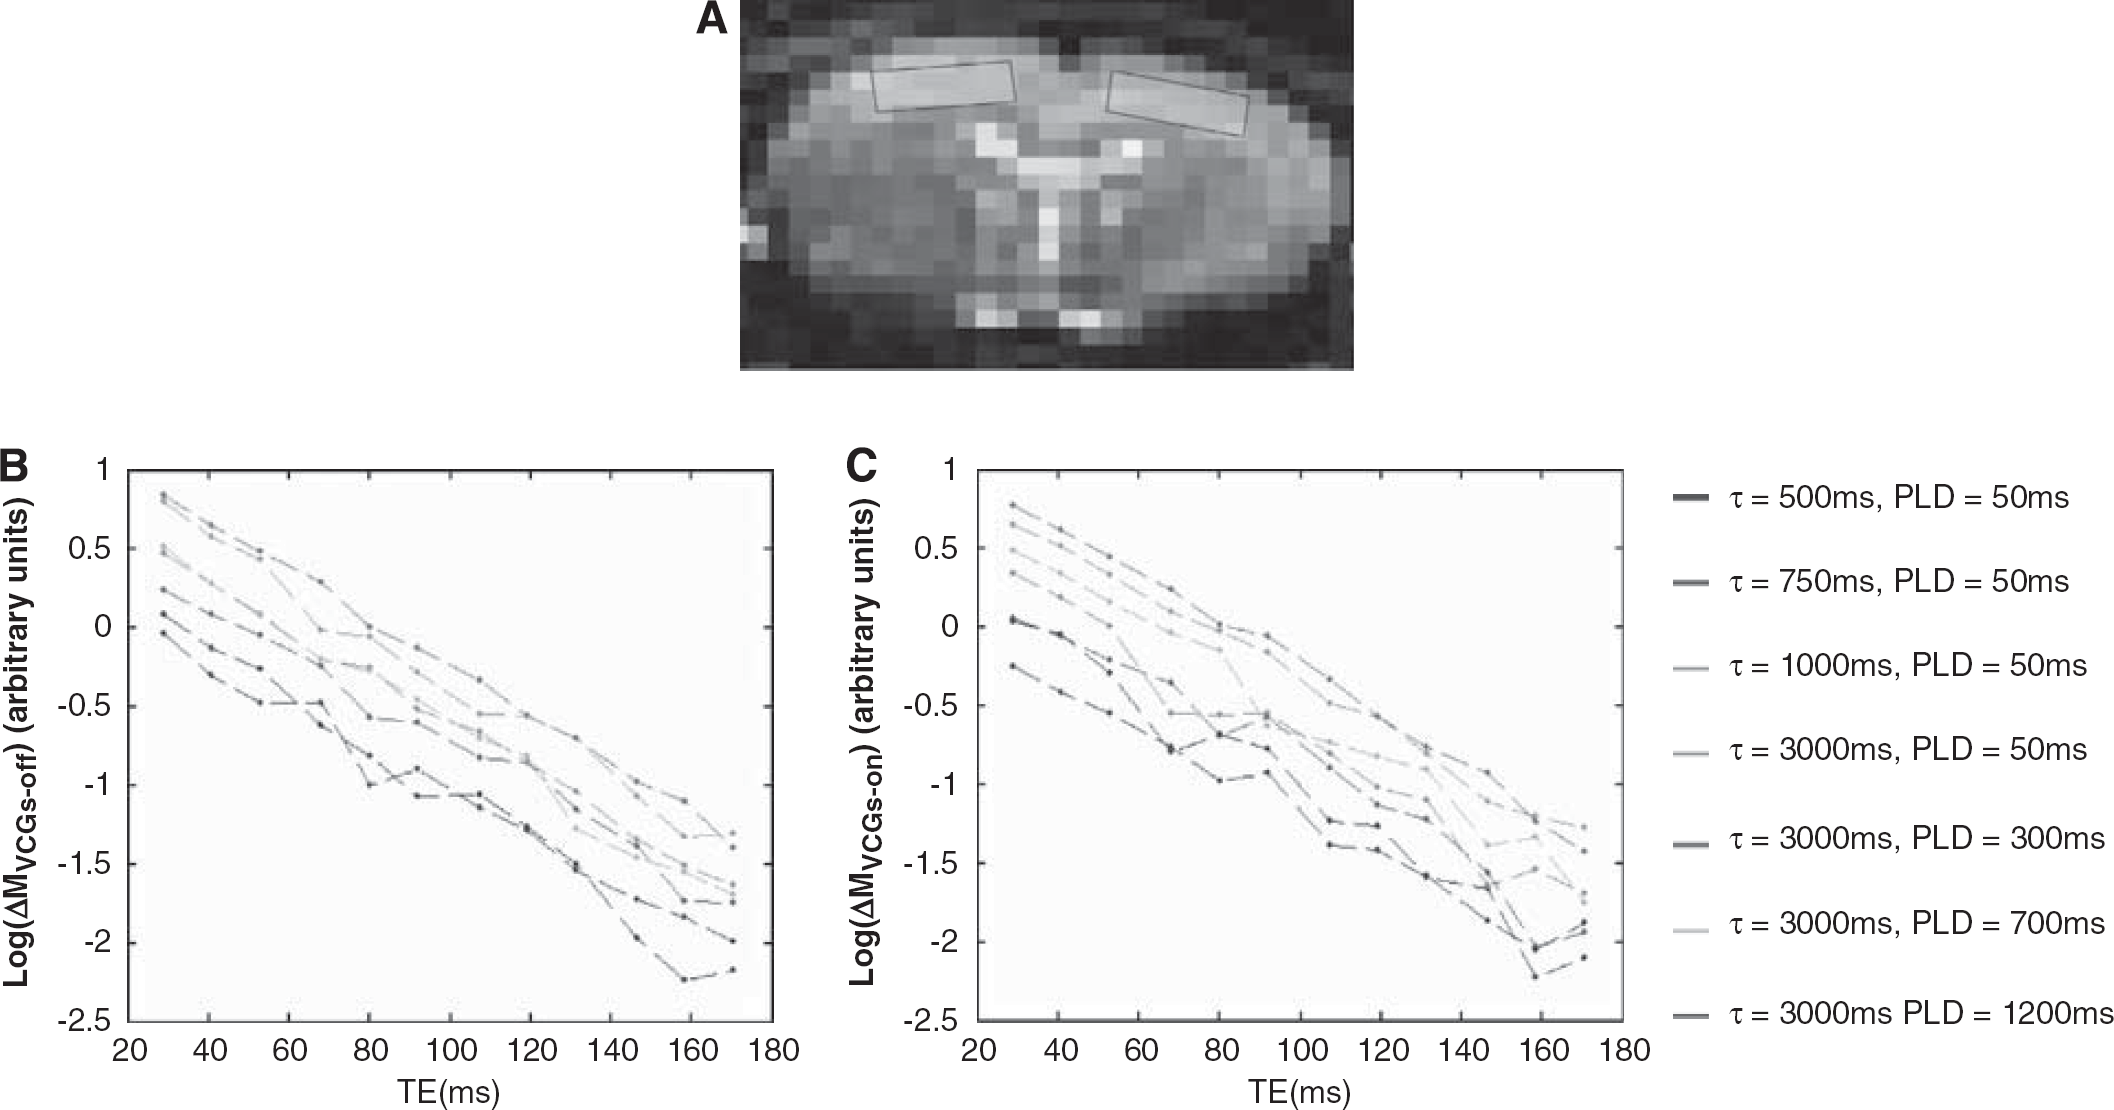
The mean perfusion-weighted signal within the cortical ROI (shown in (
Figure 3 shows measured ΔMVCGs-on/ΔMVCGs-off (i.e., 1-ΦIVΔM) at fixed PLD (50 ms) and increasing τ and then at fixed τ (3,000 ms) and increasing PLD. The monotonic increase, as is apparent from visual inspection, reflects the apparent shift of the source of the ASL signal from the vascular to the tissue compartment as τ and PLD increase. This is likely to be due to exchange of vascular water into the tissue combined with outflow of labelled blood from the observation slice that does not exchange. Figure 4 shows the mean apparent T2 of the ASL and control signal (T2appΔM and T2appCtrl) over the range of τ and PLDs across the nine experiments. As discussed earlier, T2app was estimated using a monoexponential fit to provide a simple summary measure of the apparent T2 of the labelled water in the different compartments. T2appΔM(VCGs-on) and T2appΔM(VCGs-off) measured at τ=500 ms and PLD=50 ms were significantly greater then the equivalent estimates acquired at τ=3,000 ms and PLD=1,200 ms providing evidence that the T2appΔM is decreasing with increasing τ and PLD, as inferred through visual inspection of Figure 4. The decrease in T2appΔM(VCGs-on) may reflect the shift of the perfusion-weighted signal from the EC to the IC tissue space with increasing τ and PLD (see below). Each of the T2appΔM (VCGs-on) estimates is significantly greater than the T2appCtrl (VCGs-on) observations acquired at the same τ and PLD, which provides evidence that the balance between the intracellular and extracellular signal contributions is more weighted toward the extracellular tissue space in the ΔM images compared with the controls. There was no significant difference between T2appΔM acquired with and without VCGs at the same τ and PLD. The 95% confidence intervals of the T2IC and T2EC values generated by fitting the control data (at each of the τ and PLD combinations for each of the nine subjects) to a biexponetial model with no fixed or boud parameters (Equation 2) was (25 to 80 ms) and (26 to 142 ms), respectively.
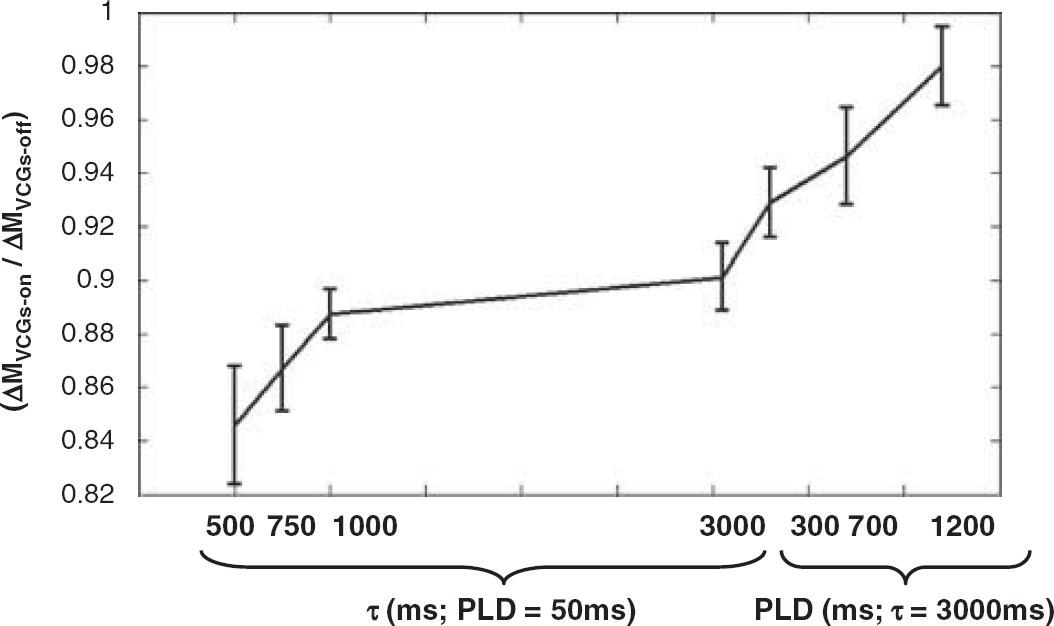
The mean of the measured ΔMVCGs-on/ΔMVCGs-off (i.e., 1-ΦIVΔM) at the different τ and PLD combinations. Error bars denote the s.e. across the nine subjects.
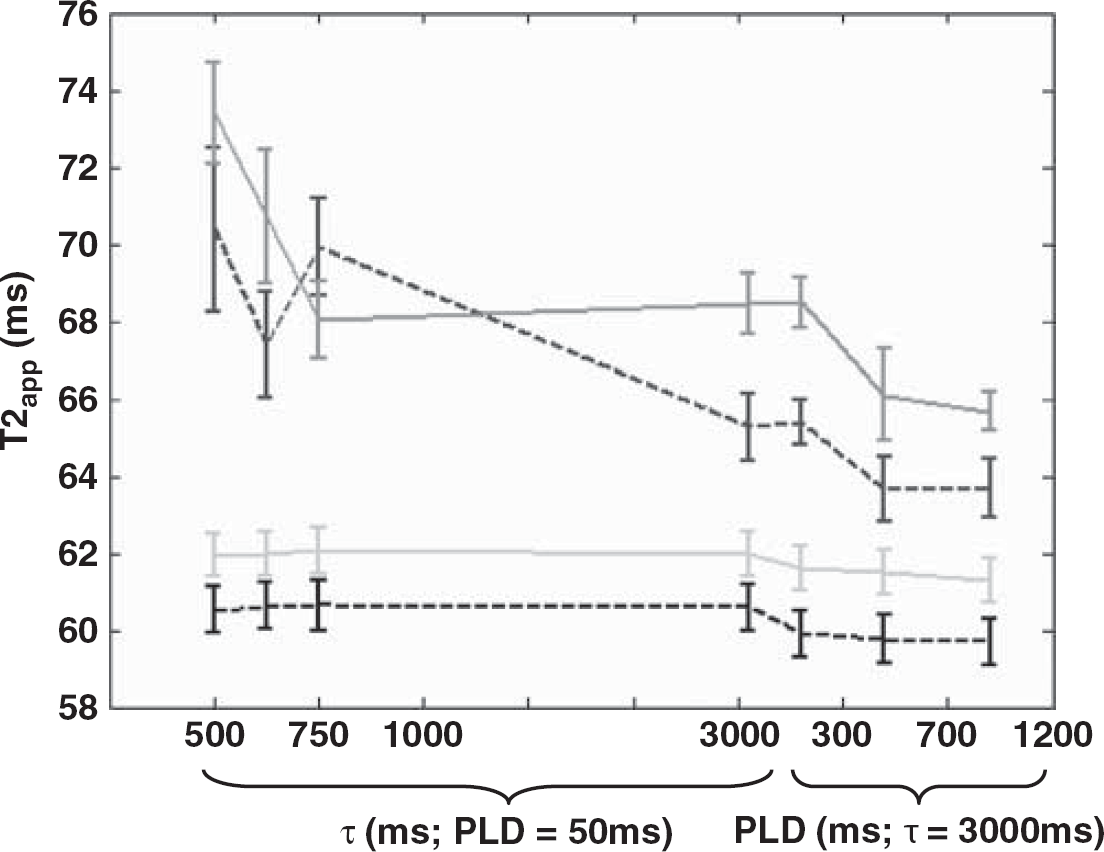
The mean T2 of the subtracted signal with VCGs (T2appΔM(VCGs-on)—red line) and without VCGs (T2appΔM(VCGs-off)—blue dashed line) and of the control data with crushers (T2appCtrl(VCGs-on)—green line) and without (T2appCtrl(VCGs-off)—black dashed line) at different PLD and τ times across all the nine experiments. Error bars represent the s.e. across the nine subjects. (The color reproduction of this figure is available on the html full text version of the manuscript.)
Figure 5 shows the estimated T2 of the ASL signal located in the vascular compartment (T2IV). ΔMVCGs-on/ΔMVCGs-off observations that are very close to 1 can result in fairly extreme T2IV estimates, because of the small intravascular component of these measurements. In this case, if there is a marked difference between T2appΔM(VCGs-on) and T2appΔM(VCGs-off) then T2IV will converge on a very high or very low value. For this reason, results from one of the nine experiments at four of the seven different τ and PLD combinations are not included in the analysis (criteria for exclusion was T2IV > 500 ms). Furthermore, for this reason, the median T2 across the remaining experiments is reported. At τ=3,000 ms and PLD=1,200 ms, ΦIVΔM is approximately 2.5 % of the total ASL signal, severely limiting the precision of T2IV estimation in this case. As a result the marked variance of the T2IV estimates across the nine experiments restricts the interpretation of T2IV at these imaging parameters and is therefore not reported in Figure 6 (criteria for exclusion was mean ΦIVΔM <0.05). At short τ (0.5 to 1 secs) and PLD (50 ms) we may have expected the T2IV observations to be larger based on earlier ex vivo estimates of the T2 of arterial blood (Stanitz et al, 2005). This finding is likely to reflect the oxygen saturation of blood in the vessels that contain the labelled water, given the sensitivity of blood T2 to this parameter (Zhao et al, 2007). There seems to be an overall decrease in the median T2IV as τ is increased to 3,000 ms. This is likely to reflect the shift of the labelled blood that remains in the vessels from the arterial to the venous side of the vasculature (see Discussion).
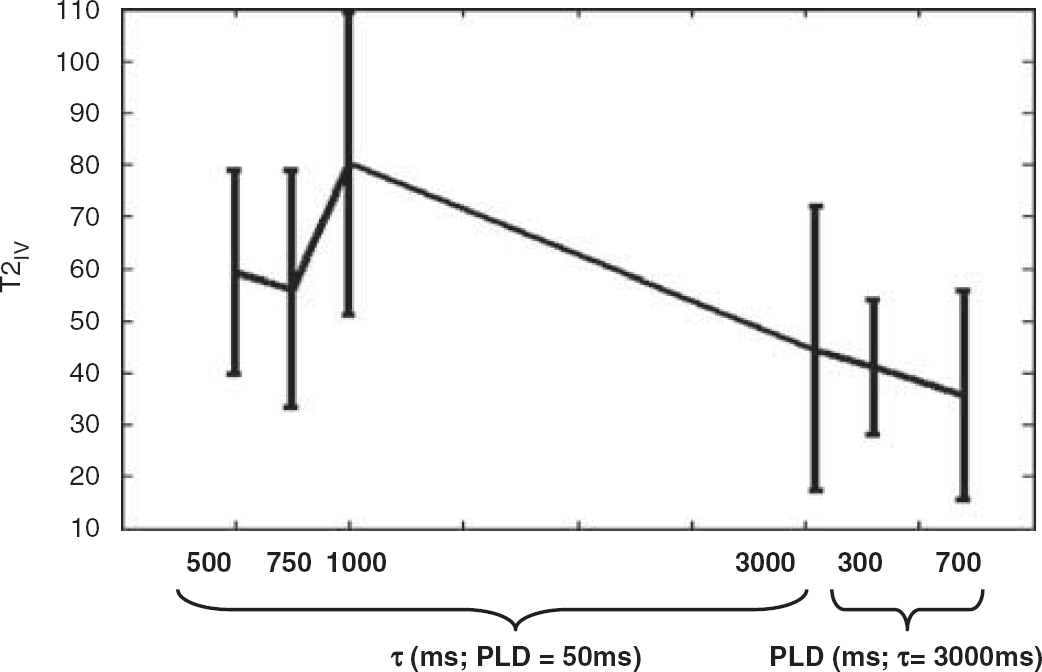
The median T2 of the vascular compartment (T2IV) at increasing τ and PLD. Error bars (dashed lines) denote the s.e. of the median across the nine subjects.
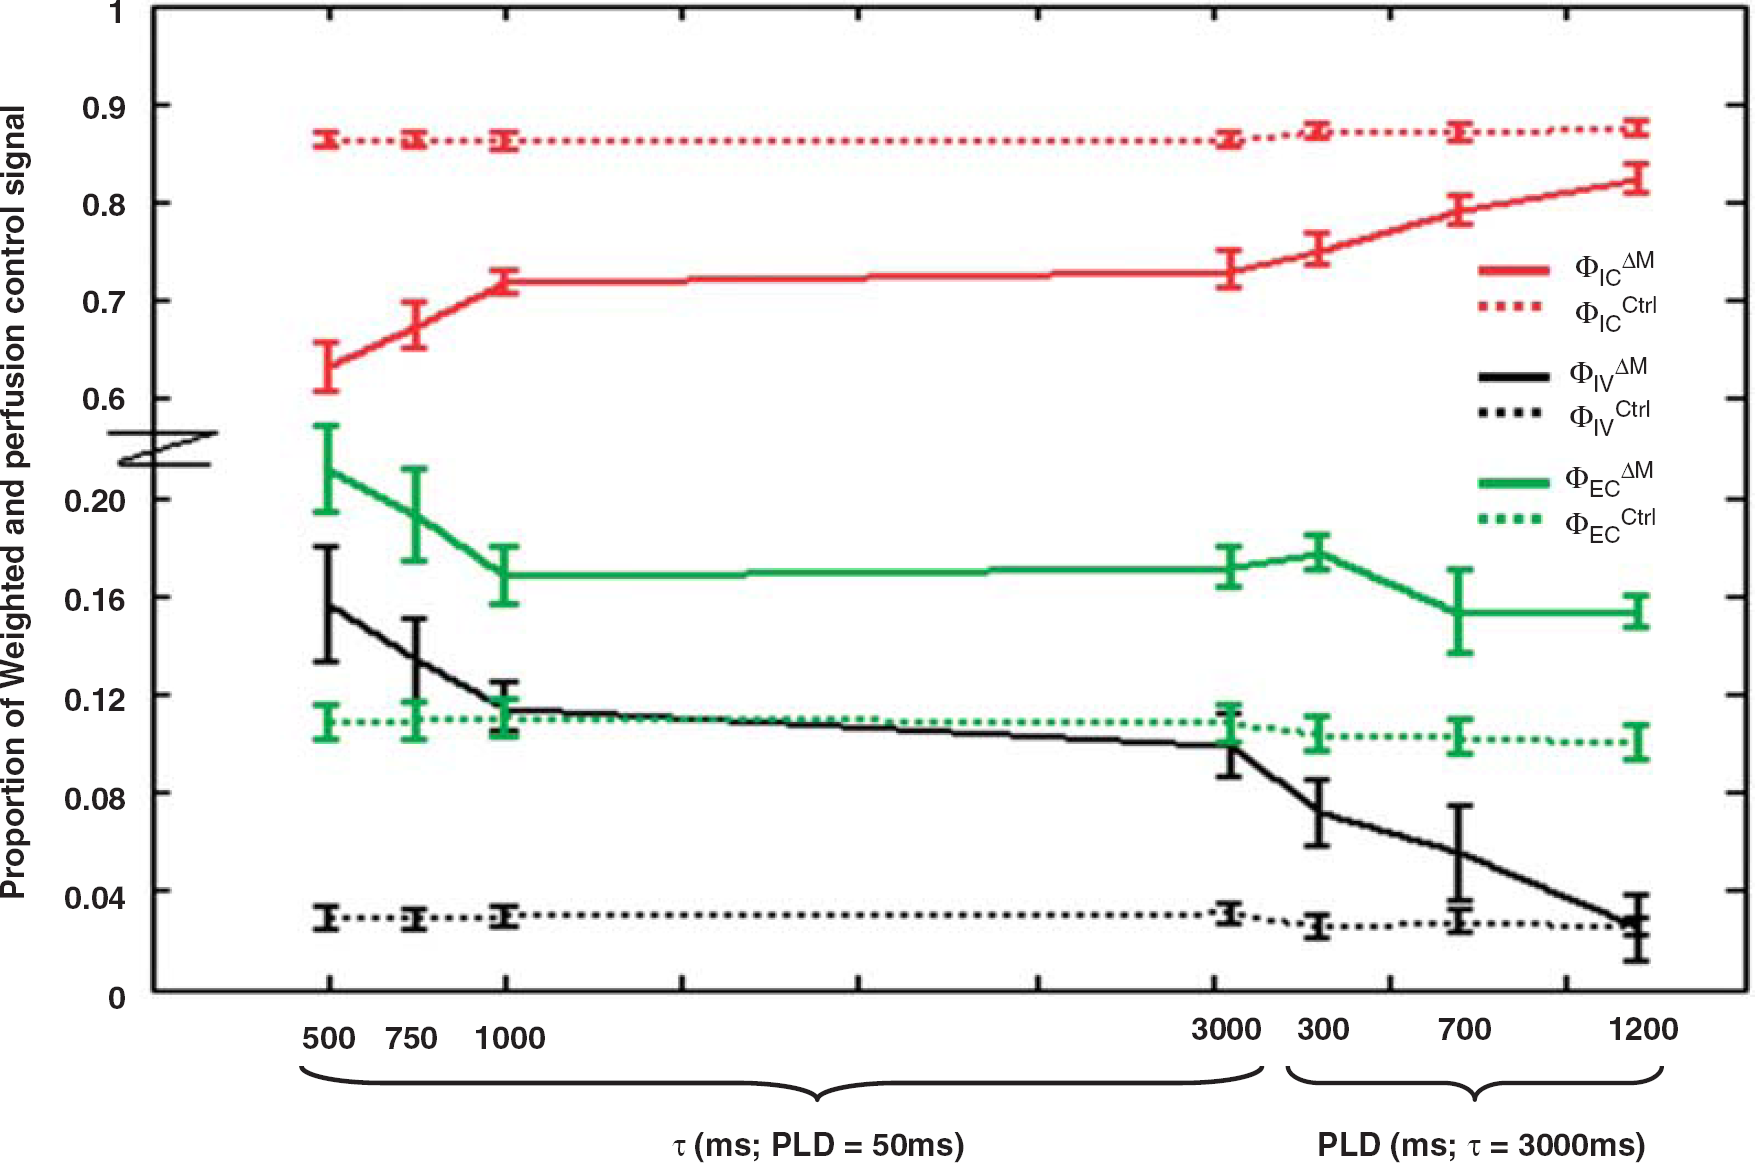
The proportion of ASL signal originating from the intravascular compartment (ΦIVΔM—black line) and in the intracellular (ΦICΔM—red line) and extracellular (ΦECΔM—green line) tissue space at the various τ and PLD combinations. The proportion of the control signal in the three different compartments is represented by a dotted line. For clarity the scale of the y axis has been adjusted and is nonlinear. Error bars denote the s.e. across the nine experiments.
Figure 6 reports the proportion of the ASL and control signal in the vascular space and in the extra- and intracellular tissue space at increasing τ and PLD. The VCGs will have a small effect on the tissue compartment given the relatively low b-value of 40secs/mm2. Any signal attenuation caused by the VCGs is likely to be similar between the intra- and extracellular tissue spaces (Duong et al, 2001).
Discussion
These are the first results to report the T2 of the ASL signal over a range of labelling durations and inflow times with and without the application of VCGs. We have estimated the dynamic distribution of the ASL signal originating from the intravascular space and within the intra- and extracellular tissue space. This provides a novel insight into the destination of arterial blood water that has flowed into the brain as well as proof of principle of this noninvasive approach for possible future applications in humans and in animal models of disease where changes in the volume of the intra- and extracellular tissue space are notoriously difficult to investigate.
Figure 6 indicates that the source of the ASL signal shifts further into the intracellular compartment from the intravascular and extracellular spaces as τ increases from 500 to 1,000 ms. The subsequent similarity of the ΦICΔM and ΦECΔM estimates at τ=1 and 3 secs suggests that a dynamic ecquilibrium is established between labelled water in the intra-and extracellular tissue space by τ=1 secs. This is perhaps not surprising given the earlier measured mean residence time of spins in the extracellular space of ∼120 ms (Quirk et al, 2003). Figure 6 also shows that the ΔM signal is weighted toward the extracellular space, relative to the control signal, even when τ=3 secs and with extended PLD. The short mean residence time (120 ms) of the extracellular spins relative to the τ and PLD timescale, as well as the aforementioned evidence for establishment of a dynamic equilibrium, suggests this may be due to gradual exchange of labelled blood from the vascular compartment to the tissue at increasing PLD as implied from Figure 6. Indeed, Figure 6 suggests that as the PLD increases at τ=3,000 ms the ASL signal from the intravascular compartment seems to effectively shift into the intracellular space whereas the signal from the extracellular space seems relatively stable, perhaps acting as a ‘buffer’ for the movement of labelled blood between the two compartments.
It was hypothesized that the heightened T2 of the arterial blood in comparison to the tissue would render the T2appΔM(VCGs-off) estimates sensitive to the fraction of labelled blood in the vascular compartment. However, Figure 4 shows that the T2appΔM(VCGs-off) estimates are similar to the equivalent observations with vascular suppression gradients applied (T2appΔM(VCGs-on)) at brief tagging durations (τ=500 to 1,000 ms) and PLD (50 ms) in which the majority of labelled blood in the vascular compartment is expected to be arterial. T2IV at these imaging parameters was calculated to be approximately 60 to 80 ms (see Figure 5). As τ increases to 3,000 ms, T2appΔM(VCGs-off) is less than T2appΔM(VCGs-on). This suggests that during image acquisition the portion of tagged blood in the vascular compartment has a reduced T2 relative to the labelled spins that have exchanged into the tissue. Indeed, T2IV at these imaging parameters was estimated to be 30 to 50 ms (see Figure 5). Earlier work has estimated the arterial and venous oxygen saturation in the rat brain to be 0.9 and 0.6, respectively (Lin et al, 1998). Zhou et al, measured the T2 of blood in vitro at 3 Tesla and 37°C (Zhou et al, 2001). They found the T2 of blood with an oxygen saturation of 0.9 and a hematocrit fraction of 0.44 to be approximately 74 ms. The T2 of blood with an oxygen saturation of 0.6 was approximately 31 ms. These measurements are of the order of those reported in Figure 5 and suggest that the source of the vascular portion of the ASL signal becomes increasingly weighted to the venous side of the vascular bed as τ increases from 1 to 3 secs. This observation may reflect the time taken by labelled blood that does not exchange because of the limited permeability of the blood brain barrier (Parkes and Tofts, 2002; Zhou et al, 2001) to traverse the capillary bed.
In this study, we estimate the proportion of ASL signal from the vascular compartment (ΦIVΔM) by calculating ΔMVCGs-on/ΔMVCGs-off, assuming the VCGs (b=40 secs/mm2) achieve complete vascular suppression (Silva et al, 1997a). Our ΦIVΔM estimates at τ=3 secs and PLD=50 ms are in good agreement with earlier Sprague Dawley rat ASL studies using similar anesthetic regimes and very similar imaging parameters (τ and PLD). This provides some evidence that the crusher gradients are working as intended to severely attenuate the vascular signal. In Silva et al (1997a), ΦIVΔM was estimated by differentiating the vascular and tissue portion of the ASL signal based on their diffusion characteristics (the same approach used in this work). They studied rats under halothane anesthesia and found that the contribution of vascular water to the measured perfusion can be efficiently eliminated with b-values of approximately 20 secs/mm2. With τ=3.5 secs and negligible PLD they calculated NΦIVΔM to be approximately 0.9 at normal CBF, in excellent agreement with our results (see Figure 3). In Silva et al (1997b) ΦIVΔM was estimated by exploiting the different susceptibility of blood and tissue to magnetization transfer effects. In their work the extent of magnetization transfer in the volume of interest was manipulated without affecting tagging efficiency by using a separate labelling coil for spin tagging. The estimated ΦIVΔM after labelling for 2 secs with negligible PLD was around 0.9 in agreement with our findings. In Zaharchuk et al (1998) a long half-life intravascular magnetopharmaceutical with a high tissue:blood susceptibility difference was used in combination with ASL for the continuous measurement of blood flow and blood volume. In this study ΦIVΔM was calculated to be about 0.8 at τ=3.7 secs and PLD=0.2 secs at a blood flow of 200 mL/100g/mins. However, they report a large spread in the ΦIVΔM estimates acquired over a relatively narrow range of blood flows (1.1 to 0.6 over 100–200 mL/mins/100 g). Therefore, the estimated ΦIVΔM in this work is likely to fall within the confidence intervals of this previous study. Nonetheless, this may introduce some uncertainty as to the extent of vascular suppression in our experiments. Earlier work has measured a persistent microvascular signal despite the presence of large crusher gradients (Henkelman et al, 1994). This may be because of the variability in microvascular flow during the application of the diffusion-weighting gradients in the sequence (Villringer et al, 1994). This could additionally explain the ΔMVCGs-on/ΔMVCGs-off reported in this work at brief tagging durations (Figure 3, τ=500 and 750 ms) given that the transit time from the labelling to the imaging plane (Thomas et al, 2006) in the CASL experiments has been reproducibly measured to be approximately 0.2 secs, intuitively one may expect the vascular proportion occupied by the labelled blood to be greater then 0.2. However, this result may simply indicate rapid exchange of labelled water into the tissue after entering the capillary bed. In humans, a greater proportion of labelled water reside in the intravascular compartment during image acquisition (Wang et al, 2007). This discordance principally reflects the marked difference in CBF (∼50 mL/mins/100 g) and transit time (1 secs) to the human brain in comparison to the rat brain (where CBF ∼200 mL/mins/100 g and transit time ∼ 0.2 secs).
Although visual inspection of Figure 4 suggests T2appΔM(VCGs-on) is increased in comparison to T2appΔM(VCGs-off) at τ=3,000 ms, we found no significant difference between the T2appΔM estimates acquired at the same τ and PLD with and without VCGs. This finding provides some indication that the sensitivity of T2appΔM to ΦIVΔM is limited and suggests that diffusion sensitized measurements (ΔMVCGs-on/ΔMVCGs-off) are a much more efficient way of calculating the proportions of vascular and tissue ASL signal in the rat brain.
In general, the relatively narrow range of measured T2 estimates (see Figure 4) suggests this approach has limited sensitivity to the vascular origin of the labelled blood, even over a wide range of CASL sequence timings (i.e., τ, PLD; see Figure 4). Alternatively, this finding does provide some reassurance that T2appΔM is unlikely to be a confounding factor for CBF estimation using a range of tagging pulse lengths and/or PLDs, particularly if TE is relatively short. However, the significantly increased T2app (VCGs-on) of the perfusion-weighted signal in comparison to the control may result in a small overestimation in CBF using standard quantification methods (e.g., Alsop and Detre, 1996; Buxton et al, 1998) because the equilibrium magnetization of the tissue (M0) is assumed to decay with the same T2 as the labelled ASL signal in the brain.
In this work we estimate the proportion of the measured ASL signal originating from the IV, IC, and EC compartment. The longitudinal relaxation of tagged spins following labelling has a significant function in the tricompartmental distribution of ASL signal. For example, tagged water that has exchanged into the tissue during labelling will be relaxing according to T1 sat (Alsop and Detre, 1996) whereas labelled blood in the vasculature will be recovering at a slower rate, T1b (Alsop and Detre, 1996). Therefore, it is likely that T1 relaxation acts to preferentially attenuate the signal from labelled water in the tissue space in comparison to blood water that remains in the IV compartment after labelling. However, it is difficult to speculate in any greater detail how the reported relative population estimates may change by taking longitudinal relaxation and magnetization transfer effects into account. To do so would require knowledge of the T1 relaxation history of the labelled water in the different compartments, which is an unknown parameter. For example, we do not know whether labelled blood water in the venous vessels has flowed through the vasculature (because of the limited permeability of the blood brain barrier) or whether it has exchanged into the tissue on the arterial side and then exchanged back into the venules.
The reliance on published T2EC and T2IC values is a limitation of this work. In future studies it would be ideal to fit the control data acquired with VCGs to a biexponential model to simultaneously estimate the relative distribution of the intra- and extracellular signal of the static tissue in addition to the T2 constants of the two compartments. However, this would require a greater number and range of echo times than used in the present work (e.g., see Matsumae et al (2003) for a typical acquisition protocol used for this purpose).
In conclusion, ASL can noninvasively isolate the MR signal from arterial blood water that has flowed into the brain. We have shown that it is possible to measure the transverse decay of this signal over a range of bolus durations and delivery times to estimate the dynamic origin of nutritive flow-related signal in the intra- and extracellular tissue space, accepting that the accuracy of ΦICΔM and ΦECΔM estimation is restricted by the limited validation of T2IC and T2EC. Furthermore, by taking measurements with and without VCGs we have calculated the proportion of the perfusion-weighted signal originating from the cerebral vasculature, together with the associated T2 constant of this compartment (which may represent a surrogate index of blood oxygen saturation). We hope that this technique may be useful for future application in animal models of disease to better understand the relationship between the time course for blood delivery and exchange and pathology.
Footnotes
Acknowledgements
We acknowledge the Wellcome Trust, British Heart Foundation and Biotechnology, Epilepsy Reseach UK, and Biological Sciences Research Council for supporting this work.
The authors declare no conflict of interest.