
Abstract
Electron paramagnetic resonance imaging (EPRI) is a new modality for visualizing O2 distribution in tissues, such as the brain after stroke or after administration of drugs of abuse. We have recently shown that 3-acetoxymethoxycarbonyl-2,2,5,5-tetramethyl-1-pyrrolidinyloxyl [
Introduction
Molecular oxygen is the terminal electron acceptor for many enzymes that are important in brain function, including those involved in the biosynthesis of the neurotransmitters dopamine, serotonin, and norepinephrine. Thus, changes in O2 levels can have a significant and profound impact on physiology. For example, stroke, which results from occlusion of a major cerebral artery with consequently diminished partial pressure of O2 (pO2) in the brain, is the leading cause of long-term disability and a major cause of mortality in the elderly.
For diagnosis of stroke, monitoring the status of cerebral blood flow and O2 supply in the ischemic region is essential. Different imaging modalities, such as functional magnetic resonance imaging (fMRI), positron emission tomography (PET), and computed tomography (CT), are widely used to assess a range of brain functions, including those associated with stroke. However, these techniques cannot quantitate tissue pO2, which is essential in determining the physiology and pathophysiology of an affected region after ischemia (Grond et al, 1997; Baird and Warach, 1999; Kidwell et al, 2003; Kida et al, 2004; Hjort et al, 2005; Rauscher et al, 2005). For instance, blood oxygen level-dependent magnetic resonance imaging (MRI) measures blood oxygenation (not tissue oxygenation) by estimating deoxyhemoglobin concentration (Elas et al, 2003; Wedegartner et al, 2005). The accuracy of this measurement depends on three physiologic parameters: (1) local rate of metabolic consumption of O2, (2) regional cerebral blood volume, and (3) regional cerebral blood flow. Hemodynamic and metabolic changes that influence these parameters can alter the concentration of deoxyhemoglobin and thus affect blood oxygen level-dependent MRI data. Furthermore, perfusion imaging reflects only cerebral blood flow and cerebral blood volume changes and is, therefore, not a direct measure of tissue pO2. Therefore, development of a novel-imaging methodology for directly quantifying tissue pO2 in different regions of an ischemic brain is essential in understanding this pathology.
Molecular oxygen, being paramagnetic, broadens the electron paramagnetic resonance (EPR) spectral lines of other paramagnetic species, such as nitroxides or trityl radicals (Elas et al, 2003; Liu et al, 2004). This phenomenon has been developed into an accurate oxygen measurement technique, with the EPR spectral line width for such paramagnetic compounds being used to estimate O2 concentration in homogeneous solution (Elas et al, 2003; Khan et al, 2003; Shen et al, 2003; Kutala et al, 2004). With the development of low-frequency EPR spectroscopy and imaging and appropriate spin probes, it is now feasible to estimate local O2 concentrations in situ, in vivo in real time (Elas et al, 2003). An obstacle to the development of minimally invasive electron paramagnetic resonance imaging (EPRI) to quantitate pO2 in the brain is the difficulty of transporting O2-sensing probes across the blood–brain barrier.
Recently, we and others showed that 3-acetoxymethoxycarbonyl-2,2,5,5-tetramethyl-1-pyrrolidinyloxyl [
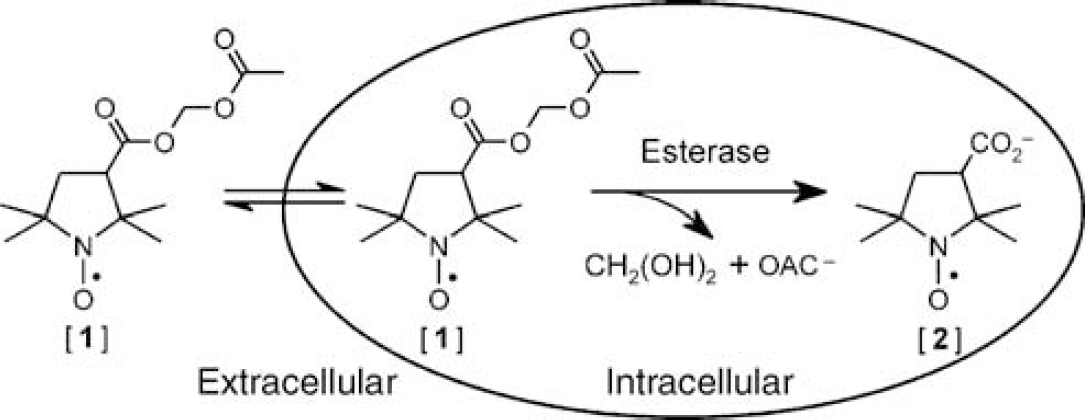
Schematic diagram showing ready diffusion of lipophilic nitroxide [
Materials and methods
Chemicals
All chemicals and solvents were of ACS grade or better and were used without further purification. The 3-acetoxymethoxycarbonyl-2,2,5,5-tetramethyl-1-pyrrolidinyloxyl [
Electron paramagnetic resonance phantom experiments
A Bruker E540L L-band EPR spectrometer equipped with 3D planar gradients was used for phantom experiments. To determine the spatial resolution of L-band EPR spectroscopy, we made a phantom comprising a bundle of 15 capillary tubes (ID, 1.0 mm): eight contained nitroxide [
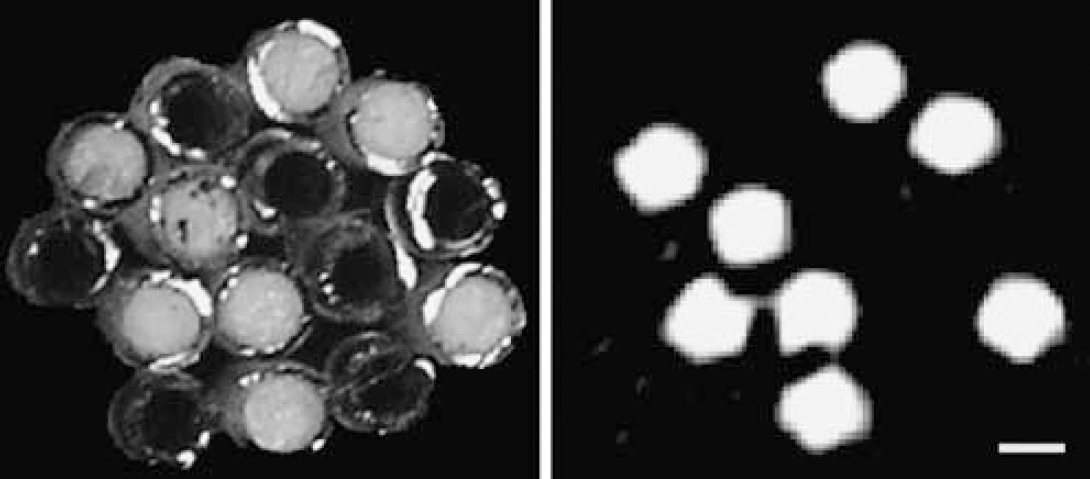
Photograph (left) and EPR image (right) of phantom comprising a bundle of 15 capillary tubes: 8 are filled with 1 mol/L nitroxide [
Validation of tissue oxygen measurement with nitroxide by comparison with solid-state electron paramagnetic resonance oximetry probe lithium phthalocyanine
C57 mice were maintained under appropriate lighting conditions for 4 days with free access to food and water, and were used in compliance with the principles set forth in the ‘Guide for Care and Use of Laboratory Animals.’ All animal experimental protocols were approved by the University of New Mexico Animal Care and Use Committee. To test the feasibility of using nitroxides for mapping brain O2 distribution, LiPc particles (about 0.2 mm in diameter) were implanted into the brains of four mice anesthetized by inhalation of 4% isoflurane in N2O:O2 (7:3) 5 days before EPR experiments. Nitroxide [
Focal cerebral ischemia model
Focal cerebral ischemia was achieved by right-sided endovascular middle cerebral artery occlusion (Longa et al, 1989; Liu et al, 2006). Briefly, in an anesthetized mouse, the right carotid arteries were exposed through a midline cervical incision. The right external carotid artery was dissected free and isolated distally by coagulating its branches (Bipolar Electric Coagulation, GN60; Aesculap AG & Co., Tuttlingen, Germany) and placing a distal ligation before transaction. A piece of 4-O-monofilament nylon suture, with its tip rounded by gentle heating, was introduced through the lumen of the right external carotid artery stump and the right internal carotid artery to embed into the right anterior cerebral artery, so that the right middle cerebral artery was occluded at its origin. An abrupt reduction in regional cerebral perfusion to <30% of the baseline value, as verified by laser Doppler measurement, was considered to achieve focal ischemia. After 30 min of ischemia, MR and EPR images of the heads of sham controls and ischemic mice were obtained.
Magnetic resonance imaging experiments
Mice with middle cerebral artery occlusion were placed in a custom-built holder and moved to the isocenter of the magnet before imaging. Throughout the imaging session, animals were anesthetized with isoflurane (4% for induction, 1% for maintenance), and the heart and respiratory rates were monitored in real time.
MRI was performed on a 4.7T Biospec® dedicated research MR scanner (Bruker Biospin, Billerica, MA, USA), equipped with a 500 mT/m (rise time 80–120 μs) gradient set for performing small animal imaging, and a small-bore linear RF coil (ID 72 mm). Initial localizer images were acquired using the following parameters: 2D fast low angle shot; TR/TE, 10/3 ms; matrix, 256 × 128; FOV, 6.4 cm; 1 slice per orientation. After acquisition of localizer images, T2-weighted and diffusion-weighted imaging (DWI) were performed with the following parameters: T2-weighted 2D RARE (rapid acquisition with relaxation enhancement), TR/TE, 4000/65 ms; FOV, 2.5 cm × 2.5 cm; slice thickness, 1.0 mm; slice gap, 0.5 mm; number of slices, 10; matrix, 256 × 128; number of averages, 20; receiver bandwidth, 50 kHz; DWI–2D diffusion-weighted RARE, TR/TE; 2000/31.2 ms; FOV, 2.5 cm × 2.5 cm; slice thickness, 1.0 mm; slice gap, 0.5 mm; number of slices, 10; matrix, 64 × 64; number of averages, 20; receiver bandwidth, 100 kHz; d=5 ms; D=20 ms; b-value of 0 and 900 s mm−2; diffusion gradient along the slice-select direction. The DWI method was slice matched to the T2-weighted method. The acquired data were postprocessed on a dedicated workstation.
In vivo electron paramagnetic resonance imaging experiments
Mice were placed in a plastic holder, fitted with a plastic tube for inhaled gas anesthesia, and mounted into the cavity of the L-band EPRI system equipped with 3D planar gradient sets.
EPR spectra with and without a field gradient were obtained with the following acquisition parameters: microwave frequency, 1.12 GHz; microwave power, 18 mW; central field, 410 G; modulation frequency, 50 kHz; modulation amplitude, 0.4 G. The image types were either signal intensity images, which report solely on the intensity of the EPR signal in space, or spectral-spatial imaging defining both intensity and the line width of the nitroxide in space. Spectral-spatial-imaging parameters were the same as intensity images, but the field gradients are controlled by proprietary software. Images were reconstructed by filtered back projection, and line width imaging was obtained by further data processing with software provided by Bruker Inc. Moreover, a calibration curve based on the EPR line width of nitroxide [
Hyperoxic treatment
To show the effects of normobaric hyperoxic treatment on pO2 in the focal ischemic mouse brain in vivo, four mice were anesthetized with isoflurane, injected with nitroxide [
Results
Phantom study for determining spatial resolution of electron paramagnetic resonance images
An initial series of experiments focused on establishing the spatial resolution of EPRI. We used a phantom comprising a bundle of 15 tubes, eight of which contained 1 mol/L nitroxide [
Oxygen sensitivity of nitroxides in mouse brain
Data depicted in Figure 2 indicate that the spatial resolution of EPR spectral-spatial images may be adequate for mapping variations in brain O2 levels. We next evaluated nitroxides as oxygen sensors for EPRI in vivo. Earlier, we reported that the EPR spectral line width of LiPc particles, stereotaxically implanted into specific sites in a mouse brain, was an accurate measure of local O2 concentration at the site of implantation (Liu et al, 1995; Ilangovan et al, 2004; Hou et al, 2004; Liu et al, 2004; Hou et al, 2005). Therefore, as a reference standard for in vivo O2 measurement, LiPc particles were implanted into the brains of mice (n=6) 3 days before administration of nitroxide [
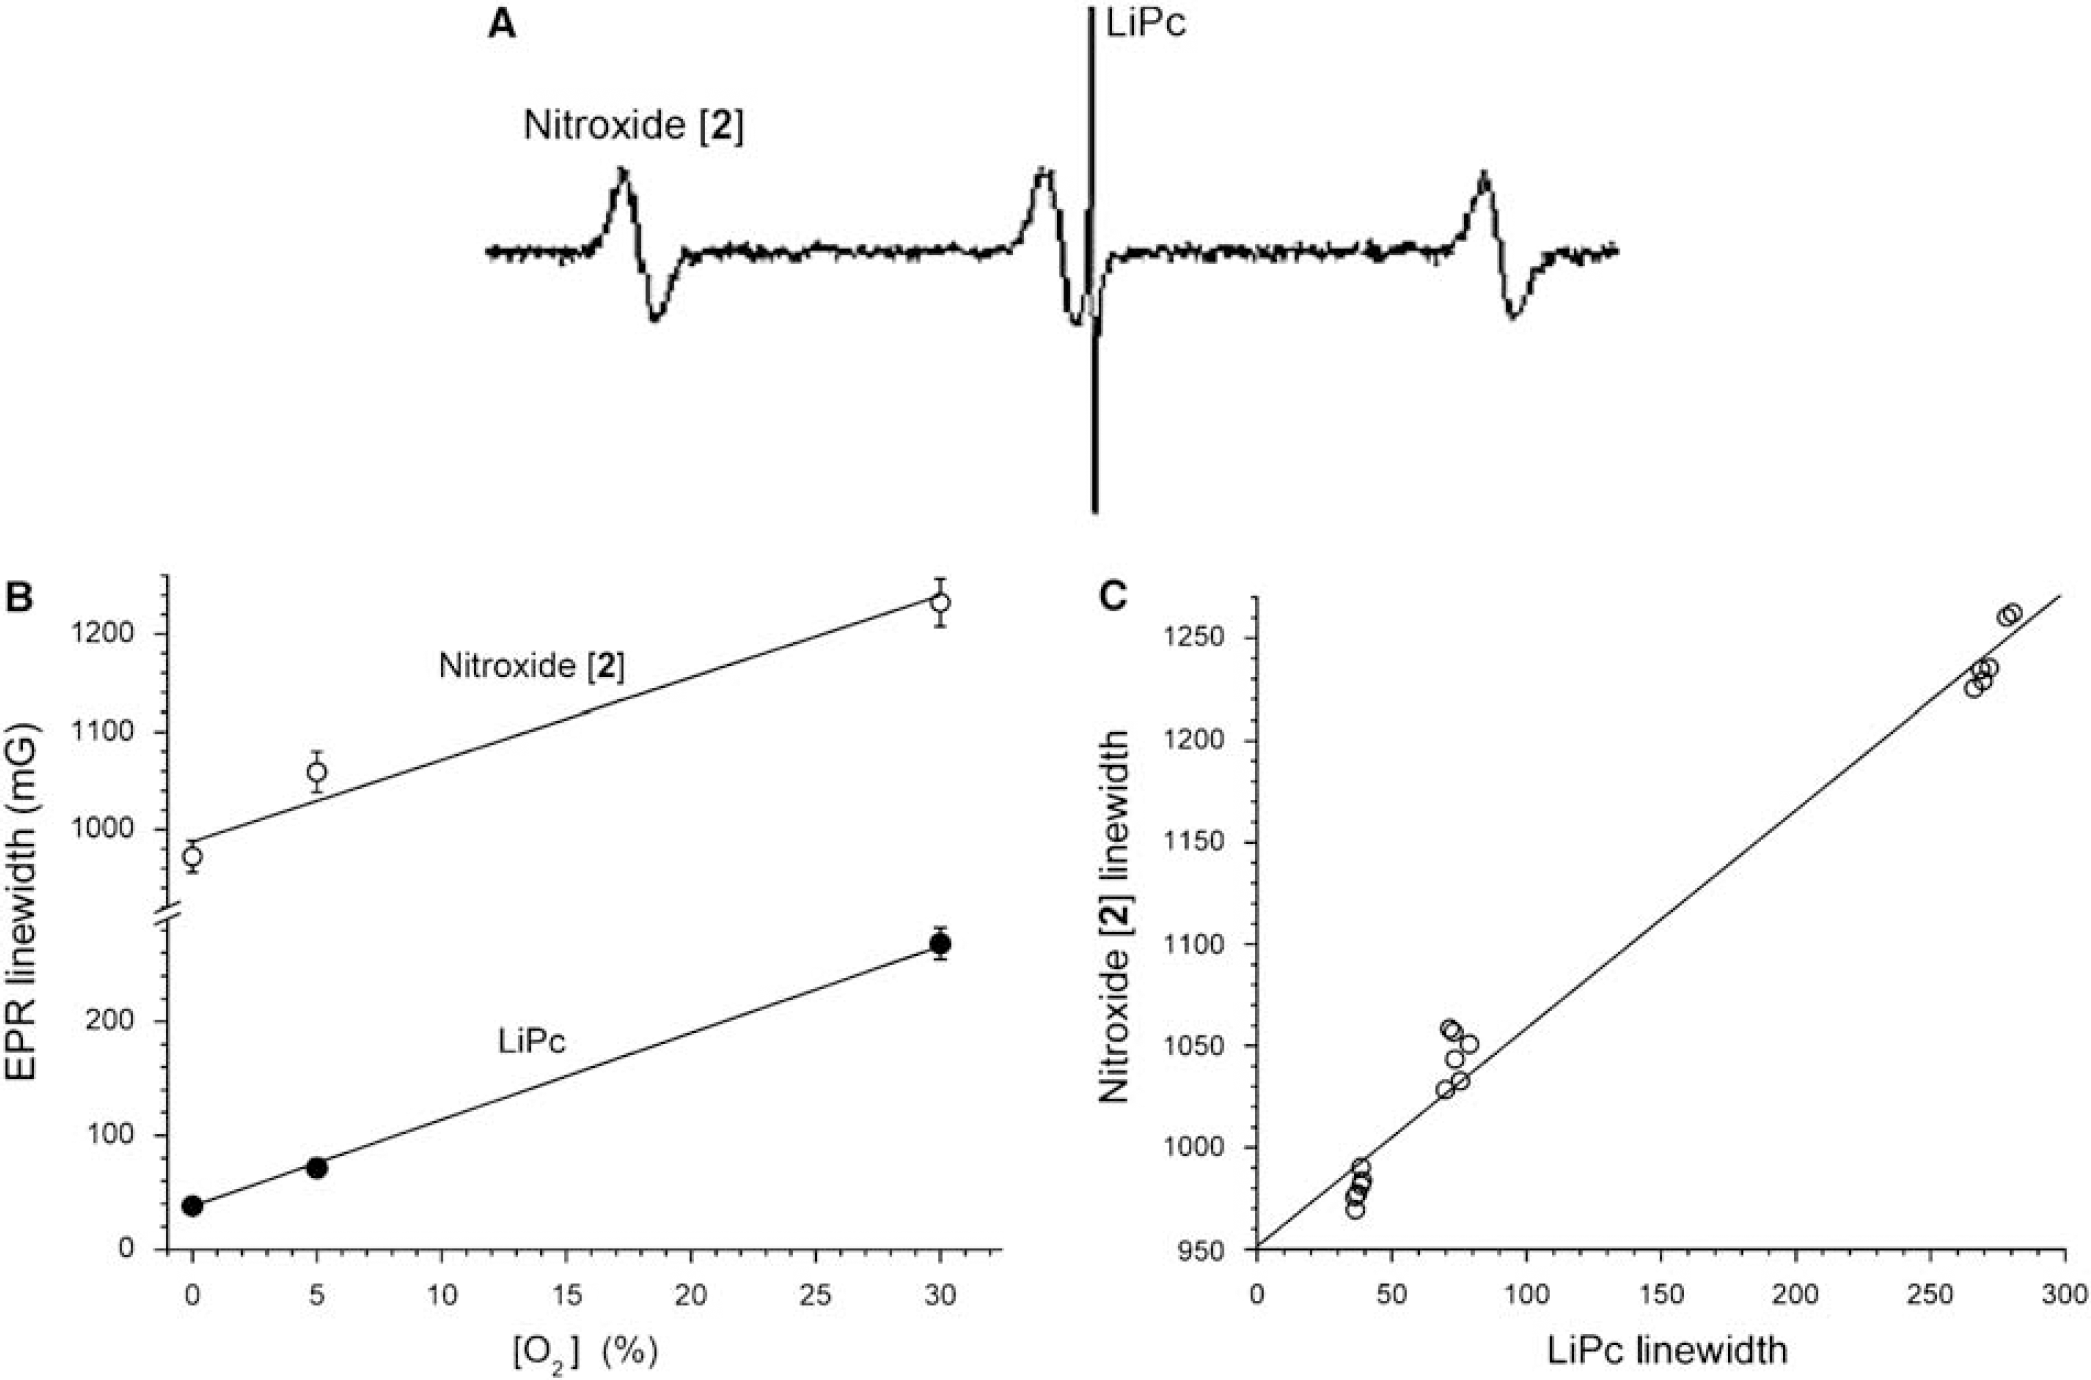
Variation of EPR line width of nitroxide [
Electron paramagnetic resonance imaging of brain O2 during focal ischemia
In Figure 3, the changes in nitroxide EPR spectral line width reflect the average changes of pO2 across the entire brain, whereas similar data from LiPc only report pO2 in the tissue immediately surrounding the implanted LiPc (spherical volume with ∼1 mm diameter). It would, however, be advantageous to measure oxygenation in tissues with inhomogeneous distribution, as occurs after ischemic stroke or traumatic brain injury. The addition of a magnetic field gradient to a static magnetic field (Elas et al, 2003; Matsumoto et al, 2005; Matsumoto et al, 2006) enables spatial encoding of the EPR spectrum of nitroxide molecules within each local region (i.e., pixel). Line width data from such a spatially localized spectrum can then be converted into pO2 for that local region.
To test the validity of our approach, L-band EPR spectroscopy, with nitroxide [
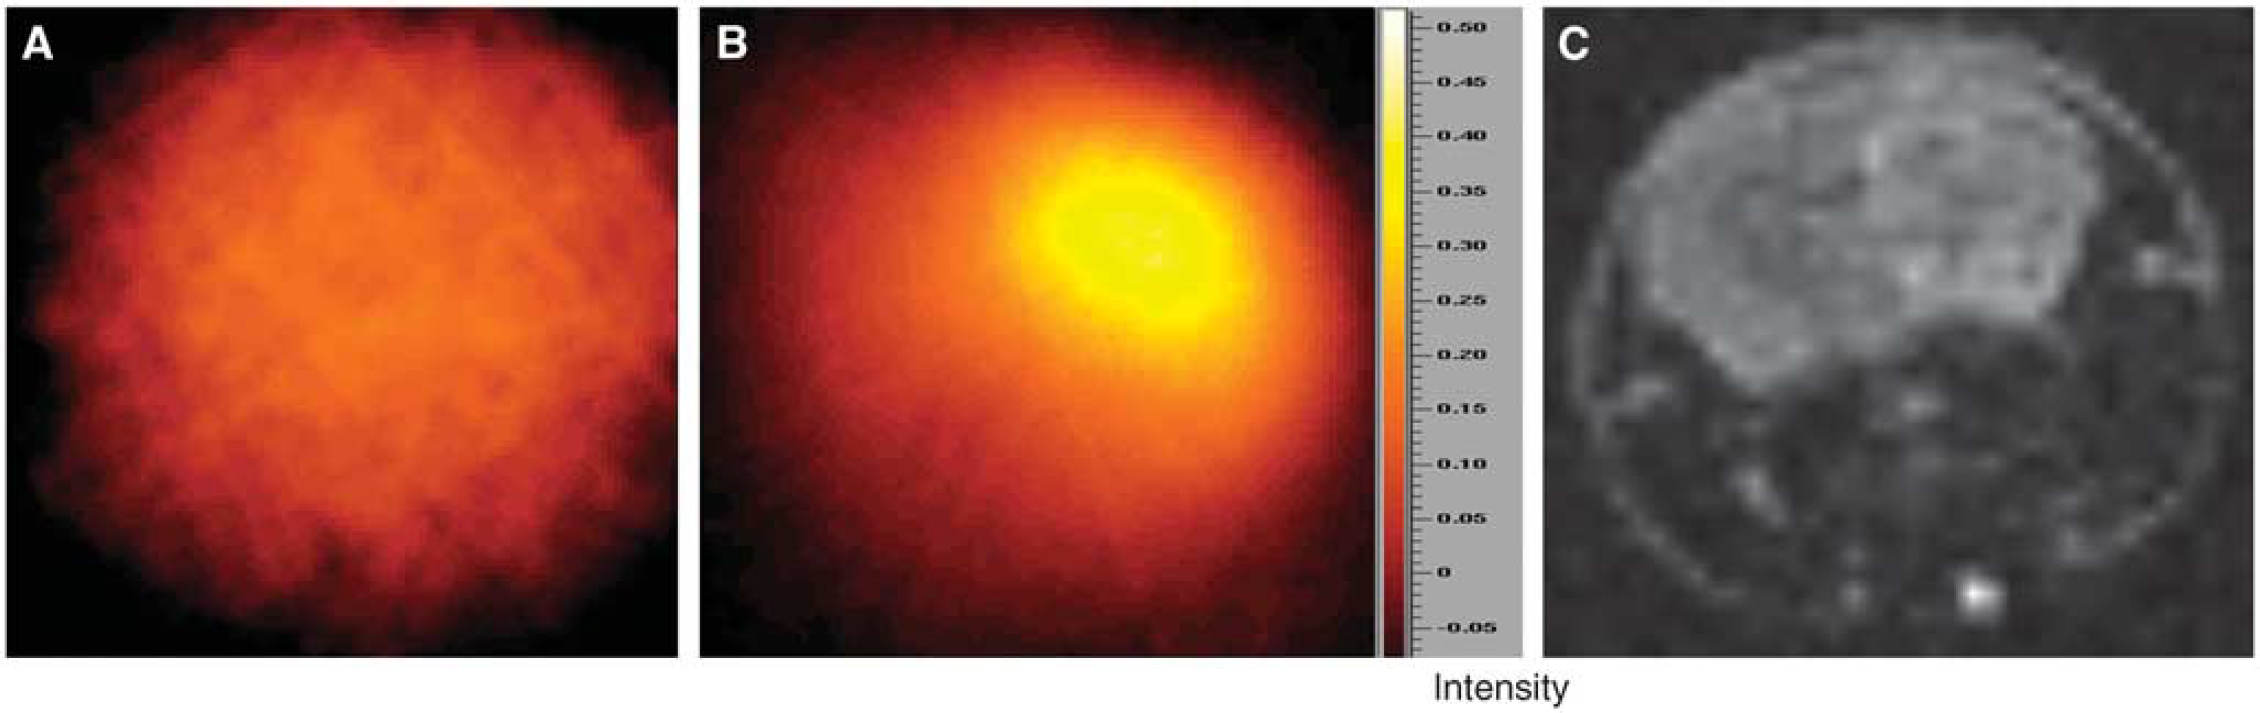
Comparison of EPR intensity image and MR diffusion image in ischemic mouse brain is shown. (
To definitely show the oxygen distribution in the ischemic brain, spatial spectral images were obtained, and were then transformed into pO2 images by using the line width of the EPR signal (Figures 5A and 5B). As expected, O2 concentration in the head of the control mouse was relatively uniform throughout the brain (Figure 5A). However, in parallel with the EPR spectral-spatial image of the focal ischemic brain (Figure 4B), O2 concentrations in the left and right hemispheres were markedly different (Figure 5B). By comparing the EPR and MR images, the low-O2 region in the EPR image matched well with the corresponding infarction area identified with the MR diffusion image (compare images in Figures 5B and 5C). Importantly, the EPR line width image indicated that, even within the same ischemic hemisphere, the pO2 distribution was heterogeneous. Interestingly, the hypoxic region with pO2 <5 mm Hg was relatively small (darkest region in Figure 5B), even though the MRI diffusion image showed a relatively large infarction area induced after 30 min of focal cerebral ischemia (Figure 5C). To examine the pO2 distribution in the ischemic brain, we measured the spatial profile of pO2 along the black line in Figures 5A and 5B. The spatial pO2 profiles are shown in Figure 5D and reveal that only a few points showed pO2 <10 mm Hg at the particular brain locus. The pO2 values across the brain section were also plotted in Figure 5E as a histogram, which shows that the distribution of tissue pO2 values was centered at ∼40 mm Hg in the nonischemic brain, whereas several loci in the ischemic brain had pO2 <20 mm Hg. These findings suggest that the anoxic regions are smaller than the infarct area, perhaps offering a window of opportunity for therapeutic intervention aimed at correcting these intensely hypoxic foci.
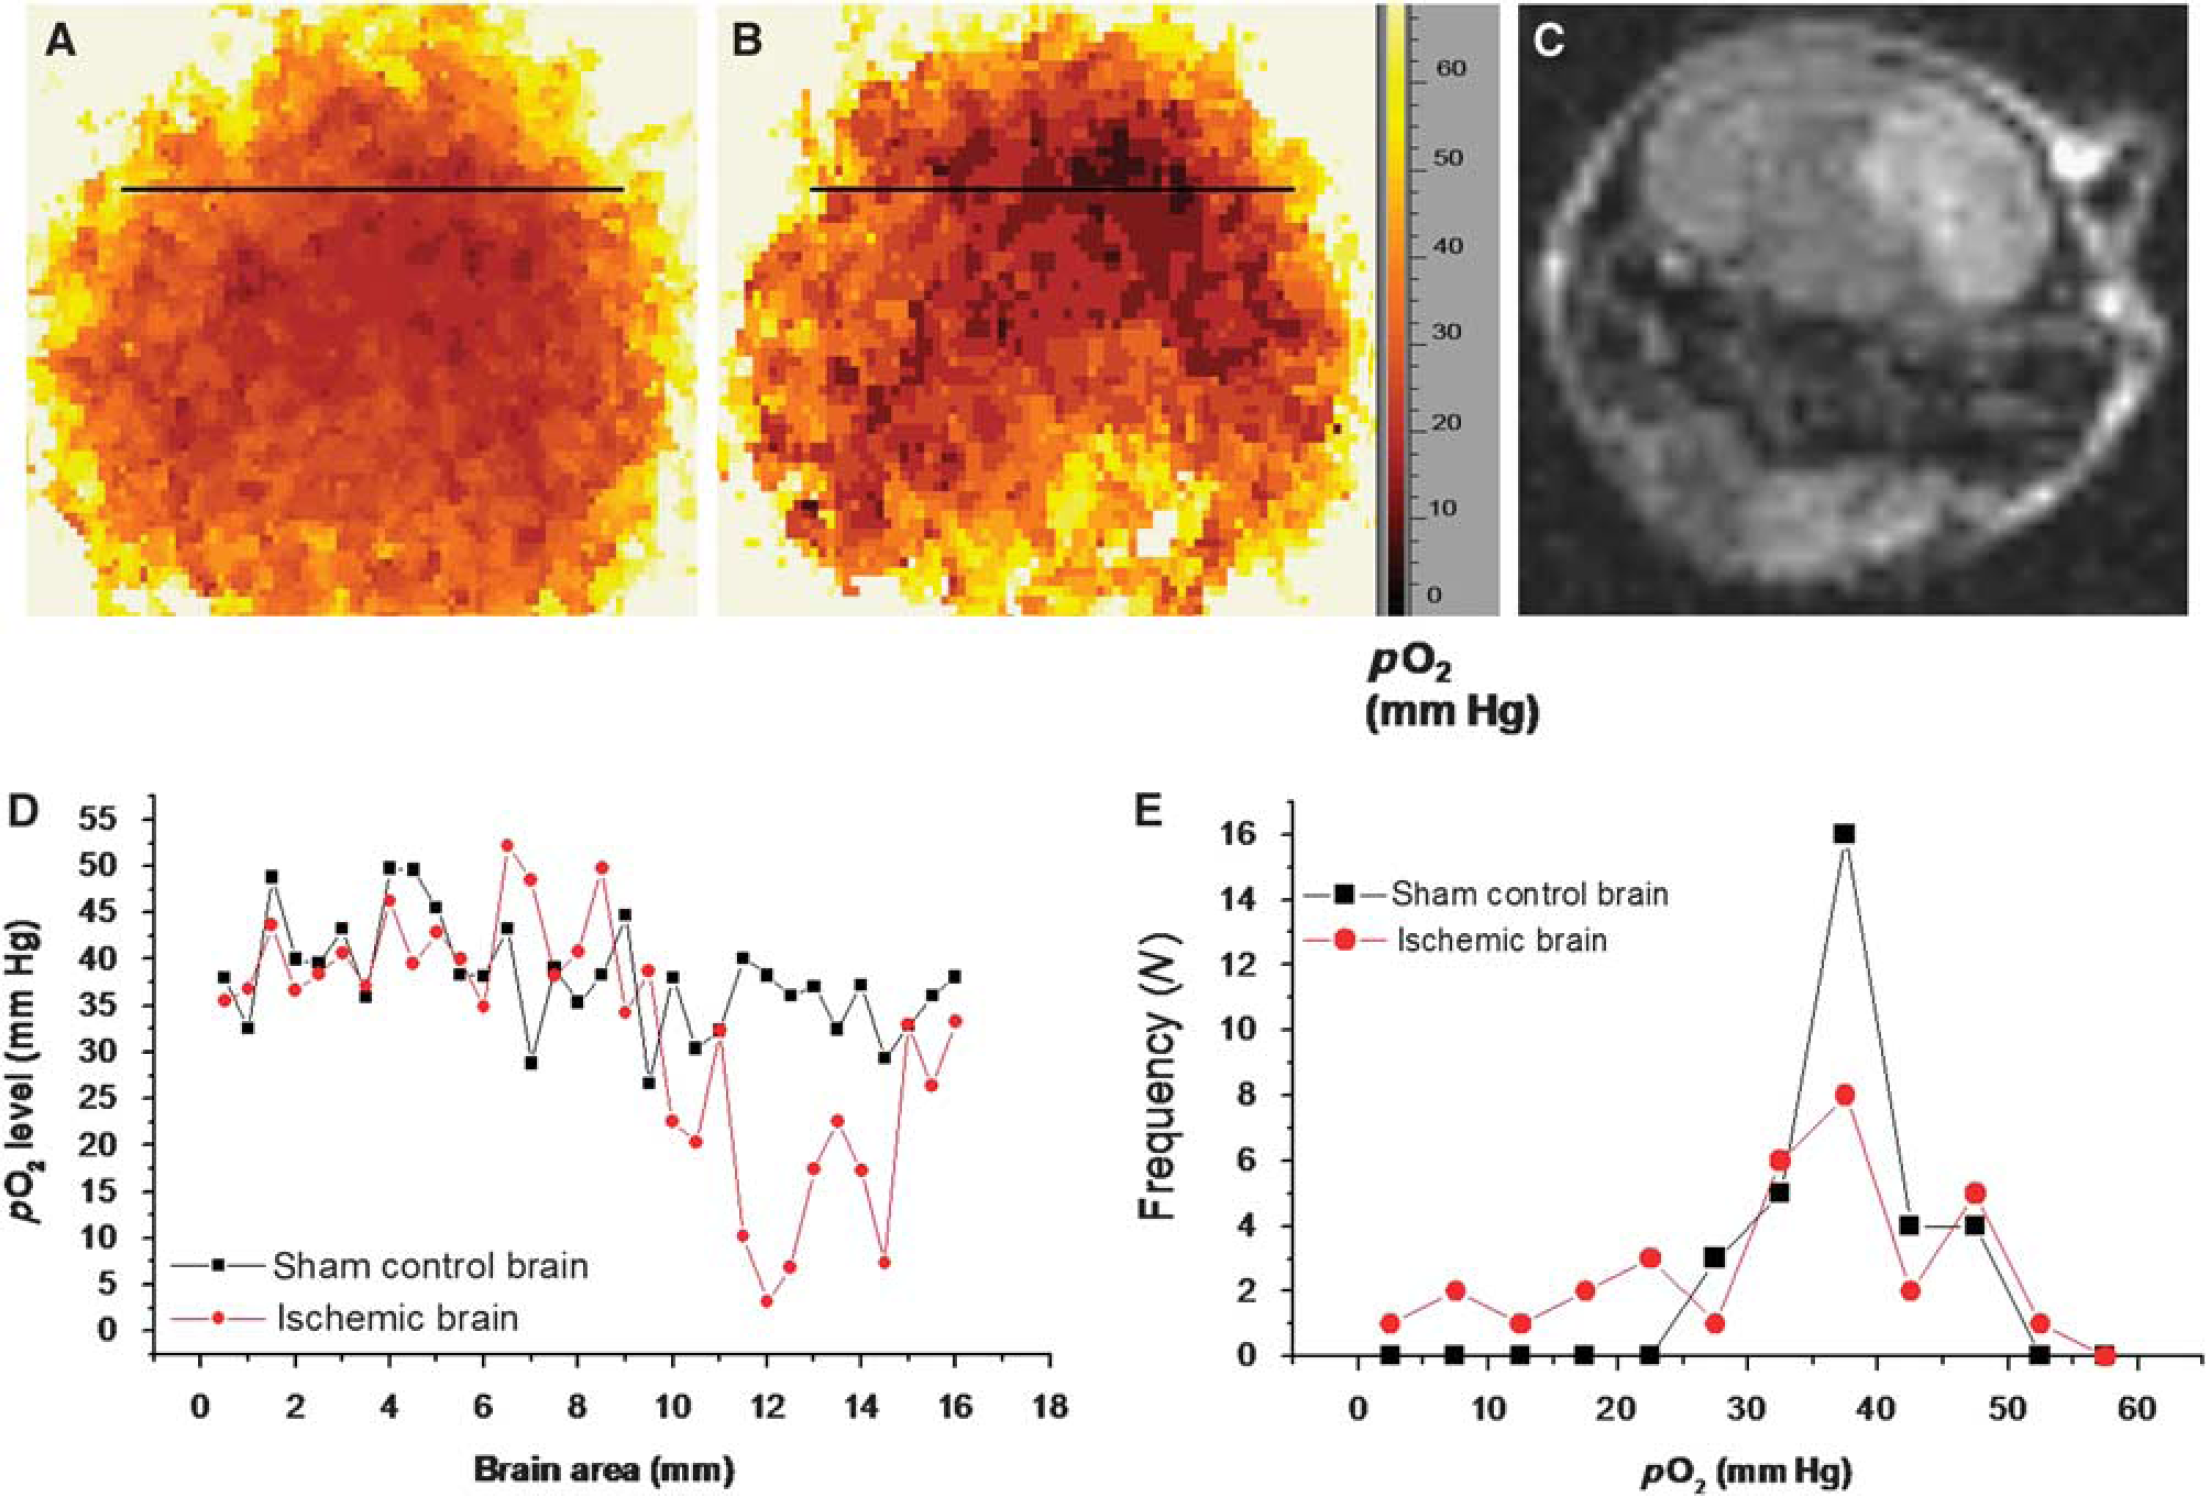
pO2 distribution in sham control and ischemic mouse brain obtained by EPR spectral-spatial imaging. (
Effects of hyperoxic treatment on brain pO2 in focal cerebral ischemic mice
It has been reported that normobaric hyperoxia is beneficial in reducing brain injury in animal models of stroke, when O2 is administered during transient cerebral ischemia (Singhal et al, 2002a, 2002b; Liu et al, 2006). Our earlier study using single-site pO2 measurement with LiPc indicates that normobaric hyperoxic treatment with 95% O2 significantly increased cerebral tissue pO2 in mouse brains during ischemia (Liu et al, 2006). We now wish to ascertain the overall effect of hyperoxic treatment on brain oxygenation by mapping O2 distribution in the entire ischemic brain through EPRI, and to determine whether hyperoxic treatment could increase cerebral pO2. To this end, nitroxide [
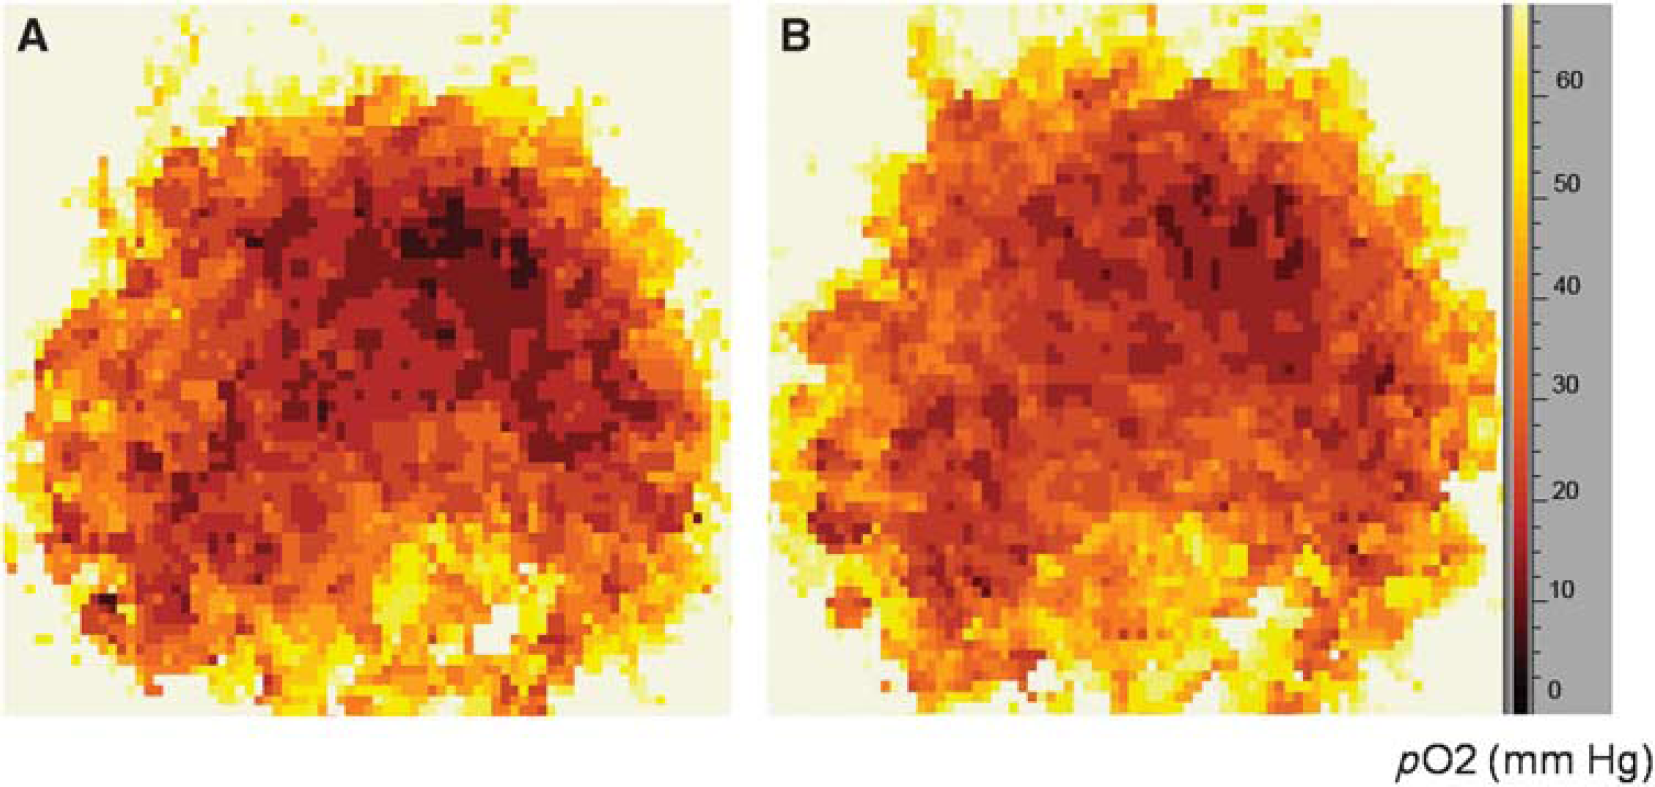
(
Discussion
Continued advances in neuroimaging technology, such as functional MRI, computed tomography, or positron emission tomography, have made it possible to map anatomic and functional changes during brain infarction, thus providing therapeutic opportunities to ameliorate the consequences of a stroke (Baird and Warach, 1999). However, despite these remarkable advances in stroke diagnosis and evaluation, there are no reliable, minimally invasive-imaging modalities that can accurately measure brain O2 distribution in vivo, in situ, and in real time. In earlier publications, we evaluated the ability of structurally different nitroxides to cross the blood–brain barrier and enter the brain tissue, in which local enzymatic action caused entrapment of these paramagnetic probes in the brain tissue. Furthermore, we showed the ability of nitroxides to accurately report local O2 concentrations using low-frequency EPR spectroscopy as an imaging modality (Miyake et al, 2006; Shen et al, 2006). The experiments described here are among the first reports of O2 mapping in an ischemic mouse brain in real time. The change of O2 concentration in this experimental paradigm of brain ischemia was clearly visualized by EPR spectral-spatial imaging of the nitroxide line width. The hypoxic zone in the EPR images matched well with the infarction area in the brain as revealed by diffusion-weighted MRI. EPRI indicated that the hypoxia region with the pO2 <5 mm Hg was relatively small, even though the MR diffusion image showed a relatively large infarction area after 30 min of focal cerebral ischemia, suggesting that not all tissues in the ‘infarcted area,’ as defined by DWI or TTC staining, are highly hypoxic. Normobaric hyperoxia treatment significantly increased overall tissue pO2 and reduced the hypoxic region in the ischemic mouse brain.
In earlier studies, EPRI has been used to map local distribution of O2in vivo, including in tumor-bearing animals (Matsumoto et al, 2006; Krishna et al, 1998; Elas et al, 2003; Kuppusamy and Zweier, 2004; Matsumoto et al, 2008). However, a major obstacle in EPRI for O2 mapping in the brain has been the synthesis of paramagnetic probes that (1) can cross the blood–brain barrier, (2) have high O2 sensitivity, and (3) can be retained in brain tissue at sufficiently high concentration to permit imaging of O2 over time. As detailed in recent publications (Kao and Rosen, 2004; Shen et al, 2006; Miyake et al, 2006; Burks et al, 2008), we have designed and synthesized a family of nitroxides that can cross the blood–brain barrier to enter the brain tissue, in which local metabolic conversion traps a derivative of the parent nitroxide. In this study, we tested the feasibility of using nitroxide
An important finding is the ability to quantitate O2 in the brain after introducing nitroxide [
It is noteworthy that breathing 95% O2 significantly increased the pO2 level in the focal cerebral ischemic brain (Figure 6)—overall pO2 was markedly increased relative to when 30% O2 was inhaled. This result is direct evidence that normobaric hyperoxia treatment can improve O2 delivery to the infarction area. In our earlier reports, we suggested that normobaric hyperoxia treatment could increase penumbral pO2, reduce infarction volume, improve neurologic function, decrease the generation of reactive O2 species, and reduce matrix metalloproteinase-9 expression and caspase-8 cleavage in the ischemic brain (Liu et al, 2006; Liu et al, 2009). Thus, normobaric hyperoxia could be a valuable therapeutic approach for saving the ischemic brain.
Our long-term objective is to map O2 distribution for diagnosis of brain hypoxia and for evaluation of therapeutic approaches in ischemic stroke in animal experiments and clinical trials. Despite the success of the experiments reported here, there are several issues that need to be resolved before EPRI is applicable for clinical application in cerebral stroke: (1) the EPR line width of nitroxides, such as nitroxides [
Footnotes
Acknowledgements
This research was supported in part by grants from the National Institutes of Health, RR15636 and AG031725 (KJL), RGC GRF No. 774408M (JGS), EB2034 and DA023473 (GMR), and GM56481 (JPYK). The authors thank Bruker BioSpin, Inc for technological support.
The authors declare no conflict of interest.