
Abstract
Predicting tissue outcome remains a challenge for stroke magnetic resonance imaging (MRI). In this study, we have acquired multiparametric MRI data sets (including absolute T1, T2, diffusion, T1ρ using continuous wave and adiabatic pulse approaches, cerebral blood flow (CBF), and amide proton transfer ratio (APTR) images) during and after 65 mins of middle cerebral artery occlusion (MCAo) in rats. The MRI scans were repeated 24 h after MCAo, when the animals were killed for quantitative histology. Magnetic resonance imaging parameters acquired at three acute time points were correlated with regionally matching cell count at 24 h. The results emphasize differences in the temporal profile of individual MRI contrasts during MCAo and especially during early reperfusion, and suggest that complementary information from CBF and tissue damage can be obtained with appropriate MRI contrasts. The data show that by using three to four MRI parameters, sensitive to both hemodynamic changes and different aspects of parenchymal changes, the fate of the tissue can be predicted with increased correlation compared with single-parameter techniques. Combined multiparametric MRI data and multiparametric analysis may provide an excellent tool for preclinical testing of new treatments and also has the potential to facilitate decision-making in the management of acute stroke patients.
Introduction
Detection of acute ischemia by magnetic resonance imaging (MRI) is a straightforward task exploiting diffusion- and perfusion-sensitive techniques (Schlaug et al, 1999). The remaining challenge in both preclinical and clinical settings is to predict tissue outcome from single time-point MRI scans. The information on the state of the ischemic tissue in the hyperacute phase of ischemic stroke is important in selecting treatment strategies, which currently include alternatives to recombinant tissue plasminogen activator. In patient management, within a time window of a few hours, a decision has to be taken between administering recombinant tissue plasminogen activator for thrombolysis, albumin (believed to act as a reactive oxygen species scavenger), and using hypothermia for global neuroprotection. To this end, one would expect that it would be beneficial to have an objective means of assigning tissue status at the time of ischemic stroke diagnosis.
Diffusion-weighted images visualize the ischemic core that is likely to proceed into infarction within a few hours from the onset of ischemia (Hossmann, 1994). However, although diffusion appears to be ambiguous, as it can decrease or show no change, yet infarction follows in both cases. It is commonplace to find lowered perfusion in a larger brain area than that showing decreased diffusion in the early moments of ischemia, a condition often termed the diffusion–perfusion mismatch. The mismatch volume is taken to encompass the so-called MRI penumbra, which is under an elevated risk of infarction, but is potentially salvageable. T2-weighted MRI provides a degree of certainty in assigning irreversible ischemia, which apart from the immediate decrease after occlusion is associated with the reversible phase of ischemia (Calamante et al, 1999; Gröhn et al, 1998) and shows ischemic pathology only hours after the insult.
Despite the high sensitivity to hyperacute changes attributed to stroke, none of these MRI parameters alone can unequivocally predict tissue outcome, and therefore the potential of more investigational techniques has been recently examined. Magnetic resonance imaging studies exploiting longitudinal rotating frame relaxation, T1ρ, have shown good quantitative correlation between absolute T1ρ and cell death at the early phase of ischemia (Gröhn et al, 1999), suggesting that T1ρ may be a predictor of early irreversible tissue status. T1ρ MRI and related spin-lock contrasts can be acquired by different MRI pulse sequences using either continuous wave (CW) or adiabatic radiofrequency pulses (Jokivarsi et al, 2009; Michaeli et al, 2004). In experimental settings, these spin-lock MR techniques have been used to quantitatively assess water dynamics in different cerebral water pools (Jokivarsi et al, 2009) during ischemia. A further MRI technique probing the chemical exchange of amide protons (Zhou et al, 2003b) has been recently applied to a rat model of stroke induced by middle cerebral artery occlusion (MCAo). It has been shown to provide potentially useful information about tissue status in the acute phase of stroke, about the level of acidification, and with other MRI contrasts it may help to separate the benign oligemia from the ischemic penumbra and core (Jokivarsi et al, 2007; Sun et al, 2008).
It has been shown that neither diffusion and perfusion (Mezzapesa et al, 2006) nor the perfusion–diffusion (Rivers et al, 2006) mismatch is sufficient to predict the outcome of ischemic brain. Several analytical approaches have been explored for their ability to predict the severity of the final lesion from multiparametric MRI data acquired in acute stroke (Jiang et al, 1997; Shen et al, 2003). These studies have exploited diffusion, perfusion, and T2 MR data owing to the inherently complementary biophysical and pathologic information from ischemic parenchyma that is provided by these parameters. Multiparameter studies (Lu et al, 2005; Mitsias et al, 2002) using quantitative T1, T2, and diffusion MRI have shown the potential to predict final lesion size as supplemented with a priori knowledge of the location of stroke. Recent clinical MRI studies indicate that the volume with defective CBF at the acute stage closely matches the final infarction volume (Sorensen et al, 1999). These observations are intriguing as far as the prediction of the ischemic core is concerned in the hyperacute phase of the stroke. Nevertheless, predicting the fate of the ‘MRI penumbra’ remains an elusive challenge.
The aim of the study was to investigate the predictive value of established (T1 and T2) and the investigational (T1ρ and amide proton transfer ratio (APTR)) MRI contrasts, as supplemented with cerebral blood flow (CBF) as determined by MRI, in predicting the histologic outcome in a transient MCAo rat model. The goal was to quantify how these MR parameters alone or in combination, as measured in the acute phase of ischemia, correlate with neural damage by histology during the first 24 h after occlusion when the majority of the acute cell deaths have been shown to take place in the rat model used (Gröhn et al, 1999).
Materials and methods
Animals
Male Wistar rats (weight range from 280 to 320 g, n = 13) were anesthetized with isoflurane (2.5% during surgery, maintained at 1.5% to 2% during MRI) with a constant flow of 70:30 N2O/O2 through a face mask. MCAo was induced using the intraluminal thread method (Longa et al, 1989) before the rats were taken into the magnet bore. The occlusion time for the MCAo was 65 mins, after which the thread was remotely pulled out 6 mm without moving the rat out from the magnet bore. Arterial blood gases and pH were analyzed immediately before and during MR scanning (i-Stat, East Windsor, NJ, USA). The core temperature was monitored online and maintained close to 37°C by circulating warm water in a heating pad placed under the torso. Breathing rate was monitored online throughout the study (SA Instruments, Stony Brook, NY, USA). All animal procedures were approved by the Animal Care and Use Committee of the University of Kuopio and conducted in accordance with the guidelines set by the European Community Council Directives 86/609/EEC.
Magnetic Resonance Imaging
Magnetic resonance imaging experiments were performed in a horizontal 4.7 T magnet (Magnex Scientific, Abingdon, UK) interfaced to a Varian Inova console (Varian, Palo Alto, CA, USA). A volume coil was used as a transmitter and a quadrature half-volume surface coil as a receiver (Rapid Biomedical GmbH, Rimpar, Germany) for all MRI acquisitions.
An axial imaging plane (field of view 2.56 × 2.56 cm2, 128 × 64 points) was positioned so that the center of the slice (thickness 1.5 mm) was 5 mm caudally from the olfactory bulb. The MR data set was acquired once during the MCAo (between 30 and 60 mins of MCAo). The occluder thread was retracted after 65 mins of MCAo while the animal was in the scanner, and three further MR data sets were acquired between 0 to 30, 30 to 60, and finally 90 to 120 mins after the removal of the occluder. Magnetic resonance imaging scans were also repeated at the 24-h time point. The MR imaging for each time point included acquisitions of T1, T2, diffusion, arterial spin labeling (for blood flow), T1ρ,CW, and T1ρ,HS8 data sets.
The order and duration of MR scans at each time point above were as follows: T1ρ,CW (duration of data acquisition: 2 mins), T1ρ,HS8 (2 mins), diffusion (8.5 mins), arterial spin labeling (14 mins), T1 (2 mins), T2 (2 mins), and B1 (2.5 mins) scans leading to a total MRI time of 33 mins and 20 secs. This was followed by the acquisition of the amide proton transfer ratio (APTR using the technique described by Zhou et al (2003a) at three time points (120 to 150, 180 to 210 mins, and at 24 h after MCAo). Each APTR scan lasted for ∼30 mins. Values shown for each MR parameter refer to the start of the entire MR acquisition lot, yet the actual starting time point varied. For instance, for ‘T2 at 60 mins,’ it was about 89 mins.
The trace of diffusion tensor (D av = (1/3) Trace(d)) image was used to localize the acutely ischemic tissue (Kettunen et al, 2000). The D av was quantified using a spin-echo MRI sequence incorporating four bipolar gradients along each axis (Mori and van Zijl, 1995) with four b-values ranging from 0 to 1,370 secs/mm2 (time to repetition (TR): 1.5 secs and time to echo (TE): 55 ms).
The on-resonance spin-lock T1ρ (T1ρ,CW) MRI was acquired with a conventional CW-T1ρ approach. A contrast formation block consisting of an adiabatic half-passage spin-lock adiabatic half-passage (AHP-SL-AHP) segment was added before a fast spin-echo sequence readout (echo spacing 10 ms). Adiabatic spin-lock pulses (Gröhn et al, 2005) ranging from 8 to 64 ms were used with a target spin-lock amplitude B1,SL = 0.4 G with TR 2.5 secs and TE 6 ms. Adiabatic T1ρ (T1ρ,HS8) MR images were also collected using hyperbolic secant (HS8) pulses (Garwood and DelaBarre, 2001). The phases of adiabatic full-passage (AFP) pulses were prescribed according to the MLEV4 scheme (train of 4 to 32 AFPs, pulse duration of 2 ms, no interpulse delay).
T2 images were computed from the multi-TE data sets (five TEs) using the fast spin-echo sequence with a preparation block consisting of adiabatic pulses (AHP-TE/4-AFP-TE/2-AFP-TE/4-reverse AFP). Both TR and TE within the fast spin-echo readout were set similar to those used with the spin-lock acquisitions.
T1 maps were calculated from the inversion recovery MR images acquired with five inversion times ranging from 5 to 1,500 ms (TR = 3 secs) with the same fast spin-echo readout as above.
Cerebral blood flow was measured using a continuous arterial spin labeling technique (Detre et al, 1992). A 3-sec labeling pulse was used with a 500-ms postlabeling delay (3.0 secs prepulse delay, B1 = 0.05 G). The labeling pulse was centered 2 cm from the imaging plane, caudally for the labeled image and rostrally for the control image. Cerebral blood flow was estimated using the formula
where ΔM is the magnetization difference between the labeled and control images, λ the blood–brain partition coefficient, and T1 the longitudinal relaxation time (Thomas, 2005). Value for λ was assumed to be a constant value of 0.9 mL/g (Herscovitch and Raichle, 1985). Eight label-control pairs were used to calculate the average signal difference, ΔM.
For APTR, Z-spectral data were acquired by saturating off-resonance frequencies for 5 secs with a train of 2.0 ms long 180 G pulses (γB1 = 50 Hz) without interpulse delay. Fourteen frequencies were measured at ±250, ±3.75, ±3.5, ±3.25, ±3, ±0.5, and ±0.25 p.p.m. offset from the water line and at 0 p.p.m. (TR: 10 secs and TE: 6 ms). To compensate for B0 inhomogeneity, the Z-spectrum minimum was first shifted to match 0 p.p.m. offset for each pixel. Then, the APTR variables were calculated from the asymmetry in Z-spectra at ±3.5 p.p.m. on both sides of the water line using interpolated values from the shift-corrected Z-spectra (Jokivarsi et al, 2007).
A B1 map was calculated for the homogeneity control of the radiofrequency field. A cosine function was fitted to signal intensity oscillation that was caused by a variable length square preparation pulse and a crusher gradient in front of a fast low angle shot (FLASH) pulse sequence (TR: 4.5 ms and TE: 2.2 ms) as previously described (Jokivarsi et al, 2007).
Histology
After the MRI session at 24h after MCAo, the animals were transcardially perfused with saline for 10 mins, followed by 10 mins of perfusion with 4% paraformaldehyde, and the flow of both media was set at 30 mL/min. Postfixation was performed in paraformaldehyde for 4 h, followed by cryoprotection in glycerol with 0.02 mol/L potassium phosphate-buffered saline for 24h. Brains were frozen on dry ice and stored at −70°C until further processing. Slicing was performed using a microtome on 30 μm slices. Quantitative cell counts were obtained from cresyl violet-stained histologic sections using the Stereo Investigator software on a Neurolucida morphometry system (MicroBrightField, Colchester, VT, USA).
Data Analysis
Cell count data from the regions of interest (ROIs) were correlated with the ROI data of given MRI variables. Correlation between cell count and MRI parameters were assessed using a linear multiparametric correlation approach. To evaluate the goodness of a given MRI parameter alone and in combination, we first determined the single MRI parameter showing best correlation with the cell count. After this, the best two and three parameters were calculated to assess the way correlation evolved with these added parameters and which combination produced the highest correlation. Multiparametric images were generated by combining data from the three measured parameters using weighting factors obtained from the ROI analyses.
All MRI data analysis was carried out using an in-house written Aedes software (http://aedes.uku.fi/) developed in the MATLAB environment (MathWorks, Natick, MA, USA). All values are presented as mean ± s.d. Statistical significances of differences between ipsilateral and contralateral sides were estimated using paired Student's t-test.
Results
During the MRI scans, rectal temperature (37°C ± 1°C), blood pH (7.31 ± 0.05), and pO2 (130 ± 16 mm Hg) were within normal physiologic range and pCO2 (58 ± 8 mm Hg) was slightly elevated, which is typical for spontaneously breathing animals under isoflurane anesthesia (Hata et al, 1998). The γB1 used in the T1ρ CW and HS8 type measurements was 1,600 ± 100 Hz (B1 = 0.38 ± 0.02 G). The difference in γB1 between the ipsilateral and contralateral sides (measured at the striatum) was 4 ± 17 Hz (0% ± 1%), which was insignificant with regard to MR data interpretation.
Postischemia Animal Groups
For group analysis, the animals were divided into two groups according to the size of the lesion in histology at 24 h after MCAo. In group A (n = 6), the lesion at 24 h after MCAo encompassed the striatum, the insular cortex, and the somatosensory cortex. In group B (n = 7), the lesion covered the striatum only, but in some rats (n = 3) it extended to the insular cortex. The ROIs were drawn for the striatum (Str), insular cortex (Ins), and lesion-free cortex (Cor) and in the contralateral brain, including the contralateral striatum (CStr), the insular cortex, and the cortex (Figure 1). In Group A, an additional ROI involving the expanded lesion area (Exp), that is, covering the ischemic lesion in the cortex that was not clearly evident in T1, T2, and T1ρ MRI contrasts during MCAo and early reperfusion, but visible in both histology and MRI by 24 h, was added between the insular cortex and the cortex ROIs.
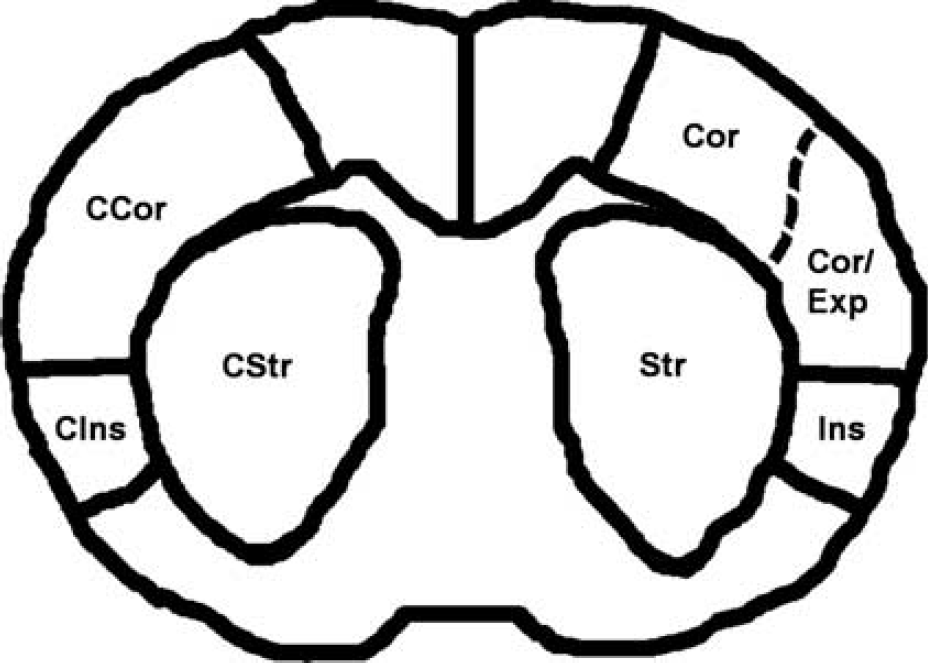
A schematic drawing of the regions of interest (ROIs) demarcating the ipsilateral striatum (Str), insular cortex (Ins), lesion expanding to the cortex (Exp) for group A, undamaged (lesion-free) cortex (Cor), and corresponding contralateral areas (C stands for ‘contralateral,’ e.g., CStr).
Time Courses of Individual Magnetic Resonance Imaging Parameters
Severe ischemia was evident in all MCAo animals as verified by diffusion MRI. In the striatum, 30 mins of MCAo resulted in a decrease of Dav by ∼40% in group A and 30% in group B (Figures 2 and 3) from the Dav value of 0.78 × 10⁻³ mm2/sec. Moderate recovery toward normal values was seen at 60 min after MCA occlusion in all ROIs followed by secondary decline in most severely damaged areas, such as Str A and expansion (Exp A).
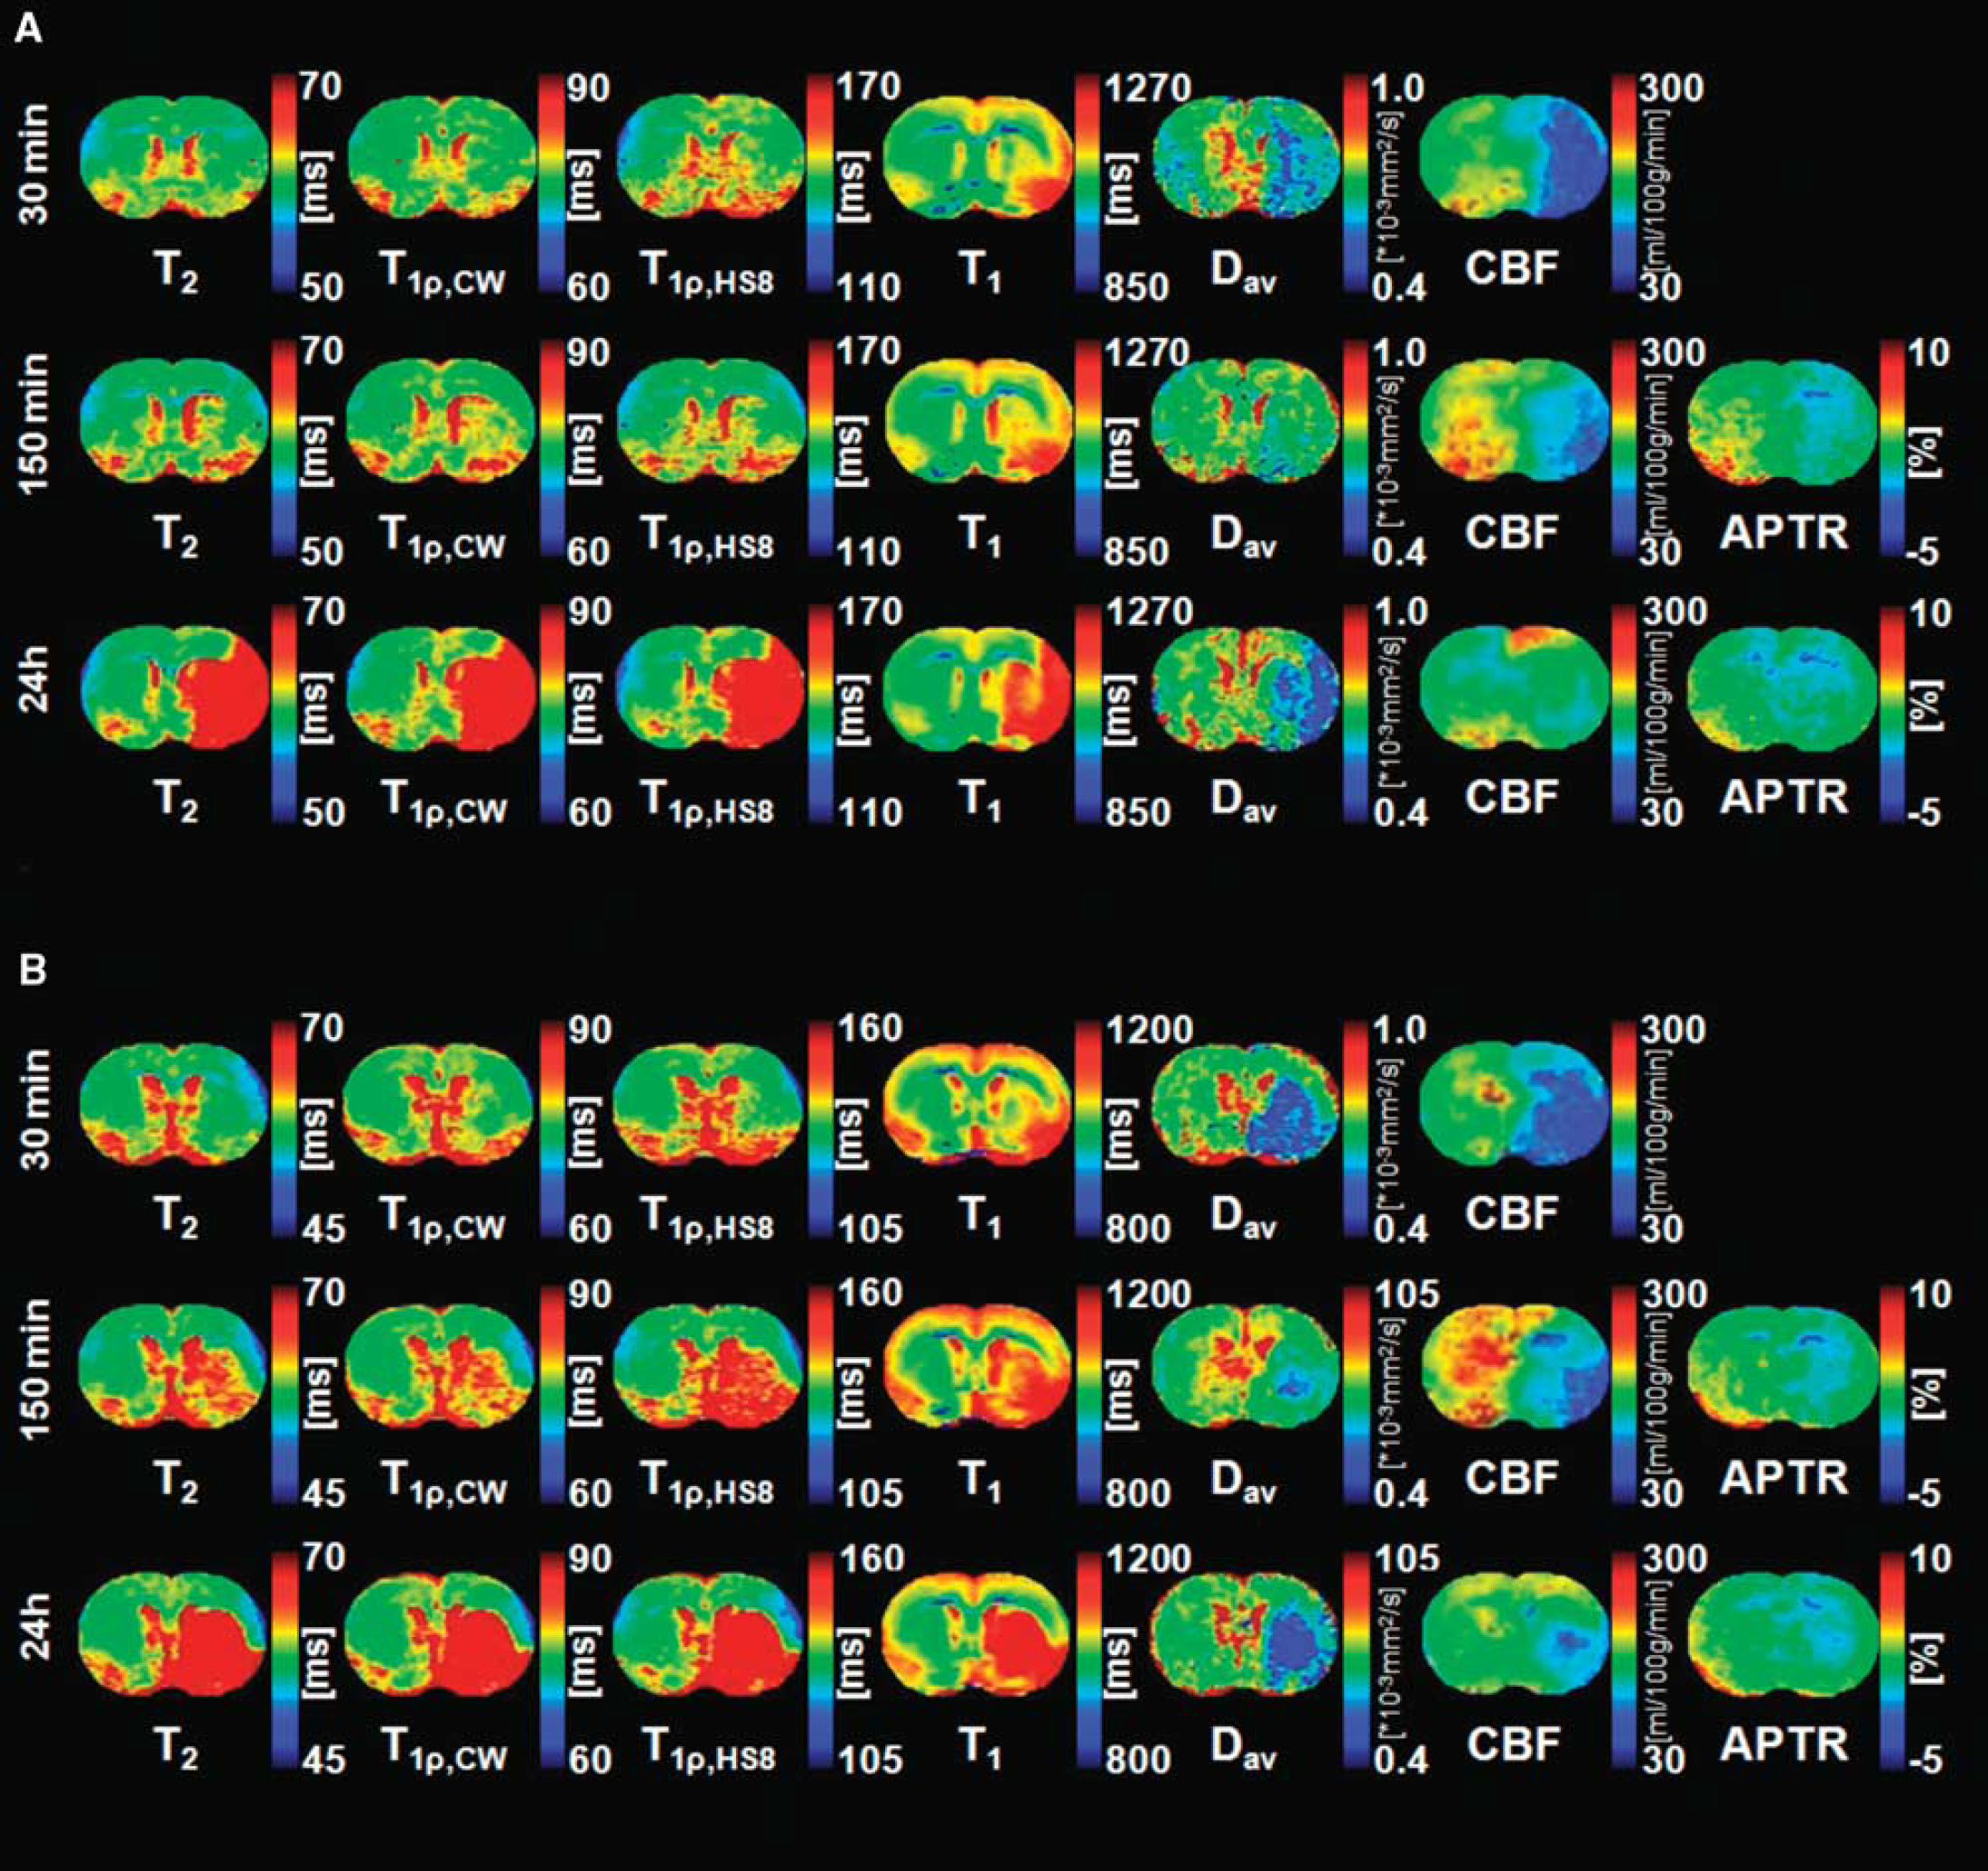
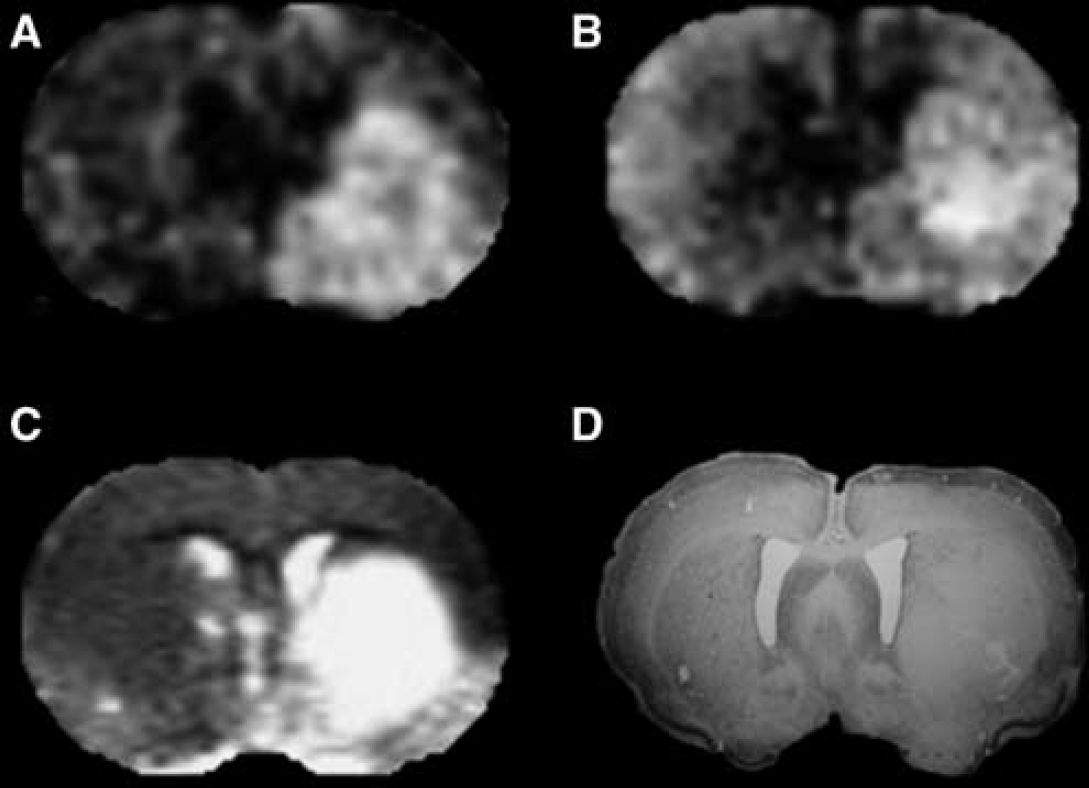
Representative relaxation, diffusion, cerebral blood flow (CBF), and amide proton transfer ratio (APTR) images acquired at three time points during and after middle cerebral artery occlusion (MCAo). Images in panels (
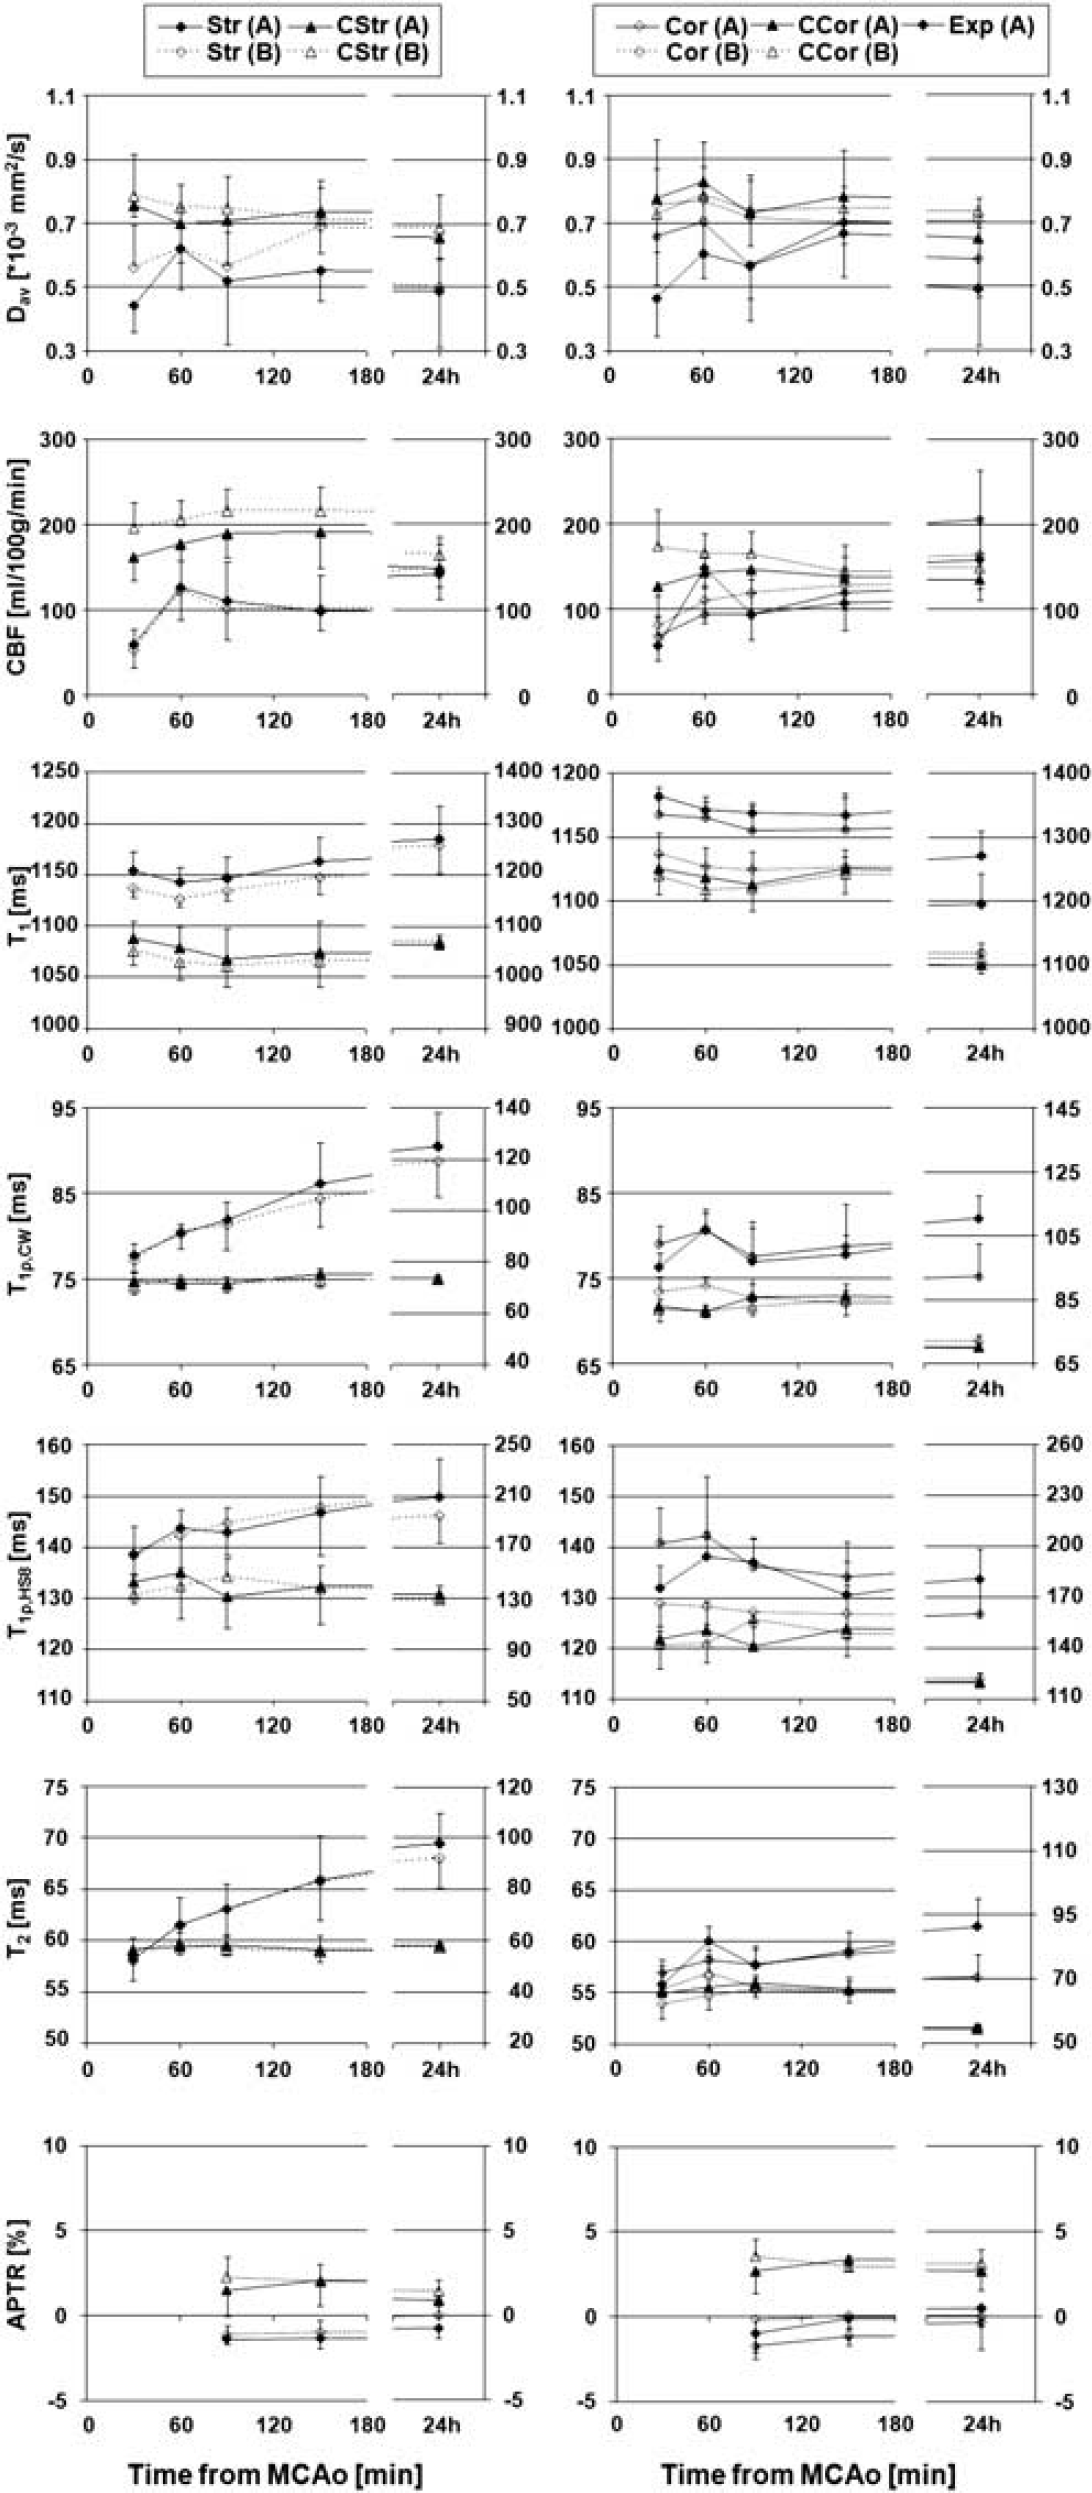
Time-dependent values for diffusion (Dav), cerebral blood flow (CBF), T1, T1ρ,CW, T1ρ,HS8, T2, and amide proton transfer ratio (APTR). The left column shows the data for striatum regions of interest (ROIs) (Str) and the right column shows the data for expansion (Exp) and cortex ROIs (Cor) for the ipsilateral and contralateral sides (denoted with C, e.g., CStr). Data are presented for group A (lesion expanding to the cortex) and group B (mainly striatal lesion) as mean ± s.d. CW, continuous wave.
The CBF had decreased in both rat groups by 70% in the striatum and 80% in the insular cortex relative to the values in the contralateral hemisphere by 30 mins of the MCAo. Only partial recovery of perfusion was detected in the ipsilateral striatum after removing the occluder. Interestingly, despite a very similar decrease in CBF during MCAo in groups A and B, the temporal profiles of CBF behavior during early reperfusion were different in the cortex. The cortical areas in the group A rats, which eventually were included into the overall lesion volume (i.e., Exp A), showed complete recovery of CBF and in some cases even an overshoot soon after occluder removal, whereas the cortex in group B animals with a more favorable tissue outcome showed only small CBF response to occluder removal. However, during follow-up, a secondary decrease in CBF was detected in group A rats, whereas group B animals showed a gradual return of CBF toward physiologic values.
T2 and T1ρ images acquired using either the CW approach or adiabatic pulses showed the progressive nature of tissue damage during the early hours after MCAo. Unlike T2, T1ρ was significantly increased in the striatum as early as 30 mins from the induction of MCAo. T1ρ,CW increased from 74 ± 1 to 77 ± 1 ms (+4%, P<0.01) and T1ρ,HS8 from 132 ± 4 to 138 ± 5 ms (+5%, P<0.01) in the early minutes of ischemia. At later time points, the behaviors of all three relaxation times were very similar in brain tissue destined to infarction characterized either by a progressive increase (in Str) or by a slight recovery immediately after onset of reperfusion followed by a gradual increase as a function of follow-up (in Exp A). It should be noted that a relatively weak spin-lock B1 was used here, resembling the clinically feasible experimental setting for T1ρ MRI explaining why the sensitivity of T1ρ to irreversible ischemia was only slightly better than in T2 measurements (for comparison, see Gröhn et al, 2000).
An immediate increase in T1 by 63 ± 16 ms (+6%, P < 0.001) was detected in the striatum in both groups A and B, consistent with previous reports (Calamante et al, 1997; Kettunen et al, 2000). Interestingly, T1 was able to differentiate lesion expansion area (Exp A) from the recoverable cortex (Cor B) despite very similar initial CBF values in these brain structures. This observation argues that cause(s) for initial T1 increase is (are) not directly flow related.
Owing to the time limitations for MR data acquisition, we were not able to collect APTR data during the MCAo period. After MCAo values of −1.2 ± 0.5%, −1.1 ± 0.5%, and −0.3 ± 0.7% for ΔAPTR in severely ischemic areas at 90 mins, 150 mins and 24 h, respectively, from MCAo were determined, whereas in the contralateral side the values were 1.9 ± 1.4%, 2.1 ± 1.2%, and 1.2 ± 0.9%. Using the pH calibration data from Zhou et al (2003b), this ΔAPTR would translate to a pH change of −0.4 ± 0.3 at both 90 and 150 mins and −0.15 ± 0.10 at 24 h, assuming that pH was the only factor affecting the proton exchange rate during cerebral ischemia. The APTR values for lesion ROIs returned toward normal by 24 h after MCAo, however, remaining lowered for severely damaged tissue.
Histologic Outcome
The lesion area in histologic preparations very closely resembled the lesion visible in T2 MR images at 24 h (Figure 4). Cell counts showed a significant decrease by 56 ± 18% (P<0.001) in the ipsilateral striatum, compared with the contralateral side, and 43 ± 14% (P<0.005) in the expansion area of the cortex, but no significant change in the unexposed cortex (Figure 5).
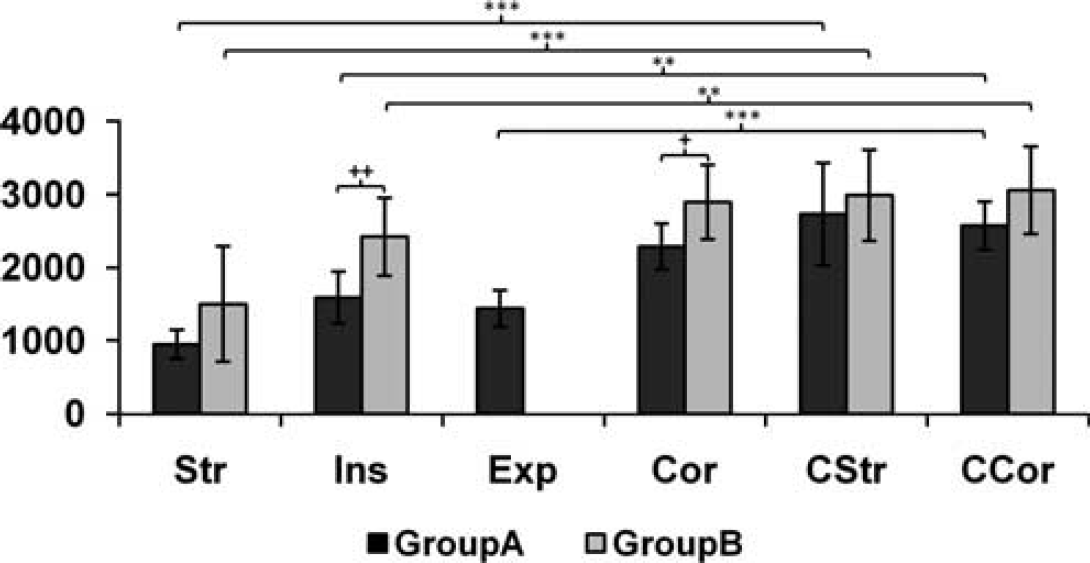
Number of viable cells per mm2 in selected regions of interest (ROIs; ipsilateral and contralateral sides, see text) for groups A and B. Brain areas are labeled as in Figure 1. Significance is shown as follows: ***P = < 0.001, **,+ + P = < 0.01, and +P = < 0.05.
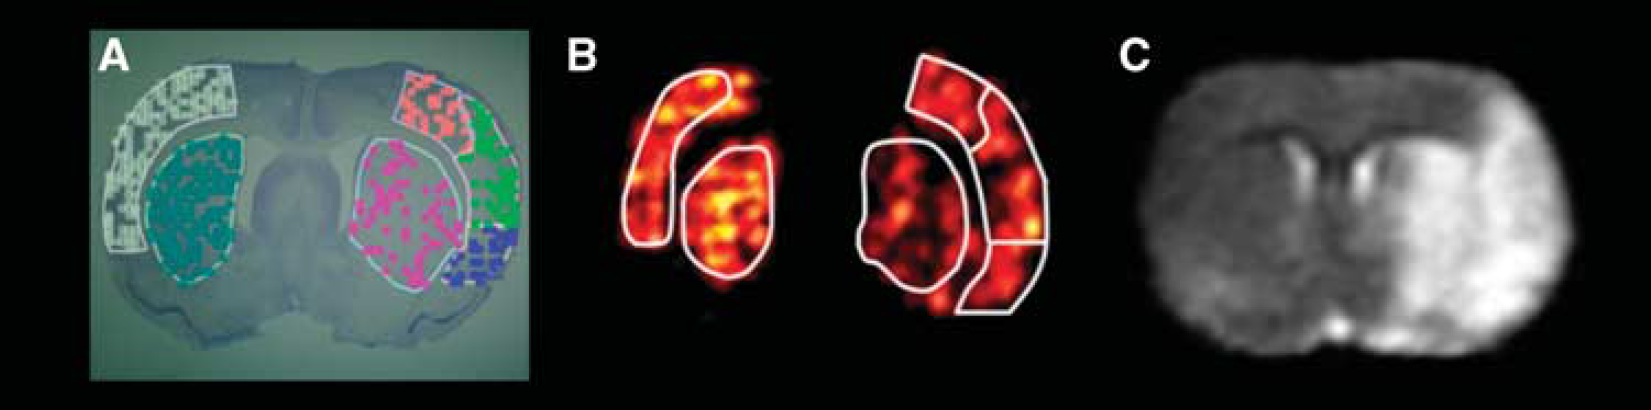
Representative histology and magnetic resonance imaging (MRI) data from an animal in group A. (
Correlation Between Magnetic Resonance Imaging and Histology in Different Brain Areas
The correlations between the values for the MRI parameters in early time points and the cell counts in each ROI at 24 h are shown in Tables 1–3.
Correlation values of seven individual MRI parameters with the cell outcome
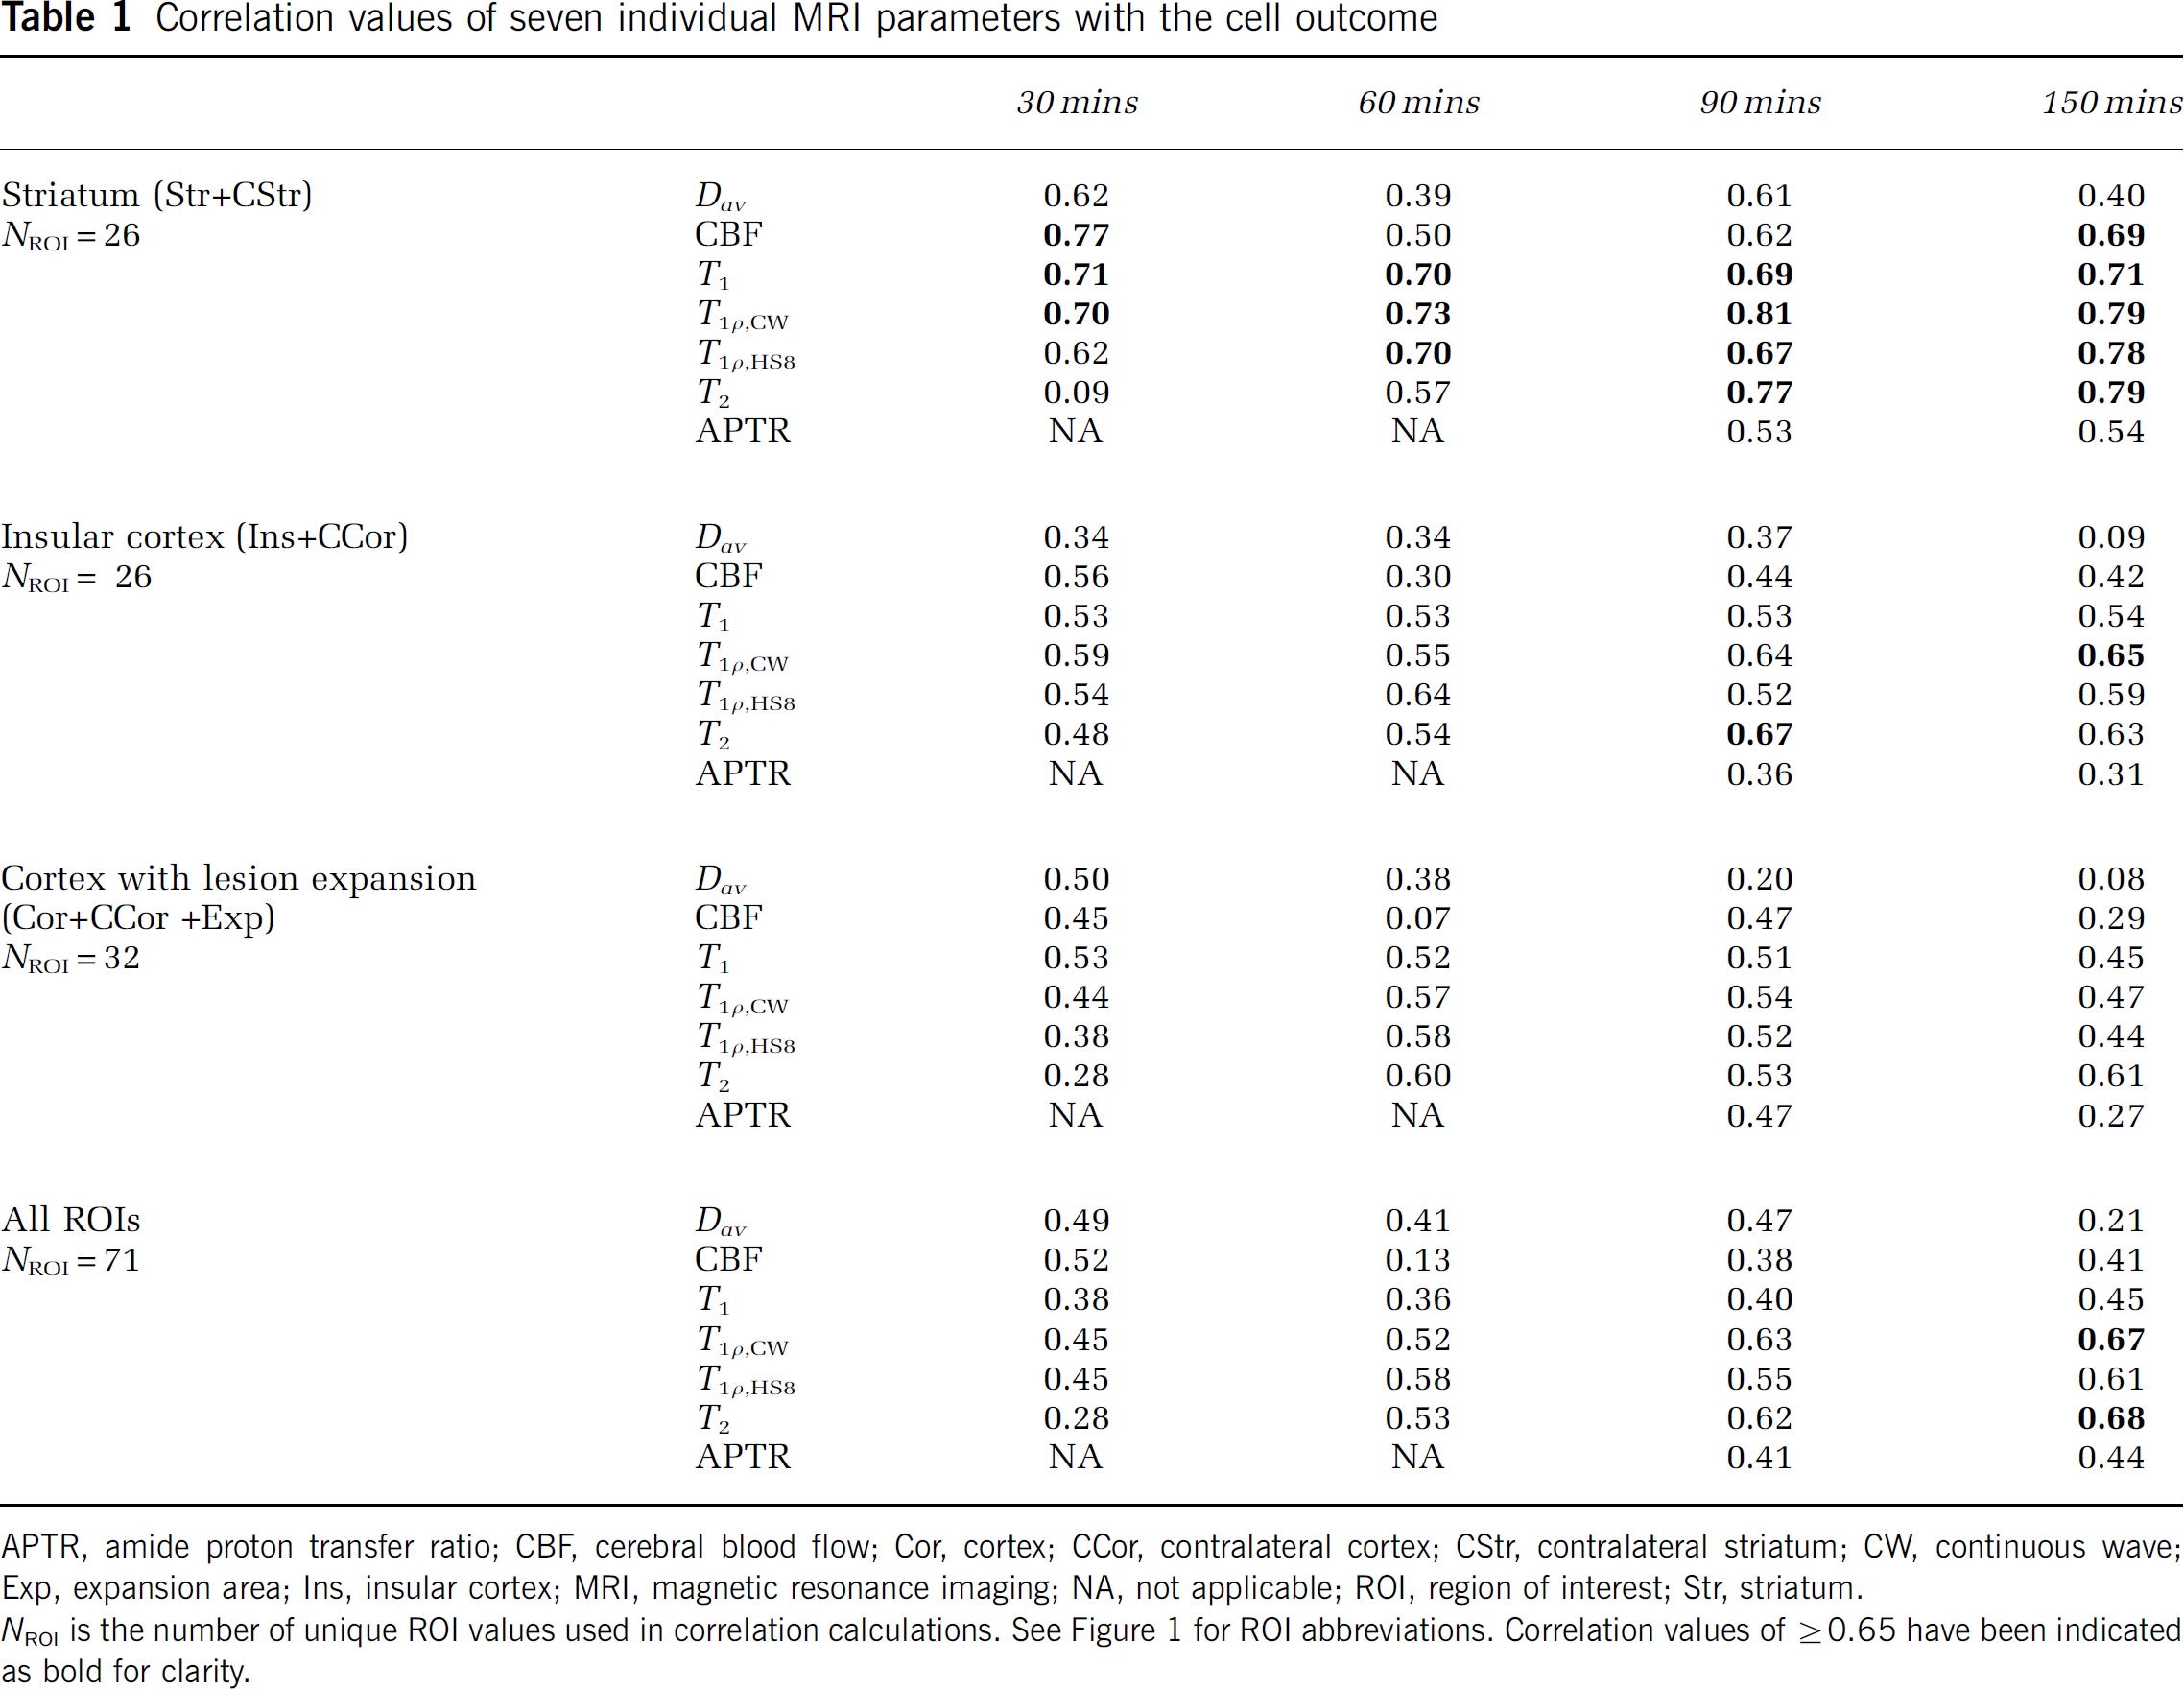
APTR, amide proton transfer ratio; CBF, cerebral blood flow; Cor, cortex; CCor, contralateral cortex; CStr, contralateral striatum; CW, continuous wave; Exp, expansion area; Ins, insular cortex; MRI, magnetic resonance imaging; NA, not applicable; ROI, region of interest; Str, striatum.
NROI is the number of unique ROI values used in correlation calculations. See Figure 1 for ROI abbreviations. Correlation values of ⩾ 0.65 have been indicated as bold for clarity.
Correlation values of combinations of two MRI parameters with the cell outcome
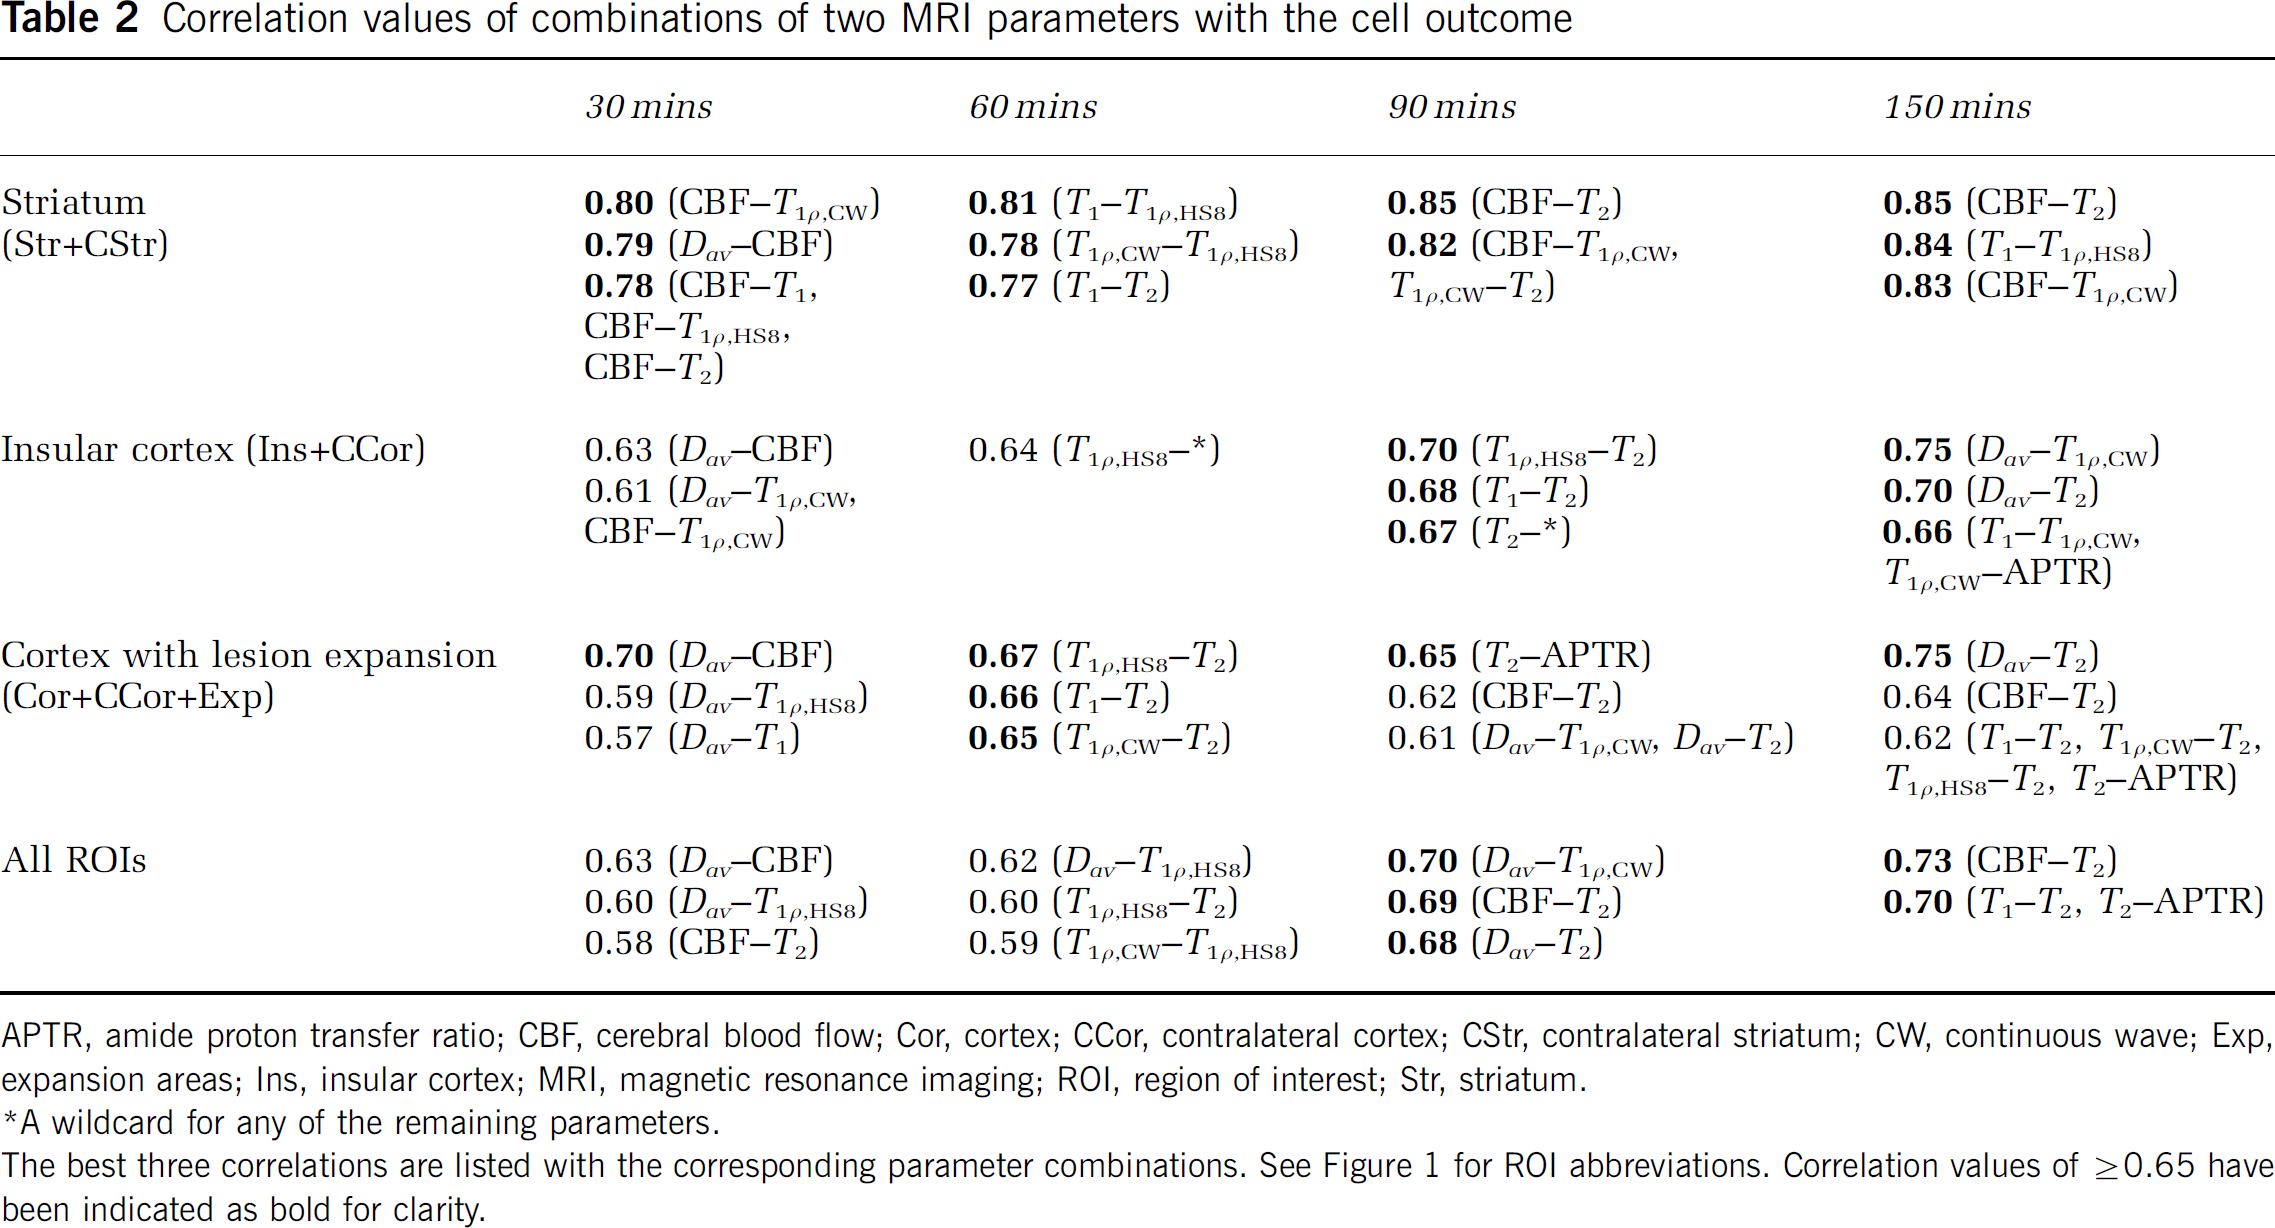
APTR, amide proton transfer ratio; CBF, cerebral blood flow; Cor, cortex; CCor, contralateral cortex; CStr, contralateral striatum; CW, continuous wave; Exp, expansion areas; Ins, insular cortex; MRI, magnetic resonance imaging; ROI, region of interest; Str, striatum.
A wildcard for any of the remaining parameters.
The best three correlations are listed with the corresponding parameter combinations. See Figure 1 for ROI abbreviations. Correlation values of ⩾0.65 have been indicated as bold for clarity.
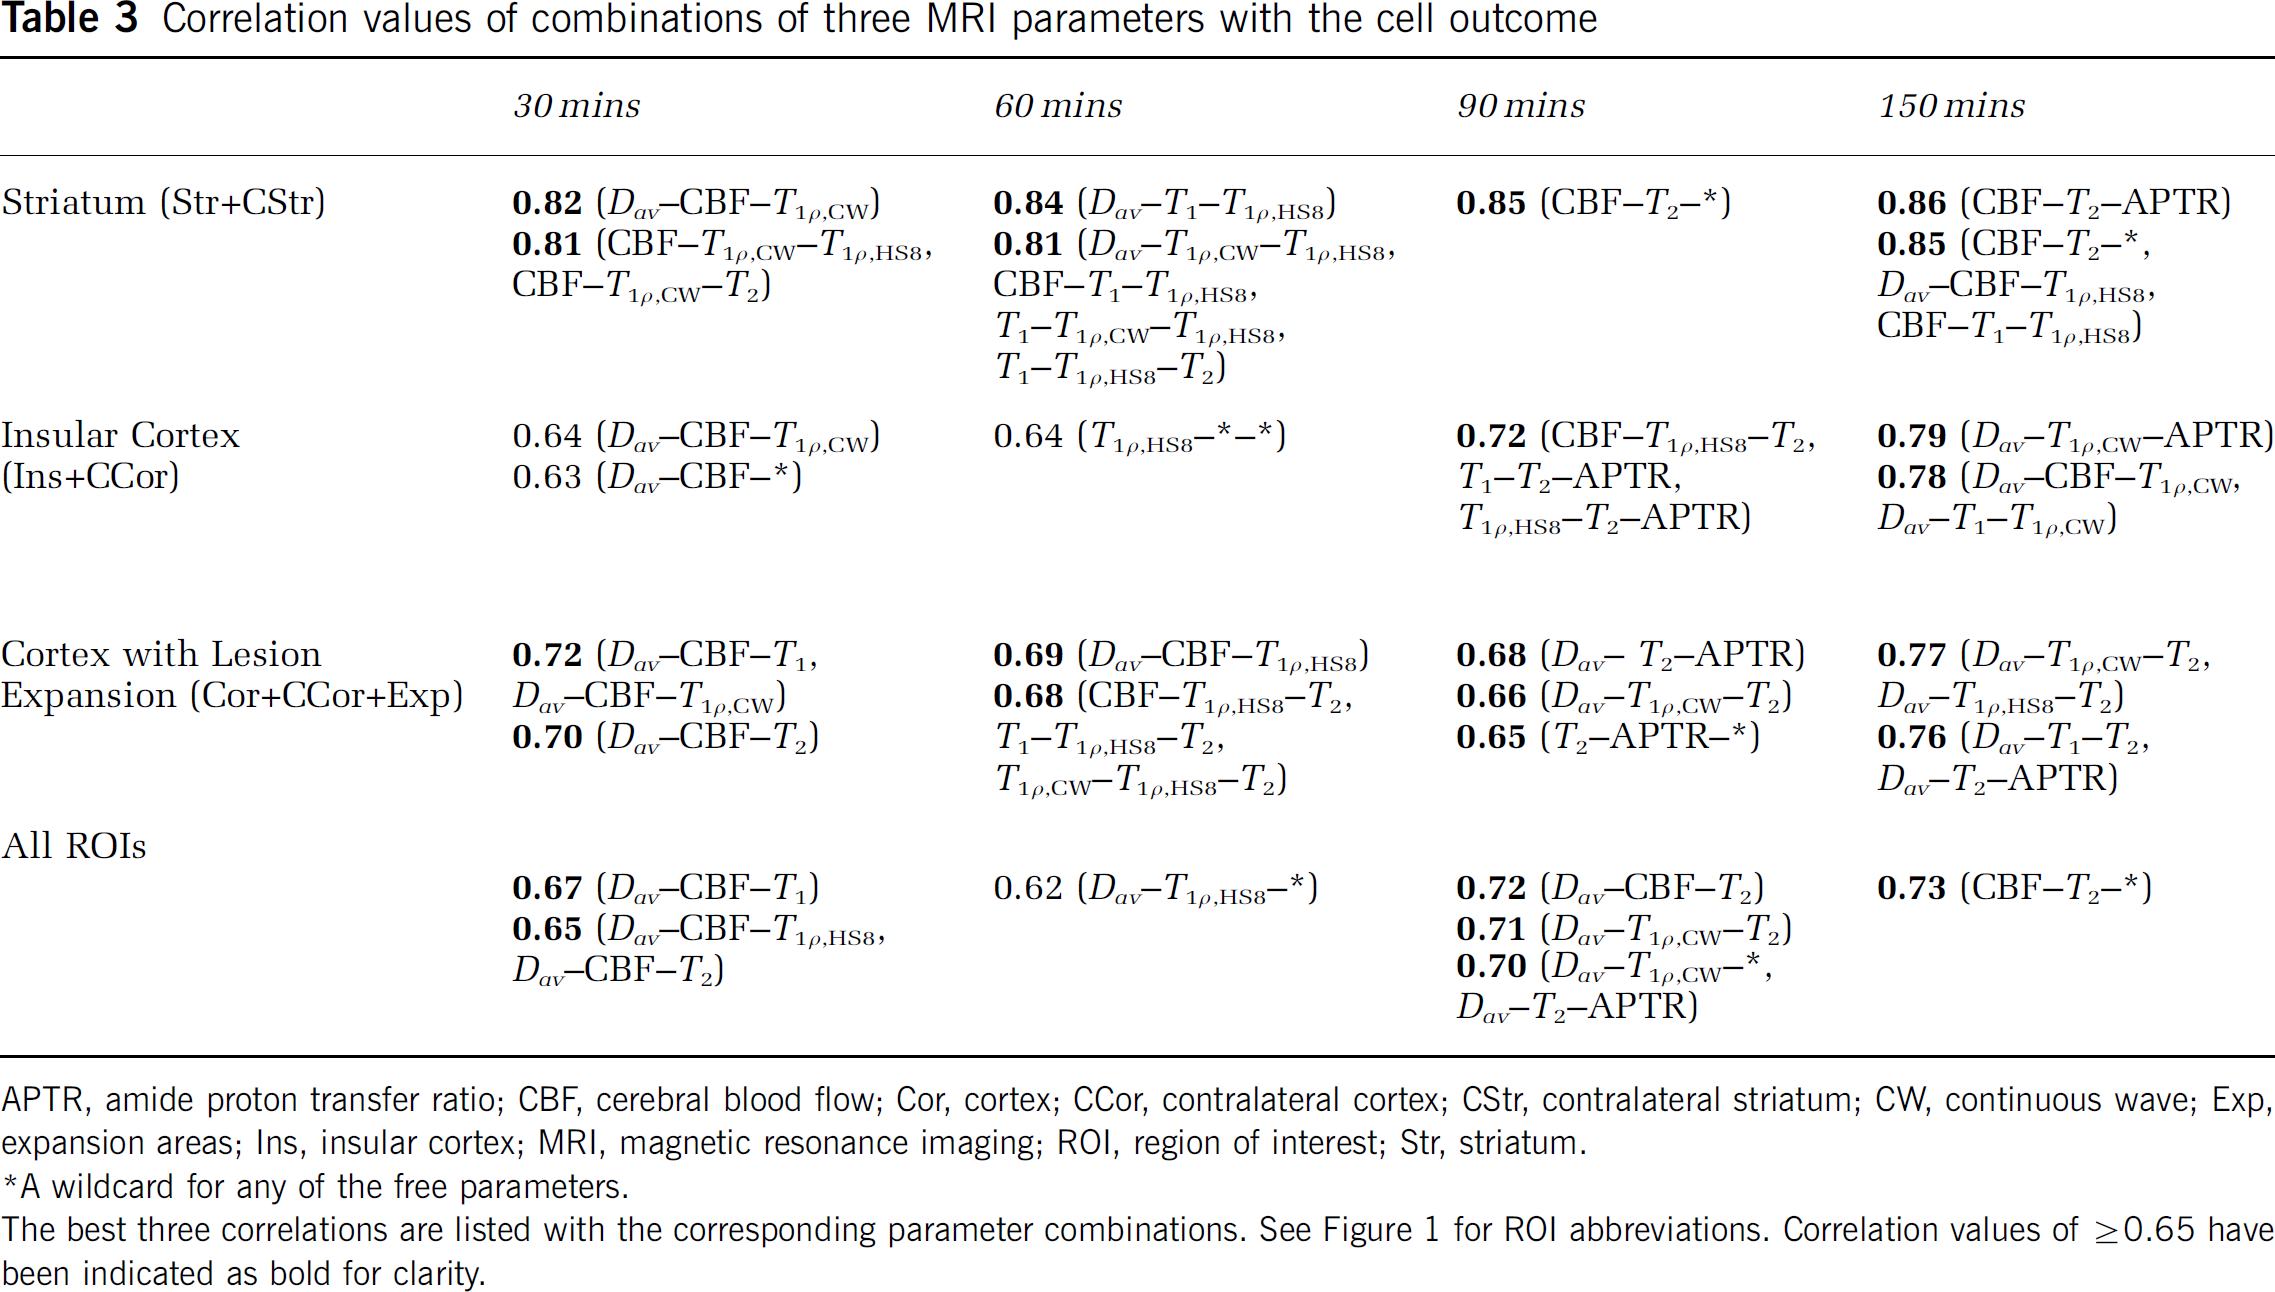
Correlation values of combinations of three MRI parameters with the cell outcome
APTR, amide proton transfer ratio; CBF, cerebral blood flow; Cor, cortex; CCor, contralateral cortex; CStr, contralateral striatum; CW, continuous wave; Exp, expansion areas; Ins, insular cortex; MRI, magnetic resonance imaging; ROI, region of interest; Str, striatum.
A wildcard for any of the free parameters.
The best three correlations are listed with the corresponding parameter combinations. See Figure 1 for ROI abbreviations. Correlation values of ⩾0.65 have been indicated as bold for clarity.
In this stroke model, the ipsilateral striatum represents the core of the lesion. From the individual MRI parameters, the decline in CBF at 30 mins of MCAo was best correlated with cellular outcome. Combining the CBF data either with the relaxation or with diffusion MRI data in two or three parameter correlation analyses improved the correlation only slightly. During early reperfusion (90 and 150mins time points), T1ρ,CW MRI provided the best correlation with histology. The correlation was slightly increased when both CBF and any of the relaxation parameters were used in multiparametric analyses.
The insular cortex showed the most core-like behavior of the cortical areas studied. However, unlike in the striatum, the correlation with cell count was low (r<0.4) even in multiparametric approaches during the MCAo. During early reperfusion, correlations of single MRI parameters remained low (r = < 0.63). A multiparametric approach was able to improve correlations much more in the striatum (up to 0.86 with three parameters). This shows that the MRI parameters under study provide complementary information toward long-term outcome from ischemia and that their value varies between different brain areas.
The expansion area represents features found in the penumbral tissue: a peri-core region that initially appears normal in MRI but nevertheless becomes lesional by 24 h. The predictive value of any individual MRI parameter remained relatively low (r= < 0.60) both during occlusion and in early reperfusion. It should be noted that diffusion alone during early reperfusion showed no correlation with tissue outcome; however, when combined with CBF and relaxation parameters, the correlations were improved to the level of r = 0.75 to 0.77. Similarly, either APTR or CBF combined with relaxation parameters improved the correlations.
To evaluate the overall prediction accuracy of the model, we calculated the s.d. between the measured outcome parameter (cell density) and the value predicted by the model. As expected, the s.d.s decreased from 24% to 26% (single parameter fitting, all ROIs) to 19% to 22% (three parameter fitting, all ROIs) by adding more parameters showing the improved accuracy of the model. Multiparametric MR images generated from diffusion, CBF, and T1ρ,CW data at 30 mins after MCAo and from CBF, T1ρ,CW, and T2 scans during reperfusion (Figure 6) showed good agreement with the lesion size.
Representative magnetic resonance imaging (MRI) and histology data from an animal in group B. Multiparametric MRI images were generated using (
Reversible Magnetic Resonance Imaging Changes in Noninfarcted Cortex
We analyzed cortical areas (in groups A and B) where MRI changes were evident during occlusion without a significant cell loss 24 h later. This area shows diffusion–perfusion mismatch with close to normal diffusion despite a decrease in CBF by 50% to 60%. In this tissue (Cor), CBF behaved very differently in the early reperfusion phase to that seen in the cortex becoming damaged (Exp): in the former areas, CBF normalized gradually and slowly, whereas in the latter regions CBF recovered transiently shortly after reperfusion followed by a secondary failure. The values of the relaxation parameters in nondamaged brain were in between the levels found in normal and damaged tissues Interestingly, the relaxation parameters were increased (P<0.01) at 24 h (slightly increased (P<0.02) at 30 mins) relative to the contralateral brain.
Discussion
Diagnosis of ischemic stroke is only one of the goals of patient evaluation by imaging in clinical settings. Equally important to patient management is the ability to provide prediction of tissue status and outcome at any given time point of the disease process. The current data are promising toward multiparametric MRI as a working platform for tissue status assessment for both the core and MRI penumbra after transient ischemia. Overall, we observed the highest correlations between MRI and histology for core-like brain areas (the striatum and the insular cortex), the lowest for the expansion area in the cortex, and the intermediate level correlations were seen for combined ROIs. The results emphasize the differences in the temporal profile of individual MRI contrasts during MCAo and especially during early reperfusion, and suggest that complementary information from CBF, depolarization, and tissue damage can be obtained with appropriate MRI contrasts. These data show that the multiparametric MRI procedure exploiting conventional and rotating frame relaxation times, diffusion, CBF, and APTR data improves correlation with tissue damage if compared either with single-parameter correlation or with diffusion/perfusion data alone. This was evident during early moments of reperfusion and in brain structures where lesion expansion takes place in the subacute phase.
The most commonly used duration of MCAo in the intraluminal thread model is 90 mins, which typically leads to irreversible damage in the striatum and ipsilateral cortex. In this study, a relatively short duration of 60 mins was used to create conditions where a variation in lesion size in the cortex was likely. The procedure allowed the evaluation of time courses and predictive value of MRI contrasts in brain areas that may either recover or progressively degenerate after initial insult. Our data show the following two types of temporal profiles of MRI parameters in these areas: first, CBF and diffusion decrease during MCAo followed by an almost complete recovery because of reperfusion; second, T1ρ and T2 relaxation times show progressive increase after induction of MCAo and respond weakly only to reperfusion. It should be noted that in spite of their sensitivity to hyperacute ischemia, CBF, and diffusion, the latter depending heavily on the oxygen supply and energy state of tissue provide very little predictive information about tissue damage at early moments of reperfusion. T1ρ and T2 relaxations show progressive increase after MCAo, which is likely to be due to destructive processes in tissue, subsequently dominated by the increase in water content (vasogenic edema) in tissue. These MRI parameters have the potential to serve as ‘timers’ from the onset of occlusion and clearly supplement data provided by diffusion and perfusion imaging. The absolute changes both in T1ρ and T2 in the acute phase, however, are small. Owing to this fact, a high spin-lock field for T1ρ MRI is required, and quantitative images instead of weighted images should be acquired for these parameters, if they were exploited for evaluation of tissue prognosis in acute stroke.
In accordance with previous reports (Calamante et al, 1999; Kettunen et al, 2000), T1 relaxation acutely prolongs on cerebral ischemia. The temporal profile seems to contain features of the two aforementioned groups: acute reversible changes and progressive gradual changes. The acute T1 changes have been associated with increased water content (Barbier et al, 2005), in-flow effects (Calamante et al, 1999; Detre et al, 1992), and protein–water interaction (Ewing et al, 1999). Dissociation of CBF and T1 data in this study rules out in-flow effects as a predominant mechanism behind acute T1 changes induced by ischemia. Increased water content is generally detected only hours after stroke onset, leaving changes in protein–water interaction as the most probable mechanism. As T1 in the currently used magnetic field strength probes molecules with rotational correlation time in the order of 10−9 secs, this interaction is clearly different in nature from that dominating T2 or T1ρ relaxation, and has been suggested to be associated with water in the loosely bound hydration layer around proteins (Ceckler and Balaban 1994; Koenig et al, 1993).
The relatively short occlusion time prevented us from acquiring the APTR data during MCAo, and thus only postocclusion data exist. In a permanent MCAo of rats, Sun et al (2007) showed that the area delineated by lowered APTR was intermediate in size relative to the areas highlighted by diffusion and perfusion MRI. This observation suggests that the APTR contrast may aid in defining penumbral tissue in acute stroke. In our study, APTR was found to be decreased in tissue destined to infarction despite the recovery of both CBF and diffusion MRI signal. The key physicochemical factor influencing APTR during ischemia is believed to be tissue acidification resulting in a decrease in the amide proton exchange rate. Interestingly, our data show the slow recovery of APTR after MCAo, a finding that is in conflict with the known fast recovery of intracellular pH after ischemia despite persistently elevated lactate (Allen et al, 1988). It should be noted, however, that APTR is sensitive to a number of pH-independent mechanisms, including proteolysis, which can change the amount of amide groups, changes in the amount of direct saturation and asymmetry of the underlying macromolecular baseline, and water content that may influence this MR contrast in ischemic brain (Ewing et al, 1999; Zhou et al, 2003b). In principle, T1 changes caused by ischemia contribute to APTR. We calculated that T1 prolongation-determined after ischemia, however, explains only ∼0.2% of the units of the total APTR change observed in the acute ischemia. A further important point to note with APTR MRI is the low inherent dynamic range this contrast provides for the assessment of pathology.
Our results point to differential values of the MRI parameters under study for the prediction of ischemic damage between brain regions. For instance, in the ischemic core-like area, that is, the striatum in this animal model, a high correlation for T1ρ,CW was obtained during MCAo, whereas in the lesion expansion area in the cortex the correlations were only modest. The results show that correlations for individual MRI parameters with histologic damage vary between brain areas and that a multiparametric approach can, to a certain extent, alleviate this variation. The observed variation may reflect inherently differing pathophysiological and biophysical factors contributing to the MRI contrasts used. For instance, diffusion signal is sensitive to water distribution across the plasma membrane, intracellular streaming, and temperature, whereas T1ρ probes closely the changes in slow molecular motion, such as changes in macromolecule tumbling, fraction of macromolecule-bound water, and chemical exchange processes. Our findings are consistent with the previous report by Shen et al (2005), using a permanent MCAo model of the rat, measuring ADC and CBF at five time points during the first 3 h of ischemia and correlating these results with the lesion volume 24 h later. They reported that incorporating information about anatomic structure into the predictive model on the basis of MRI data improved the prediction accuracy greatly.
For compliance, any clinical MRI protocol for acute stroke patients should be as short as possible. Owing to the time constraints, it is pivotal to choose the optimal combination of the MRI parameters to be collected for establishing the diagnosis and prognosis of the condition. In multiparameter correlation analysis, using both the diffusion and CBF collected during MCAo produced the highest individual correlations with cell damage, whereas combinations of two or three MRI parameters including either T1ρ or T2 showed best correlations during early reperfusion. The correlations obtained for either CW or adiabatic type T1ρ or even for T2 were fairly similar in the later time points. Incorporation of T1 into the analyses did not significantly increase correlations, indicating that the mechanisms behind both the acute rapid increase and progressive slow increase components are very similar to those prescribing changes for the CBF, diffusion, and transverse relaxations. Amide proton transfer ratio provides a small improvement for the correlation analysis, but its predictive potential remains to be established in future studies.
As far as the translation of the multimodal MRI approach used in this study into the clinical settings is considered, several technical limitations have to be tackled. All predictions are dependent on the quality of the methodology. In terms of MR methods, APTR bears similarities with arterial spin labeling in essence as both require the subtraction of two sets of images collected with schemes incorporating off-resonance saturations. In both techniques, the influence of magnetization transfer from the broad macromolecule baseline is assumed to be removed in subtraction, and the small effect arising either from labeled water spins arriving with blood to the brain and exchanging at capillaries with tissue water or from the chemical exchange of polypeptide/protein amide and bulk water protons is used to generate (semi)quantitative images for the given state. Both of these approaches provide inherently low contrast-to-noise ratio and complications for multislice approaches. Owing to the reasons described above, arterial spin labeling perfusion is still mainly used for research purposes in clinical settings. Instead, perfusion is often measured with dynamic susceptibility contrast MRI with a bolus injection of intravenous contrast agent during T2(*)-weighted EPI data acquisition (Rosen et al, 1990). T2-weighted MRI is part of the routine clinical imaging protocol. However, if absolute T2 images are acquired in a short time, then multi-echo sequences or CPMG EPI have to be used. Despite being apparently trivial, the quantification of T2 is not unproblematic because of several reasons: multi-echo multislice approaches are susceptible to stimulated echoes from repeated radiofrequency pulses, magnetization transfer effect as well as variable contributions from dynamic dephasing because of diffusion and/or exchange. These complications do not necessarily decrease the sensitivity of absolute T2 images to ischemia. However, comparisons of the absolute values between different medical centers using different pulse sequences can be compromised. Both the T1ρ approaches used here have inherent problems because of the high SAR caused by the long spin-lock radiofrequency pulse or pulse trains. Nevertheless, T1ρ MRI has been performed in human subjects (Gröhn et al, 2005; Michaeli et al, 2006; Wheaton et al, 2004b) even in the multislice mode (Wheaton et al, 2004a), which may provide whole-brain coverage. To supersede T2 in the detection of irreversible ischemia, T1ρ MRI must be measured with B1 in the range of 0.6 to 1.7 G, which does not cause tissue heating with the data acquisitions used here, even in flow-compromised tissue (Gröhn et al, 2000), but yet needs to be proven in humans within the SAR guidelines.
We used linear multiparametric correlation analysis to search combinations of the MRI parameters providing the highest predictive values for cell damage occurring within 24 h after reversible MCAo. In this analysis, the parameters were brought one by one to the model using the cell damage as an output, and the goodness of the model was calculated for each added variable to rank the variables. In other words, several parallel models were created, from which the best was always selected to be developed in the next selection round. In this selection method, nonlinear models, similar to neural networks, can also be used for modeling (Lisboa, 2002). However, large data sets are then required for validation of the models. The beauty of MRI data is that one can create models that work at the pixel-by-pixel level. This has been accomplished for the ADC and CBF images helping to define lesion volumes (Shen et al, 2003) and using, for example, ISODATA analysis in both experimental (Jacobs et al, 2000) and clinical (Lu et al, 2005; Mitsias et al, 2002) settings referring to either the MR images collected at chronic time points or the histologically evaluated lesions. In this study, the most fundamental outcome parameter after ischemic stroke, that is, quantitative histologic analysis of the neuronal density, was used. As histologic analysis was not feasible at the level of individual pixels, we used data from ROI-based analysis to obtain the best combination of parameters and weighting factors that were used to create multiparametric images. This procedure was able to create multiparametric images with good correlation with the outcome proving the potential of a multiparametric approach.
The selection of the outcome parameter and the end point for stroke studies is not unproblematic. We used cell density obtained from histology that has traditionally been the most fundamental parameter for the outcome (Knight et al, 1994). Cell density is quantified in each brain region enabling detailed correlation analyses with MRI. An alternative end point could have been functional outcome that could have been assessed by behavioral tests. From a clinical viewpoint, functional outcome is probably the most significant outcome parameter. However, data from behavioral tests are semiquantitative and cannot provide data directly in a region-specific manner. Although the majority of acute cell deaths have taken place in the stroke model used by 24 h (Knight et al, 1994), delayed cell death mechanisms continue far beyond this time point.
In conclusion, we have shown that multiparametric MRI has the potential to predict tissue outcome with improved correlation compared with single-parameter predictions. The best combinations of MRI parameters show time-dependent variations, a fact that should be taken into consideration for the exploitation of multiparametric MRI for acute stroke imaging. The MRI parameters, such as T1ρ, which typically show a time-dependent increase in the lesion core (Gröhn et al, 1999; Jokivarsi et al, 2009), may serve as markers of irreversible damage and help to evaluate the time from the onset of occlusion area and help to design optimal protocols in the clinical environment where scanning time is limited. In our experimental setting, characteristic MRI changes for reversible tissue seem to be diffusion–perfusion mismatched with small relaxation changes and gradual recovery of CBF after deocclusion. By carefully choosing the most applicable contrasts, the key elements of ischemic lesion evolution can be modeled and then predicted. This provides a good tool for studying new treatment modalities and may also pave the way for more accurate prognosis in clinical settings.
Footnotes
Acknowledgements
The authors sincerely thank Ms Maarit Pulkkinen and Ms Tiina Konu for expert technical assistance and Mr Nick Hayward, MSc, for proofreading and editing the paper.
The authors declare no conflict of interest.