53. Assessing the existence of ischemic penumbra through automatically analyzing baseline diffusion-weighted imaging
Q. Hu1,2,3, P. Gao4, L. Ma4, Z. Chen1,2, J. Wu1,2 and X. Ma1,2
1Shenzhen Institute of Advanced Integration Technology, Chinese Academy of Sciences/The Chinese University of Hong Kong; 2Shenzhen Institute of Advanced Technology; 3Key Laboratory for Biomedical Informatics and Health Engineering, Chinese Academy of Sciences, Shenzhen; 4Beijing Tiantan Hospital, Beijing, China
Objectives: Even though the PWI-DWI (perfusion- and diffusion-weighted imaging) mismatch model has been challenged, it remains the major clinical tool and has been proven useful.1 Serious problems with PWI-DWI mismatch include the delineation of lesions manually (error prone and time consuming), invasiveness and interpretation uncertainty of PWI. A method to determine the existence of salvageable tissues fast and reliably is thus highly desirable and of vital clinical significance, which is our objective.
Methods: An image analysis system is developed to automatically determine the existence of salvageable ischemic tissues. It takes the baseline DWI as input and consists of the following steps:
reference ADCref of normal brain tissues is taken as the most frequent value of apparent diffusion coefficient (ADC);
regions with ADC smaller than 0.65*ADCref are approximated as the infarct regions (IRs) while those with ADC in between [0.65*ADCref, 0.85*ADCref] as the transition regions (TRs);
only those TRs neighboring IRs (area>10 mm2) are kept;
the region with the largest area of IR, and the region with the maximum area of the sum of IR and TR, are found;
for each region, the areas of the IR and TR are denoted as AIR and ATR, respectively; the radial distance (RD) of the TR is approximated as RD = sqrt ((AIR+ATR)/3.14)−sqrt(AIR/3.14) (sqrt for square root); ADC gradient of a point is the ADC difference between the maximum within the 8-neighbors and this point's ADC divided by their distance; the expected ADC change in the TR (δADC) is the product of the average of the ADC gradient of all points within the TR and the radial distance RD divided by ADCref;
if both δADCs are not smaller than 0.18 and at least one is larger than 0.21 with the volume of IR not greater than 100 ml, then this patient has salvageable ischemic tissues.
Results: Thirty-nine patients retrospectively retrieved from Tiantan Hospital (Siemens 3.0 T) in the last 5 years within 6 h of symptom onset without cerebral hemorrhage were tested. The lesions were measured by neurologists to determine the existence of PWI-DWI mismatch (33 with and 6 without mismatch). Taking the PWI-DWI mismatch as gold standard, the image analysis system can yield a sensitivity of 97.0% (32/33) and a specificity of 100% within 1 min on Pentium 4 PC. Figure 1 shows an axial slice of ADC and the detected IR (red) and TR (green).
Conclusions: The novelty and main contribution is to judge mismatch based on defining and quantifying spatial distribution instead of the exact volume of ADC within TR. The developed system is now used to test prospective data on both Siemens and GE scanners with encouraging results. It may be used to guide thrombolysis clinically.
55. Pre-symptomatic detection of experimental autoimmune encephalomyelitis using in vivo magnetic resonance imaging of VCAM-1
S. Mardiguian1, S. Serres2,3, A. Akhtar4, M. McAteer4, R. Choudhury4, D. Anthony1 and N. Sibson2,3
1Department of Pharmacology; 2Department of Physiology, Anatomy and Genetics, University of Oxford; 3Department of Radiation Oncology and Biology, Radiobiology Research Institute; 4Department of Cardiovascular Medicine, University of Oxford, Oxford, UK
Currently, Multiple Sclerosis (MS) is diagnosed clinically when contrast-enhancing lesions are visible using MRI, yet this identifies late-stage lesions in which BBB breakdown has occurred. The initial recruitment of leukocytes in MS takes place across an intact, but activated, brain endothelium expressing vascular cell adhesion molecules such as VCAM-1, preceding BBB breakdown. Identification and quantification of VCAM-1, therefore, represents an attractive imaging target to accelerate diagnosis and to guide specific therapy in neurological disease. We have previously demonstrated that an anti-VCAM-1 antibody conjugated to 1 μm microparticles of iron oxide (MPIO) enables detection of VCAM-1 expression in vivo using MRI, with high specificity and exceptional conspicuity following the unilateral injection of Interleukin-1β into the brain. In this study, using a relapsing- remitting EAE mouse model of MS, we show the expression of VCAM-1 in pre-symptomatic EAE mice, at a time when pathology is otherwise undetectable. In particular, we show the accumulation of anti-VCAM-1-MPIO in EAE lesions of the brain stem and cerebellum in the absence of gadolinium enhancement, indicating that endothelial VCAM-1 expression can be identified in lesions prior to BBB breakdown. We report that the expression of VCAM-1 significantly increases with the progression of disease as well as with increasing disability. Our findings demonstrate that our novel contrast agent reveals pathology previously inaccessible to conventional, clinically-used MRI techniques, raising the possibility of early diagnosis of MS and targeting treatment to patients with elevated VCAM-1 expression.
Anti-VCAM-1-MPIO reveals early presence of EAE.
58. Structural MRI-measured T1 map reflects functional topography in primary somatosensory cortex of a non-human primate
J. Liu, N. Bock, A. Kocharyan, Y. Hirano and A. Silva
CMU LFMI, NINDS, National Institutes of Health, Bethesda, Maryland, USA
Objectives: Functional organization in cerebral cortex, for example the somatotopy in primary somatosensory cortex, is well revealed by non-invasive measurements of blood oxygenation (BOLD) using functional MRI.1 However, a corresponding anatomical organization is rarely shown in structural MRI, where cortical gray matter usually appears homogeneous. We hypothesize that high-resolution T1 maps acquired by structural MRI can show heterogeneity within gray matter, because T1 contrast in brain often arises from myelin concentration differences, and a heterogeneous myelin distribution within gray matter (myeloarchitecture) is shown by postmortem histology.2 We further test the hypothesis that the T1 heterogeneity within cortical gray matter matches the functional organization mapped by BOLD, thus providing an anatomical substrate that corroborates the functional mapping.
Methods: Three common marmosets were anesthetized by propofol and positioned into a 7 Tesla MRI scanner. For T1 mapping, inversion-recovery (IR) was added to a conventional multi-slice echo-planar imaging (EPI) sequence (field-of-view: 31.8 × 21.0 mm, in-plane resolution: 0.3 × 0.3 mm, thickness: 0.5 mm, TE/TR: 21/11000 ms). Data under 18 IR time values (sampled from 60 to 9859 ms with geometric factor 1.35) were fitted to a three-parameter, single-exponential T1-recovery function.3 A T1 map of 20 slices was acquired in 10 mins. For functional mapping, BOLD response was measured using the same EPI sequence, but with shorter TR (667 ms) and no IR. Stimuli were electrical stimulation of peripheral nerves in either arm or foot, delivered in periodic repeats of epochs (2.5 mA 0.4 ms pulses at 40 Hz, each epoch 8/32 secs on/off). The T1 and BOLD measurements were in good coregistration as they had identical EPI-related geometric distortions.
Results: Within the gray matter of dorsolateral cortex, the primary somatosensory cortex (SI) had significantly low T1 (∼1700 ms) whereas the cingulate cortex (medial to SI) and the secondary somatosensory cortex (lateral to SI) had high T1 (∼1850 ms). Furthermore, a fine structure was identified within SI. A band running lateral to medial had the smallest T1 (∼1650 ms), and this band was interrupted at least two gaps with higher T1 (∼1700 ms). Functional MRI showed two clusters of stimulus-evoked BOLD responses within SI. The relatively medial cluster was driven by stimulation to the foot, and the relatively lateral driven by stimulation to the arm. Both clusters centered at the smallest-T1 band, and were separated by a gap with higher T1.
Conclusions: The non-invasively acquired T1 map is in line with known cortical myeloarchitecture. SI, especially area 3b, has high concentration of myelin, and the major body subareas (foot, hand, etc.) in area 3b are separated by several gaps with low myelin concentration.2 Correspondingly, we found that a high-T1 (low-myelin) gap separates the two low-T1 (high-myelin) regions that are responsive to foot and arm, respectively, in BOLD imaging. Thus the somatotopy (foot versus arm) may be reflected by structures in T1 map within SI.
133. Spatiotemporal investigation of the bold and CBV response to brief somatosensory stimulation in awake marmosets
Y. Hirano1, J. Liu1, B. Stefanovic2 and A. Silva1
1CMU/LFMI, NINDS/NIH, Bethesda, Maryland, USA; 2Sunnybrook Health Sciences Centre, Toronto, ON, Canada
Objectives: Understanding the spatiotemporal features of the hemodynamic response (HDR) to functional brain stimulation is essential to the proper application of fMRI to study brain function. Previously, we showed that the BOLD-, CBF-, and CBV-HDR to a single electrical pulse can be robustly detected in α-chloralose anesthetized rats (Hirano et al, ISMRM 2008), and that both spatial and temporal characteristics of such responses are fine enough to resolve the heterogeneity of fMRI amplitudes, onset times, and time-to-peak across the cortical layers. Here, we extend the work to investigate the spatial and temporal evolution of the BOLD- and CBV-HDR in awake nonhuman primates.
Methods: Adult male common marmosets were implanted head posts in the skull and secured to a head holder. fMRI experiments were performed at 7T by GRE-EPI with following parameters: TE/TR = 13/250 ms, acquisition bandwidth 200 kHz, nominal resolution = 400 × 400 × 2000 μm3. To measure the HDR to somatosensory stimulation, a pair of contact electrodes was secured across each wrist and bilateral electrical stimulation (333 μs pulses, 2 mA amplitude, 64 Hz) was performed synchronized with the scanner. The stimuli consisted of individual epochs containing 1 or 256 electrical pulses (333 μs or 4-secs stimulus lengths), respectively, repeated 128 times or 16 times. Before commencing the CBV-HDR, a maximum dose of 30 mg/kg of 30 nm iron oxide particles (MION) were injected intravenously to the animal.
Results: Robust BOLD- and CBV-HDRs were obtained in the primary and secondary somatosensory cortex (S1 and S2) before and after 20 and 30 mg/kg MION injection at 4-sees stimulus (Figure). The amplitude increased (31% and 44% increased at 30 mg/kg than 20 mg/kg in S1 and S2 respectively) with MION dosage. At 10 mg/kg MION and less, CBV-HDRs showed nonspecific responses and poor separability between S1 and S2 (data not shown). We concluded that 30 mg/kg of MION is a more appropriate dose to investigate spatiotemporal characteristics of the fMRI response. Using 30 mg/kg MION, we then proceeded to compare the CBV impulse response function (IRF) with previously acquired BOLD IRFs (data not shown). Both the BOLD and the CBV-IRF from S2 had stronger amplitude than the one from S1, in agreement with the notion that high order cortical processing is dominant in primates. We are currently analyzing the temporal features of the BOLD and CBV IRF in the marmosets.
BOLD and CBV activation maps at 4-sess stimulation (64 Hz).
Conclusion: Robust CBV-HDR in S1 and S2 was observed after 30 mg/kg MION injection in awake marmoset. The refinement of this study will allow for a better understanding of the mechanisms of neurovascular coupling in unanesthetized primates and facilitate the applicability of animal fMRI studies to the investigation of human brain function.
204. Combining electrophysiology with fMRI to investigate neuropharmacological modulation of brain function in the rat
C. Martin1 and N. Sibson2
1Department of Physiology, Anatomy and Genetics; 2Gray Institute for Radiation Oncology and Biology, University of Oxford, Oxford, UK
Background and aims: Functional brain imaging methods which exploit the neurovascular coupling of neuronal activity to changes in haemodynamics are increasingly applied to study the functional effects of neuropharmacological agents in both human and animal subjects. A problem is that neuroimaging signals such as the blood oxygen level dependent (BOLD) functional magnetic resonance imaging (fMRI) signal may be subject to multiple neuronal, neurovascular, haemodynamic and systemic effects of the drug under investigation. To address this, our understanding of the neurophysiological basis of functional imaging signals must be expanded to include the effects of altered neurotransmitter function (e.g. by experiment, clinical trial or disease) and differences across neuropharmacologically diverse cortical and subcortical structures. An effective approach for establishing relationships between fMRI responses and underlying neuronal activity is one in which both of these signals are measured concurrently. Achieving this within the MR environment is difficult due to distortion of electrophysiological signals by rapidly changing magnetic gradient fields. Here, we report the development of methodology for concurrent acquisition of fMRI and electrophysiological measures of neuronal activity in the rat. We use this method to investigate the effects of the serotonin releasing agent, fenfluramine, on both baselines and stimulus evoked responses.
Methods: Animals were anaesthetized with isoflurane, tracheotomised for artificial ventilation and cannulated for administration of drugs and monitoring of physiological parameters. Electrodes were constructed from carbon fibre bundles (diameter ∼50 microns) and inserted into the hindpaw sensorimotor cortex. Stimulating electrodes were inserted into the contralateral hindpaw. Imaging was performed on a 7-Tesla horizontal bore magnet. Anatomical scans to cover the whole brain were acquired using a T2-weighted fast spin-echo sequence (field of view 30 × 30 mm, matrix size 128 × 128, slice thickness 0.5 mm). Functional data were acquired using T2*-weighted multi-echo gradient-echo sequences (effective TE 12 ms, field of view 30 × 30 mm, matrix size 128 × 64, slice thickness 0.5 mm). Fenfluramine (10 mg/Kg) was injected intravenously after a period of baseline data acquisition. Analysis procedures to remove the MR artefacts from the data included an adaptive template-based artefact removal procedure and band-pass filtering.
Results and conclusions: We demonstrate that electrophysiological measures of both baseline and stimulation-evoked neuronal activity can be obtained concurrently with fMRI data acquisition. Fenfluramine administration produced simultaneous decreases in the BOLD fMRI signal (Figure A) and in EEG power fluctuations (Figure B). Neuronal responses to hindpaw stimulation could be easily extracted from the data following processing to remove MR gradient artefacts (Figure C: red—before processing, blue—after processing). Neuronal responses were also transiently attenuated by fenfluramine administration (Figure D). These procedures will be used to investigate the effects of neuropharmaoclogical manipulation of neurotransmitter function on the relationship between neuronal activity and fMRI reponses. Methods for conducting experiments in awake animals are also being developed.
325. Functional magnetic resonance imaging in un-anaesthetized rats using a chronically implanted surface coil
C. Martin1, A. Kennerley2, J. Berwick2, N. Sibson3 and J. Mayhew2
1Department of Physiology, Anatomy and Genetics, University of Oxford, Oxford; 2Department of Psychology, The University of Sheffield, Sheffield; 3Gray Institute for Radiation Oncology and Biology, University of Oxford, Oxford, UK
Background and aims: Functional magnetic resonance imaging in animal models usually requires the use of anaesthetic agents. However, such agents interfere with normal neuronal, metabolic and haemodynamic function in addition to precluding the use of operant and behavioural experimental protocols. In light of this we have developed techniques to enable functional imaging studies to be repeatedly conducted in trained, restrained, un-anaesthetized rats. Chronic implantation of the surface coil and accurate repeated positioning of the subject in the scanner bore enabled acquisition of imaging data to commence within minutes of securing the animal. Using this methodology we have successfully recorded both local (whisker stimulation) and global (using hypercapnia) functional imaging responses in fully conscious animals over a period of several weeks.
Methods: Animals were gradually acclimatised to the noise of the scanner and increasing periods of restraint in a body harness for periods of up to 1 h over a 3 week period prior to surgical preparation. Animals were then anaesthetized and a 15 mm diameter surface transmit/receive coil (in-house design) was secured to the skull using plastic screws and cyanoacrylate. A cylindrical chamber protruded from the top of the coil and provided a means to secure the head during imaging. To enable electrical stimulation Teflon-coated tungsten microwires were implanted subcutaneously in the whisker pad and electrical connectors were positioned on the top of the head. Animals were allowed to recover for 72 h prior to any imaging experiments. The apparatus is shown in Figure A. Functional data were acquired from suitable coronal and oblique slices using a single shot MBEST Gradient Echo—Echo Planar Imaging sequence (B0 = 7, data matrix = 64*64, FOV = 30 mm, slice thickness = 1 mm, TR/TE = 1000/12 ms, flip angle 90°). Stimuli consisted of 0.4 mA, 2 s, 40 Hz bursts (0.3 ms pulse width) and hypercapnia consisted of increasing the CO2 concentration in inspired air (by means of directed air flow) to 5% for 1 min. The BOLD signal was calculated as fractional change normalized by the mean of the one minute preliminary baseline signal.
Results and conclusions: We were able to successfully record BOLD fMRI responses to hypercapnia and whisker stimulation in awake rats. Hypercapnia produced large and rapid rises in BOLD signal amplitude (Figure B). Electrical stimulation of the whisker pad produced a reliable ∼7% increase in BOLD signal in the corresponding barrel cortex (Figure C). Interestingly, responses to both hypercapnia and stimulation displayed faster temporal dynamics than have been reported previously in studies using anaesthetized animals. This methodology leaves the face and limbs free from obstruction, making possible a range of behavioural or sensory stimulation protocols. Further development of this animal model could enable traditional behavioural neuroscience techniques to be combined with modern functional neuroimaging.
374. Mapping dopaminergic denervation in parkinson disease in vivo and in situ: the visualization of structural details by CBV-weighted fMRI
C.-C.V. Chen1, Y.-Y.I. Shih1, K.-C. Mo1, N.-W. Yao1, Z.-J. Lin1, C.-H. Huang1, B.-C. Shyu2 and C. Chang1
1The Functional and Micro-magnetic Resonance Imaging Center; 2Institute of Biomedical Sciences, Academia Sinica, Taipei, Taiwan R.O.C.
Background and aims: Striatal dopaminergic denervation is an important characteristic of Parkinson disease (PD). The damage is often evaluated by post-mortem immunohistochemistry (IHC), which in situ localizes the dopaminergic innervations in the brain tissues. Nevertheless, post-mortem techniques can not be applied to living organisms. To propose an approach that detects the structural details of dopaminergic denervation of PD in vivo and in situ, the cerebral blood volume (CBV)-weighted fMRI facilitated by the increased relaxivity with iron oxide nanoparticles (IRON) technique was employed. The CBV method is proposed for the following reasons. First, dopamine is a vasoactive neurotransmitter. Second, CBV responses can be a reflection of dopaminergic neurotransmission.1,2 Since the resolution of the CBV images achieves the level of a pixel size of tens of microns, the CBV-weighted fMRI may be applicable in mapping striatal dopaminergic denervation in vivo and in situ in PD.
Methods: The Parkinsonian rats were lesioned ipsilaterally by infusing 6-OHDA into the right substantia nigra. A paradigm that activates the endogenous dopaminergic neurotransmissionthe, the nociceptive stimulation, was employed to induce the vasoactivity in the striatum so as to be detected by CBV-weighted fMRI.2 Superparamagnetic iron oxide nanoparticles as a contrast agent were administered via the femoral vein at a dose of 30 mg Fe/kg. fMRI images were then captured using a 4.7-T Bruker Biospec spectrometer. Images were acquired using a FLASH sequence with a repetition time of 150 ms, echo time of 20 ms, field of view of 2.56 by 2.56 cm2, slice thickness of 1.5 mm, number of excitation of 1, acquisition matrix of 128 by 64 (zero-filled to 128 by 128), and temporal resolution of 9.6 secs. Images were analyzed using a custom-built ISPMER data processing system.
Results: It was found that the intact striatum retained an integral CBV response whereas the lesioned straitum exhibited no CBV reactions in the denervation sites yet remaining responses in the residual dopaminergic fibers. The results indicate that CBV weighted fMRI detects the dopaminergic fiber lesion in PD with the acuity to differentiate the denervation from the spared innervations.
Conclusions: The preclinical findings strongly support the applicability of the CBV weighted fMRI as an in vivo and in situ mapping tool to evaluate the striatal dopaminergic denervation in PD.
424. Preliminary clinical study in patients with hemispatial neglect after stroke by neglect test battery and 99MTC-ECD SPECT
Y. Yin, Y. Li and X. Li
Nuclear Medicine, No.1 Hospital of China Medical University, Shenyang, China
Objective: To explore the presence, clinical characters, anatomical foci in image, and mechanism of Hemispatial neglect (HSN), neglect test battery and SPECT rCBF imaging were performed on patients with stroke.
Methods: Thirty dextromanual patients who were diagnosed as having unilateral stroke clinically were recruited. A neglect test battery including line bisection test, star cancellation test and drawing test was performed on the subjects. The severity of neglect was measured on neglect tests. The lowest rCBF, the range with decreased rCBF, number of the foci with decreased rCBF, the flow deficit size and the total number of pixels in the foci were measured on SPECT rCBF imaging.
Results: Twenty-five patients were diagnosed as having HSN by the neglect test battery. Contralateral neglect (CN) and ipsilateral neglect (IN) were observed in both right and left hemisphere strokes. On SPECT images, the patients with neglect had decreased rCBF in the frontal cortex most often, parietal, occipital, temporal cortices second often, and basal ganglia and thalamus in some cases. The patients who had two or more regions damaged showed neglect more often and severe. The correlation coefficients between rCBF in the foci, the decreased percentage of rCBF of the foci and the severity of neglect were −0.119 (P>0.05) and 0.221 (P>0.05). The correlation coefficients between the range, number of foci, the flow deficit size, the total number of pixels of the foci and the severity of neglect were 0.537 (P<0.05), 0.493 (P<0.05), 0.561 (P<0.05), 0.466 (P<0.05), respectively. No difference between CN and IN on SPECT images reached statistical significance.
Conclusions: The severity of neglect did not correlate with rCBF and the decreased percentage of rCBF in the foci, while it was significantly correlated with the range, number of foci, the flow deficit size and the total numbers of pixels of the foci significantly. And the patients with CN and IN did not show any difference on the presence of HSN, the manifestation on the neglect test battery and SPECT images. HSN is the damage of multiple sites, with combined damage resulting in more severe neglect.
447. Co-registration of T2*-weighted MRI with [14C]-2-deoxyglucose autoradiography to validate delineation of the ischaemic penumbra
C. Robertson1, C. McCabe1, M.D.R. Lopez-Gonzalez2, D. Brennan2, L. Gallagher1, W. Holmes1, B. Condon2, K. Muir2, C. Santosh2 and I.M. Macrae1
1Glasgow Experimental MRI Centre (GEMRIC), University of Glasgow; 2Institute of Neurological Sciences, Southern General Hospital, Glasgow, UK
Objectives: Accurate identification of the ischaemic penumbra is critical in determining whether stroke patients will benefit from thrombolysis and in the design of future clinical trials of potential neuroprotectants. We have recently developed a novel MRI technique that could potentially enable a more precise definition of the penumbra where 100% oxygen is used as a metabolic biotracer to detect tissue metabolism.1 This ‘oxygen challenge’ (OC), has now been tested to validate that the penumbra, as defined by a T2* signal change during OC, equates with evidence of persisting tissue metabolism. This was achieved by co-registering T2* OC images with [14C]-2-deoxyglucose (14C 2-DG) autoradiograms, for determination of local cerebral glucose utilisation (LCMRglu).2
Methods: Male Sprague Dawley rats (300 to 323 g, n = 5) were anaesthetised (2% isofluorane), ventilated (Air) and the middle cerebral artery permanently occluded (MCAO) by the intraluminal filament technique. Imaging (6 coronal slices throughout MCA territory) was performed on a Bruker Biospec 7T/30 cm system. A T2 scan was generated as a neuroanatomical template for co-registration. Diffusion-weighted imaging (DWI) determined ischaemic damage and Perfusion-weighted imaging (PWI), using a continuous ASL technique, determined the perfusion deficit. A T2* weighted sequence was acquired during OC: 5 mins air, 5 mins 100% oxygen and 15 mins air inhalation. Following OC, rats were immediately administered an iv bolus of 125 μCi/kg 14C 2-DG. MRI images were co-registered to corresponding 14C 2-DG autoradiograms. Glucose utilisation was determined by optical density measurements (MCID v4) and MRI-defined regions of interest (ROI) were picked within cortical ischaemic core, contralateral cortex and penumbra, as defined by PWI/DWI mismatch.
Results: The mean (±s.d.) time to commence OC was 65±6 mins following MCAO. OC induced a T2* signal increase of 1.26% in contralateral cortex. Within ischaemic core, LCMglu was reduced by 98.5% (relative to contralateral cortex) and OC induced a small 0.74% increase in T2*. In penumbra, a 35% increase in LCMRglu co-registered with the greatest (3.97%) increase in T2* signal change (Figure). Interestingly, hyperglycolysis (295% increase in LCMRglu) occurred within the boundary of the ADC lesion and corresponded with a 1.04% T2* signal increase.
Corresponding ROIs on co-registered images.
Conclusions: Co-registration of MRI and autoradiograms provides evidence that the area of greatest T2* signal increase, which fell within penumbra (defined by PWI/DWI) is metabolically active (as defined by LCMRglu). Negligible T2* signal change and glucose utilisation were recorded within ischaemic core. Hyperglycolysis which bordered the ADC lesion and coregistered with a lower T2* increase, may be indicative of anaerobic glycolysis.
Research supported by an MRC project grant and Capacity Building Studentship (to CR).
456. Glutamine synthesis rate in the hyperammonaemic rat brain using simultaneous localized in vivo1H and 15N MRS
C. Cudalbu1, B. Lanz1, F. Morgenthaler1, Y. Pilloud1, V. Mlynárik1 and R. Gruetter1,2
1Laboratory for Functional and Metabolic Imaging (LIFMET), Ecole Polytechnique Fédérale de Lausanne (EPFL), Lausanne; 2Departments of Radiology, Universities of Lausanne and Geneva, Lausanne and Geneva, Switzerland
Objectives: Glutamine synthetase is a critical step in the glutamate-glutamine cycle, the major mechanism of glutamate neurotransmission and is implicated in the mechanism of ammonia toxicity. 15N MRS is an alternative approach to 13C MRS in studying glutamate-glutamine metabolism. 15N MRS studies allow to measure an apparent glutamine synthesis rate (Vsyn) which reflects a combination of the glutamate-glutamine cycle activity (Vnt) and net glutamine accumulation. The net glutamine synthesis (Vsyn-Vnt) can be directly measured from 1H NMR. Therefore, the aim of this study was to perform in vivo localized 1H MRS interleaved with 15N MRS to directly measure the net glutamine synthesis rate and the apparent glutamine synthesis rate under 15N labeled ammonia infusion in the rat brain, respectively.
Methods:1H and 15N MRS data were acquired interleaved on a 9.4T system (Varian/Magnex Scientific) using 5 rats. 15NH4Cl solution was infused continuously into the femoral vein for up to 10 h (4.5 mmol/h/kg).1 The plasma ammonia concentration was increased to 0.95±0.08 mmol/L (Analox GM7 analyzer). 1H spectra were acquired and quantified as described previously.215N unlocalized and localized spectra were acquired using the SIRENE sequence;3 and quantified using AMARES and an external reference method.4 The metabolic model used to analyze the total Gln and 5-15N labeled Gln time courses is shown on Figure 1A.
(A) Metabolic model; (B) One series of in vivo 1H spectra acquired at 9.4T in the rat brain; (C) A series of in vivo unlocalized 15N spectra acquired at 9.4T in the rat brain at different time points (from bottom to top: 23, 47, 69, 115, 173, 193, 218, 321, 376, 398, 420, 463, 529lmins). The 15N chemical shifts were referenced to nitromethane; (D) The time courses and corresponding fits of total Gln and 5–15N Gln from one rat.
Results: Glutamine concentration increased from 2.5±0.3 to 15±3.3 mmol/kg whereas the total glutamate concentrations remained unchanged (Figure 1B). The linear fit of the time-evolution of the total Gln from the 1H spectra gave the net synthesis flux (Vsyn-Vnt), which was 0.021±0.006 μmol/min per g (Figure 1D). The 5-15N Gln peak (−271 ppm) was visible in the first and all subsequent scans, whereas the 2-15N Gln/Glu peak (−342 ppm) appeared after ∼1.5 h (Figure 1C). From the in vivo 5-15N Gln time course, Vsyn = 0.29±0.1 μmol/min per g and a plasma NH3 fractional enrichment of 71%±6% were calculated. Vnt was 0.26±0.1 μmol/min/g, obtained assuming a negligible Gln efflux.5 Vsyn and Vnt were within the range of 13C NMR measurements.6
Conclusion: The combination of 1H and 15N NMR allowed for the first time a direct and localized measurement of Vnt and apparent glutamine synthesis rate. Vnt is approximately one order of magnitude faster than the net glutamine accumulation.
461. Comparison between BOLD and CBV fluctuations using partial directed coherence in rat brains during rest
W.H. Shim1, K.Y. Baek1, B. Rosen2, J.S. Jeong1 and Y.R. Kim2
1Bio&Brain Engineering, KAIST, Daejeon, South Korea; 2Radiology, Martinos Center for Biomedical Imaging/Massachusetts General Hospital, Charlestown, Massachusetts, USA
Objectives: Recently, low frequency vascular fluctuations during rest and functional connectivity analyses of fMRI have been introduced as one of the potential methods to effectively assess brain dynamics.1 However, most of resting state fMRI connectivity studies has been limited to the investigation of MRI signal changes based on blood oxygen level-dependence (BOLD). Since BOLD is an indirect signal based on the mixture of multiple physiologic parameters, we hypothesize that understanding underlying vascular parameter is important and perhaps more informative for displaying direct brain dynamics. In the current study, we specifically compared BOLD resting state fMRI fluctuations with CBV signals using partial direct coherence (PDC) analyses.
Methods: Three normal healthy Sprague-Dawley rats (∼300 g) were used for the BOLD and CBV acquisition (Gradient Echo Planar Imaging: TR/TE = 1000/12.89 ms; FOV = 2.5*2.5 cm2; five contiguous 1 mm slices; Recording time = 10 mins). ROIs were placed over the regions as motor cortex (M1 & M2), primary sensory areas (S1fl), secondary somatosensory cortex (S2), caudate putamen (CPu) and thalamus area (TA). Each ROI time course was detrended to the second order and bandpass-filtered between 0.01 and 0.3 Hz. Functional connectivity between ROIs in both BOLD and CBV were calculated by partial directed coherence (PDC).
Results:Figure 1 shows distribution tables of average PDC values, average area under the curve between 0.01 and 0.3 Hz in frequency domains. Both BOLD and CBV show similar functional influences from M1&M2 to TA and from CPu to TA. The directional BOLD interactions among M1&M2, S1fl and S2 and the functional pathways from CPu to M1&M2, S1fl and S2 were different from those found in CBV. Specifically, we found directional causality from M1&M2 to S2 and from CPu to S2 in CBV. Within significant PDC pathways (e.g., from M1/M2, CPu to TA: Figure 1), the PDC spectra across frequency displayed similar patterns between BOLD and CBV, in which distinctive frequency peaks appeared near both 0.12 and 0.24 Hz in both BOLD and CBV time courses (Figure 2).
Average under curve of PDC distribution tables for BOLD (A) and CBV (B).
Partial directed cohernce result. Partial directed coherence from M1/M2, CPu to TA.
Conclusions: Even though both BOLD and CBV seem to have similar frequency bands responsible for communicating between the brain regions, two methods reveal different causality networks, especially in M1&M2- and CPu-related areas. To support our PDC results, we also applied the Granger-causality analysis method to our data. The Granger-causality results were variable according to the autoregressive model order; however, the directional functional connectivities between ROIs were similar to our PDC results in most cases. We speculate that the differences between BOLD and CBV might be caused by metabolic efficiency difference in resting states or the baseline vascular conditions. The findings warrant future studies for understanding the relationship between underlying vascular parameter and blood oxygen level-dependence in functional connectivity analysis.
498. Pixel-by-pixel analysis of dual contrast-enhanced MRI results in experimental stroke
T. Nagaraja1, R. Paudyal2, K. Karki2, J. Ewing2, J. Fenstermacher1 and R. Knight2
1Anesthesiology; 2Neurology, Henry Ford Health System, Detroit, Michigan, USA
Introduction: Digitized image acquisition and analysis enables precise localization of regional variations of brain responses to injury and treatments. Only a few studies, however, have reported results employing such techniques in experimental stroke.1,2 In this study, generalized estimating equations (GEE) analysis was applied to data on blood-brain barrier (BBB) damage obtained from a rat model of transient cerebral ischemia by employing magnetic resonance imaging (MRI) with two contrast agents of different sizes.
Methods: Male Wistar rats (∼300 g; n = 6) were subjected to focal cerebral ischemia using suture occlusion of the right middle cerebral artery for 3 h followed by reperfusion via suture withdrawal. Contrast agents, gadolinium-diethylenetriaminepentaacetic acid (Gd-DTPA; ∼0.6 kDa) and Gd-DTPA linked to bovine serum albumin (Gd-BSA; 68 kDa) were synthesized. Status of the BBB at 21 h of reperfusion was assessed first by Gd-DTPA-MRI and then by Gd-BSA-MRI in a 7 Tesla magnet. Offline image processing was performed to localize contrast enhancing areas and construct maps of blood-to-brain influx constant (Ki) using Patlak plots.1 The mean Ki values from these maps were used to perform correlation analysis of the vascular permeability measured by MRI for the two contrast agents. Finally, the entire set of pixel-by-pixel correlations in all ROIs were analyzed by a generalized estimating equation (GEE) technique,3,4 using the R software package geepack.4
Results: The larger contrast agent Gd-BSA enhanced to a smaller extent than the smaller Gd-DTPA, but was contained within the latter region. It was assumed, therefore, that regions with Gd-BSA enhancement represented areas of common enhancement for both agents and were chosen as regions of interest (ROI) for further analysis. The comparison of mean values of Gd-DTPA with Gd-BSA from such ROI yielded a correlation of R = 0.36 with P<0.40). In contrast, the GEE analysis performed on the longitudinal data associated with 6 clusters corresponding to the 6 ROIs chosen yielded a correlation of R = 0.32 with P<0.002.
Conclusion: The simple mean comparison indicated that the Ki values were poorly and insignificantly correlated. The GEE analysis, however, showed that despite the poor correlation between the means, there was a significant relationship between the two measures. Thus, it may be possible to investigate the distribution of vascular pore sizes via the slope of the relationship between the transport constants of the two different-sized contrast agents, rather than via their mean values alone.
Grant support: Supported by NIH 1RO1NS38540, 1RO1HL70023 and AHA 0270176N, 0635403N.
646. Use of residue constraints and stochastic properties of noise improves the accuracy of perfusion information recovered from dynamic contrast MR/CT
N. Fitzgerald1, F. O'Sullivan1 and G. Newman2
1University College Cork, Cork, Ireland; 2Albert Eistein Research Centre, Philadelphia, Pennsylvania, USA
The application of residue analysis for quantification of the haemodynamic parameters flow, volume and mean transit time for perfusion CT/MR is well established. This technique requires the use of deconvolution of the acquired dynamic data to estimate the residue function (R) which by definition takes a positive and monotone decreasing shape. Reconstruction of R provides estimates of each parameter. In the case of MRI, the raw signal intensity is well approximated by Rician statistics. The standard approach to estimation involves logarithmic transformation and deconvolution by truncated singular value decomposition. At low signal to noise this approach may not be efficient. A maximum likelihood deconvolution method involving an iterative re-weighted non-linear least squares algorithm incorporating residue function constraints has been developed. Simulation studies are presented to evaluate improvements in parameter estimates achieved by this approach relative to the standard deconvolution method. The results show that over a range of realistic signal to noise values, significant improvements in estimation accuracy are achieved (10% to 20% in flow and mean transit time). The method is applied to perfusion MRI data and smoothed parametric maps based on arterial input selected by shape driven segmentation are presented.
Supported by the Irish Health Research Board.
696. Combined fMRI and metabolic voltammetry in vivo: understanding the neurochemical basis of functional imaging signals
N. Sibson1, S. Mchugh2 and J. Lowry3
1Gray Institute for Radiation Oncology and Biology; 2Department of Experimental Psychology, University of Oxford, Oxford, UK; 3Department of Chemistry, National University of Ireland, Maynooth, Ireland
Objectives: The use of functional magnetic resonance imaging (fMRI) in both basic and clinical neuroscience is rapidly expanding. However, although advances have been made in correlating fMRI responses with the underlying neuronal activity, the fact remains that this technique does not directly measure neuronal activity but associated haemodynamic (and metabolic) events. Moreover, a constant relationship between neuronal, haemodynamic and metabolic processes across different brain regions is frequently assumed, despite substantial differences in neuronal architecture. Only by fully understanding the relationship between these parameters will we be able to fully utilise functional neuroimaging. Therefore, we must find a way of correlating fMRI data, which largely reflects the haemodynamic component, with neural and/or metabolic information. Long-term in-vivo electrochemistry (LIVE) enables real-time measurement of brain metabolites.1 In this study we have developed methods for simultaneous fMRI and tissue oxygen measurements via LIVE for direct correlation of metabolic and haemodynamic factors.
Methods: Animals (n = 3) were anaesthetised with 1.8% isoflurane in 70%N2O:30%O2, and a carbon fibre electrode (CFE) implanted into the right motor cortex (Bregma −1.5 mm). Two further electrodes (auxiliary and reference) were implanted in the same cortical hemisphere (Bregma +3.5 and +4.5 mm). Changes in O2 concentration at the recording CFE were monitored using constant potential amperometry, with the CFE held at −900 mV (versus reference CFE). A multi-echo gradient echo imaging sequence was used to obtain blood oxygenation level dependent (BOLD) fMRI data: flip angle = 20°; TR = 27.3 ms; TE = 7, 14, 21 ms. Mean echo images were calculated from the individual echo images. Both BOLD and voltametric data were acquired continuously. Following a baseline period of 2 mins, oxygen content of the inspired gases was either reduced (0% O2) for 30 secs or increased (50%, 70% or 100% O2) for 1 mins. This paradigm was repeated 3 times for each condition.
Results: As shown in the Figure, tissue O2 measurements and BOLD responses obtained simultaneously demonstrated close correlation during complete oxygen removal (100% N2O; between dotted lines); BOLD data taken from ROI in region of recording CFE. Both measurements showed a slightly delayed, but marked negative response on elimination of inspired O2, owing to increased deoxyhaemoglobin levels (BOLD) and decreased tissue oxygen. Conversely, when the inspired oxygen was increased positive changes in both the BOLD and tissue oxygen signals were observed.
Conclusions: Our findings demonstrate the feasibility of obtaining real-time metabolite information during fMRI acquisition. Although demonstrated here for oxygen measurements, the same LIVE technology can be applied to the measurement of many different neurochemicals, thus enabling comprehensive investigation of the relationship between fMRI signal changes and the underlying neurochemistry.
718. Fast bolus-tracking function magnetic resonance imaging (fMRI) in medetomidine-sedated rats using intravascular tracer
C.W. Blau1, M. Kelly1, K.M. Griffin2, J.F.X. Jones2 and C.M. Kerskens1
1Trinity College Institute of Neuroscience, Trinity College Dublin; 2School Medicine and Medical Science, Dublin, Ireland
Objectives: Using a recently described animal model for fMRI1 that has potential for longitudinal studies, we investigated the feasibility of using a commercial MRI contrast agent to detect neuronal activation. We show that neuronal activation can not only be easily detected using our method, but that information about the hemodynamic response can be gleaned over and above that provided by blood-oxygen level-dependent (BOLD) fMRI.
Methods: MRI Images of rat primary somatosensory cortex were obtained using a 7Tesla Bruker BioSpin scanner with purpose-built transmit and receive coils. T1-weighted images of the coronal slice of interest were acquired using a fast gradient echo sequence (echo time 3.5 ms, repetition time 11.0 ms, matrix 64 × 64, 1 average, 120 repetitions, acquisition time 60 secs). Male Wistar rats (n = 4) were placed in the scanner under sedation with a continuous subcutaneous infusion of medetomidine1 and electrically stimulated using 5 ms duration, 5 Hz, 3 V pulses via electrodes connected to the forepaw, enabling unilateral stimulation of the associated cortical area. Shortly after initiation of stimulation and during acquisition of images, a bolus of meglumine gadopentate was injected via a tail-vein. The resulting images were evaluated using a software script in IDL language, and bolus transit curves calculated for the active and contralateral regions.
Results: The temporal activation pattern of select primary somatosensory cortical neurons was clearly visible on subtraction maps (see Figure), and regions of activation selected from these maps showed a significant difference in both signal amplitude and time-to-peak of bolus arrival between activated and contralateral regions (P<0.01, Student's t-test). Second moment is also significantly (P<0.05) greater in the activated region. The outcome of analysis and deconvolution of the signal in the activated region with respect to contralateral control regions will be shown.
Time evolution of neuronal activation.
Time evolution of neuronal activation of rat somatosensory cortex; subtraction images from images acquired 500 ms apart.
Discussion: First moments of drug passage are generally thought to reflect mean transit time (MTT) through the entire vasculature, whilst the second moment has been hypothesized to represent micro-vascular topology2 and this has been applied to other animal models to determine microflow heterogeneity.3 Our results show that the activation response causes a measurable increase in both flow rate and heterogeneity, which can be characterized further due to the fine temporal resolution of our method. The method shows promise for longitudinal studies in which changes in activation response could be repeatedly sampled over time. In conclusion, we present a novel method for both visualizing neuronal activation and quantifying the associated vascular response.
792. Dynamic calibrated fMRI for event related oxidative energetics
B.G. Sanganahalli1,2, P. Herman1,2,3, H. Blumenfeld4,5 and F. Hyder1,2,6
1Diagnostic Radiology; 2QNMR, Yale University School of Medicine, New Haven, Connecticut, USA; 3Semmelweis University, Budapest, Hungary; 4Department of Neurology; 5Neuroscience; 6Biomedical Engineering, Yale University School of Medicine, New Haven, Connecticut, USA
Objectives: Energetic basis of neural activity provides a solid foundation for non-invasive neuroimaging with calibrated fMRI. Calculating dynamic changes in cerebral oxidative energy utilization (CMRO2) is limited by uncertainties about whether or not the conventional BOLD model can be applied transiently using multi-modal measurements of blood flow (CBF) and volume (CBV) that affect the blood oxygenation level dependent (BOLD) signal. A prerequisite for dynamic calibrated fMRI is testing the linearity of multi-modal signals within a temporal regime, as assessed by signal strength (i.e., both intensity and width). If each hyperemic component (BOLD, CBV, CBF) is demonstrated to be linear with neural activity under various experimental conditions, then the respective transfer functions generated by deconvolution with neural activity should be time invariant and thus could potentially be used for calculating CMRO2 transients.
Methods: Sprague-Dawley rats (n(fMRI) = 12, n(neurophysiology) = 8) were used under α-chloralose anesthesia (46±4 mg/kg per h). The stimulation ranged from a single pulse to several pulses (1 to 4). Each pulse was 2 mA in amplitude and 0.3 ms in duration. The frequency ranged from 1.5 to 6 Hz. All fMRI data were obtained on a modified 11.7T Bruker horizontal-bore spectrometer (Billerica, MA) using a 1H resonator/surface coil RF probe. LFP and MUA were recorded extracellularly in layer 4 of the rat somatosensory cortex. Electrical (e.g., LFP) non-electrical (e.g., BOLD, CBF, CBV) signals were measured during forepaw stimulation. Changes in CMRO2 were calculated using multi-modal measurements of changes in BOLD signal (ΔS/S), blood flow (ΔCBF/CBF), and blood volume (ΔCBV/CBV) from the relationship originally described by Ogawa et al, 1993.
Results: We found variable dependencies of each hyperemic component (BOLD, CBF, CBV) and neuronal activity (LFP, MUA) with the inter-pulse interval. Although relationships between neural activity and stimulus features ranged from linear to non-linear, associations between hyperemic components and neural activity were linear. Specific to each hyperemic component, a universal transfer function was calculated using iterative convolution method with LFP or MUA as input signal. In this process the residual signal (difference between the modeled and measured signal) was minimized. For stimulus frequencies of 1.5 and 3 Hz, the CMRO2 response (intensity, width) increased linearly with higher number of stimulus pulses, whereas for the same number of stimulus pulses the CMRO2 response decreased with higher stimulus frequency. For stimulus frequency of 6 Hz, the CMRO2 responses were nearly identical for different number of stimulus pulses. Existing methods cannot provide high temporal resolution CMRO2 data. Therefore, based on the thermodynamic principle of relating energy expended for the work done, we used the neural activity as a pseudo-validation for the predicted CMRO2 transients. Furthermore, given that the BOLD signal is dependent on oxygen transport from blood to tissue, we compared our CBF-CMRO2 coupling with theoretical predictions and experimental observations.
Conclusion: The results identified a component of the BOLD signal that can be attributed to significant changes in CMRO2, even for temporal events separated by less than 200 ms.
Acknowledgements: Supported by grants from NIH (R01 MH-067528, R01 DC-003710, P30 NS-52519).
796. fMRI and electrophysiological studies with α-chloralose and domitor anesthesia
B.G. Sanganahalli1,2, P. Herman1,2,3, H. Blumenfeld4,5 and F. Hyder1,2,6
1Diagnostic Radiology; 2QNMR, Yale University School of Medicine, New Haven, Connecticut, USA; 3Semmelweis University, Budapest, Hungary; 4Department of Neurology; 5Neuroscience; 6Biomedical Engineering, Yale University School of Medicine, New Haven, Connecticut, USA
Objectives: Anesthetized animal studies are valuable for many experimental situations and settings including high resolution fMRI, electrophysiology and optical imaging. Different anesthetics have diverse effects on systems responsible for arousal and conscious states, and the design of such studies may be affected by the profound metabolic and electrical effects of using different anesthetics. Recently, domitor (α2-adrenergic agonist) has been studied as a potential anesthetic for longitudinal studies in rodents. α-chloralose and domitor have different powers in the γ band range of neural activity, which presumably reflect different arousal states. Therefore, we were interested in comparing the functional responses obtained under domitor and α-chloralose anesthesia during sensory stimulation in rodents.
Methods: Sprague-Dawley rats were tracheotomized and artificially ventilated (70% N2O, 30% O2). During the animal preparation isoflorane (2% to 3%) was used for induction. Intraperitoneal lines were inserted for administration of α-chloralose (46±4 mg/kg per h) or domitor (0.1 mg/kg per h) and D-tubocurarine chloride (1 mg/kg per h). Forepaw stimulation was achieved by insertion of thin needle copper electrodes under the skin of the forepaw. Electrical stimulation consisted of 0.3 ms square wave pulses provided with a stimulus isolation unit (World Precession Instruments, FL, and USA). Variation of functional response was achieved by varying the frequency (1 to 24 Hz) of the stimulus. The stimulus was controlled with a computer by custom written scripts with a 30 secs off 30 secs on block design. All fMRI data were obtained on a modified 11.7T Bruker horizontal-bore spectrometer (Billerica, MA) using a 1H resonator/surface coil RF probe. LFP and MUA were recorded extracellularly in layer 4 of the rat somatosensory cortex.
Results: We evaluated forepaw stimulation-induced activity patterns in the rat somatosensory area. Electrical stimulation (2 mA) of the forepaw with 0.3 ms duration pulses for 30 secs evoked a strong positive BOLD signal change in the contralateral primary somatosensory area of the forelimb (S1FL) under both anesthetics with stimulus frequency above 1 Hz. We found frequency tuning response curves for α-chloralose and domitor where the BOLD and CBV responses peaked at 3 Hz for chloralose and 9 Hz for domitor. There were significant differences in the amplitude and shape of the BOLD and CBV response curves under domitor as compared to a-chloralose (3 Hz) and (9 Hz). The reproducibility of responses from inter and intra subjects was better with a- chloralose as compared to domitor. Baseline multiunit (MUA) and local field potential (LFP) recordings from S1FL regions under α-chloralose and domitor showed different power in the γ band range of neural activity, which presumably reflects different arousal states. There is a dramatic difference in the power of the γ band range of neural activity in the cortex, where activity/energy is significantly higher in the domitor state.
Conclusion: Differences in baseline spontaneous neuronal activity may be responsible for differential response magnitudes in BOLD and CBV under these two anesthetics. These results will benefit interpretation of fMRI experiments in anesthetized rodents as well as the understanding of brain function.
Achnowledgements: Supported by grants from National Institutes of Health (R01 MH-067528, R01 DC-003710, P30 NS-52519).
797. BOLD impulse responses across cortical layers: implications for CMRO2
P. Herman1,2,3, B.G. Sanganahalli1,2, H. Blumenfeld2,4,5,6 and F. Hyder1,2,7
1Department of Diagnostic Radiology; 2Quantitative Neuroscience with Magnetic Resonance, Yale University, New Haven, Connecticut, USA; 3Institute of Human Physiology and Clinical Experimental Research, Semmelweis University, Budapest, Hungary; 4Department of Neurology; 5Department of Neurosurgery; 6Department of Neurobiology; 7Department of Biomedical Engineering, Yale University, New Haven, Connecticut, USA
Objectives: The calibrated fMRI technique can be used to extract oxygen consumption (CMRO2) from BOLD signal using multi-modal measurements of blood flow (CBF) and volume (CBV).1,2 This model based approach describes tissue oxygen extraction at steady-state.3,4 It is not clear how the cortical localization of the measurements can modify the calibration procedure since the neuronal and vascular microstructure is not homogenous across the cortex. How are the neural signals connected to the functional BOLD responses in different layers of the cortex? We described the BOLD transfer functions in the upper, middle and lower cortical layers with convolution analysis. The same experimental model was used in two groups of rats to measure the fMRI-BOLD signals and the conjunctive neural responses.
Methods: Sprague-Dawley rats were anesthetized with Halothane or Isoflurane which switched to i.p. α-chloralose after the surgery. Forepaw stimulation: Each stimulus train lasted 30 s with 3 Hz frequency, 2 mA in amplitude and 0.3 ms in duration. BOLD (n = 7): All gradient echo EPI fMRI data were obtained on a modified 11.74T Bruker horizontal-bore spectrometer (Billerica, MA) using a 1H resonator/surface coil RF probe. Electrophysiology (n = 31) In the second group of animals microelectrodes were inserted step-by-step into three different depths of the cortex (upper, lower and middle part; 0.3, 1, and 1.5 mm, respectively) with stereotaxic manipulator. Local field potentials (LFP) were obtained applying low pass filter (<150 Hz) to the raw time series. Transfer function: The transfer function between the LFP and the BOLD signal was modeled by the gamma variate function.5 The input function was defined as the average of the LFP series, where the individual events were normalized to the largest evoked potential (first evoked potential in the middle layer).
Results: The BOLD signal has the largest response in the upper layer and decreases toward the deeper cortical layers. The LFP signal is the most explicit in the middle layer and the smallest in the lower layer. The amplitude of transfer function follows the amplitude of the functional BOLD response. The normalized signals show very good correlation between the layers. The correlations between the electrical signals are very good because of the high number data point and similar pattern of the signals. BOLD signals show the best correlation between the upper and middle layers, while in the lower layer there is a small hysteresis in the correlation. Similarly the transfer functions of the upper and middle layers are well correlated.
Conclusion: Despite the differences in amplitudes, the normalized responses of the upper and middle layers are interchangeable for CMRO2 calculation. On the other hand, the lower layer of the cortex needs separate calibration.
This work was supported by grants from NIH (R01 MH-067528, R01 DC-003710, P30 NS-52519).
800. BOLD impulse responses for different somatosensory modalities: implications for CMRO2
P. Herman1,2,3, B.G. Sanganahalli1,2, H. Blumenfeld2,4,5,6 and F. Hyder1,2,7
1Department of Diagnostic Radiology; 2Quantitative Neuroscience with Magnetic Resonance, Yale University, New Haven, Connecticut, USA; 3Institute of Human Physiology and Clinical Experimental Research, Semmelweis University, Budapest, Hungary; 4Department of Neurology; 5Department of Neurosurgery; 6Department of Neurobiology; 7Department of Biomedical Engineering, Yale University, New Haven, Connecticut, USA
Objectives: Quantitative mapping of changes in CMRO2 with calibrated fMRI1 is proportional to changes in energy consumption of neuronal activities induced by different type of stimulations.2 The calibrated fMRI is based on a tissue oxygen extraction model.3,4 This model includes measured or modeled hemodynamic parameters (CBV, CBF), and their responses are different in different areas of the cortex. If these responses will differ only because of the different neural responses, than the same CMRO2 calibration can be used through different cortical areas. We measured BOLD and LFP signals in the forelimb and the whisker barrel cortex and calculated the impulse response functions with convolution analysis between these modalities. We assume the transfer function can linearly convert the electrical activity to the co-localized BOLD response, therefore similar transfer functions can establish the same CMRO2 calibration.
Methods: Sprague-Dawley rats were artificially ventilated. The anesthesia was switched to i.p. α-chloralose from Halothane or Isoflurane after the surgery. Stimulation: Electrical forepaw stimulus trains used 2 mA in amplitude, with 3 Hz frequency, and 0.3 ms in duration. For whisker stimulation we used air-puffs through a solenoid controlled plastic tube5 with 8 Hz of stimulus frequency. All stimulus presentation lasted 30 secs. BOLD (n = 13): All gradient echo EPI fMRI data were obtained on a modified 11.74T Bruker horizontal-bore spectrometer (Billerica, MA) using a 1H resonator/surface coil RF probe. Electrophysiology (n = 33): Microelectrodes were inserted with stereotaxic manipulator either into the somatosensory forelimb or into the whisker barrel region. Local field potentials (LFP) were obtained applying low pass filter (<150 Hz) to the raw time series. Convolution analysis: The transfer function between the LFP and the BOLD signal was modeled by the gamma variate function.6 The input function was defined as the average of the LFP series.
Results: We studied the responses only in the middle (III-IV) cortical layer, from where the electrical activity was measured. The BOLD response and LFP activity for whisker stimulation were weaker than that for the forepaw stimulation. However their normalized values were correlated very well (r2 was 0.86 and 0.99, respectively). Transfer functions were calculated for both areas. The precision of the simulation was adequate if the root mean square of the residual signal (i.e. difference between the modeled and measured signal) was smaller then the standard deviation of the measured signal (Forepaw: 0.2 versus 0.58, Whisker: 0.41 versus 1.36).
Conclusion: Despite the similar characteristics of the transfer functions and the high correlation of the normalized signals, there is a marked hysteresis in the correlation of impulse response functions, which indicates caution in the CMRO2 calibration.
This work was supported by grants from NIH (R01 MH-067528, R01 DC-003710, P30 NS-52519).
801. Multi-compartment CBV changes with laser-doppler and fMRI
P. Herman1,2,3, B.G. Sanganahalli1,2 and F. Hyder1,2,4
1Department of Diagnostic Radiology; 2Quantitative Neuroscience with Magnetic Resonance, Yale University, New Haven, Connecticut, USA; 3Institute of Human Physiology and Clinical Experimental Research, Semmelweis University, Budapest, Hungary; 4Department of Biomedical Engineering, Yale University, New Haven, Connecticut, USA
Objectives: Quantitative mapping of changes in CMRO2 proportionally describes the energy consumption of neural activities,1,2 therefore it is popular for studying functional brain activity. Calibrated fMRI experiments require measurements of CBF, CBV, and BOLD signal to predict CMRO2 changes. Injection of long-lasting MRI contrast agent is necessary to obtain an MRI signal that was highly weighted by CBV. The aim of this study was to find an alternative method to estimate the CBV changes during stimulation.3
Methods: Animal preparation: Sprague-Dawley rats were anesthetized with Halothane which switched to i.p. α-chloralose after the surgery. Forepaw stimulation: Each stimulus train lasted 30 secs with 3 Hz frequency, 2 mA in amplitude and 0.3 ms in duration. CBV fMRI measurement (n = 6): All gradient echo EPI fMRI data were obtained on a modified 11.74T Bruker horizontal-bore spectrometer (Billerica, MA) using a 1H resonator/surface coil RF probe. The focal CBV response was measured by injection of iron oxide nanocolloid (Combidex 15 mg/ml).2LDF and backscatter measurement (n = 12): Fiber optodes (interoptode distance: 200 μm) were inserted into the three different depth of the forepaw somatosensory cortex with stereotaxic manipulators to measure the laser-Doppler flux and backscattered light intensity.
Results: We found a strong correlations between the MRI measured CBV and the optically measured back scattered light intensity in every three measured layers during onset (r2 = 0.96±0.02), activation plateau (r2 = 0.86±0.16), and offset (r2 = 0.97±0.02) phases of the functional hyperemic response (overall r2 = 0.95).
The contrast agent used in the fMRI CBV measurement is diluted in plasma volume which follows CBV changes after hematocrit correction. The BS signal intensity depends the scattering property of the brain tissue and the concentration of absorbers (i.e. oxy- and deoxyhemoglobins). Higher signal intensity means lower concentration of absorbers. If the wavelength of the applied laser light is an isosbestic point of the hemoglobin absorption curves, then only the number of the hemoglobin molecules can affect the BS intensity. Since oxygenation change doesn't influence the BS signal, it refers to the RBC volume which follows the change of the CBV. The instantaneous hematocrit (tube hematocrit) has to vary in the small vessels, because of the Fahraeus-effect, the discharge hematocrit seems to remain constant.
Conclusion: These results suggest that CBV measurements from both blood compartments may be used to reflect dynamic changes in total CBV. Furthermore, by assuming steady-state mass balance and negligible counter flow, these results indicate that discharge (volume) hematocrit is not appreciably affected during functional activation.
This work was supported by grants from National Institutes of Health (R01 MH-067528, R01 DC-003710, P30 NS-52519).
802. Quantification of punctate iron sources using susceptibility weighted phase images
G. McAuley1, M. Schrag1, P. Sipos2, R. Sun3,4, A. Obenaus5, B. Holshouser6, W. Kirsch1 and W.J. Pearce7
1Neurosurgery Center for Research, Loma Linda University, Loma Linda, California, USA; 2Department of Inorganic Biochemisty, University of Szeged, Szeged, Hungary; 3Non-Invasive Imaging Laboratory; 4School of Science and Technology; 5Non-Invasive Imaging Laboratory, Radiobiology Program; 6Radiology; 7Center for Perinatal Biology, Division of Physiology, Loma Linda University, Loma Linda, California, USA
Objectives: Iron deposition and dysregulation have clearly been implicated in neurodegenerative diseases including Alzheimer's disease (AD). Whether changes in iron content and metabolism are causal or epiphenomena, there is strong evidence that iron-mediated tissue damage occurs. We recently reported increasing BMB in a subset of subjects with progressing dementia in our prospective study. The BMB were located spatially in the brain in a pattern that is characteristic of cerebral amyolid angiopathy (CAA), a disease where beta amyloid is deposited in small cerebral arteries and microvessels, and typically present in AD cases.
Extravasated blood following BMB is a pathological source of brain iron that may contributes to the dementia associated with AD and CAA, and is potentially informative regarding the extent of cerebral vessel pathology. The potential role of paramagnetic iron as a biomarker or agent of disease makes its noninvasive quantification by MR very valuable for monitoring disease progression and treatment efficacy both clinically and experimentally. Past efforts to quantify brain iron have focused on estimation of content in distributed brain regions. However, BMB represent punctate iron sources where quantification is desirable.
Susceptibility weighted imaging (SWI) is a MR modality that uses magnetization phase to create or enhance contrast. It has been shown to be more sensitive to BMB detection than gradient echo T2* (GRE T2*) methods. Magnetization phase is directly related to tissue susceptibility differences, and therefore is sensitive to the presence of paramagnetic iron.
The present study investigates the possibility of using phase images to quantify iron content in punctate iron sources. We hypothesize a theoretical relationship between the iron content of samples modeled as magnetic dipoles and a measureed parameter in the phase images.
Methods: Magnetic resonance phantoms were constructed containing samples of a chitosan-ferric oxyhydroxide composite material which serves as a mimic for hemosiderin (the iron-containing blood breakdown product that marks the location of BMB in GRE T2* and SWI images). The phantoms were imaged using a SWI sequence at 11.7T. An easily recognized parameter from the resulting phase images theoretically related to the iron content of the sample was then measured from the resulting phase images. A plot relating the parameter with the known sample iron content was constructed.
Results: The hypothesized relationship between dipole pattern properties and sample iron content in phase images was corroborated by a plot of theoretically related variables that displayed the predicted mathematical form.
Conclusions: A simple and effective method is presented that relates parameters from phase images to iron content of punctat samples modeled as magnetic dipoles. Phantoms were constructed with a chitosan-ferric oxyhydroxide composite which serves as a mimic for hemosiderin. Results are in excellent agreement with theory, and serve as a ‘proof of concept’ of the quantification technique. The research is potentially a first step toward experimental or clinical quantification of puntate iron sources such as BMB marked by hemosiderin deposits.
981. Contribution of peripheral IL-1beta expression in the systemic reactivation of focal MOG-EAE lesions in rat brain
S. Serres1,2, D.C. Anthony3, Y. Jiang3, S.J. Campbell3, D. Merkler4, W. Bruck4, J. Recton5 and N.R. Sibson2
1Physiology, Anatomy & Genetics; 2Gray Institute for Radiation Oncology and Biology; 3Pharmacology, University of Oxford, Oxford, UK; 4Neuropathology, Georg-August University, Gottingen, Germany; 5Biogen IDEC, Boston, Massachusetts, USA
Objectives: Multiple sclerosis (MS) is a chronic inflammatory disorder associated with demyelination and axonal injury. Most MS patients display a relapsing-remitting form of disease in which bacterial and viral infections may play a key role. We have previously demonstrated that systemic endotoxin injection induced reactivation of inflammatory processes in focal MOG-EAE lesions. It has also been shown that systemic infection increases peripheral IL-1beta expression.
Methods: Therefore, in this study, we have investigated the contribution of systemic IL-1beta in the reactivation of focal MOG-EAE lesions. Two groups of rats with dormant CNS lesions were challenged with an i.v. injection of adenovirus expressing IL-1beta cDNA (4 × 10¹⁰ plaque forming units). In addition, one of the groups was treated with a therapeutic dose of rrIFNbeta (5 × 10⁶ U/kg, intraperitonally).
Results: We found a significant increase in the left/right regional cerebral blood volume (rCBV) ratio (∼2 fold) from 1 to 3 days after administration of adenovirus expressing IL-1beta cDNA, an effect that we have previously shown to be associated with new macrophages recruitment and increased myelin loss following systemic endotoxin challenge. Post-gadolinium-DTPA T1-weighted images revealed contrast enhancement in the ipsilateral meninges indicating breakdown of the blood-CSF barrier, probably caused by extravasations of leukocytes into the brain. To determine whether a commonly used therapeutic agent IFNbeta could combat this IL-1beta induced reactivation of an MS-like lesion, rats were treated with therapeutic doses of rrIFNbeta and showed marked amelioration of the increased rCBV ratio together with a reduction in the gadolinium enhancement in the ipsilateral meninges.
Conclusion: These findings demonstrate the key role of peripheral IL-1beta expression in the mechanism of systemic reactivation of MS lesions and as the potential for therapy using IFNbeta.
998. Functional MRI during direct stimulation of the sensorimotor cortex in rats after unilateral stroke
M.P.A. van Meer1,2, K. van der Marel1, W.M. Otte1,2, J.W. Berkelbach van der Sprenkel2 and R.M. Dijkhuizen1
1Image Sciences Institute; 2Rudolf Magnus Institute of Neuroscience, University Medical Center Utrecht, Utrecht, The Netherlands
Objectives: Functional MRI studies with peripheral somatosensory stimulation or, in patients, execution of a task have provided important insights in rearrangement of ipsi- and contralesional functional brain fields during recovery from stroke.1,2 In this study we applied blood oxygenation level-dependent (BOLD) fMRI during direct intracortical stimulation (DICS) of the primary motor cortex (M1) in rats recovering from stroke. Our goal was to assess possible changes in excitability of ipsi- and contralateral sensorimotor network regions following DICS of contralesional M1 at different time points after experimental unilateral stroke.
Methods: Stroke was induced by 90-mins transient intraluminal occlusion of the right middle cerebral artery (tMCAO) in adult male rats. MRI was conducted on a 4.7 T MR system at 3 days (n = 2) and 4 weeks (n = 2) after stroke. Nine rats served as controls. Animals were anesthetized with 1% to 2% isoflurane in air/O2 (2:1) and paralyzed with pancuronium bromide during MRI to prevent head motion. MRI-compatible custom-made bipolar insulated gold electrodes were positioned in contralesional (= left) M1. BOLD echo planar imaging was done in combination with a DICS paradigm3 that involved 5 blocks of 3-secs periods of stimulation, followed by 60-secs rest. The BOLD signal intensity time series were coregistered to a T2-weighted rat brain template. Statistical activation maps were calculated using FEAT (www.fmrib.ox.ac.uk). Z-statistic images were thresholded at a Z-value of 2.3 (uncorrected, equal to a corrected P = 0.05).
Results: The Figure displays average fMRI activation maps of the different groups (Z = 2.3 to 25.5). Various cortical and subcortical sensorimotor areas ipsilateral to the stimulation site (= left) showed significant BOLD activation after stimulation of M1 in healthy control animals. Contralateral to the stimulation site (= right) M1, clear activation responses were evident in secondary motor cortex (M2), primary somatosensory cortex of the forelimb (S1fl) and caudate putamen. DICS-induced activation responses were decreased at 3 days after stroke in ipsilesional intact motor regions and contralesional subcortical areas. At 4 weeks after stroke activation was recovered in various ipsi- and contralesional sensorimotor regions.
DICSfMRI.
Conclusions: This study demonstrates that fMRI during DICS allows assessment of central functional connectivity in rat brain. Our preliminary data in stroke rats point toward loss of ipsi- and contralesional activation at a subacute stage. At 4 weeks after tMCAO, when animals had recovered considerably, the activation pattern more clearly resembled the control situation, which is in agreement with previous fMRI data based on peripheral forelimb stimulation.2
1049. MRI estimates of the transvascular transfer constant of albumin agree with those of quantitative autoradiography
J. Ewing1, T. Nagaraja2; R. Paudyal1, H. Bagher-Ebadian1, R. Knight1, S. Panda1 and J. Fenstermacher2
1Neurology; 2Anesthesiology, Henry Ford Hospital, Detroit, Michigan, USA
The apparent forward transfer constant, K1a, for albumin was measured in implanted 9 L cerebral tumors in 15 rats, 8 of which had been previously administered dexamethasone to broaden the range of vascular transfer constants present in the tumors1. An MRI study using Gd-labeled albumin (Gd-BSA) was followed by terminal quantitative autoradiography (QAR) using radioiodinated serum albumin (RISA). MRI procedures used Look-Locker estimates of T1 to follow Gd-BSA tissue concentration. QAR and MRI maps of K1a were co-registered, a region of interest (ROI) that included the tumor and its bordering tissue was selected, and the estimates of K1a by two techniques were compared by calculating the correlation coefficient based on either summary data (i.e., mean per animal ROI) or on pixel-by-pixel data using a generalized estimating equation (GEE).
For 15 animals, the two estimates of K1a did not differ (P = 0.2), and were significantly correlated (r = 0.55, P = 0.04). A pixel-by-pixel GEE analysis, adjusting for clusters, showed a significant correlation between the two measures (r = 0.56, P<0.0001), consistent with the summary data.
We conclude that the MRI K1a measure shows utility as a surrogate measure of QAR K1a.
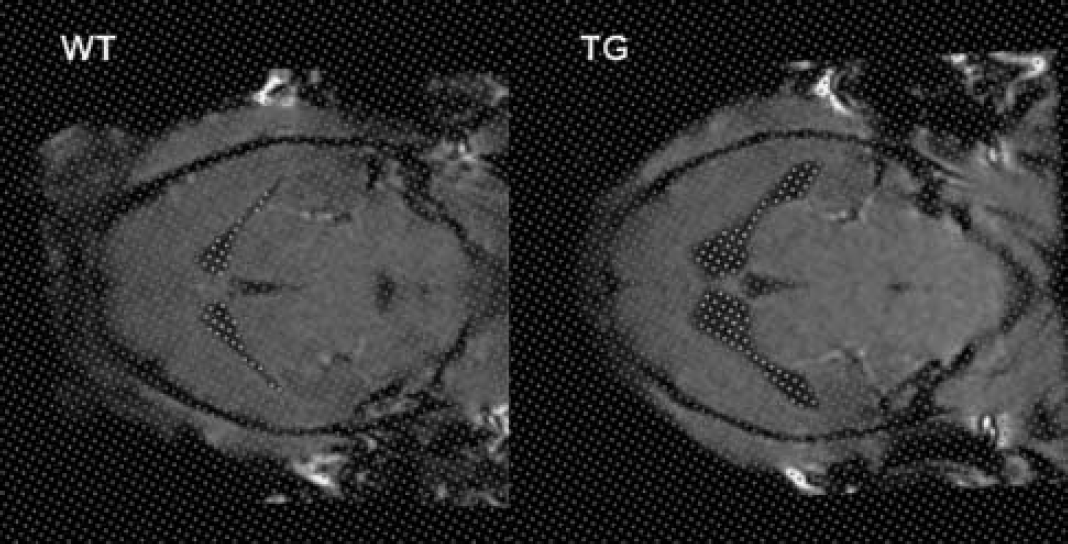
1063. Volumetric assessment for morphological structures of mouse brain lateral ventricle using anatomical MRI images based on a random-sampling theorem
A. Yamamoto1,2, K. Koshino1, Y. Hirano1, C. Shen3, Y. Niwa3, N. Iwai3, H. Sato1, H. Fujiwara2 and H. Iida1,2,4
1Department of Investigative Radiology, National Cardiovascular Center Research Institute; 2Department of Medical Physics and Engineering, Graduate School of Medicine, Osaka University; 3Department of Epidemiology, National Cardiovascular Center Research Institute, Osaka, Japan; 4Neurobiology Research Unit, Copenhagen University Hospital, Copenhagen, Denmark
Introduction: ‘Random Sampling’ (RS)-based grid-point counting is an un-biased statistical procedure for assessing volumes for given structures.1 A sophisticated program has been developed to assess volumes from tomographic images of MRI/PET with careful counting of randomly-generated grids those hit the volume-of-interest. Particle grids are generated randomly with arbitrary shift and/or rotation parameters, and observers are asked to highlight those grids on computer-screen, with careful judge for each point, based on anatomical/pathophysiological knowledge. This study was intended to evaluate the adequacy and usefulness of this program by applying to both numerical and physical phantoms. Applicability of this technique to anatomical/pathophysiological assessment on small animals has also been tested.
Materials and methods: The program is written in JAVA and can be applied to mutiple tomographic images which have been registered prior to the analysis. Grids are generated and overlaid to tomographic images, and the number of points hitting the structure-of-interest is counted. Volume assessment for multiple slice data is made by multiplying the area estimated from the number of grids at each slice by thickness of slice.
To test the statistical characteristics of RS approach, a simulation study was carried out, by assuming simple numerical phantoms of known volumes. Accuracy of the estimated volume was evaluated as a function of the number of grids hitting the structure.
The same evaluation was made for a small physical phantom of 436 microL obtained using a clinical MRI (GE, Signa HD) scanner with a small-animal dedicated coil.2 T1W images (156 × 156 × 300 μm) were obtained with 3D fast-spoiled-gradient-echo (FSPGR) sequence (TR/TE = 16/3.4 ms, FA30°).3 Agreement of estimated volume and the statistical uncertainty of RS approach were evaluated.
Study was also carried out on 9 normal mice (weight; 18 to 32 g, age; 3.7±1.2 months) and a transgenic (TG) mouse (2-months old male) of ventricular distension.
MRI images were obtained using the same scanner, with visualizing images at constant signal intensity.
Results and discussion: Both numerical and physical phantom studies resulted in the volume estimates which agreed with the true value within errors <5%, when the number of grids hitting the structure was >20 points in a slice. The normal animal study demonstrated the CSF volume 3.6±1.2 μL in lateral ventricle (LV). This variation was attributed to the individual differences rather than the statistical errors. The TG mouse showed CSF volume of 24.6±1.2 μL in LV, in which the variation was beyond the range of statistical variation of RS.
Conclusions: RS provides un-biased, expert knowledge-based assessment of volumetry in PET/MRI images. The practical procedures are minimal, and thus can be applied to a number of pathophysiological studies.
References
1.
ThomallaG. Outcome and symptomatic bleeding complications of intravenous thrombolysis within 6 h in MRI-selected stroke patients comparison of a German multicenter study with the pooled data of ATLANTIS, ECASS, and NINDS tPA trials. Stroke2006;37:852–8.
2.
McAteerMASibsonNRVon Zur MuhlenCSchneiderJELoweASWarrickNChannonKMAnthonyDCChoudhuryRP. In vivo magnetic resonance imaging of acute brain inflammation using microparticles of iron oxide. Nature Medicine2007;13:1253–8.
3.
Servos. Neuroreport1998;9(4):605–9.
4.
Krubitzer and Kass. J Neurosci.1990;10(3):952–74.
5.
Deichmann. Neuroimage2000;12(1):112–27.
6.
ChoiJKChenYIHamelEJenkinsBG. Brain hemodynamic changes mediated by dopamine receptors: Role of the cerebral microvasculature in dopamine-mediated neurovascular coupling. Neuroimage2006;30:700–12.
7.
ShihYYIChenCCVShyuBCLinZJChiangYCJawFSChenYY and ChangC. Journal of neuroscience, 2009 (accepted).
8.
SantoshC. J Cereb Blood Flow and Metab2008;28(10):1742–53.
9.
SokoloffL. J Neurochem1977;28:897–916.
10.
KanamoriK. NMR Biomed1993;6:21.
11.
MlynarikV. J Magn Reson2008;194:163.
12.
ChoiIY. Magn Reson Med2000;44:387.
13.
GruetterR. Magn Reson Med1991;20:327.
14.
KanamoriK. Biochem J1993;293:461.
15.
SibsonNR. Proc Natl Acad Sci1997;94:2699.
16.
SunFT. Neuroimage2004;21(2):647–58.
17.
EwingJR. Magn Res Med2003;50:283–92.
18.
WuC. Computer Methods and Programs in Biomedicine2005;78:75–86.
19.
YuMCDunnOJ. Educ Psychol Measur1982;42:987–1004.
20.
UlrichH. Statistical software2006;15:1–11.
21.
O'NeillRDLowryJP. Voltammetry in vivo for chemical analysis of the living brain. In Encyclopedia of Analytical Chemistry2000, pp 676–709.
22.
Weber. Neuroimage2006;29(4):1303:10.
23.
Weisskoff. Magn Res Med1993;29:553–8.
24.
Tomita. J Cereb Blood Flow Metab2002;22:663–9.
25.
Hyder. NMR Biomed2001;14:413–431.
26.
Kida. J Cereb Blood Flow Metab2000;20:847–60.
27.
Ogawa. Magn Reson Med1993;29:205–210.
28.
Kennan. Magn Reson Med1994;31:9–21.
29.
Boynton. J Neurosci1996;16:4207–4221.
30.
Hoge and Pike. J Chem Neuroanat2001;22:43–52.
31.
Smith. Proc Natl Acad Sci USA2002;99: 10765–770.
32.
Ogawa. Magn Reson Med1993;29:205–10.
33.
Kennan. Magn Reson Med1994;31:9–21.
34.
Sanganahalli. NMR Biomed2008;21:410–16.
35.
Boynton. J Neurosci1996;16:4207–21.
36.
Hoge and Pike. J Chem Neuroanat2001;22:43–52.
37.
Smith. Proc Natl Acad Sci USA2002;99:10765–770.
38.
Herman. JCBFM2009;29:19–24.
39.
CramerSC. Stroke2004;35:2695–8.
40.
DijkhuizenRM. J Neurosci2003;23:510–7.
41.
AustinVC. MRM2003;49:838–47.
42.
EwingJRBrownSLNagarajaTN. MRI measurement of change in vascular parameters in the 9L rat cerebral tumor after dexamethasone administration. J Magn Reson Imag2008;27(6):1430–8.