
Abstract
Introduction
The importance of providing wet bulb globe temperature (WBGT) heat stress flag category measurements in real time is well recognized by road race directors, and it is bound to become even more important with the rise of extreme weather and pandemic outbreaks. The purpose of this paper is to describe the WBGT index and its components measured during the 125th running of the Boston Marathon on October 11, 2021, for qualitative comparison to measurements made similarly on its traditional April date, 2014 to 2019.
Methods
Monitoring occurred at the 7 km, 18 km, and 32 km marks of the race in the towns of Ashland, Natick-Wellesley, and Newton. The outdoor WBGT index was calculated from direct hourly measurements of the dry bulb, black globe, and natural wet bulb temperatures from 0900 to 1500 h.
Results
The WBGT index was not different among towns; thus, the average hourly values for the 3 towns were compared to historical data averaged identically. Although the black globe temperature fluctuated considerably in response to changing cloud cover, on average, partly cloudy skies kept the solar load comparable to what has been observed in April. Dry bulb and wet bulb temperatures were higher than those on most April dates shown, which resulted in a yellow (or amber) flag day for most of the race.
Conclusions
The historic October Boston Marathon was among the warmest in recent history. Like the impact of COVID-19 on the 2021 Boston Marathon, future climate challenges around outdoor activities could necessitate rescheduling; they underscore the importance of real-time WBGT index measures.
Introduction
For more than 100 y, the world’s oldest annual marathon has been run on Patriot’s Day in the month of April. Only twice in Boston Marathon history has the race been modified or canceled, once in 1918 during World War I and once in 2020 during the COVID-19 pandemic, the latter of which closed much of the world for a year. Mutations of the COVID-19 strain have continued to challenge public health and delay the safe conduct of road races the world over. In April of 2021, the Boston Athletic Association made the decision to postpone the race to a later date and acknowledged the looming possibility of a sequential race cancellation due to COVID-19. Herculean efforts to control the pandemic resulted in an opportunity to modify the 2021 race and allow its safe conduct in the month of October.
Extreme weather events were an added global challenge during the COVID-19 pandemic in 2021 1 as well as a looming concern around the unpredictable April weather in New England. Unpredictable spring weather has historically been the motivation behind research efforts aimed at understanding the challenges of the Boston Marathon to runner health and performance. 2 -5 Environmental guidelines for safe sports participation using the wet bulb globe temperature (WBGT) index are well recognized, especially for distance running, 6 but guidelines cannot be applied universally among all sports, and there is a lack of consistent use and best practices for the WBGT.7,8 For this reason, the past 6 y have included research at Boston to develop a 72-h WBGT forecast capability and race-day measurements of the WBGT from 3 locations on the course. 3 Heat stress flag categories 6 are reported hourly to the Boston Athletic Association and Massachusetts Emergency Management Agency. Wet bulb globe temperature forecasting and real-time on-the-course monitoring allow race organizers and medical directors to anticipate staffing needs and allocate resources based on the risks of environmental illness among other health hazard assessments. 4
The WBGT index is a composite measurement that combines the weighted influence of air temperature (10%; dry bulb), solar heat load (20%; black globe), and air water vapor pressure (70%; natural wet bulb) on the risk of exertional environmental illnesses. Please see the study by Cheuvront and Hosokawa 6 for a complete review of using the index in road race medicine. The importance of providing WBGT heat stress flag category measurements in real time for the modified October race date relates to the possibility of volatile swings in weather, such as those experienced occasionally by autumn marathons in Chicago and New York. For 2021, real-time WBGT monitoring is even more important for decision making given that COVID-19 reduced the capacity of local hospitals for receiving patients with potential serious exertional heat or cold illnesses.
The purpose of this article is to describe the WBGT index and its components measured during the 125th running of the Boston Marathon on October 11, 2021, for comparison to measurements made similarly on its traditional April date in 2014-19.
Methods
The instruments, methods, and locations used for WBGT monitoring during the 2021 Boston Marathon were nearly identical to those published previously. 3 Briefly, 3 Kestrel 5400 devices (Nielsen-Kellerman, Boothwyn, PA) were positioned on tripods 1.22 m from the ground near the 7 km, 18 km, and 32 km marks of the race in the towns of Ashland, Natick-Wellesley, and Newton. The outdoor WBGT index was calculated from direct hourly measurements of the dry bulb, black globe, and natural wet bulb temperatures. 5 Data were collected from 0900 to 1500 h. Kestrel devices could not be calibrated using environmental chambers, as reported previously. 3 However, factory calibration was checked by directly comparing the 3 devices every 30 min for 3 h with direct outdoor blacktop exposure on October 2, 2021, in accordance with ecologically valid outdoor checks of device agreement described previously. 3 Two 30-min pairs of recordings for each device (6 pairs in all) were made for the WBGT and each of its 3 components (48 data points in all) and plotted simultaneously to produce a valid range for correlation analysis.
Results
The concordance correlation coefficient for Kestrel agreement on WBGT and its 3 components was 0.99 (Figure 1), indicating very strong agreement and providing assurance of measurement accuracy on the day of the race. Figure 2 plots the WBGT differences among the 3 towns and course locations every hour. Differences falling within the gray band were considered marginal 3 and suggest largely uniform heat stress between 7 and 30 km on the course. Figure 3 shows plots of the dry bulb temperature (Figure 3A), black globe temperature (Figure 3B), natural wet bulb temperature (Figure 3C), and WBGT index abutted by heat stress flag color categories (Figure 3D) at 0900, 1200, and 1500 h on the course in Ashland, Natick-Wellesley, and Newton. Because WBGT was not different among towns, the average hourly values for the 3 towns were plotted as 1 value each at 0900, 1200, and 1500 h for comparison to those in past years (Figure 3A–D). The thin lines represent measurements made between 2014 and 2019 on Patriot’s Day, also averaged from 3 locations, and the dashed line represents the average measurements made during the race on October 11, 2021. Although the black globe temperature fluctuated considerably in response to changing cloud cover (data not shown), on average, partly cloudy skies kept the solar load comparable to what has been observed in April (Figure 3B). Dry bulb (Figure 3A) and wet bulb (Figure 3C) temperatures were higher than those on most April dates shown, which resulted in a yellow (or amber) flag day for most of the race (Figure 3D).
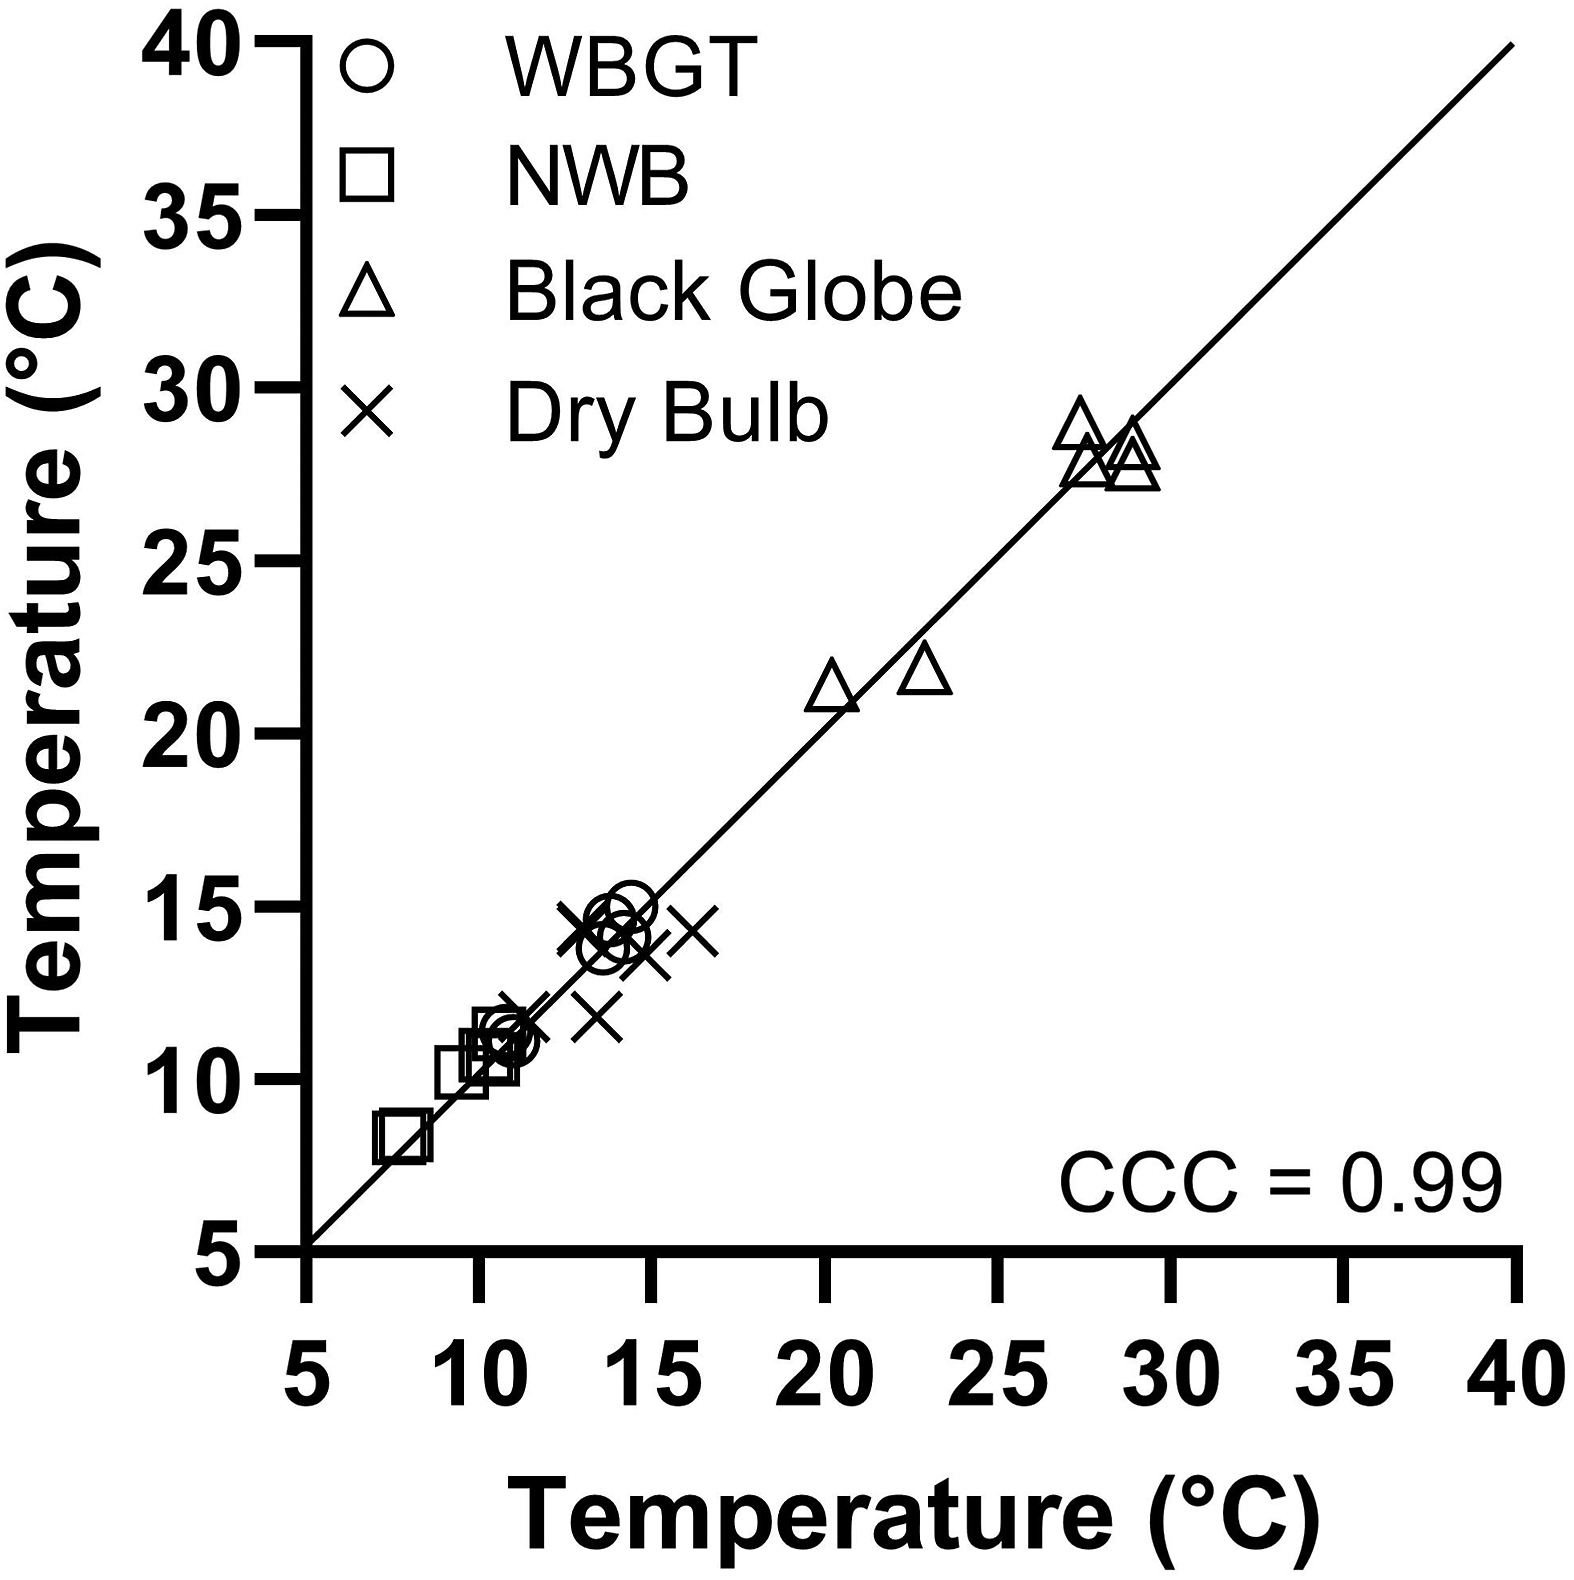
Reproducibility among Kestrel devices during instrument validation in Franklin, MA (October 2, 2021). Data represent 16 distinct measurement observations (4 measurements per environmental parameter) for each of the 3 devices (n=48 in all). Please see Methods. CCC = concordance correlation coefficient; NWB, natural wet bulb; WBGT, wet bulb globe temperature.
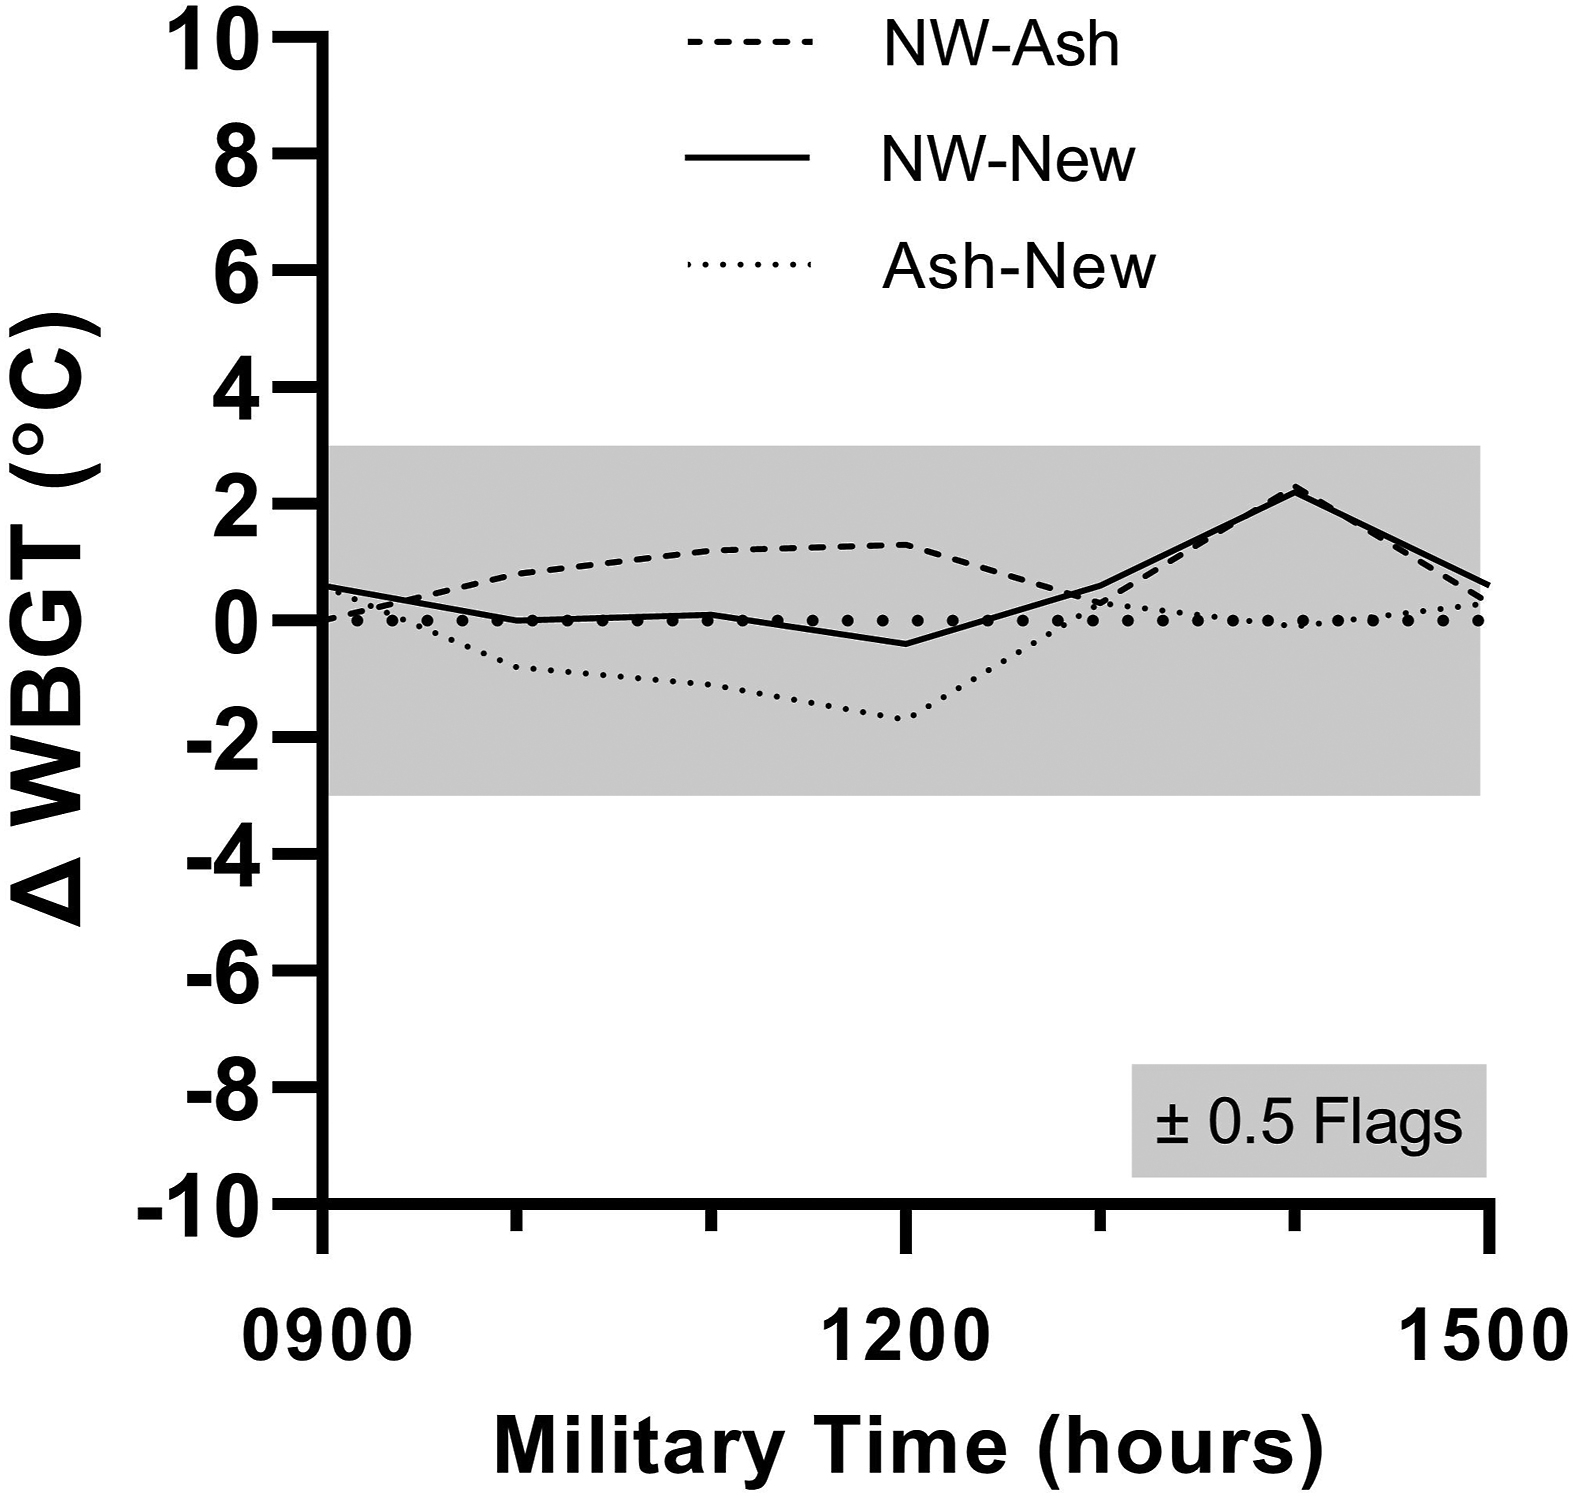
Differences in the wet bulb globe temperature (WBGT) index among course locations in Ashland (Ash), Natick-Wellesley (NW), and Newton (New) every 60 min between 0900 and 1500 h during the Boston Marathon (October 11, 2021). Gray band indicates ±3°C WBGT or approximately half of 1 heat stress flag category. 3
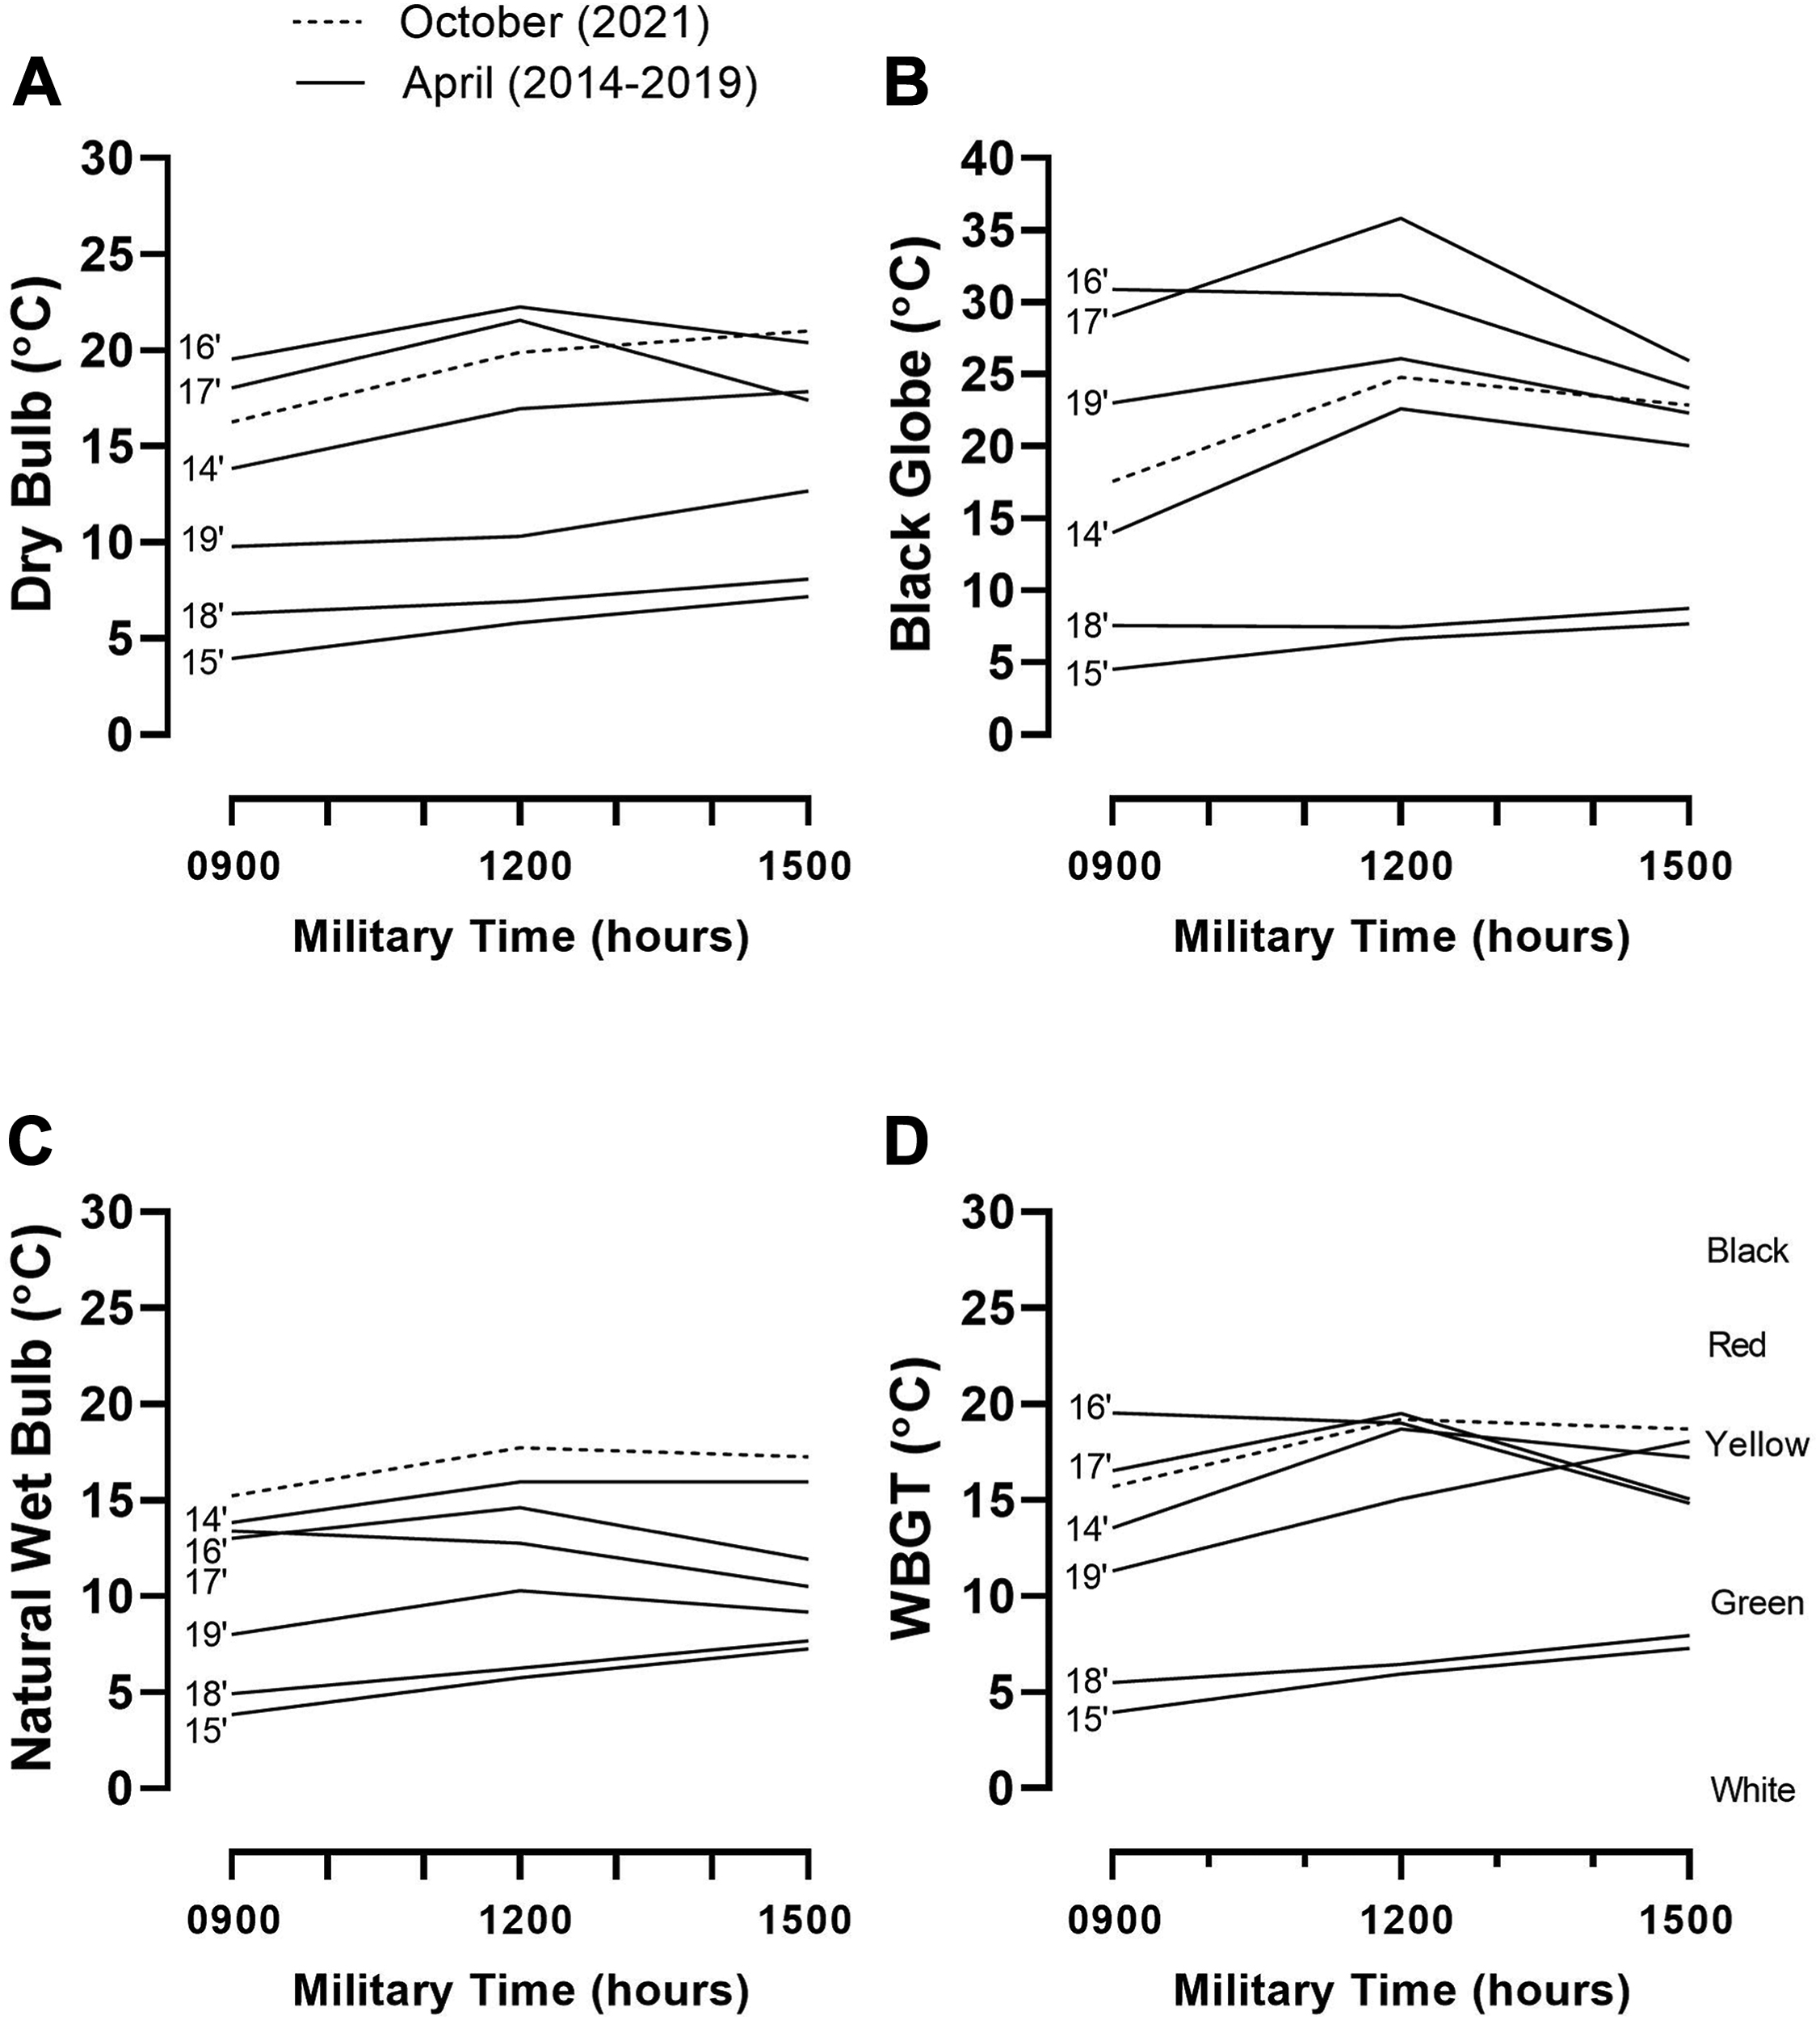
Plot of wet bulb globe temperature (WBGT) and its components at 0900, 1200, and 1500 h on October 11, 2021, for qualitative comparison to those at the same time points during the race run on Patriot’s Day in April, 2014-19.
Discussion
The prevailing conditions during the October 2021 Boston Marathon represented a yellow flag heat stress category. In a recent study evaluating more than 20 y of remote WBGT monitoring during the Boston Marathon, the occurrence of yellow flag conditions was unusual, representing only ∼5% of 147 hourly observations. 5 Yellow flag or higher conditions were present during the race in 2004, 2012, 2017, and 2019. The historic October Boston Marathon was therefore among the warmest in recent history (1995 to present), a fact consistent with the observations of slower winning times and modest levels of exertional heat illness.4,6 The wet bulb temperature was higher in 2021 than in races held in April between 2014 and 2019 (Figure 3C), but the air water vapor pressure remained well below 20 mm Hg throughout the race, affording large evaporation gradients between skin and air to keep runner heat strain in check.5,6 The delicate balance between runner heat production and heat loss is well known and is the fundamental reason why most marathons are run strategically in seasons when extreme high and low temperatures are uncommon. However, unseasonal conditions do occasionally occur to create havoc and are becoming more common.7,9
Climate change interacts with and exacerbates global health threats such as COVID-19 while increasing the frequency and severity of extreme weather events, such as heat waves.1,9 Boston is specifically near the top of the list of US cities with respect to increasing heat wave intensity. 9 With a field of approximately 30,000 runners each year at Boston, warming trends that increase the risk of serious heat illnesses even modestly can become a disproportionate drain on race medical resources. 4 At Boston, every exertional heat stroke case is attended by 4 to 6 medical staff per ice immersion tub, and 4 tubs per 10,000 runners is recommended; double this number is anticipated for larger events. 4 Valid local forecasting and real-time WBGT measurement efforts, such as those at Boston, 3 represent one significant step in the direction of developing more comprehensive extreme heat policies for sports and exercise in general 8 and road running in particular.
High-quality protection for athletes and easy to understand and implement policies will become more important as the world confronts the many facets of climate change. 1 As unprecedented as the 2020 Boston Marathon cancellation and 2021 rescheduling was, climate change has led to speculation that by 2085, few major cities may be able to safely host and conduct the summer Olympic games. 10 Like the impact of COVID-19 on the conduct of the 2021 Boston Marathon, future climate challenges around outdoor activities will only compound other world crises 1 and may necessitate drastic changes to other time-honored sporting traditions. 10
Footnotes
Acknowledgments
The authors thank the Boston Athletic Association for their interest in our research and for providing course access.
Author Contributions: study design and concept (SNC, RWK, PTB, CT); data acquisition (SNC, RWK, PTB); data analysis (SNC); drafting of the manuscript (SNC, RWK, PTB, CT); approval of the final manuscript (SNC, RWK, PTB, CT).
Financial/Material Support: Two Kestrel 5400 devices were donated by Kestrel Instruments to Sports Science Synergy, LLC.
Disclosures: RWK is an associate editor at Wilderness & Environmental Medicine but was not involved in the editorial or peer-review processing of this submission. The authors have no other conflicts of interest to report.