
Abstract
Introduction
Mean daily temperatures in Canada rose 1.7°C between 1948 and 2016, and the frequency, severity, and duration of extreme heat events has increased. These events can exacerbate underlying health conditions, bringing patients to emergency departments (EDs). This retrospective analysis assessed the impact of temperature and humidex on ED volume and length of stay (LOS).
Methods
LOS is an indicator of ED overcrowding and system performance. Using daily maximum temperatures and humidex values, this study investigated the impact of mean 3-d temperatures and humidex preceding ED presentation on the median and maximum ED LOS and patient volume in 2 community hospitals in Montreal, Quebec, during the summer months of 2016 to 2018. Data were analyzed with 1-way analysis of variance with post hoc Fisher least significant difference tests and Spearman correlation tests.
Results
The mean maximum temperature and humidex were 26.1°C and 30.4°C, respectively (n=276 d). Mean 3-d temperatures ≥30°C were associated with higher daily ED volumes in both hospitals (138 vs 121, P=0.002 and 132 vs 125, P=0.03) and with increased median LOS at 1 hospital (8.9 vs 7.6 h, P=0.03). Mean 3-d humidex ≥35 was associated with higher daily ED volumes at both hospitals as well (136 vs 123, P=0.01 and 133 vs 125, P=0.009) with an increased median LOS at 1 hospital (8.6 vs 6.9 h, P=0.0001) with humidex values of 25 to 29.9°C.
Conclusions
Heat events were associated with increased ED presentations and LOS. This study suggests that a warming climate can impede emergency service provision by increasing the demand for and delaying timely care.
Introduction
The mean daily temperature in Canada increased 1.7°C from 1948 to 2016, and summer temperatures in Quebec rose 1.5°C during the same period. 1 This may be related to the growing frequency, duration, and intensity of extreme heat events in Canada, which are projected to increase in the coming years. 2 -4 There are numerous local and international examples of the impact extreme heat events can have on population health, including the 485 heat-related deaths during the 1995 Chicago heat wave, the 2003 European heat wave leading to an estimated 40,000 deaths, and heat events in Quebec linked to 106 deaths in 2010 and 66 deaths during the 2018 Montreal heat wave.5,6
Higher temperatures have been shown to exacerbate many health conditions.7,8 Patients taking certain medications (eg, diuretics, anticholinergics, beta blockers, and antipsychotics) that interfere with core body temperature regulation, increase heat production, or increase fluid loss are predisposed to heat-related morbidity and mortality.9,10 During heat events, patients with a wide variety of comorbidities, especially cardiovascular, pulmonary, renal, and psychiatric conditions, are more likely to seek medical care and be hospitalized. 11 -15 Extreme heat events also exacerbate the existing effects of social determinants of health, influencing individuals who have poor mobility, live alone, or experience unstable housing; these populations are particularly vulnerable to the health sequelae of extreme heat. 16 There is building local and international evidence that heat waves lead to excess death and increased burden on health care system capacity. 17 -19
There is significant impetus to reorient healthcare systems so that they can be climate-resilient and meet the expected increasing need for health services as our climate continues to warm and extreme heat events become more common. However, there are limited Canadian data exploring the effect of heat events on emergency department (ED) performance. Thus, the authors sought to determine the impact of heat events on ED volume and length of stay (LOS), a marker of quality of care, system capacity, and hospital performance, 20 in 2 community hospitals in Montreal, Quebec.
Methods
This was a retrospective cohort study comparing historical weather data measured at the Montreal/Pierre Elliot Trudeau International Airport weather station, Quebec and ED performance metrics from 2 community hospitals, Notre Dame Hospital (NDH) and Verdun Hospital (VH), in Montreal. These hospitals had 26 to 35 emergency department beds, served between 45,000 and 50,000 patients annually, and were supported by acute care surgery and critical care services. The hospitals were both 10 to 11 km from the weather station. Daily temperatures, humidex, LOS, and daily ED patient volume were collected for the summer months of June 21 to September 20 from 2016 to 2018. This date range was selected to minimize the potentially confounding influence of extreme cold weather events and the seasonal patterns of spread of influenza that can increase ED volumes. Owing to its retrospective nature and exploration of a deidentified dataset that cannot be linked to specific patients and providers, this study was granted an exemption from the CIUSSS du Centre-Sud-de-L’ile de Montreal research ethics and compliance institutional review board.
Using daily maximum temperatures and humidex values, the authors calculated the mean temperature and humidex from the 3 d before patients’ presentation to hospital. The authors sought to determine whether higher 3-d mean temperatures influenced volumes and median and maximum LOS of patients in both the ambulatory and stretcher ED sections of NDH and VH. Humidex is a measurement of how hot the air feels based on temperature combined with humidity. Heat is more harmful when the relative humidity is high because less sweat evaporates from the skin, hindering one of the body's ways of cooling itself. The authors included humidex values because they more accurately represent how uncomfortable a patient is feeling and the true physiologic effects of heat. The 3-d average of temperature and humidex was selected in accordance with previous studies demonstrating its validity in modeling heat wave intensity and predicting excess heat-related morbidity and mortality.21,22 The authors used 3 a priori identified mean 3-d temperature thresholds (25–27.4°C, 27.5–29.9°C, and ≥30°C) and 3 a priori identified mean 3-d humidex thresholds (25–29.9, 30–34.9, and ≥35). No days were represented twice within these thresholds.
Data were analyzed with 1-way analysis of variance for measures of ED performance (daily median and maximum LOS and ED patient volumes) with either mean 3-d temperatures or humidex preceding ED presentation as the factor. NDH and VH data were analyzed separately. Main effects identified by 1-way analysis of variance were further analyzed with post hoc means analyses with Fisher least significant difference tests of the a priori determined thresholds of mean temperatures and humidex preceding ED presentation. Spearman correlation testing was used to assess the effect of temperature and humidex on ED volumes and LOS in the stretcher and ambulatory sections of both hospitals. Statistical analyses were conducted in R-Studio (Boston, MA) and Prism 8.0 for Macintosh (GraphPad Software, Inc). All data are presented as mean±SD. Statistical significance was set at P<0.05.
Results
The mean daily maximum temperatures for the 2016, 2017, and 2018 summers (n=276 days) for the city of Montreal were 26.7°C, 24.2°C, and 27.3°C, respectively. The mean daily maximum humidex values were 30.9, 28.0, and 32.2. The days with mean 3-d temperatures and humidex values above the a priori thresholds are presented in Table 1.
Number of days with temperatures and humidex above a priori established thresholds
Mean 3-d temperatures ≥30°C were associated with higher daily ED volumes in both hospitals (138 vs 121, P=0.002 at NDH and 132 vs 125, P=0.03 at VH) (Figure 1). There was an increased median LOS at NDH with elevated mean 3-d temperatures between 27.5 and 29.9°C (8.3 vs 7.6 h, P=0.02) and ≥30°C (8.9 vs 7.6 h, P=0.03).
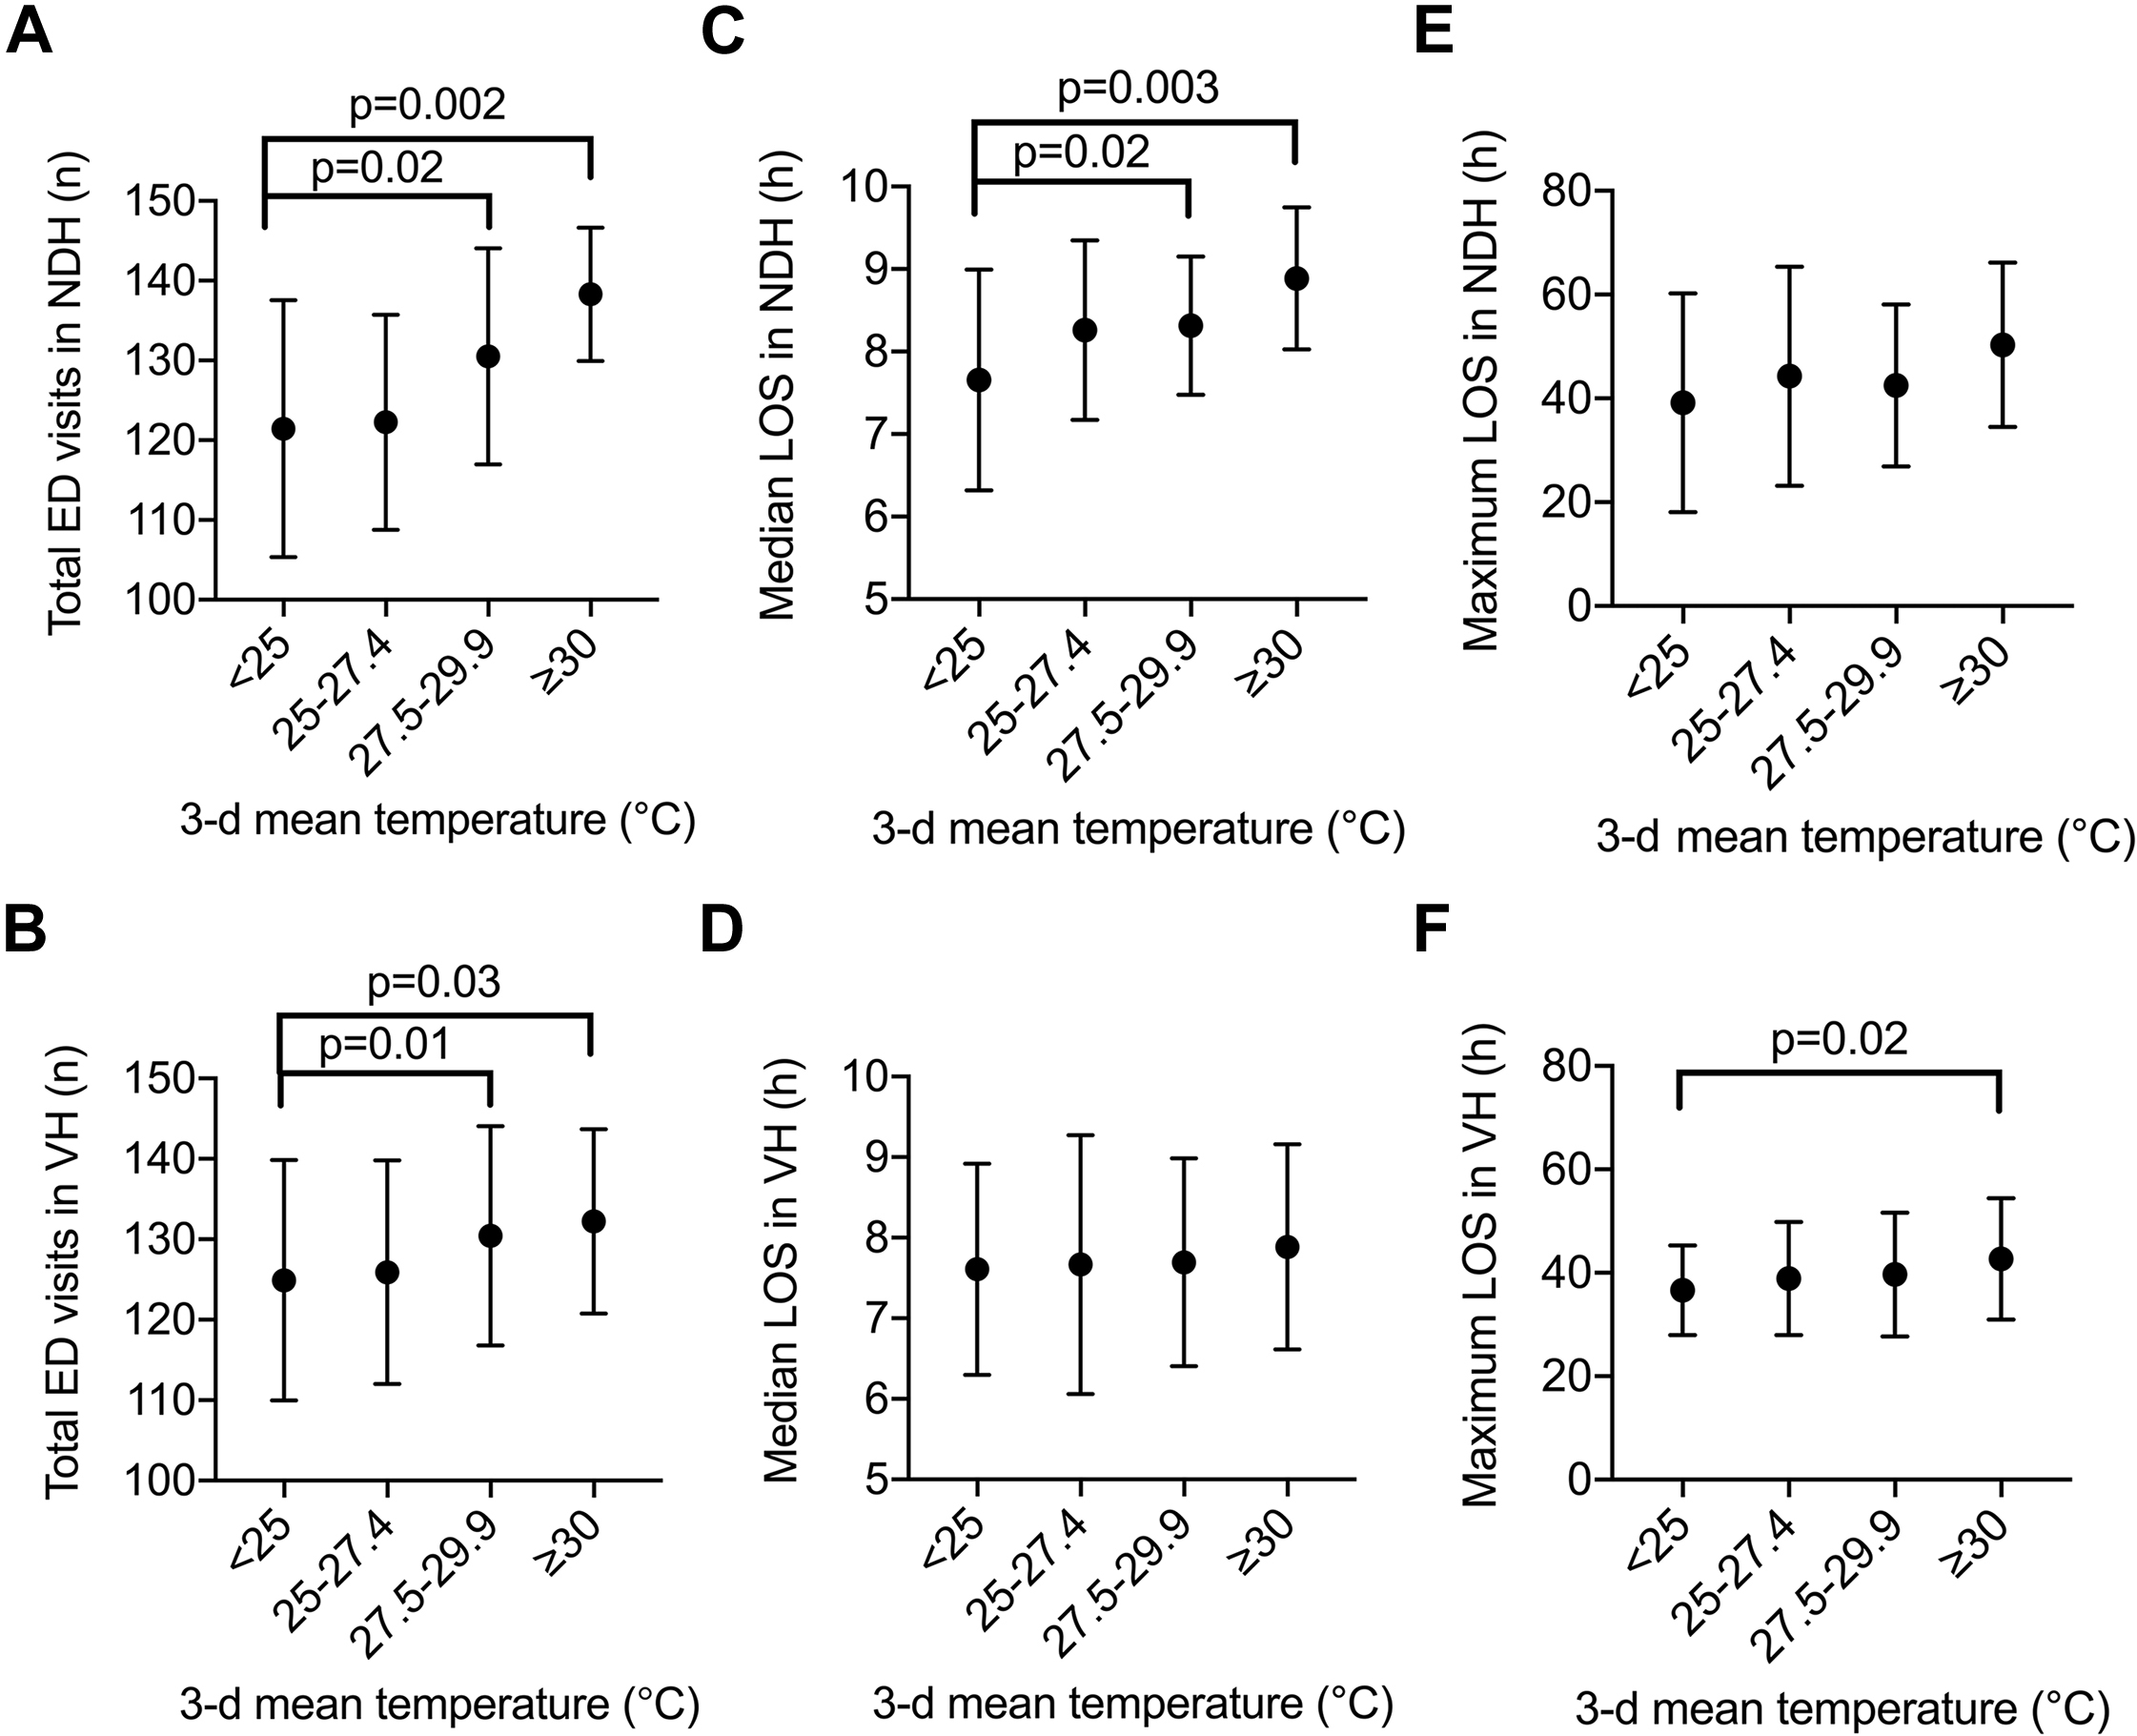
Increased 3-d mean temperatures before emergency department (ED) presentation increases ED volumes and extends ED length of stay (LOS). Daily maximum temperatures were averaged across the 3 d before ED presentation during the summer months of 2016 to 2018 (June 21 to September 20) and were grouped into 3 a priori thresholds (≥25°C, ≥27.5°C, and ≥30°C) to be compared to 3-d mean temperatures <25°C. No days were represented twice within these thresholds. The impact of 3-d mean temperatures was assessed on ED visits at (A) Notre Dame Hospital (NDH) and (B) Verdun Hospital (VH); median LOS at (C) NDH and (D) VH; and maximum LOS at (E) NDH and (F) VH. Data shown are mean±SD. Statistically significant differences are indicated with their respective P-values.
Mean 3-d humidex ≥35 was associated with higher daily ED volumes at both hospitals as well (136 vs 123, P=0.01 at NDH and 133 vs 125, P=0.009 at VH) (Figure 2). There was an increased median LOS at one hospital with an elevated mean 3-d humidex of 25 to 29.9 (8.6 vs 6.9 h, P=0.0001), 30 to 34.5 (8.3 vs 6.9 h, P=0.0001), and ≥35 (8.5 vs 6.9 h, P=0.0001). There was also an increased maximum LOS at one hospital with an elevated mean 3-d humidex of 25 to 29.9 (48 vs 31 h, P=0.03) and ≥35 (46 vs 31 h, P=0.02).
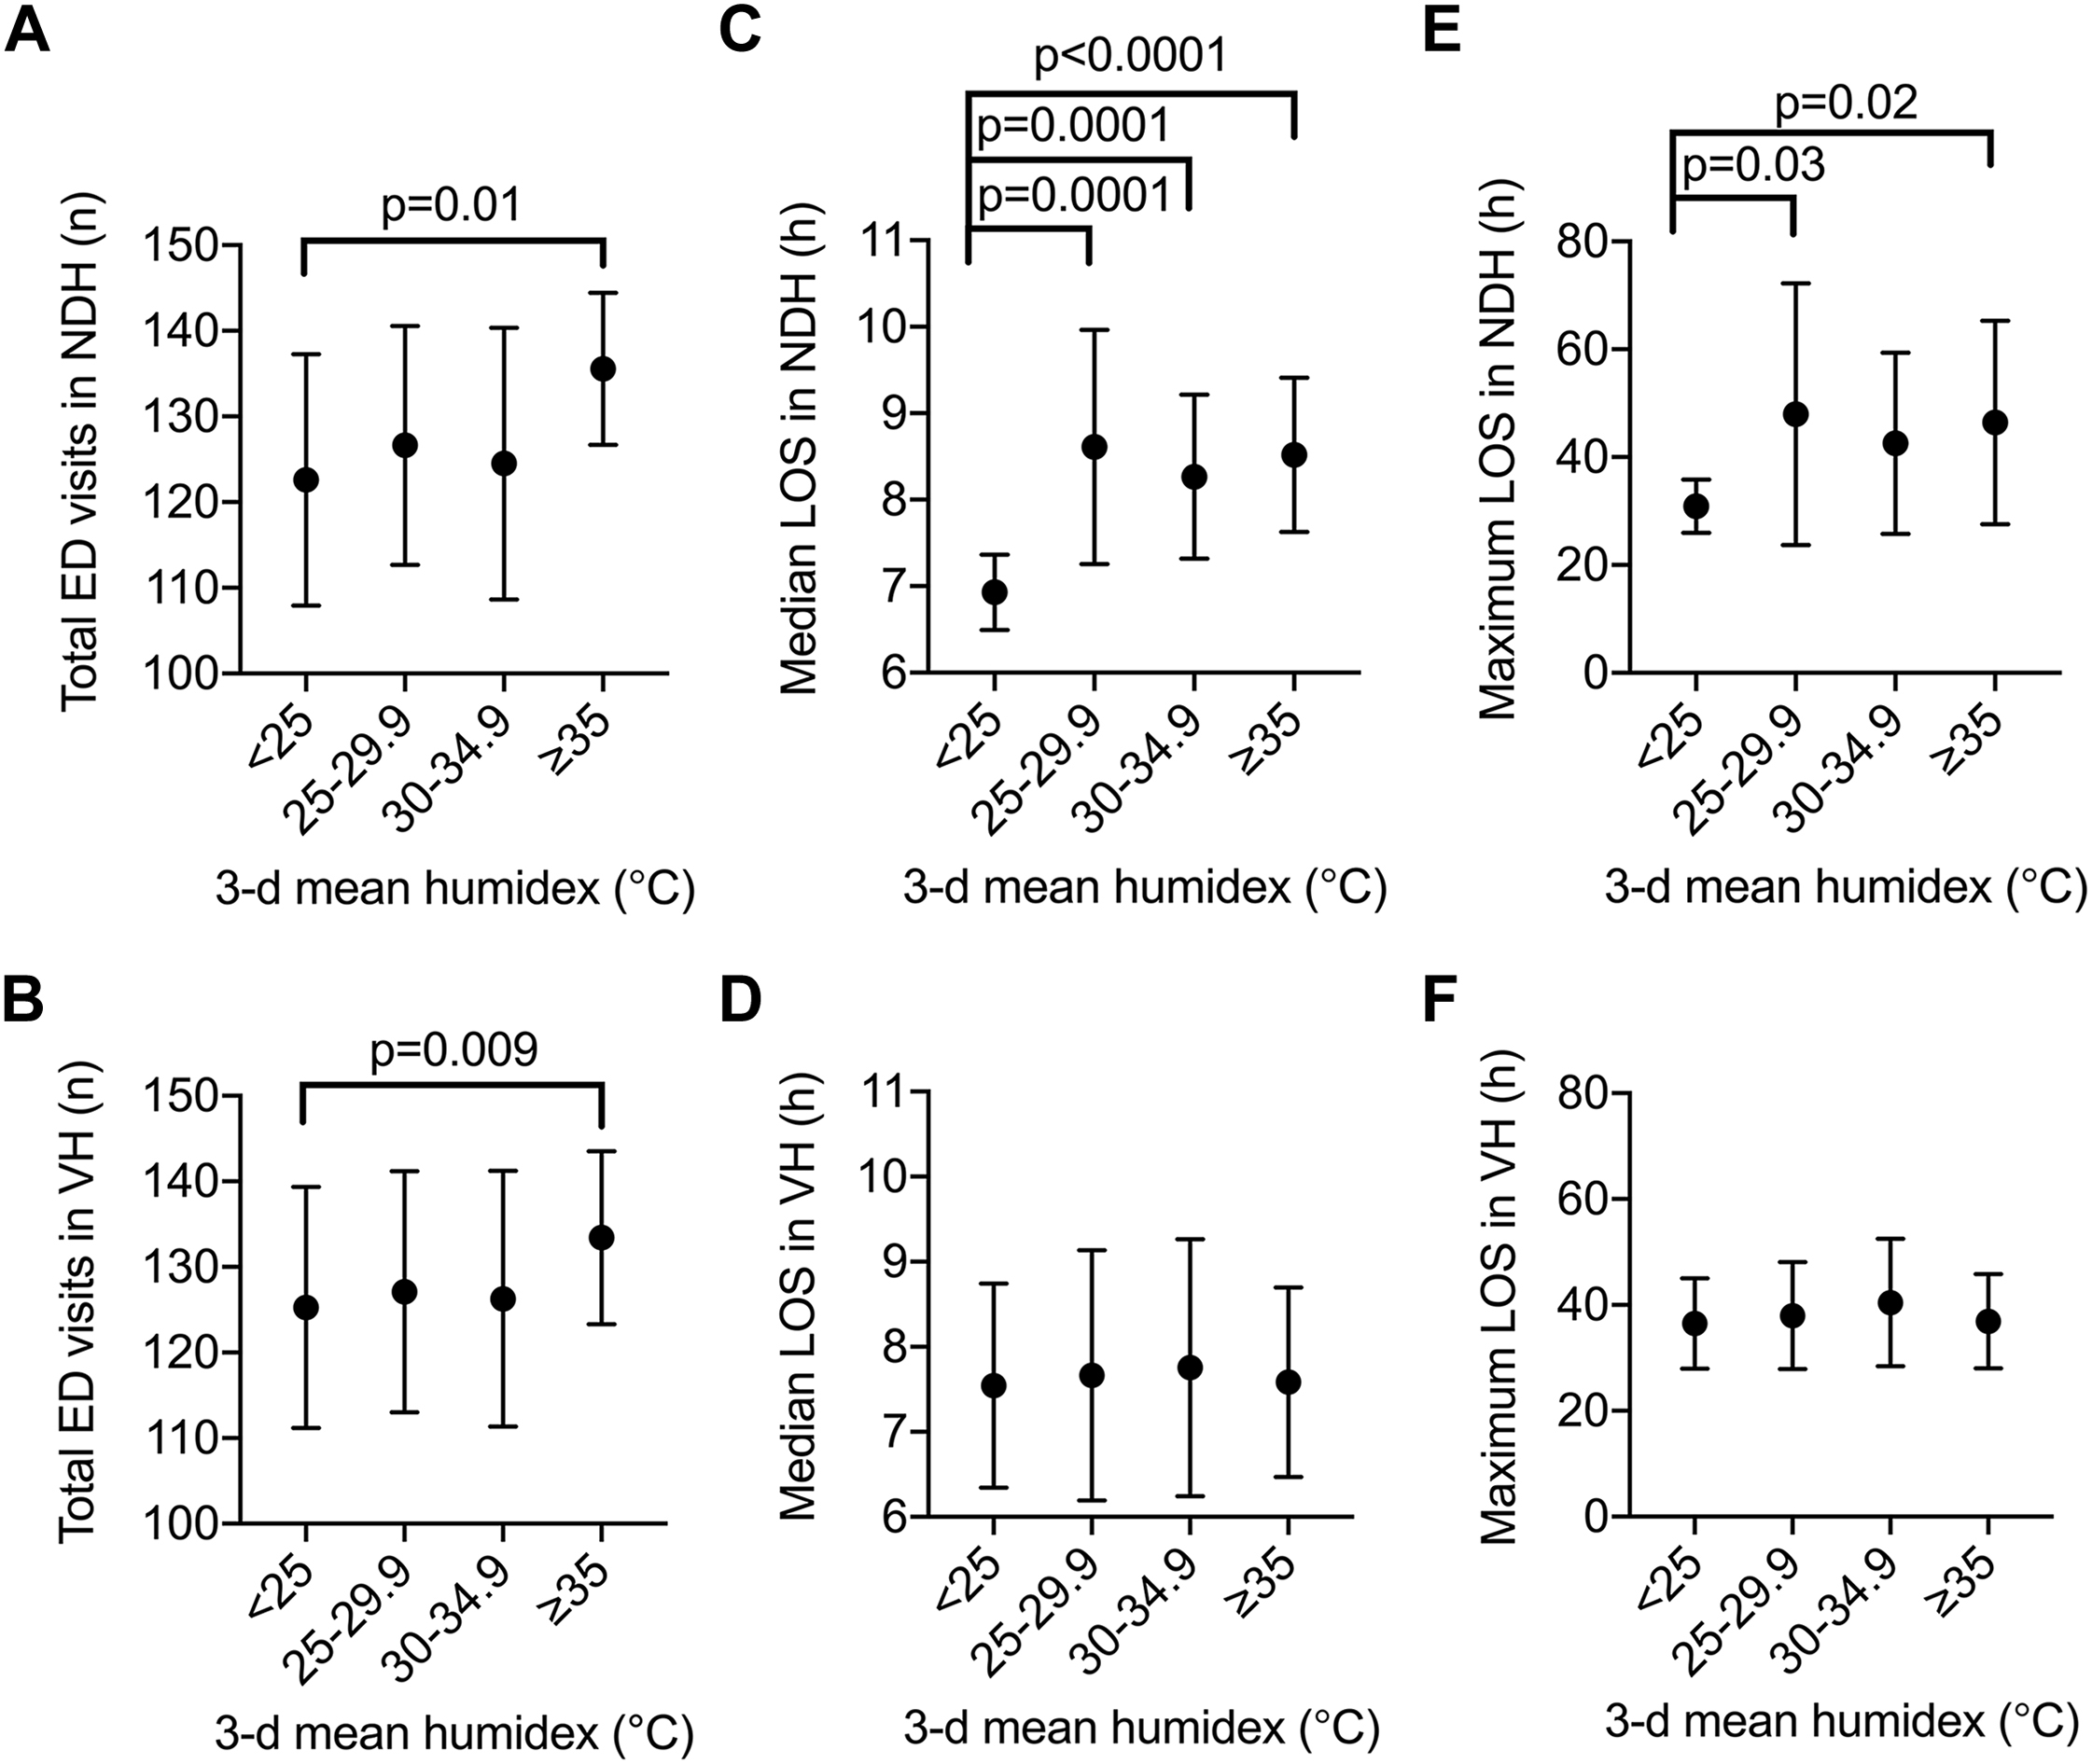
Increased 3-d mean humidex before emergency department (ED) presentation increases ED volumes and extends ED length of stay (LOS). Daily maximum humidex values were averaged across the 3 d before ED presentation during the summer months of 2016 to 2018 (June 21 to September 20) and were grouped into 3 a priori thresholds (≥25, ≥30, and ≥35) to be compared to 3-d mean humidex <25. No days were represented twice within these thresholds. The impact of 3-d mean humidex was assessed on ED visits at (A) Notre-Dame Hospital (NDH) and (B) Verdun Hospital (VH); median LOS at (C) NDH and (D) VH; and maximum LOS at (E) NDH and (F) VH. Data shown are mean±SD. Statistically significant differences are indicated with their respective P-values.
Higher mean 3-d temperatures were found to be positively associated with ambulatory ED visits at NDH (P=0.017) and stretcher ED visits at VH (P=0.00025) (Figure 3). There were positive associations between higher mean 3-d temperatures and median LOS in the NDH stretcher ED section (P=0.024), as well as maximum LOS in the NDH ambulatory ED section (P=0.042) and the VH stretcher ED section (P=0.024). Mean 3-d humidex showed similar significant positive associations with stretcher ED section visits at NDH (P=0.036) and VH (P<0.0001) but not with volumes at the ambulatory sections of both centers (Figure 4). Increased stretcher ED section median (P=0.0082) and maximum (P=0.048) LOS was found to be associated with increasing mean 3-d humidex at NDH but not at VH.
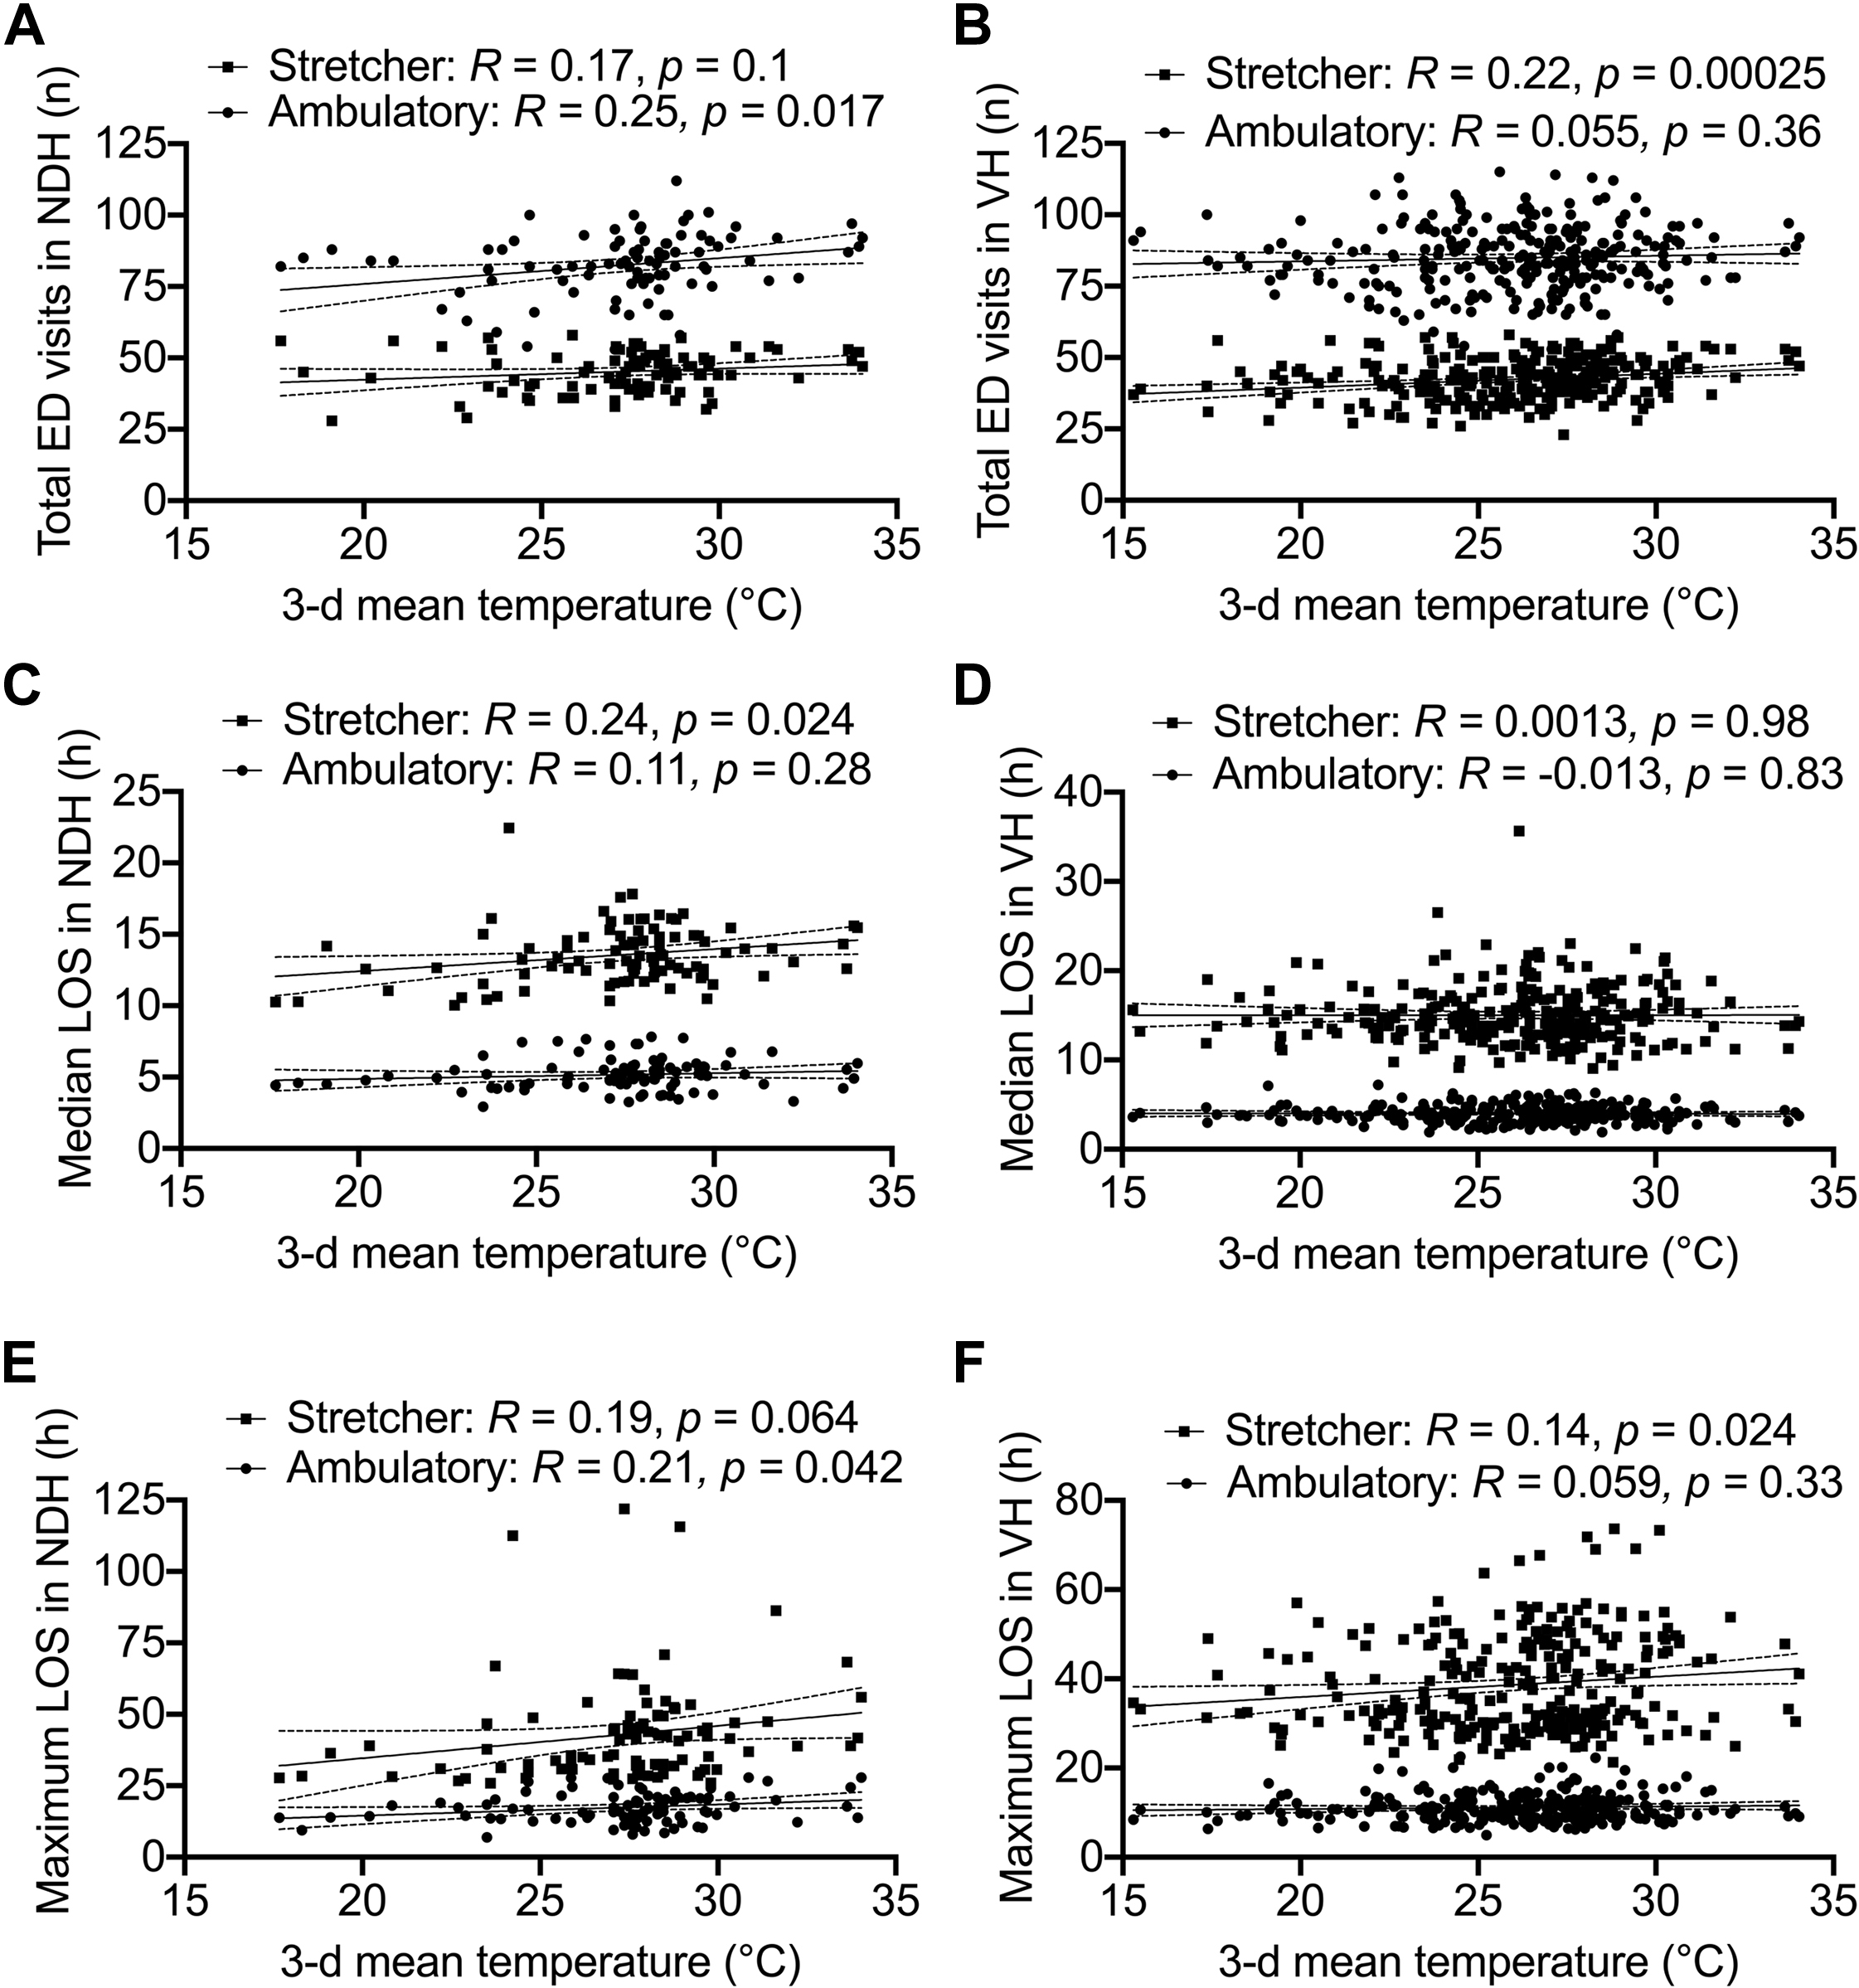
Increased 3-d mean temperatures before emergency department (ED) presentation are associated with differential volumes and length of stay (LOS) changes in the ED ambulatory and stretcher sections. Associations between 3-d mean temperatures and ED visits are shown for (A) Notre-Dame Hospital (NDH) and (B) Verdun Hospital (VH); median LOS for (C) NDH and (D) VH; and maximum LOS for (E) NDH and (F) VH. Spearman’s rank correlation analysis R values and P-values are shown.
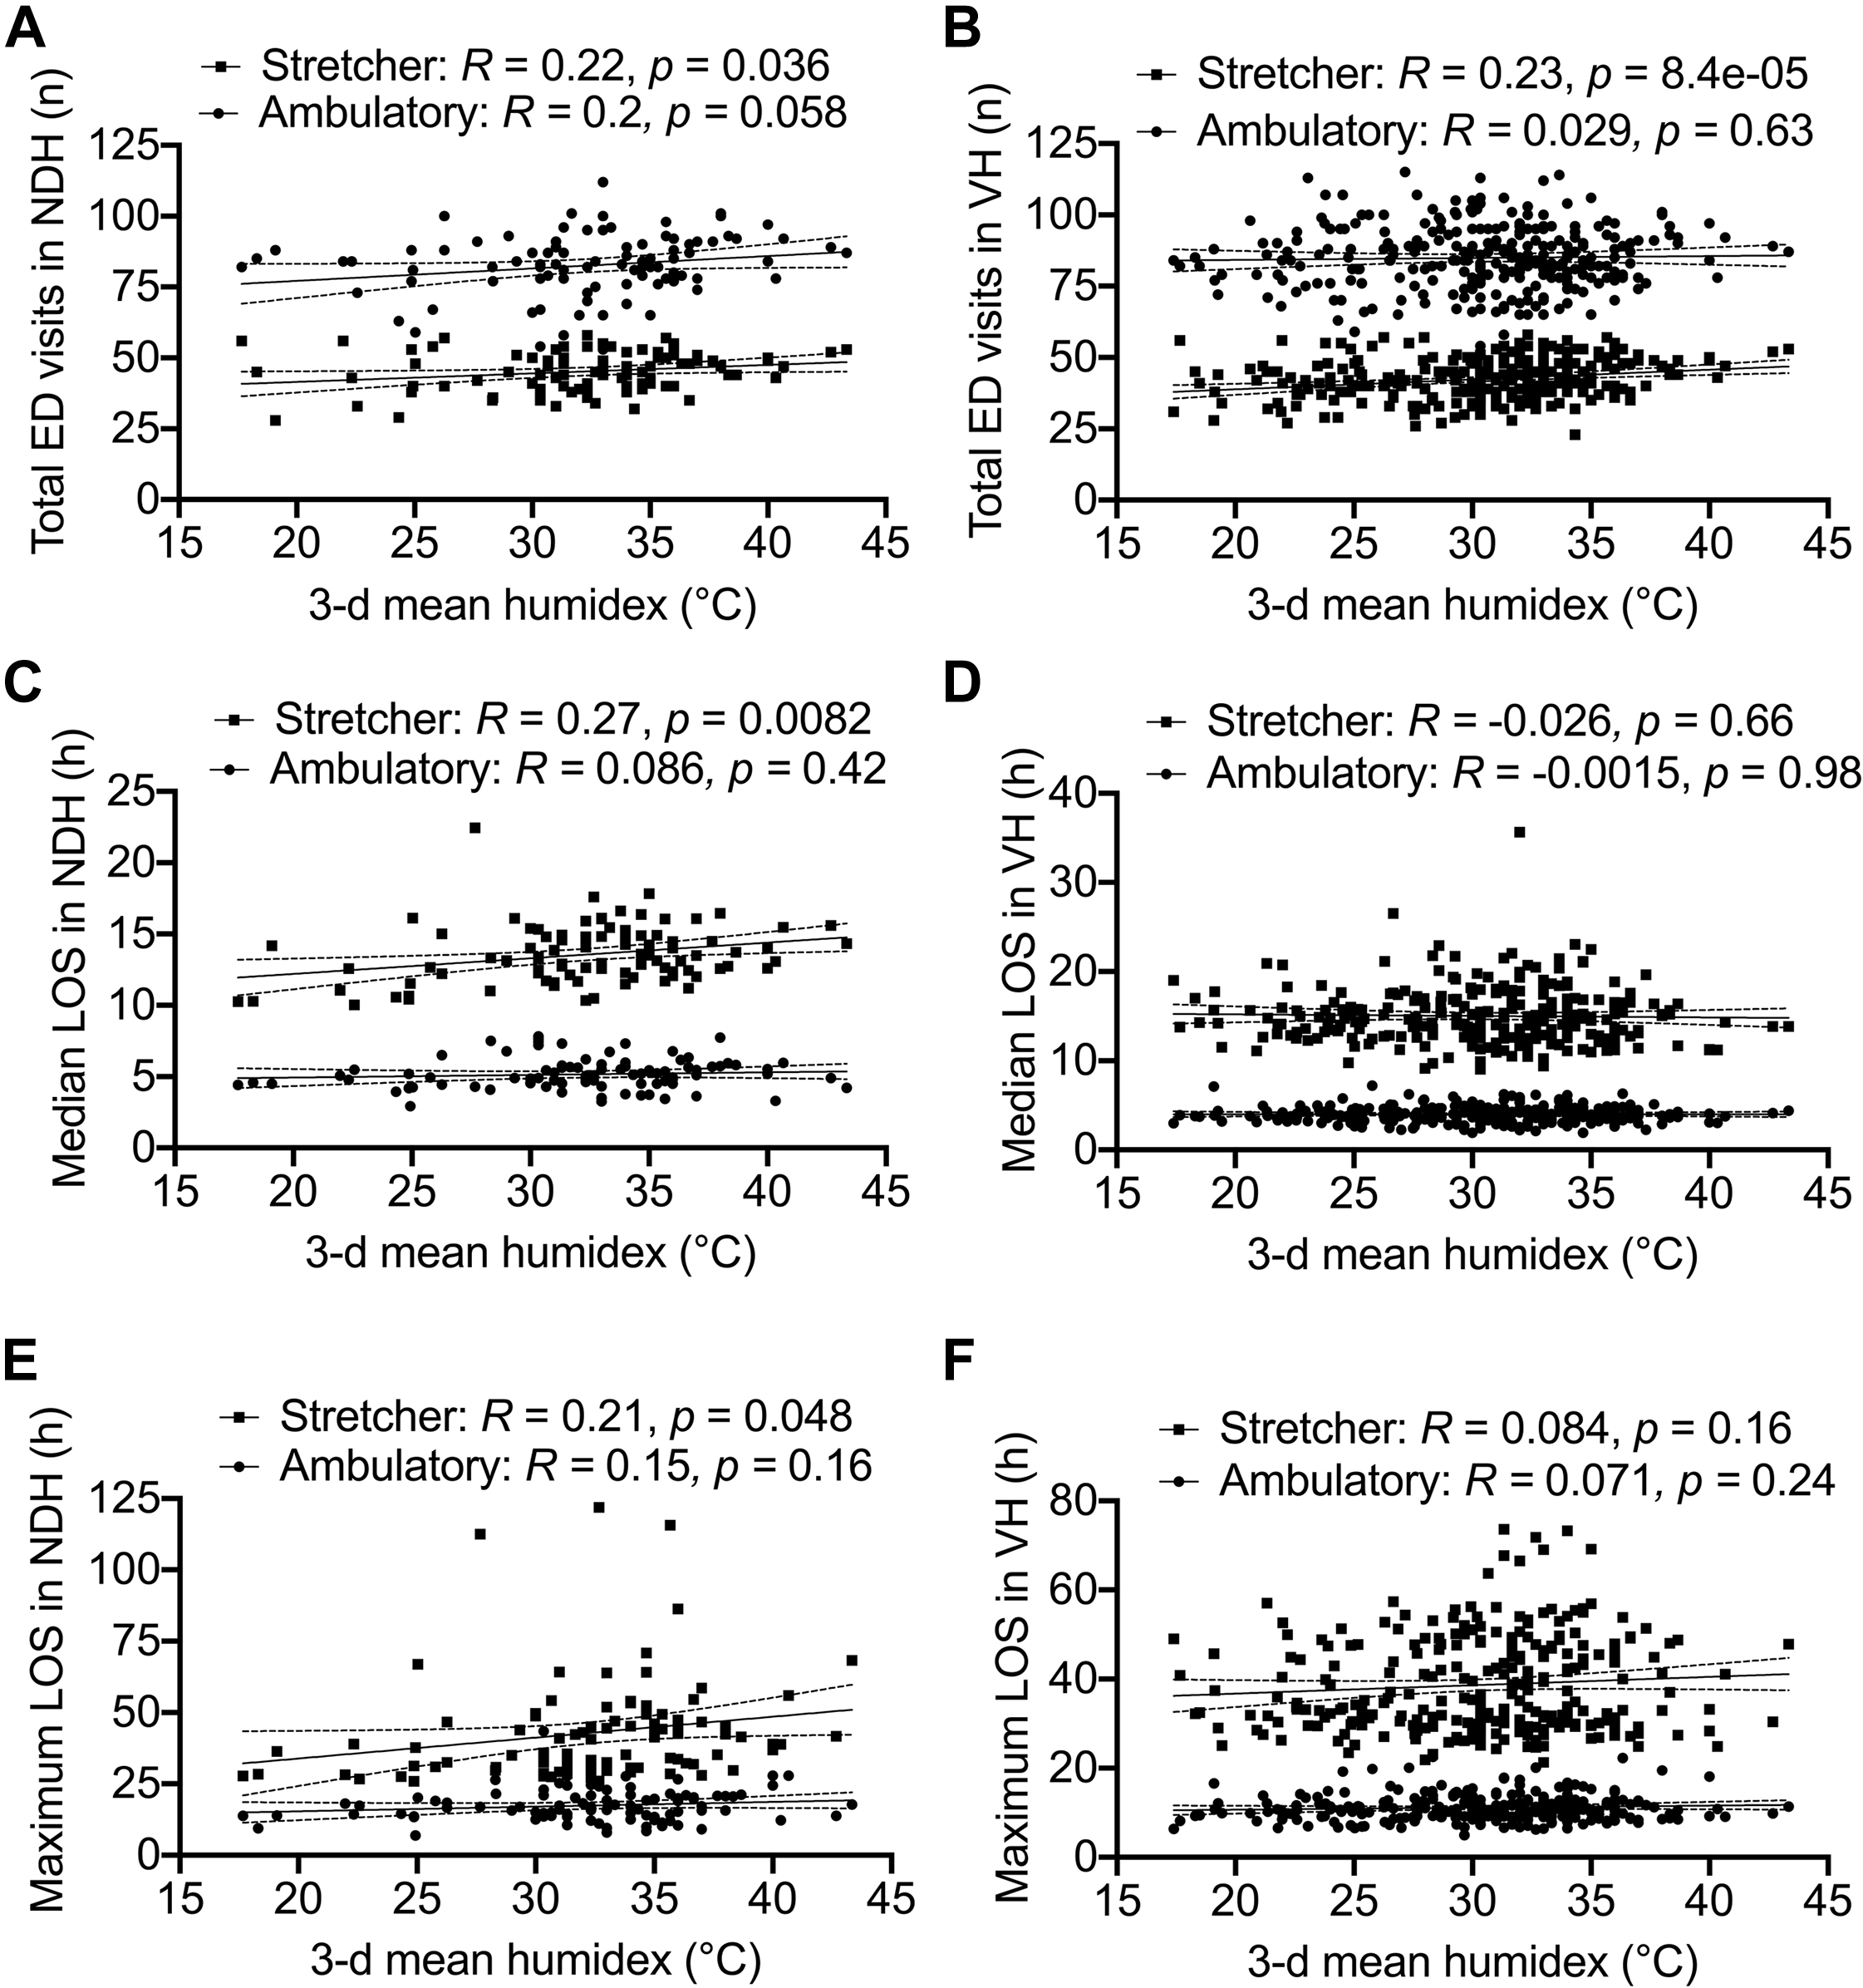
Increased 3-d mean humidex before emergency department (ED) presentation is associated with differential volumes and length of stay (LOS) changes in the ED ambulatory and stretcher sections. Associations between 3-d mean humidex and ED visits for (A) Notre-Dame Hospital (NDH) and (B)-Verdun Hospital (VH); median LOS for (C) NDH and (D) VH; and maximum LOS for (E) NDH and (F) VH. Spearman’s rank correlation analysis R values and P-values are shown.
Discussion
This study demonstrates that sustained summer heat events with 3 consecutive days of elevated temperatures and humidex leading up to patient presentation to the ED are associated with increased volumes and longer LOS. An escalating impact of mean 3-d temperature and humidex was identified, with mean 3-d temperatures and humidex at the highest thresholds of ≥30°C and ≥35, respectively, showing the most significant increases in ED volumes and LOS across both hospitals. However, impaired ED system performance was noted even when the mean 3-d temperature and humidex preceding ED presentation mildly rose to 27.5 to 29.9°C and 25 to 29.9, respectively. The increased patient volume during heat events may explain the observed increased ED LOS by contributing to an overall busier ED, hampering patient flow through the ED and delaying assessment of patient disposition. Spearman correlation testing provided additional evidence of the disproportionate impact of heat events on the 2 community hospitals; the mean 3-d temperature and humidex were found to be associated with a significantly greater number of measures of ED performance at NDH than at VH. In addition, differential temperature and humidex correlations were observed between the stretcher and ambulatory ED sections at NDH and VH, suggesting that differences in the communities the 2 hospitals serve may contribute to the apparent difference in acuity levels of health conditions exacerbated by heat events.
The associated increase in ED presentations with elevated mean 3-d temperatures and humidex at both centers aligns with a well-established finding in the literature that heat waves significantly increase ED arrivals in populations outside of Canada.19,23-25 Several factors have been shown to increase ED LOS. Patients with traumatic injuries, patients with higher acuity levels, patients requiring specialist consultation or hospital admission, longer laboratory turnaround time, and higher patient volume have all been shown to increase ED LOS. 26 -28 There are limited data on the impact of heat events on ED LOS, especially in Canada. One study demonstrated that prolonged ED LOS is associated with increased pediatric hospital presentations from April to September; however, this study did not demonstrate that specific heat events are associated with ED LOS. 29 Our findings provide local Canadian evidence that is concordant with US data indicating a positive relationship between the mean 3-d heat index and presentation volumes and LOS for patients in the adult and pediatric ED of the Johns Hopkins Hospital in Baltimore, Maryland. 30
This study’s correlation analyses suggested that heatwaves were particularly associated with increased higher-acuity ED presentations, as demonstrated by the observed associations between 3-d temperatures and humidex and increased LOS and presentations particularly in the stretcher sections of both hospitals. Previous health services research has established that longer ED LOS leads to poorer patient outcomes, especially in sicker patients. Delays of ≥4 h in critical care transfers after physiologic deterioration have been associated with a 3.5 times higher mortality rate. 31 Prolonged ED LOS is associated with increased adverse perioperative outcomes for otherwise healthy patients awaiting surgical procedures, as well as reduced thrombolysis and reduced functional status at discharge for patients with cerebrovascular accidents.32,33 ED LOS is independently associated with increased risk of hospital mortality in patients with sepsis requiring critical care admission. 34 In addition, each 1 h increase in ED LOS has been shown to be associated with a 44% increase in the odds of patients leaving without being assessed, which has been linked to complications and subsequent return to medical care.20,35 Further research would benefit from investigating the specific ED presentations and resulting diagnoses most affected by heatwaves.
Increased patient presentations to the ED and prolonged ED LOS due to extreme heat events increase the financial burden on the healthcare system. It is possible that the public health system in conjunction with emergency services can dynamically adapt to meet the needs of patients during periods of extreme heat. In addition to increasing clinical staffing and providing telemedicine support, interprofessional collaboration to provide community resources (eg, cooling stations and shelters) can aid in preventing return ED visits.30,36,37
Of particular interest, heat events affected ED performance metrics in the 2 hospitals in this study differently. The data suggest that even as both VH and NDH saw increased ED volumes in association with sustained heat events, the association between mean 3-d temperature and humidex and median LOS only reached significance at the stretcher section at NDH. A potential explanation for this finding is that the NDH serves a different community with different established risk factors for heat-related mortality, such as reduced access to home air conditioning, adequate ventilation, and shelter from extreme heat.38,39 From the 2016 Statistics Canada census, residents in the catchment area for NDH were reported to have a much lower median total household income compared to residents in the VH catchment area. Future research would benefit from exploring these factors that may be contributing to the differential vulnerability of various populations and could inform ED quality improvement projects to address climate change-related exacerbation of existing health inequities.
Limitations
This study should be interpreted in view of several limitations. Although these data are from 2 hospitals, both community hospitals were in the same Canadian city. These findings may not be generalizable to rural EDs. In addition, this study has the limitations inherent to a retrospective study. The associations we found between environmental variables of temperature and humidex and ED volumes and length of stay are correlative and do not examine the etiologies that led patients to present to the ED. One of the heat events in 2018 coincided with a statutory holiday during which system capacity was already reduced, potentially confounding the results. Finally, specific patient data including presenting complaint, admission to hospital, and consultation with a specialist were not available. These patient characteristics may have contributed to extended LOS in the ED.
Conclusions
This study found that elevated temperatures and humidex exerted an extra burden on ED system capacity by increasing the volume of patient presentations and increasing LOS in the ED in 2 community hospitals in Montreal. EDs are the safety nets of the healthcare system, and climate change threatens to further challenge the timely delivery of emergency healthcare services. Hospitals and EDs need to be climate-ready and resilient.
Footnotes
Acknowledgements
Author Contributions: Study concept and design (FK, SR); acquisition of the data (SR): analysis of the data (FK, ODL); drafting of manuscript (FK, ODL, SR); critical revision of the manuscript (FK, ODL, SR); approval of final manuscript (FK, ODL, SR).
Financial/Material Support: None.
Disclosures: None.