
Abstract
Introduction
There is no published information on the epidemiology of wilderness rescues in California outside of national parks. The objective of this study was to investigate the epidemiology of wilderness search and rescue (SAR) missions in California and identify risk factors for individuals requiring rescue due to accidental injury, illness, or navigation errors in the California wilderness.
Methods
A retrospective review of SAR missions in California from 2018 to 2020 was conducted. This was done from a database of information collected by the California Office of Emergency Services and the Mountain Rescue Association from SAR teams, who submitted voluntarily. The subject demographics, activity, location, and outcomes of each mission were analyzed.
Results
Eighty percent of the initial data were excluded because of incomplete or inaccurate data. Seven hundred forty-eight SAR missions involving 952 subjects were included in the study. The demographics, activities, and injuries of our population were consistent with those reported from other epidemiological SAR studies, and there were significant differences in outcomes based on the subject’s activity. For example, water activities were highly correlated with a fatal outcome.
Conclusions
The final data show interesting trends, but it is difficult to draw firm conclusions because so much of the initial data had to be excluded. A uniform system for reporting SAR missions in California may be helpful for further research, which may aid both SAR teams and the recreational public in understanding risk factors. A proposed SAR form for easy entry is included in the discussion section.
Introduction
California is the most populous state, the third largest by area, and one of the most commonly visited, with hundreds of millions of visitors per year.1,2 It is also one of the most geographically diverse states, featuring numerous types of wilderness environments, the highest point in the contiguous United States (Mt. Whitney), and the lowest point (Death Valley) in the entire United States. These diverse geographical features are often easily accessible from the urban areas of California, bringing recreational wilderness travelers from inside and outside the state.
The organization and co-ordination of search and rescue (SAR) activities in California are the responsibility of each county’s sheriff. There are 58 counties, so there are a minimum of 58 individual SAR teams throughout the state, although many counties have more than 1 team. For example, Los Angeles County has 7 SAR teams divided by geographic region, each operating semi-independently but all officially under the sheriff’s department. Other counties have teams divided by skill set, such as off-road teams, mountain rescue teams, dive teams, and the like. County SAR teams in California are generally made up of unpaid volunteers, whereas national parks typically have professional SAR teams consisting of both National Park Service (NPS) rangers and volunteers. It is difficult to obtain an accurate count of SAR teams in California because not all SAR teams are members of the Mountain Rescue Association (MRA) or another national organization. It is also difficult to obtain accurate information about SAR incidents in California. Although certain states, such as Oregon and Washington, require that each SAR team submit an after-action report to a state coordinator after each mission, 3 California has no such requirement at the state level, and reporting is voluntary. National Park Service SAR teams within California do record their incidents, but these are reported independently of and separately from the county SAR teams.
Previous studies have sought to define the epidemiology of SAR incidents in various national and state parks in multiple states, with varying results depending on the locale. 4 -7 Several studies have also examined SAR operations in specific national parks within California. 8 -10 No published studies to our knowledge have examined the epidemiology of SAR operations throughout the state of California as a whole, including areas outside of national parks. More information on this could potentially provide both SAR organizations and recreational wilderness visitors in California with preventive tools to avoid high-cost and high-risk rescue situations. Due to the significant geographical diversity of the state, the results may be able to be applied to a number of localities with varying environments and, therefore, extrapolated to other states or even nations. The objective of this study was to investigate the epidemiology of wilderness SAR missions in California and identify risk factors for individuals requiring rescue in the California wilderness, specifically recreational users involved in accidental incidents.
Methods
Data were obtained from a database of information about SAR missions in California from 2018 to 2020 collected jointly by the California Office of Emergency Services (Cal OES) and MRA. Search and rescue teams could voluntarily submit information to the Cal OES and MRA database via a secure online portal after each of their callouts. The submitted information included the date, number of volunteers, use of aircraft, subject demographics, activity, experience level, outcome, injuries, level of medical care provided, and co-ordinates. It is unclear why only certain teams decided to submit data and what percentage of their total incidents each team actually submitted. The identity of the SAR team submitting the information for each mission was also not included in the database. Official NPS SAR incident reports were not included in this database.
Inclusion and Exclusion Criteria
Our study intended to focus on intentional wilderness users who required SAR because of accidental injury, illness, or navigation error. Missions were first limited to incident types that matched these criteria. These incident types were as follows: avalanche, “car over” (presumed to refer to a car over a cliff or embankment, but the exact meaning is unclear), cave search/rescue, dive rescue/recovery, medical aid, mine SAR, recovery, rescue, search, and swiftwater rescue.
Missions were excluded if the type of incident or subject activity did not match this (eg, “evidence search” as the incident type and “suicidal ideations” as the activity were excluded). Missions were excluded if they were missing pertinent information to the study, such as any subject demographics, activity, or experience level.
Data Analysis
Of the remaining missions, each was individually reviewed for completeness and accuracy. If data were incomplete, such as missing types of injuries, an attempt was made to locate information about the particular mission on the SAR team’s website or in news sources. Using Google Earth and Google Maps (Google, Mountain View, CA), the co-ordinates of each mission were analyzed to identify the county, elevation, and approximate location of each mission. If missing information could not be located or the location was not in a wilderness area (eg, in the center of a city at a location where recreational wilderness activities would not normally be performed), the mission was excluded.
Microsoft Excel (Microsoft, Redmond, WA) and SPSS v27 were used to analyze the data. Descriptive statistics were used to characterize the subject demographics, activities, injuries, and counties. For group comparisons, activities with similar risks were combined into the following 4 larger categories to increase the sample size of each group: High-impact activities (biking, driving, 4-wheel driving, horseback riding, motorcycling, off-highway vehicle/all-terrain vehicle, snow skiing, snowboarding, and snowmobiling) Land-based activities (climbing, hiking, jogging/running, and mountaineering) Water-based activities (boating, canoeing/kayaking/rafting, fishing, and swimming) Miscellaneous activities (camping, gathering, hunting, mine exploration, other, photography, snow shoeing, and working)
Comparisons between these groups were performed using the generalized linear model with binomial distribution and pairwise comparisons or Pearson χ2 for cross-tabulation tables. Statistical significance was set at an alpha level of <0.05, with no adjustment for multiple comparisons. The Quinnipiac University institutional review board deemed this study exempt owing to the retrospective and deidentified nature of the data.
Results
There were initially 3847 missions in the dataset. Based on the exclusion criteria, 3099 missions were excluded, and the remaining 748 missions involving 952 subjects were analyzed (Figure 1).
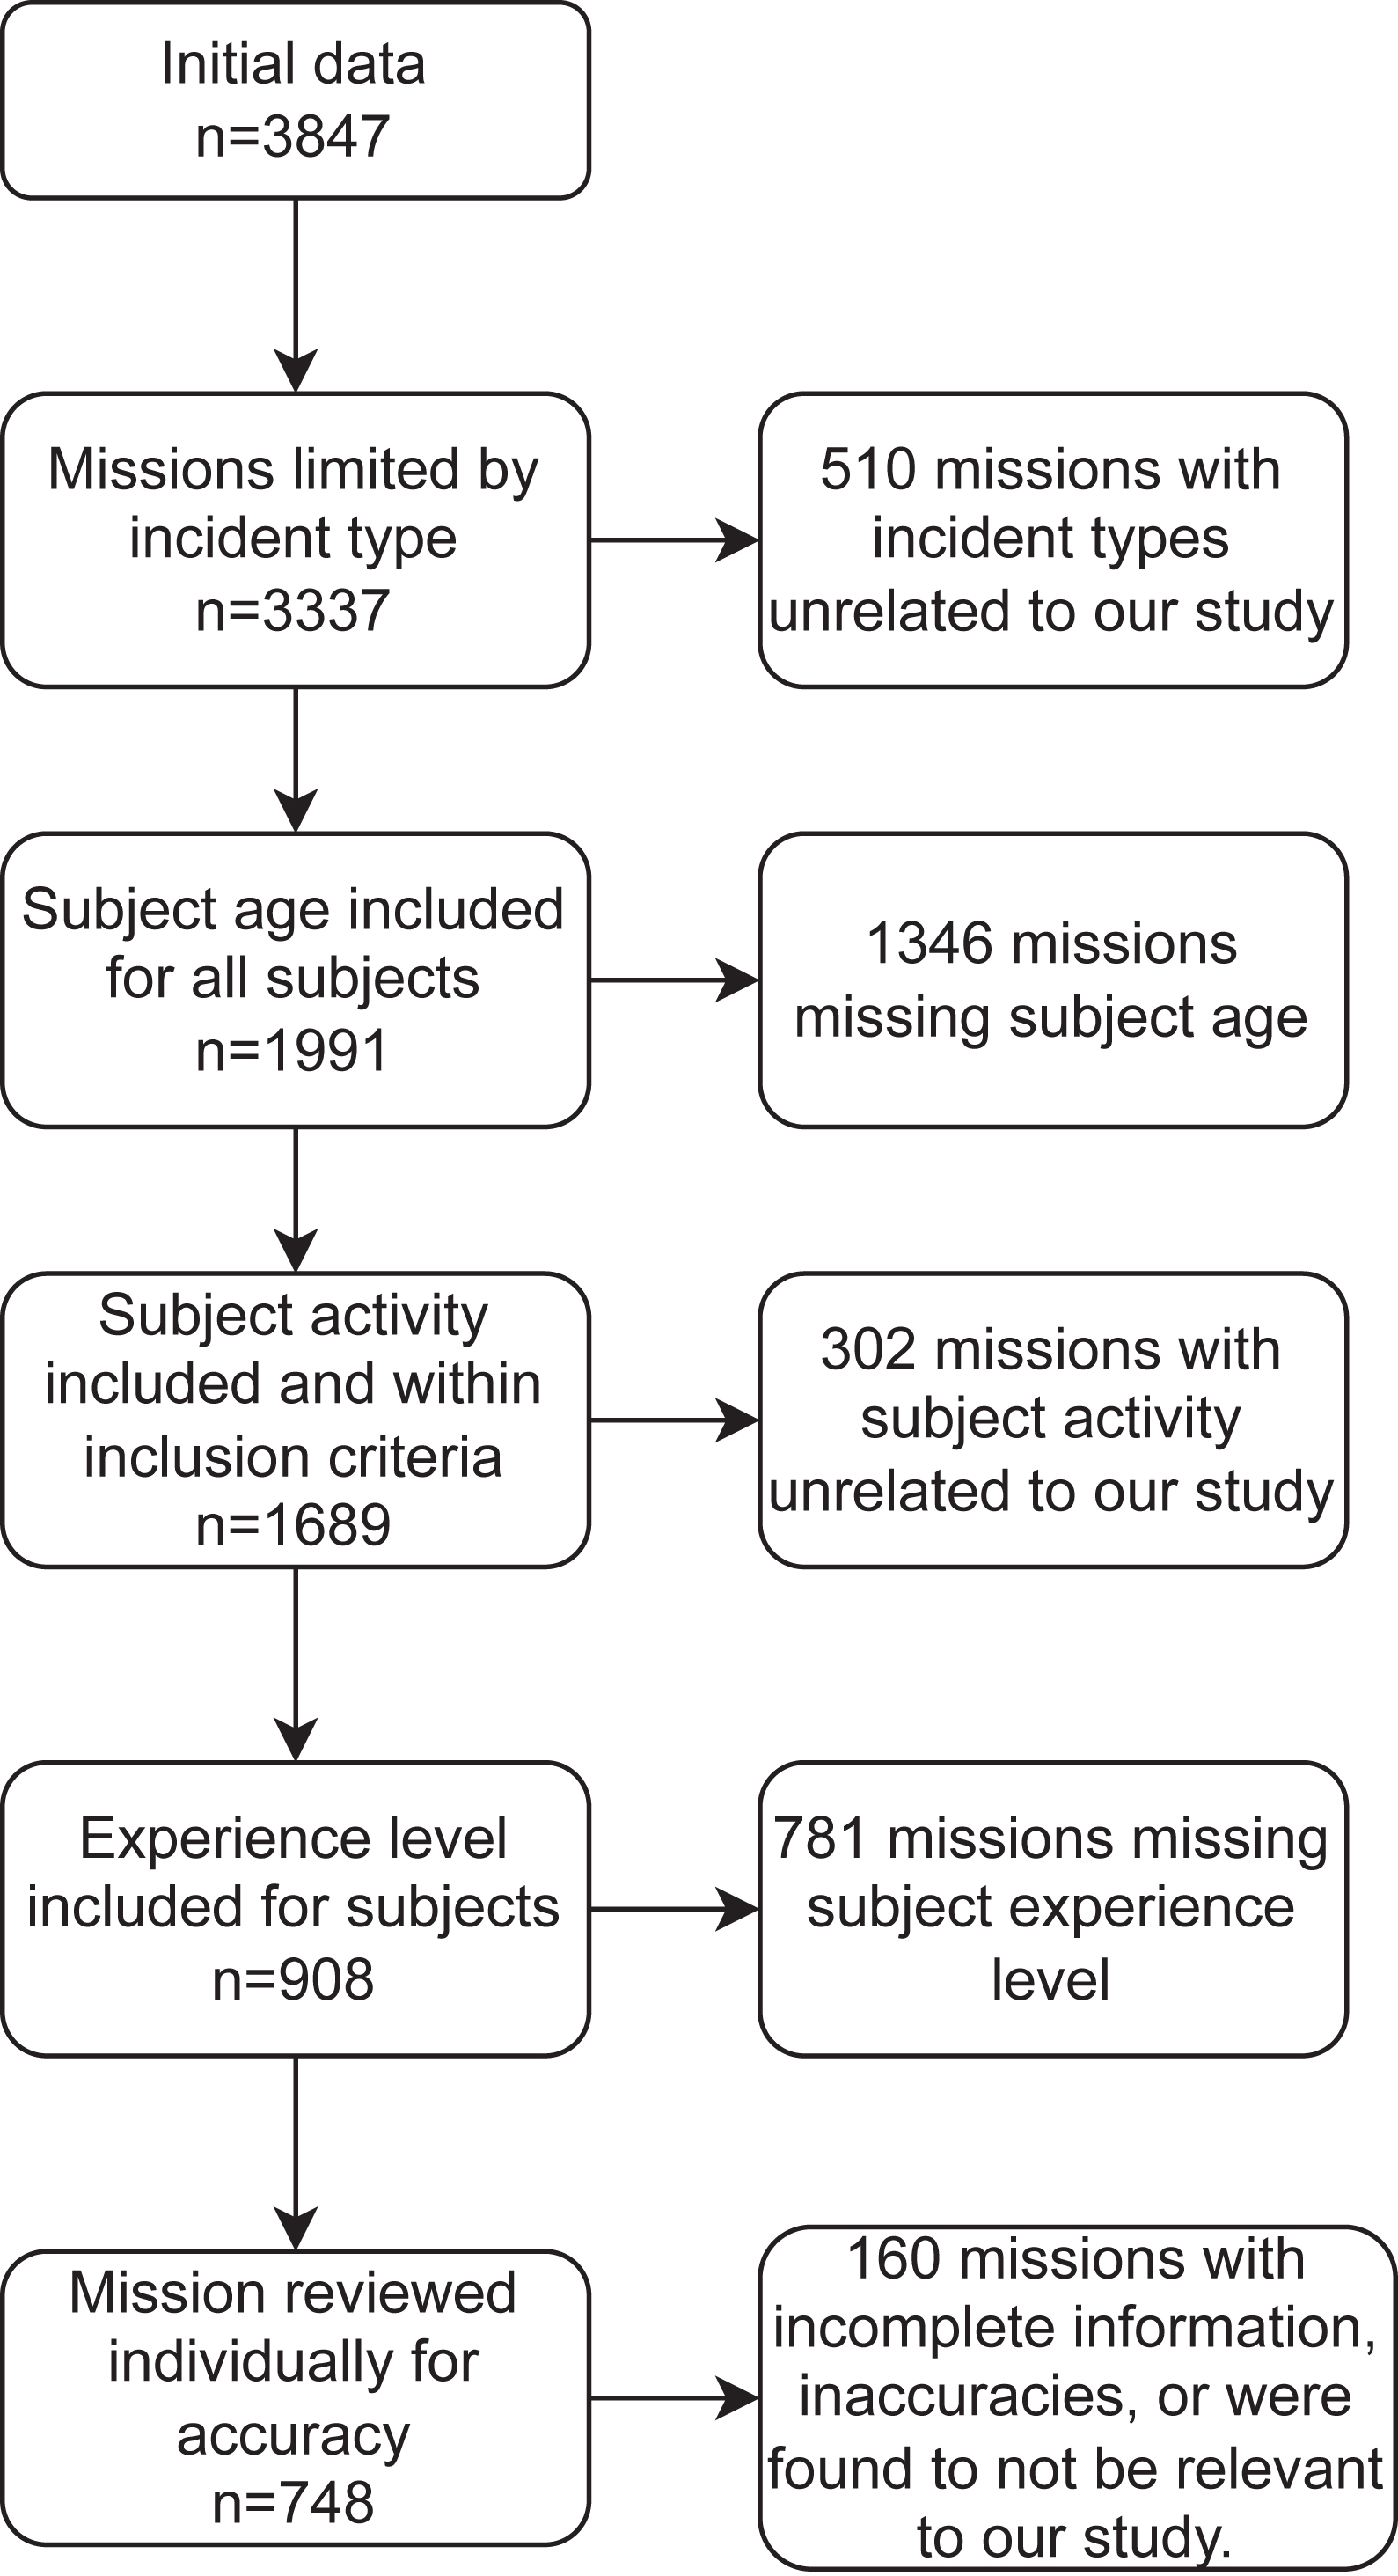
Process of exclusion.
Demographics and Locations
The mean age of the subjects was 37.5 y (SD, 17.3 y), and the median age was 33 y. Sixty-nine percent (n=655) of the subjects were male and 31% (n=297) were female (Table 1). Thirty-one percent (n=293) of the subjects were reported to have a “poor” level of experience, and 4% (n=37) were reported to have an “excellent” level of experience (Figure 2).
Demographic characteristics of subjects
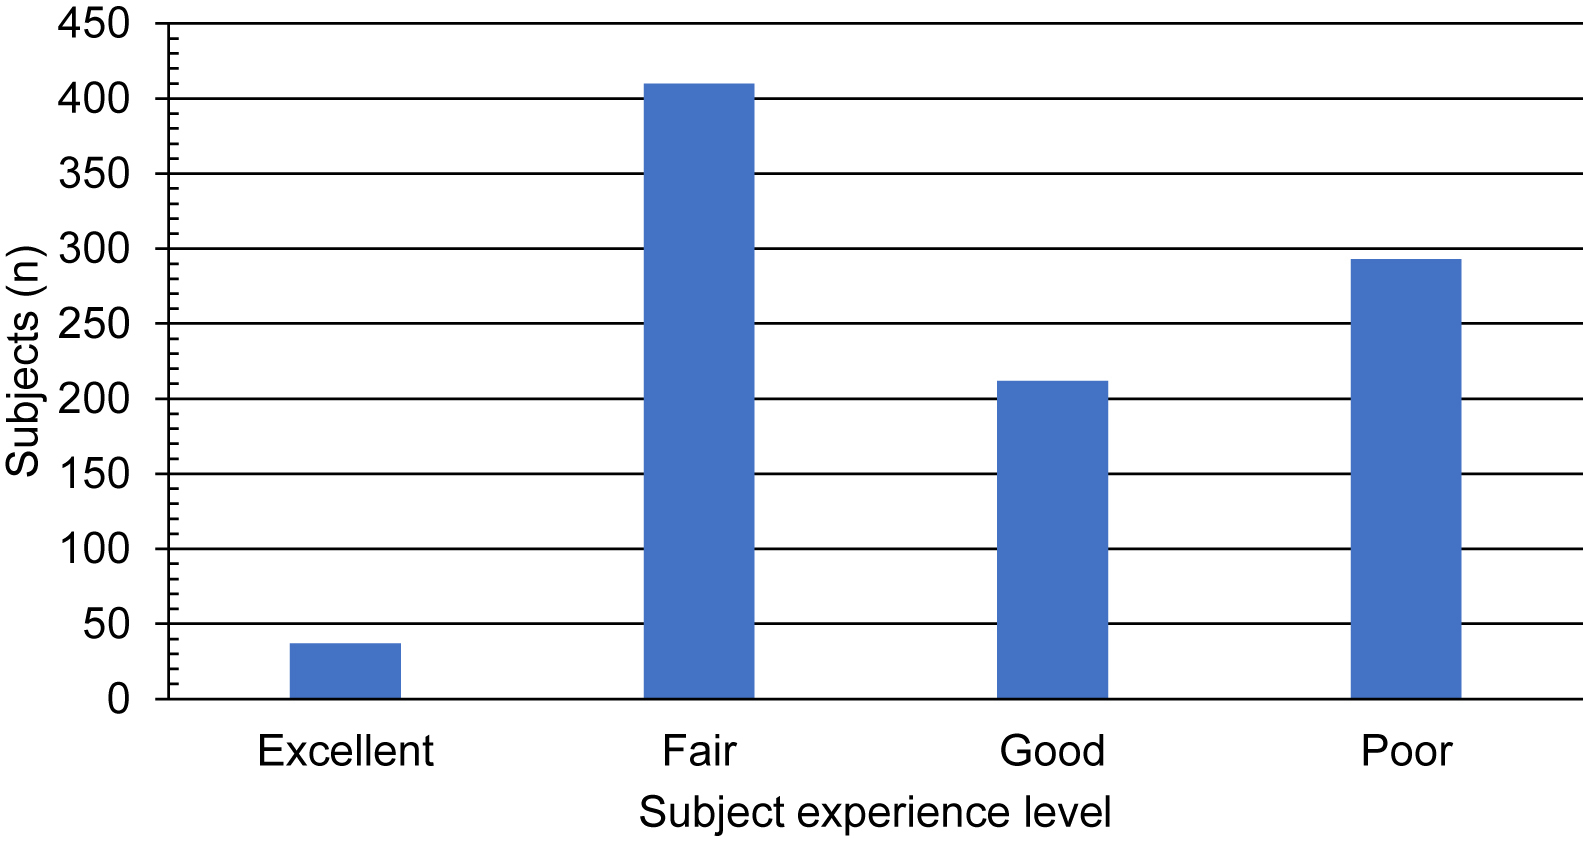
Reported level of experience of subjects.
Data were reported from 36 counties, with Los Angeles (n=211), Madera (n=105), and Riverside (n=78) counties comprising the highest number of reported missions (Figure 3). The mean elevation was 1602 m, with a range of −50 m (near Salton Sea) to 4250 m (Mount Whitney). The data included information from a variety of locales, including national forests, national parks, state parks, county parks, and other undesignated areas. The most common locations were the Angeles National Forest/San Gabriel Mountains National Monument (n=202), Inyo National Forest (n=89), and Sierra National Forest (n=75).
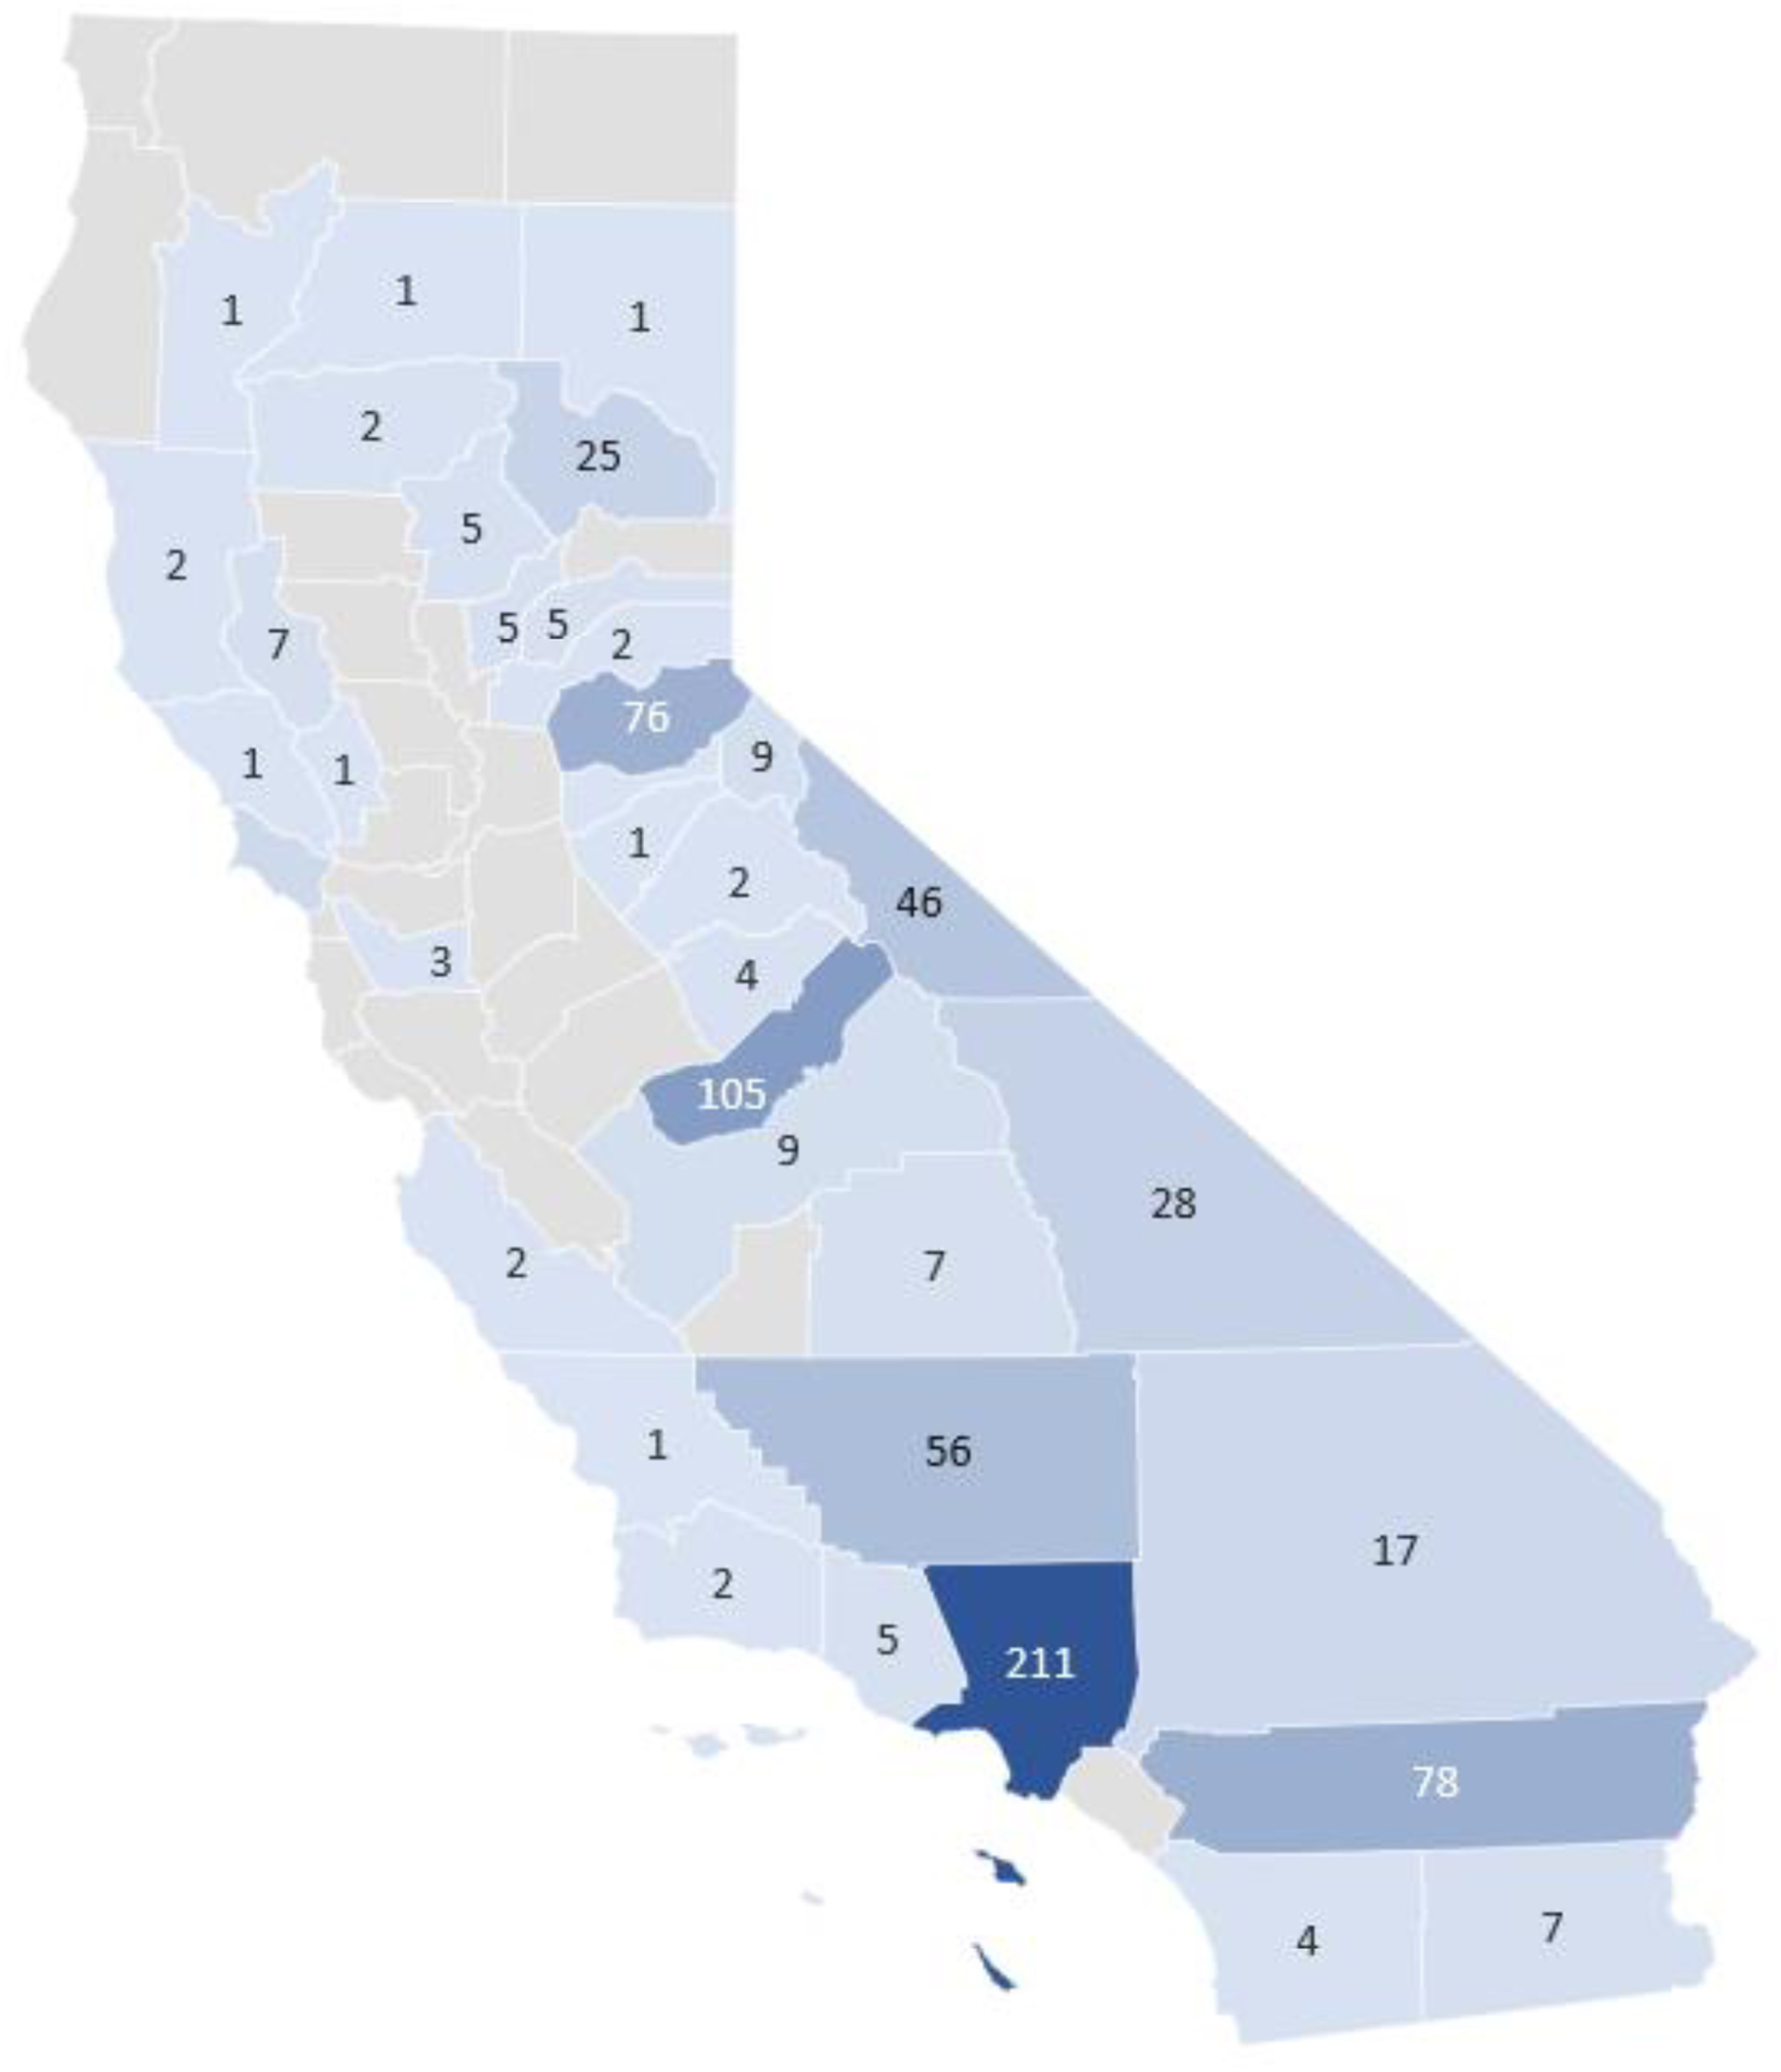
Heat map of missions by county. Darker hues denote more missions, and numbers denote the number of missions.
Activities and Outcomes
The most common subject activity in which SAR activation was required was hiking (53%), followed by driving (9%) (the definition of “driving” was unclear but believed to be subjects operating a vehicle on standard roads in wilderness areas), motorcycling (8%), and climbing (4%) (Table 2). In total, 61% of subjects were found alive and well, 31% were found injured, 5% were found deceased (DOA), and 2% were not found (it is unclear whether the “not found” subjects were later found). However, the proportion of outcomes varied greatly by activity.
Top 10 activities with outcomes
DOA, deceased; OHV, off-highway vehicle; ATV, all-terrain vehicle.
Injuries and Level of Care
Thirty-seven percent (n=280) of the incidents involved injury or illness. Of these, 81% (n=228) were trauma-related and 19% (n=52) were medical incidents. Of the subjects found ill or injured, extremity trauma was the most commonly reported injury (38%), followed by head trauma (17%) (Figure 4). Spine and chest trauma was reported at equal proportions (9%). Excluding trauma, environmental illness (eg, hypothermia, heat exhaustion) was the most common medical complaint (8%). These results included subjects with both single and multiple traumatic injuries.
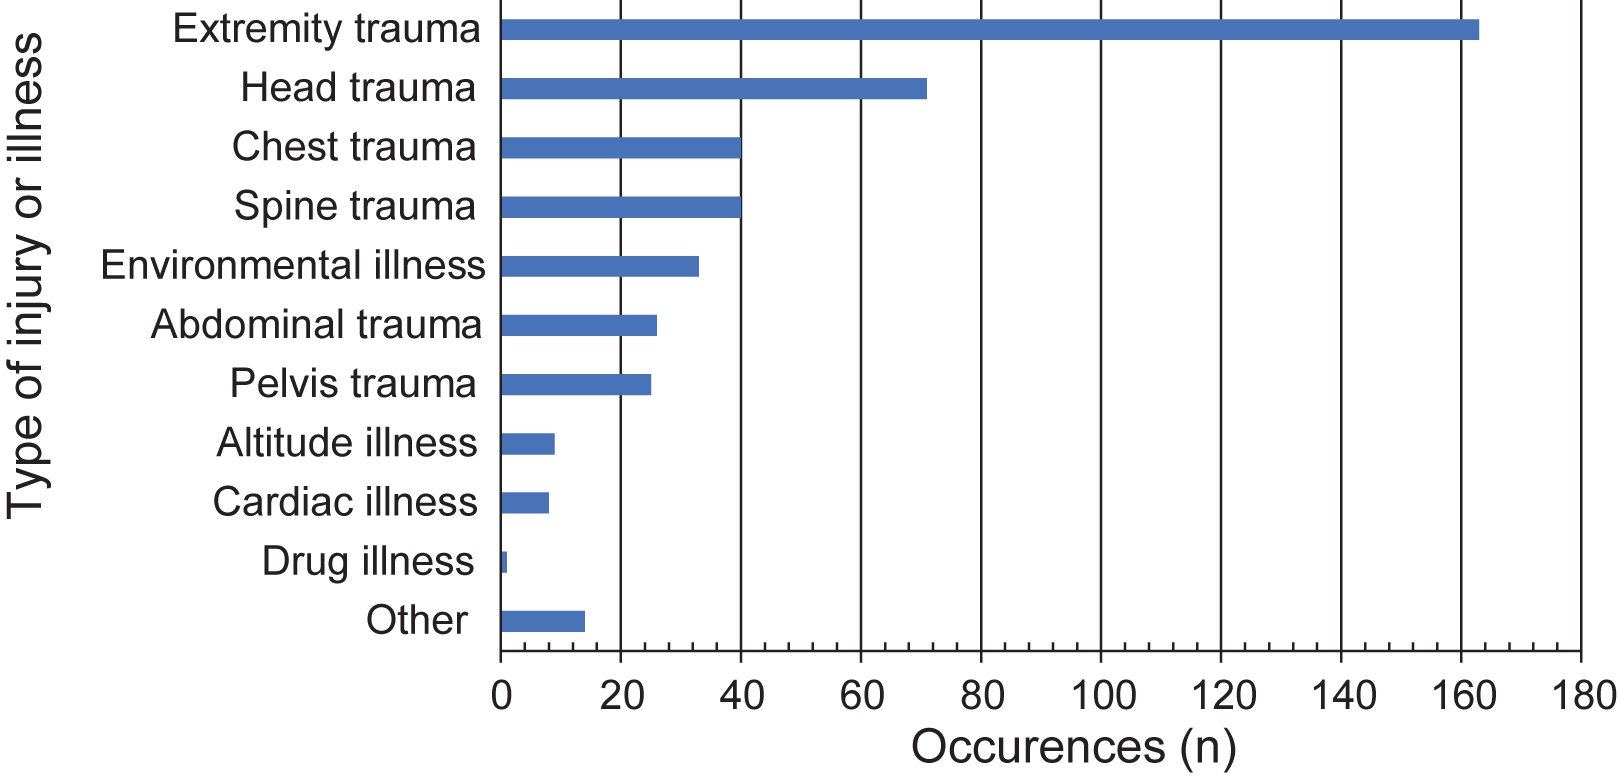
Frequency of trauma and illness.
Of the missions in which the subject was found ill or injured, advanced life support (ALS) was provided 62% of the time and basic life support was provided 20% of the time (Figure 5). However, it was not always clear whether the reported level of care came directly from the SAR team or from the responding emergency medical services (EMS).
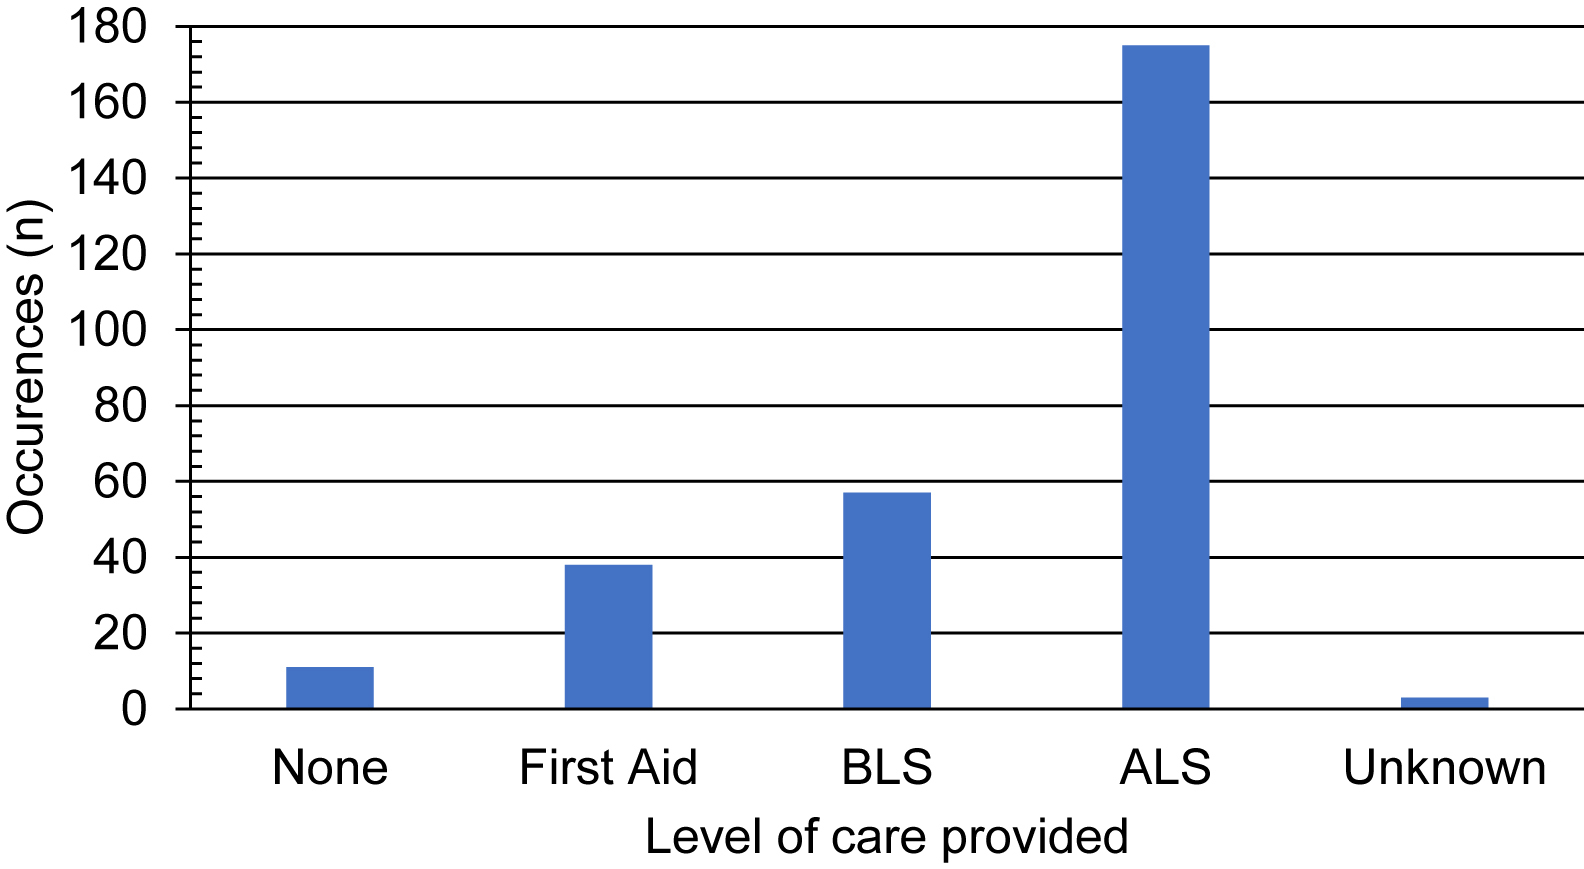
Frequency of levels of care provided. ALS, advanced life support; BLS, basic life support.
Group Comparisons
Alive and well
There was a significant difference in the proportion of subjects found alive and well by activity overall (P=0.004; Table 3). Pairwise comparisons revealed that the percentage of subjects found alive and well was significantly less in the high-impact activities group (53%) than in the land-based activities (64%; P=0.003) and miscellaneous activities (74%, P=0.005) groups. The difference in percentage found alive and well between the other groups was not statistically significant. Sixty-five percent of subjects participating in water-based activities were found alive and well.
Frequency (percentage) of outcomes by activity
DOA, deceased.
P values are based on overall χ2.
indicates significant difference
Injured
There was a significant difference in the proportion of subjects found injured by activity overall (P<0.001; Table 3). Pairwise comparisons revealed that the percentages of subjects found injured in each group were all statistically different between activities (P<0.05), except water-based activities (5%) and miscellaneous activities (17%; P=0.054). Forty-two percent of high-impact activities and 30% of land-based activities resulted in injury.
DOA
There was a significant difference in the proportion of subjects found DOA by activity overall (P<0.001, Table 3). Pairwise comparisons revealed that the percentages of subjects found DOA in each group were all statistically different (P<0.05), except for high-impact (4%) and land-based activities groups (4%, P=0.93). The percentage of subjects found DOA in the water-based activities group (30%) was statistically significantly higher than that in all other groups. The miscellaneous activities group had no subjects found DOA.
Not Found
There was a significant difference in the proportion of subjects not found by activity overall (P=0.010; Table 3). There was 1 significant pairwise difference between the land-based (2%) and water-based (0%, P=0.005) activities group. Although the miscellaneous activities group had the highest percentage (10%), it also had the lowest number of subjects, making the estimate imprecise. One percent of the subjects in the high-impact activities group was not found.
Discussion
The demographics of our population are similar to those in other studies of SAR in wilderness areas, most notably the age and sex breakdown. A 2015 study in Baxter State Park, Maine, found a mean age of 39 y and a proportion of 60% male subjects, 4 whereas a 2004 study in New Hampshire found a mean age of 36 y and 65% male subjects. 7 Men between 18 and 39 y of age appear to be more likely to require SAR in the wilderness overall; however, the outcomes are variable beyond that. The submitted data include counties with major population centers and those with small populations but popular wilderness areas.
Subjects engaged in high-impact activities were most likely to be injured and least likely to be found alive and well, whereas water-based activities were more likely to lead to fatal incidents than others. The predominance of traumatic injuries, as opposed to medical issues, is also consistent with other studies. For example, a 2013 study of Yosemite National Park found that extremity trauma alone made up 53% of their EMS incidents. 10 Similarly, a 2018 study of Sequoia and Kings Canyon National Parks found that 46% of their EMS incidents involved traumatic injury. 9 The level-of-care results are, as mentioned previously, not entirely clear as to whether the provided care came from the SAR team itself or the responding EMS. A recently published study surveying SAR teams in California found that, of the teams that responded, 12% had at least 1 nurse practitioner on their team, 21% had at least 1 physician assistant, 45% had at least 1 member with emergency medical technician-paramedic certification, and 61% had at least 1 registered nurse or physician 11 ; therefore, ALS being provided directly by the SAR team is not improbable.
Approximately 80% of the original incidents had to be excluded based on the exclusion criteria, and we do not know what additional conclusions we could have drawn from these missing data. In addition, it is unknown how many more missions took place in California during this time frame that were not officially recorded and submitted. A standardized, simple form that would be quick and easy for rescuers to complete would likely provide access to more accurate and larger amounts of data. A proposed user-friendly form for SAR team members to complete can be found in Table 4. Examples of mandatory SAR forms from Washington and Oregon can be found in the reference list.12,13
Proposed form for search and rescue teams
SAR, search and rescue; EMT-B, emergency medical technician-basic; EMT-I, emergency medical technician-intermediate; EMT-P, emergency medical technician-paramedic; RN, registered nurse; APRN, advanced practice registered nurse; PA, physician assistant; MD, doctor of medicine; DO, doctor of osteopathic medicine N/A, not available.
Limitations
The major limitation of this study is also an important point of this article: the lack of a centralized, streamlined system for reporting SAR incidents in California. Thousands of the missions initially in the dataset were missing pertinent information and had to be excluded. In addition, because the data are voluntarily reported, it is unknown exactly how many more missions took place in the time span that could have added to the results.
An additional limitation of this study is the subjective nature of the collected data. For example, although we included recorded levels of experience in the results, there was no objective measure for this in the survey. Additionally, although our study was aimed at identifying risk factors for those requiring rescue because of accidental circumstances, it is unknown how many of the incidents listed as “DOA” or “not found” were, unbeknownst to the SAR teams, actually suicide or homicide incidents. Although some of this information would be impossible to ascertain, a more detailed reporting form may lead to a better understanding of the situation.
Finally, we did not include official NPS SAR incident reports in our study. Although some incidents in national parks were included in the final data, this is likely the result of mutual aid calls or overlapping jurisdictions with county SAR teams and not from the NPS teams themselves.
Conclusions
The results of our study show interesting demographic trends and significant differences in outcomes. However, we were limited by incomplete data and thousands of excluded data points. Although the complete dataset may very well lead to the same findings, it is impossible to draw that conclusion with the limited dataset available. The limitations of this study lead to a question of whether California should develop a centralized, uniform reporting system for all SAR operations, as is done in other states, such as Oregon and Washington. This system would require each team to complete a standardized form after each mission with questions designed to elicit objective responses about subject demographics and the specific outcomes for each subject. A uniform system for collecting SAR incident data in California will provide researchers and authorities with better data for analyzing the risk factors and epidemiology leading to wilderness rescues in California, which could be extrapolated to other places given California’s diverse wilderness areas.
Footnotes
Acknowledgments
The authors thank Monty Bell of the California Office of Emergency Services and the Mountain Rescue Association for his assistance in providing the data used in this study and all the search and rescue members who serve the state of California.
Author Contributions: study concept and design (ABL, JLF); data collection (ABL); data analysis (ABL, RSF, JLF); manuscript drafting and revision (ABL, RSF, JLF); approval of the final manuscript (ABL, RSF, JLF).
Financial/Material Support: None.
Disclosures: None.