
Abstract
Introduction
The volume, nature, and risks of paragliding are poorly quantified. More comprehensive understanding, including incident rates allowing comparison to similar disciplines, will help direct and appraise safety interventions.
Methods
Paraglider pilots were surveyed regarding experience, incidents, recordkeeping, and risk perception. The survey could not capture those who had left the sport or died, so a subset of responses from UK pilots was compared to records from an incident database.
Results
There were 1788 (25%) responses from 7262 surveyed. Respondents flew a total of 87,909 h in 96,042 flights during 2019. Local flying was most frequent (n=37,680 flights, 39%) but a higher proportion of hours were spent flying cross-country (n=33,933 h, 39%). The remainder were spent in competition, hike and fly, tandem, aerobatic, or instructional flight. Flying incidents led to 103 (6%) respondents seeking medical attention, attending hospital, or missing a day of work in 2019. Near misses were reported by 423 (26%) pilots. Asymmetry and rotational forces typically led to incidents, and limb and back injuries resulted. Pilots frequently failed to throw their reserve parachutes. Only 3 (0.6%) incidents involved equipment failure, with the remainder attributed to control or decision errors. Incident rates of paragliding were estimated as 1.4 (1.1–1.9) deaths and 20 (18–27) serious injuries per 100,000 flights, approximately twice as risky as general aviation and skydiving.
Conclusions
Incidents usually resulted from pilot error (control and decision), rather than equipment failure. Future safety interventions should focus on improving glider control skills and encouraging reserve parachute deployment.
Introduction
Paragliding is a growing discipline of unpowered flight and a popular wilderness activity. Equipment performance has rapidly improved since its inception in the late 1970s, and flights of several hours are now common, with the present distance record standing at 588 km in a single, 11-h, unpowered flight. 1 However, paragliding remains hazardous, with pilots at risk of collision with terrain or one another and at risk of environmental injury secondary to hypoxia, cold, or acceleration forces. 2 Increasing efforts are being made to match performance gains with safety initiatives. 3 There is a need for better epidemiologic information to assess the effectiveness of interventions and to make paragliding’s risks comparable to those of related disciplines, such as general aviation and skydiving.
The Paraglider Manufacturers Association estimated that there were 127,000 active paraglider pilots worldwide in 2014. 4 At present, incident numbers are tallied from self-reports and published annually by national associations. Authorities (typically the police) are notified of fatalities, which are usually then investigated by representatives of national associations on their behalf. Incident numbers are less useful than incident rates, because rates indicate whether decreasing incident numbers represent a real improvement in safety or simply a change in flying frequency. One author arrived at a total of 47.1 fatalities per 100,000 participant-years in UK paragliding, based on membership data from the British Hang Gliding and Paragliding Association (BHPA). 5 However, paragliding, like other outdoor pursuits, is a diverse activity, and people fly in many different ways. Some pilots only fly locally in smooth laminar conditions, whereas others go long distances in turbulent air. Some focus on mountain flying, aerobatics, commercial tandem flying, or international competition. Some pilots fly most days, others once a year on vacation. Equipment choices may range from stable, certified gliders to high-performance prototypes. Because paraglider pilots do not file flight plans, the total flying time and time spent in these different types of flying are unknown. Estimations based on membership numbers do not consider the volume, type, or environment of the activity in question.
The most useful metrics in paragliding safety are the incident rates adopted by powered aviation, such as incidents per flight, hours, or kilometers flown. The goal of this study was to quantify the nature, volume, and risks of paragliding activities through a largescale survey and to conduct an analysis of a national incident database. The effects of activity, currency (recent experience), and risk perception on incidents was considered, and incident rates for fatalities and serious injuries by flight volume were derived.
Methods
The study made use of 2 distinct sources of data: a new survey and a pre-existing incident database. In the survey, a cohort of pilots from a controlled list was questioned to obtain a more complete picture of their flying activities. The survey tool, which could not capture those who had died, left the sport, or been too injured to respond, was combined with records from the European Hang Gliding and Paragliding Union (EHPU) incident database to provide additional detail on incident numbers and character.
A survey instrument (Table 1) was built in Survey Monkey (Momentive Inc, San Mateo, CA), in accordance with the recommendations in the international handbook of survey methodology for list-based surveys of high-coverage populations. 6 The survey was in 4 parts. The first captured demographics and primary discipline of flight. Only those who chose paragliding and provided answers relating to paragliding were included in the results. The second quantified total experience, the third focused specifically on flying activities in the year 2019, and the final part focused on incidents in 2019. Participants were asked how their responses were generated (from memory or written records), and the survey concluded with a single question about perception of risk. The instrument was piloted with 20 participants and received ethical approval from the University of Portsmouth science faculty research ethics committee (SFEC 2019-115).
Survey questions and responses
Respondents were asked at the start “What is your main discipline of flying? (The discipline of flying that you spent the most time doing in 2019.)” Only those who chose paragliding (1655 respondents) and provided answers relating to paragliding were included in the results. “Flying hours” were defined as “the time spent in the air between take-off and landing.” A “flight” was defined as “a distinct launch and then landing (not a ‘touch-and-go’ or wagga).” A “near miss” was defined as “an unplanned event that had the potential to cause injury but did not result in an accident. For example, a massive collapse close to the ground, nearly colliding with another pilot, or being dragged along the ground.” The responses are presented as number of responses, unless specifically indicated as mean±SD or median (interquartile range). Pilots might be members of multiple associations or have multiple logging methods, so percentages add up to more than 100.
APPI, Association of Paragliding Pilots and Instructors; BHPA, British Hang Gliding and Paragliding Association; DHV, Deutscher gleitschirm und drachenflugverband e.v. (German Paragliding and Hang Gliding Federation); FFVL, Fédération Française de vol libre (French Federation of Free Flight); FSVL, Fédération Suisse de vol libre (Swiss Federation of Free Flight); USHPA, United States Hang Gliding and Paragliding Association.
The population surveyed was drawn from the readership database of Cross Country magazine (Cross Country International Ltd., UK), the largest international free-flight publication. Their database was fully compliant with the general data protection regulations, with explicit opt-in permission for web surveys, and activity of the registered email addresses was checked annually, allowing for accurate calculation of response rate. An individual email invitation and unique login were sent to all 7262 readers who had opted in for web surveys on February 24, 2020. A single reminder email was sent 5 d later, and data collection was closed 14 d later (after 72 h with no further responses). The data collection period was kept short to minimize variation in the length of recall required for pilots recounting their 2019 experiences. Comprehensible partial responses were included in the analysis where possible, and the number of included responses is expressed as n values in the results.
BHPA entries on the EHPU European incident database were downloaded on January 27, 2020, after further ethical review (UoP ethics screening tool ETHICS-10049). The download included 1296 reports, of which 1034 related to paragliding, dated between January 8, 2012 and January 21, 2020. The reports in which the pilots were uninjured were manually reviewed to exclude reports relating to nonflying incidents (eg, equipment issues identified during servicing) and reports of fatal injury were screened to exclude deaths unrelated to paragliding. Fatal injuries were defined (by the database) as death “within 30 d following the accident.” Serious injuries were defined as “more than 48 h in hospital, fractures (except for finger, nose, toe), hemorrhage, ligament rupture.” Other data fields included flight type, pilot age and sex, total weight in flight, nationality, pilot rating and courses, flying hours, glider and reserve parachute, incident specifics, and witness accounts. The BHPA also provided member numbers for the years 2012 to 2019 and an anonymized version of its current member database (to February 7, 2020), which included members’ age, sex, and pilot rating.
Incident rates per flight and per hour were estimated based on the number of incidents (nonfatal and fatal) for BHPA pilots on the EHPU database as the numerator and the flying activities reported by the 368 BHPA pilots who responded to the survey as the denominator. Only survey responses from BHPA pilots were used in this comparison. Definitions from the human factors analysis and classification system (HFACS) were used to classify causal factors in incident reports. 7 The HFACS taxonomy was developed by for the United States Navy and Marine Corps as an incident investigation tool. The taxonomy described 4 levels of human failure, 1 active and 3 latent: unsafe acts, preconditions for unsafe acts, unsafe supervision, and organizational influences. The active failures, unsafe acts, were divided into errors and violations. Errors represented a failure to achieve a goal, and violations were a deliberate deviation from prescribed practice. Although unsafe acts might have led directly to the incidents, they occurred in the context (“preconditions”) of a particular set of environmental, physical, mental, and social conditions and supervisory and organizational cultures.
Data were analyzed using R Studio (V1.0.143, R Project for Statistical Computing, R Core Development Team, V 3.4.1), with advice from a statistician. Distribution of results was assessed using descriptive methods (skewness, outliers, and distribution plots) and inferential statistics (Shapiro-Wilk test). Data were presented as mean±SD if normally distributed (Shapiro-Wilk test nonsignificant) and as median (interquartile range) if not normally distributed (Shapiro-Wilk test significant). Logistic regression was performed to ascertain the effects of flying hours, currency, and risk perception on the likelihood of respondents reporting an incident or near miss in the survey. Significance (alpha) was set at P<0.05. Free-text fields were iteratively coded and then assessed quantitatively.
Results
Of the 7262 email invitations, 4914 (68%) were opened, 2028 (28%) were clicked through, and 1788 survey responses were received. The overall response rate was therefore 25%. There were 1524 complete responses (86%) and 254 partial responses (14%), and the time taken to complete the survey was 7 min (standard deviation not reported by survey tool).
Of the 1788 respondents to the survey, 1655 flew paragliders as their primary discipline of flight and were included in the analysis. The age of these paraglider pilots was 48±12 y; 1543 were male (93%), 101 were female (6%), and 11 (0.6%) declined to specify. Results for total years and hours flying were right skewed: years flying was 10 (4–20) y, and total hours was 350 (123–900) h.
The 2019 results also had a right-skewed distribution. Total hours was 42 (20–80) h (Figure 1), and number of flights was 44 (24–80). The gap between flights in 2019 was 7 (4–12) wk, and the majority of pilots (n=922, 56%) flew throughout the year, rather than seasonally.
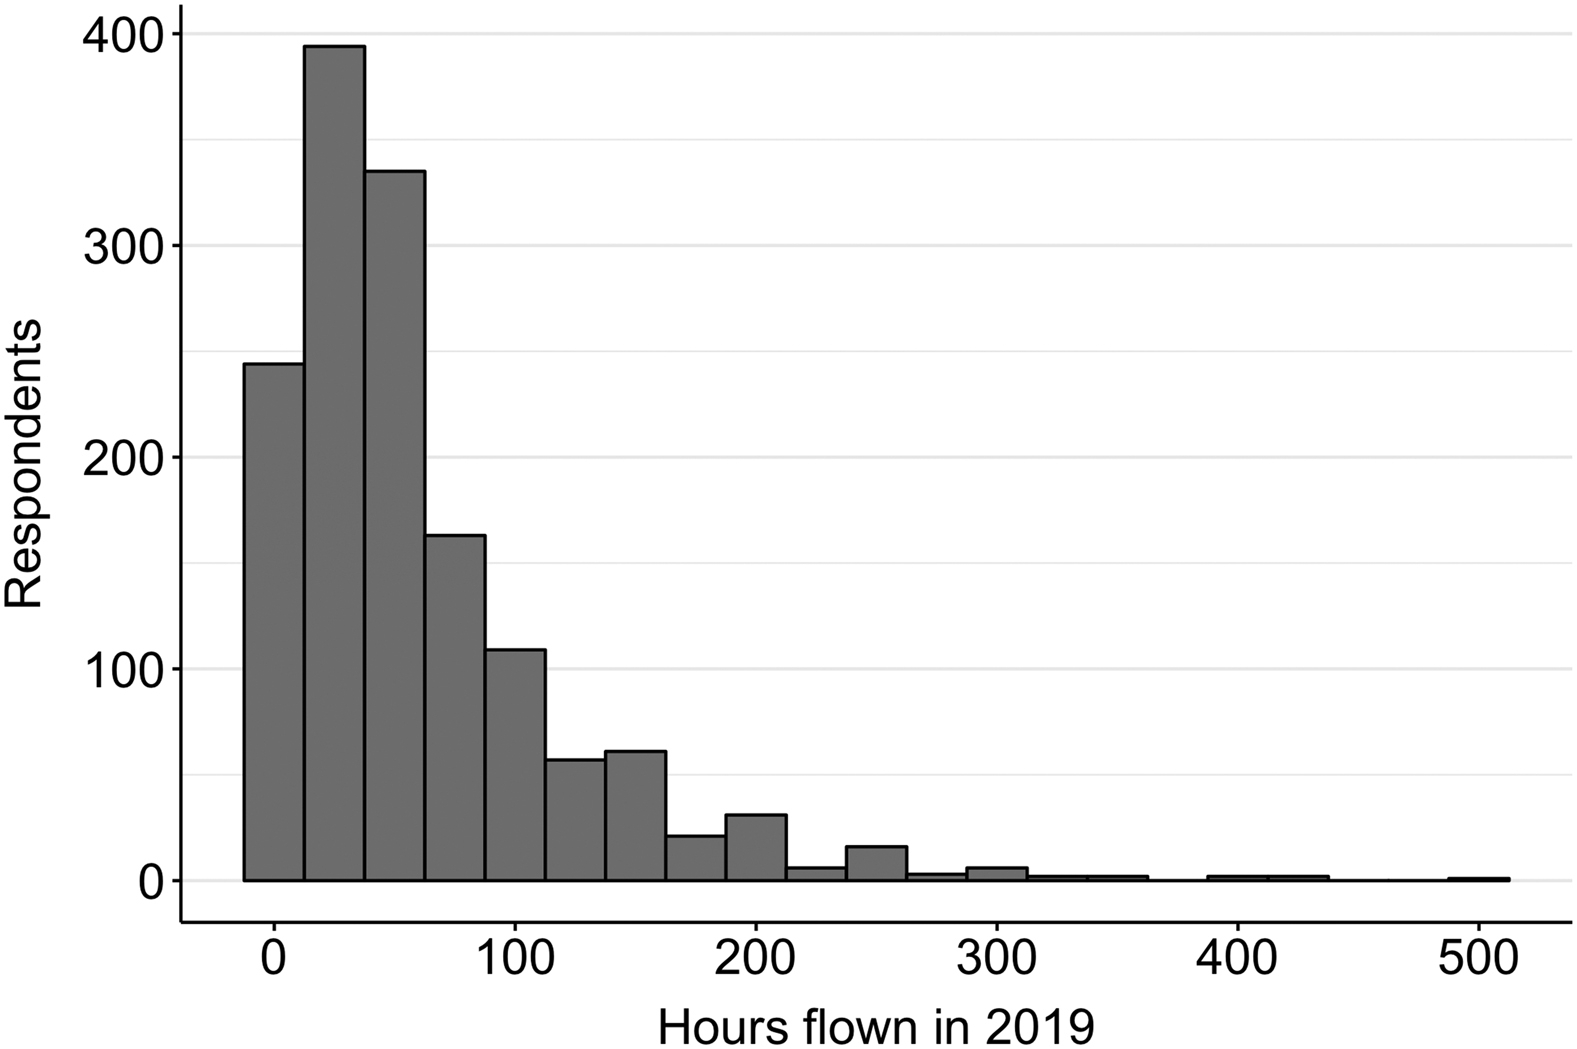
Histogram of hours flown by respondents in 2019 (n=1455).
Respondents reported that they flew a total of 87,909 h in 96,042 flights during 2019. In addition, they were asked to indicate the percentages of their flying hours spent in engaging different types of paragliding flight. Most flights were local (37,680 flights, 39%, Figure 2A), but because of longer flight times, a higher proportion of hours was spent in cross-country (33,933 h, 38%) rather than local flying (23,845 h, 34%, Figure 2B).
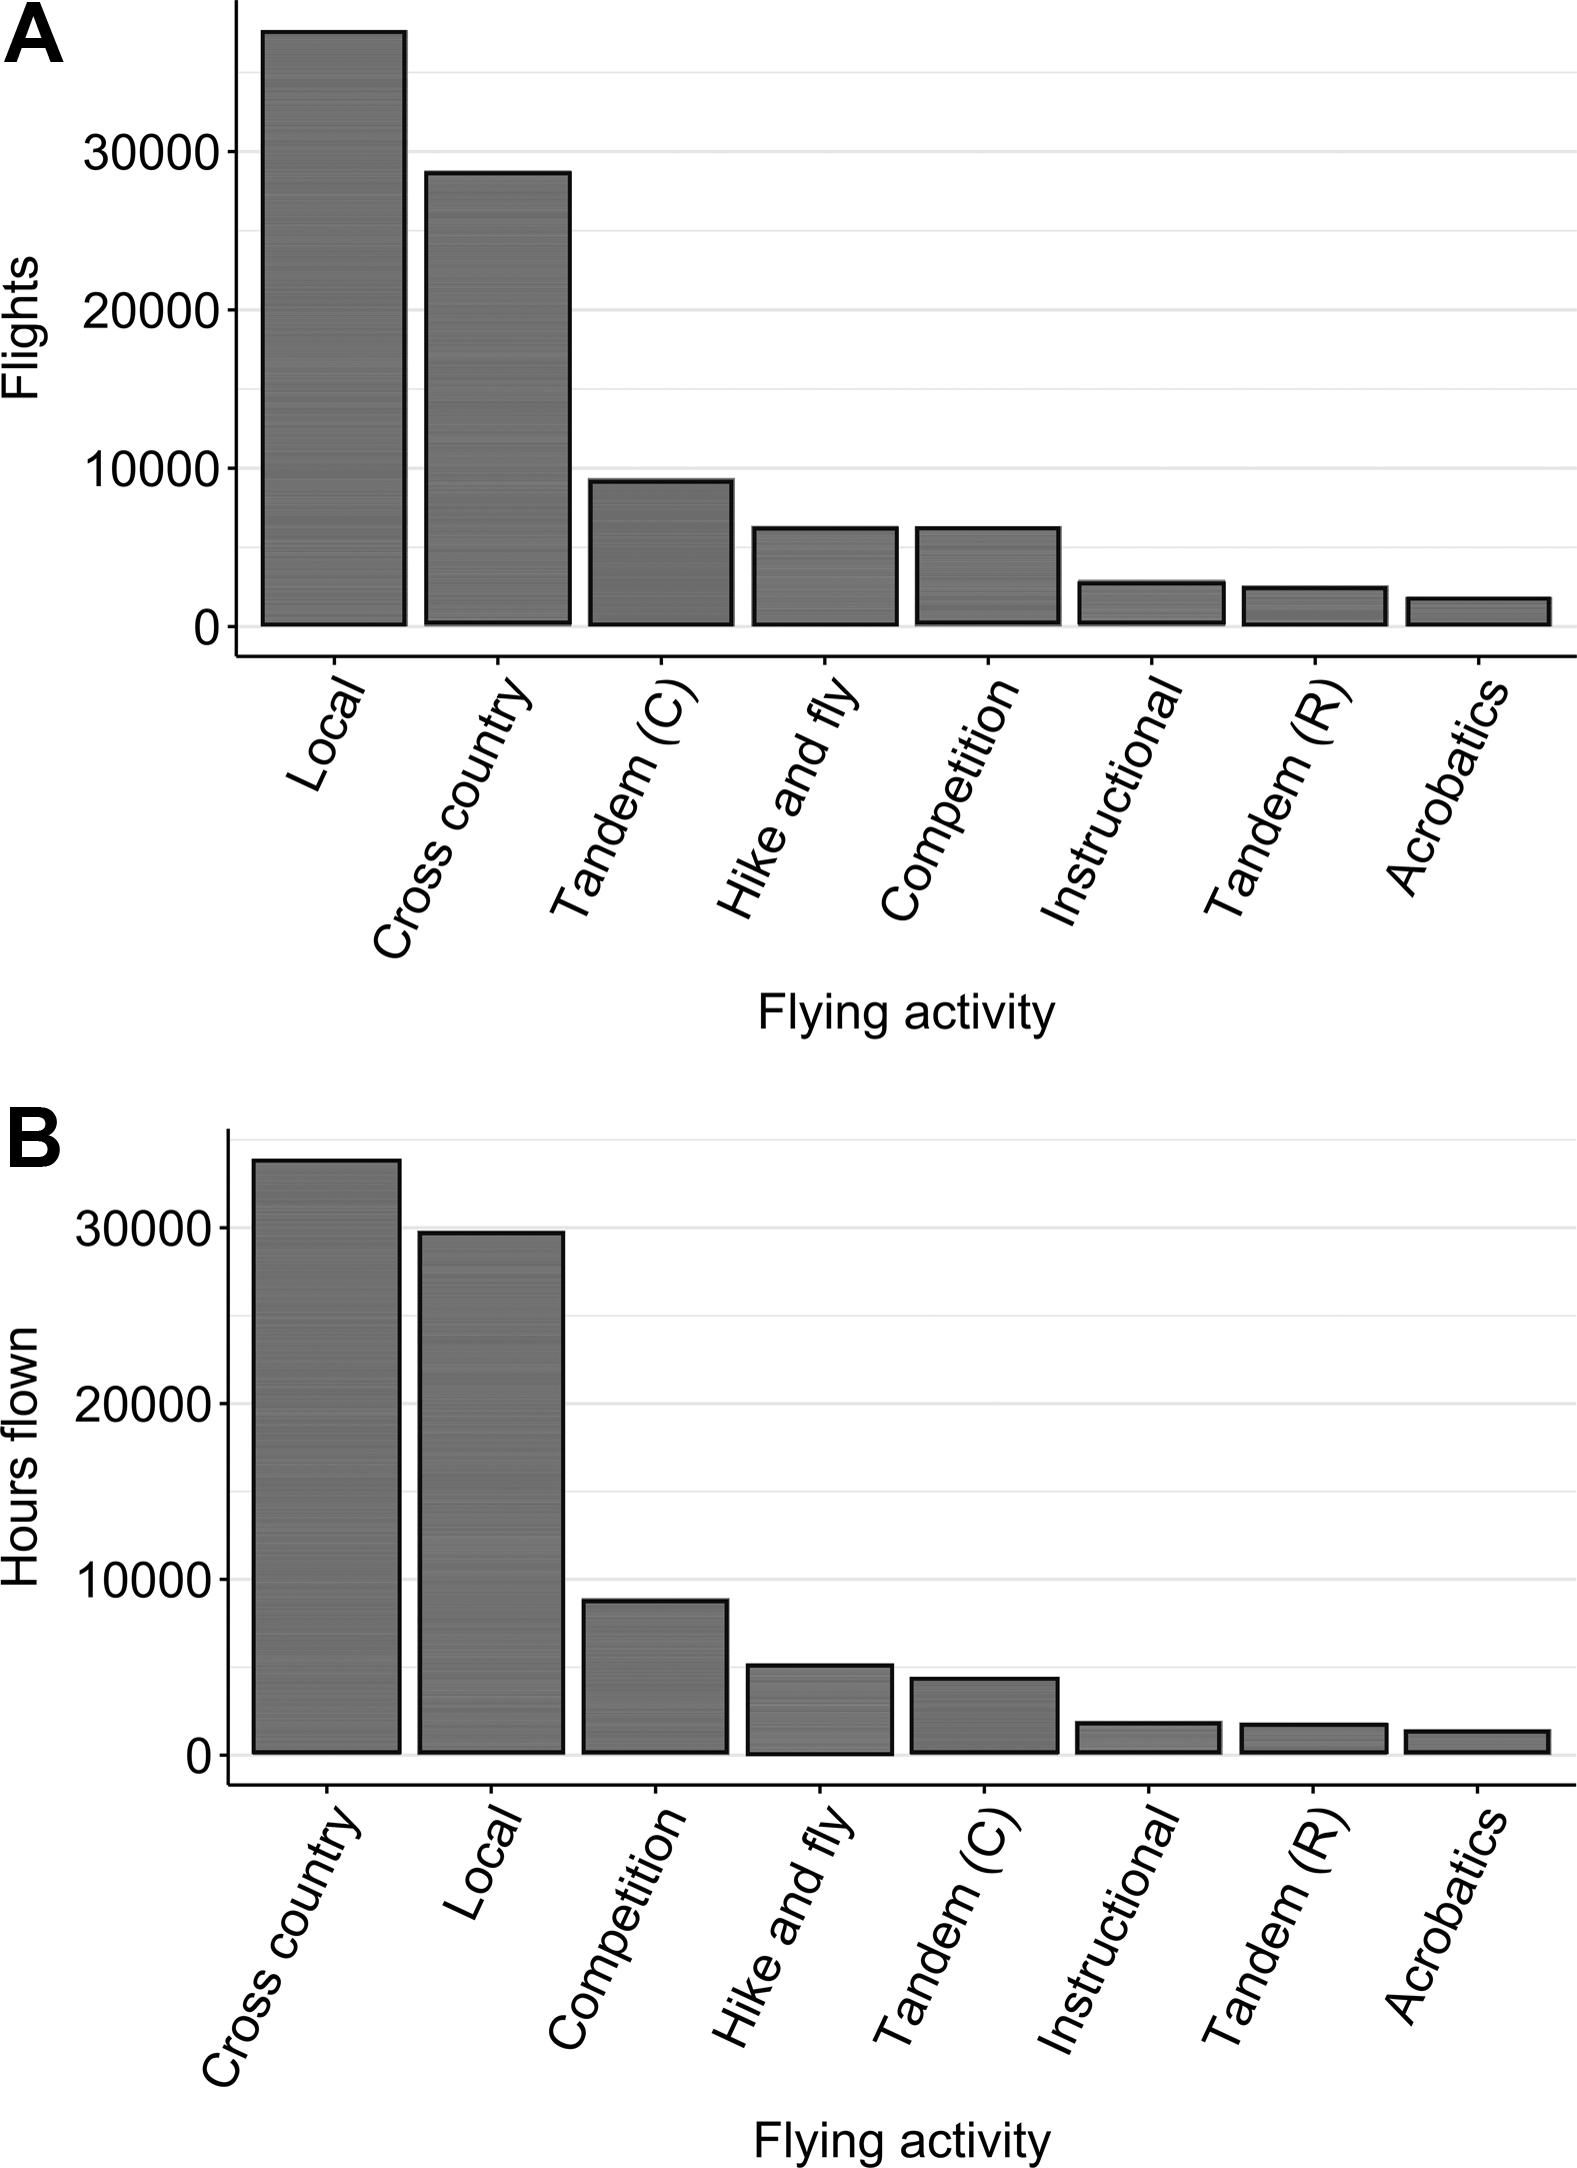
(A) Frequency of flights (n=1428) and (B) hours (n=1455) flown by respondents in 2019, broken down by activity. “Tandem (C)” is commercial, and “Tandem (R)” is recreational. “Flights” were defined as a distinct launch and then landing (not including “touch-and-go” flights) and “flying hours” as time spent in the air.
Of the total hours flown, the majority were in thermal conditions (n=59,167 h, 68%) followed by soaring (n=19,663 h, 22%) and still air (“top to bottom” flights [n=8,880 h, 10%]). Half of respondents (n=834, 50%) used a wing from the EN-B class. This is a midrange class of paraglider, designed to balance performance with safety and certified according to European Standard EN-926. 8 The remainder used a mix of beginner, more advanced, or specialist wings.
One hundred three respondents (6%) reported having to seek first aid or medical attention, attend hospital, or miss a day of work in 2019 because of a flying incident. Twenty-eight (2%) had to stay in hospital for more than 24 h. Four hundred twenty-three (26%) reported 1 or more near misses, defined as “unplanned events that had the potential to cause injury but did not result in accident.” Considered in terms of hours flown, that equated to 31 serious injuries, 117 incidents, and 481 near misses per 100,000 h—or 29 serious injuries, 107 incidents, and 440 near misses per 100,000 flights, based purely on the survey data.
Sixty-seven (65%) reported details of their incidents. Three incidents (4%) led to severe polytrauma, and the remainder involved isolated (but in many cases serious) injuries to the limbs (n=45, 67%), spine (n=5, 8%), head (n=2, 3%), pelvis (n=2, 3%), and ribs (n=2, 3%). Four hundred thirteen (98%) reported details of their near misses. Only 3 of the 480 incidents (0.6%) and near misses involved equipment failure. The remainder included 1 or more categories of pilot error (Figure 3). When the causal factors were classified using definitions from the HFACS, the majority of incidents included skill-based (n=379, 79%) and decision-based (n=213, 44%) errors. 7 Control input errors were most frequently reported (n=315, 66%), followed by misjudgment of wind strength or aerology (n=142, 30%). One-hundred forty-two reports (30%) included a collapse, 28 (6%) a stall, and 27 (6%) a spin. Midair collisions or near misses, top-landing, and kiting the glider in strong winds were also recurring themes.
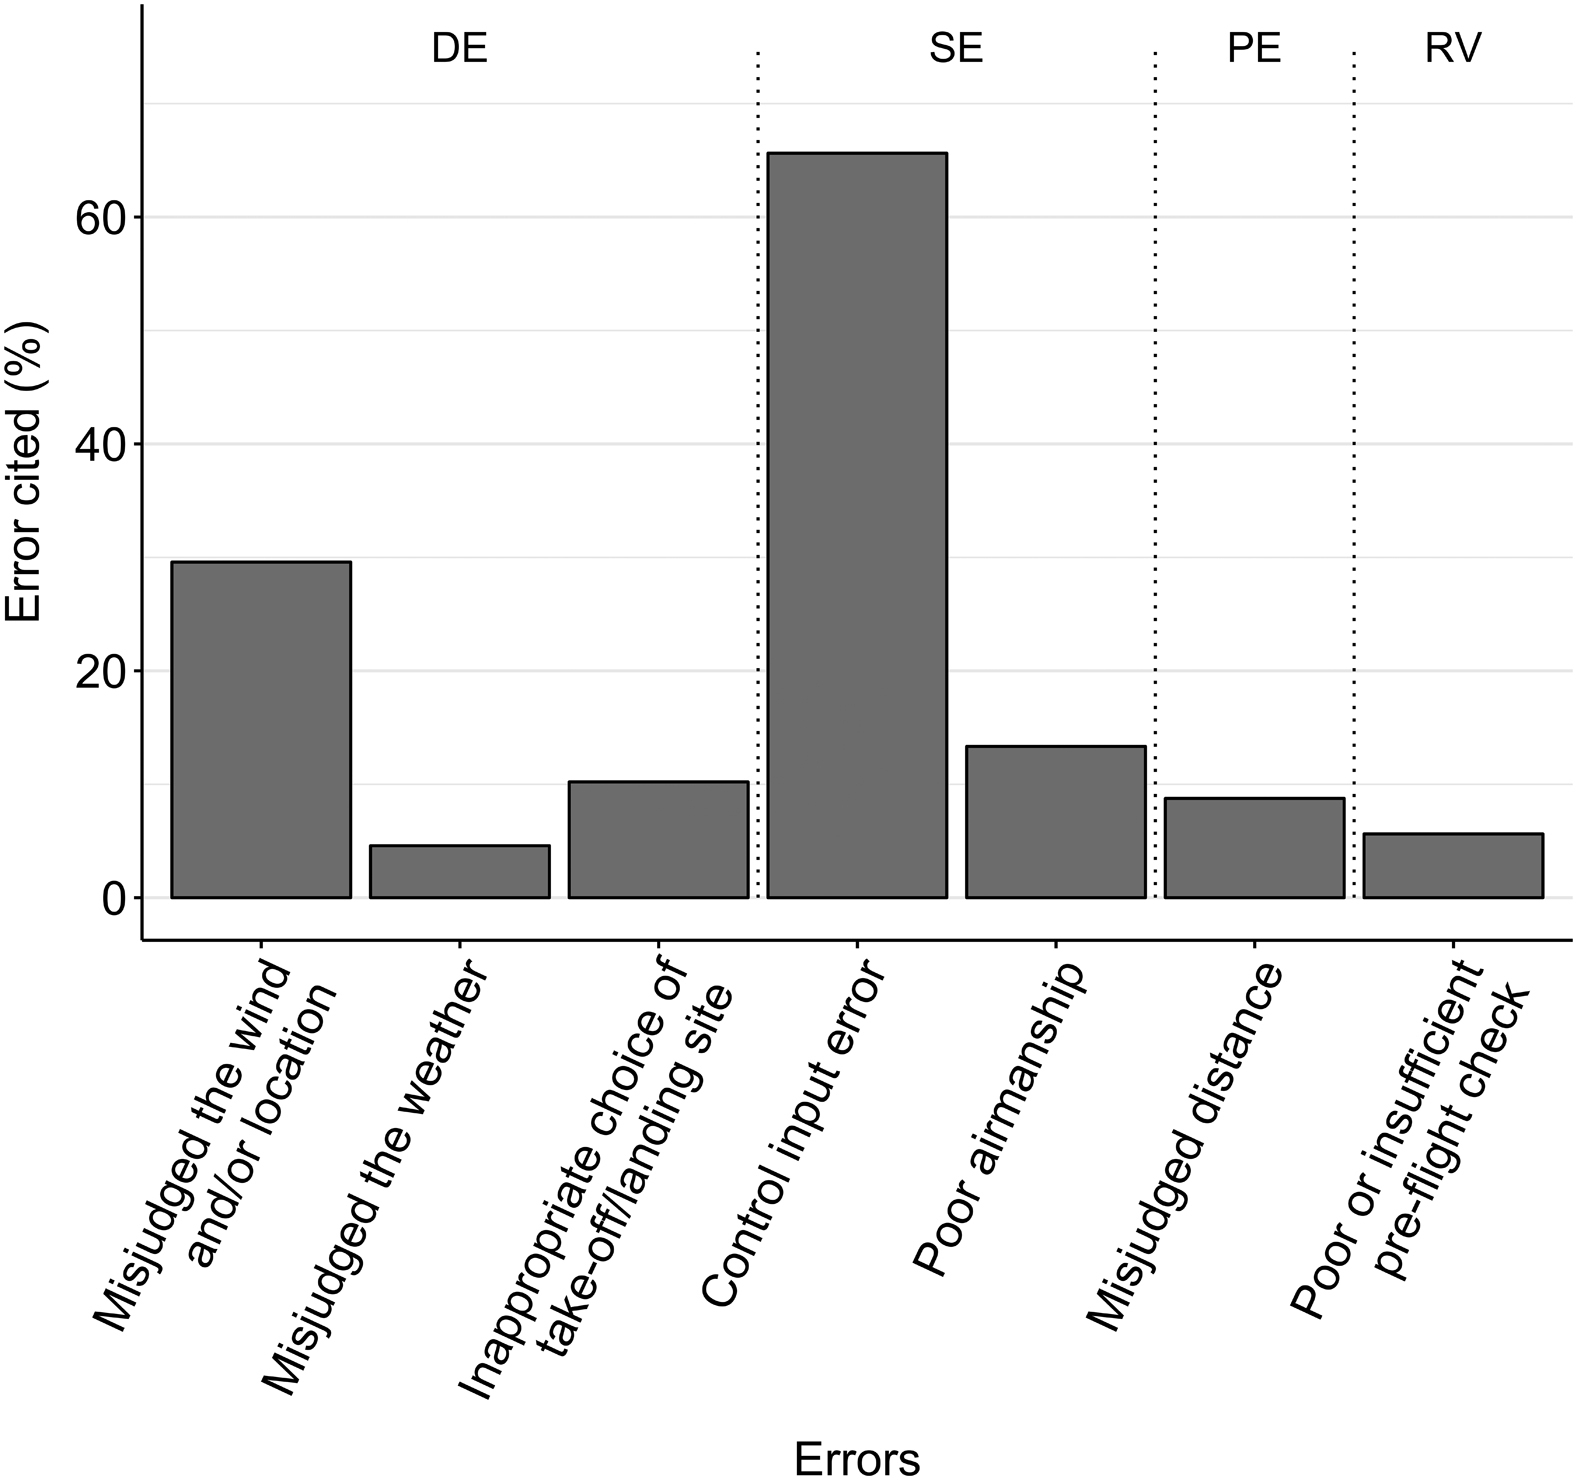
Reported errors from 67 incidents and 413 near misses (number of times each error cited, expressed as a percentage of the total number of incidents). Because the incidents often included more than 1 causal factor, the percentages in the figure do not add up to 100%. DE, decision error; SE, skill error; PE, perceptual error; RV, routine violation.
Respondents were asked to rate their perception of paragliding’s risk using a slider, between 0 (“certain you will never be injured”) and 100 (“certain you will be injured at some point”). The slider was initially positioned at 50, midway between the 2 extremes. The distribution of responses is displayed in Figure 4, and the perceived risk was 54 (34–70).
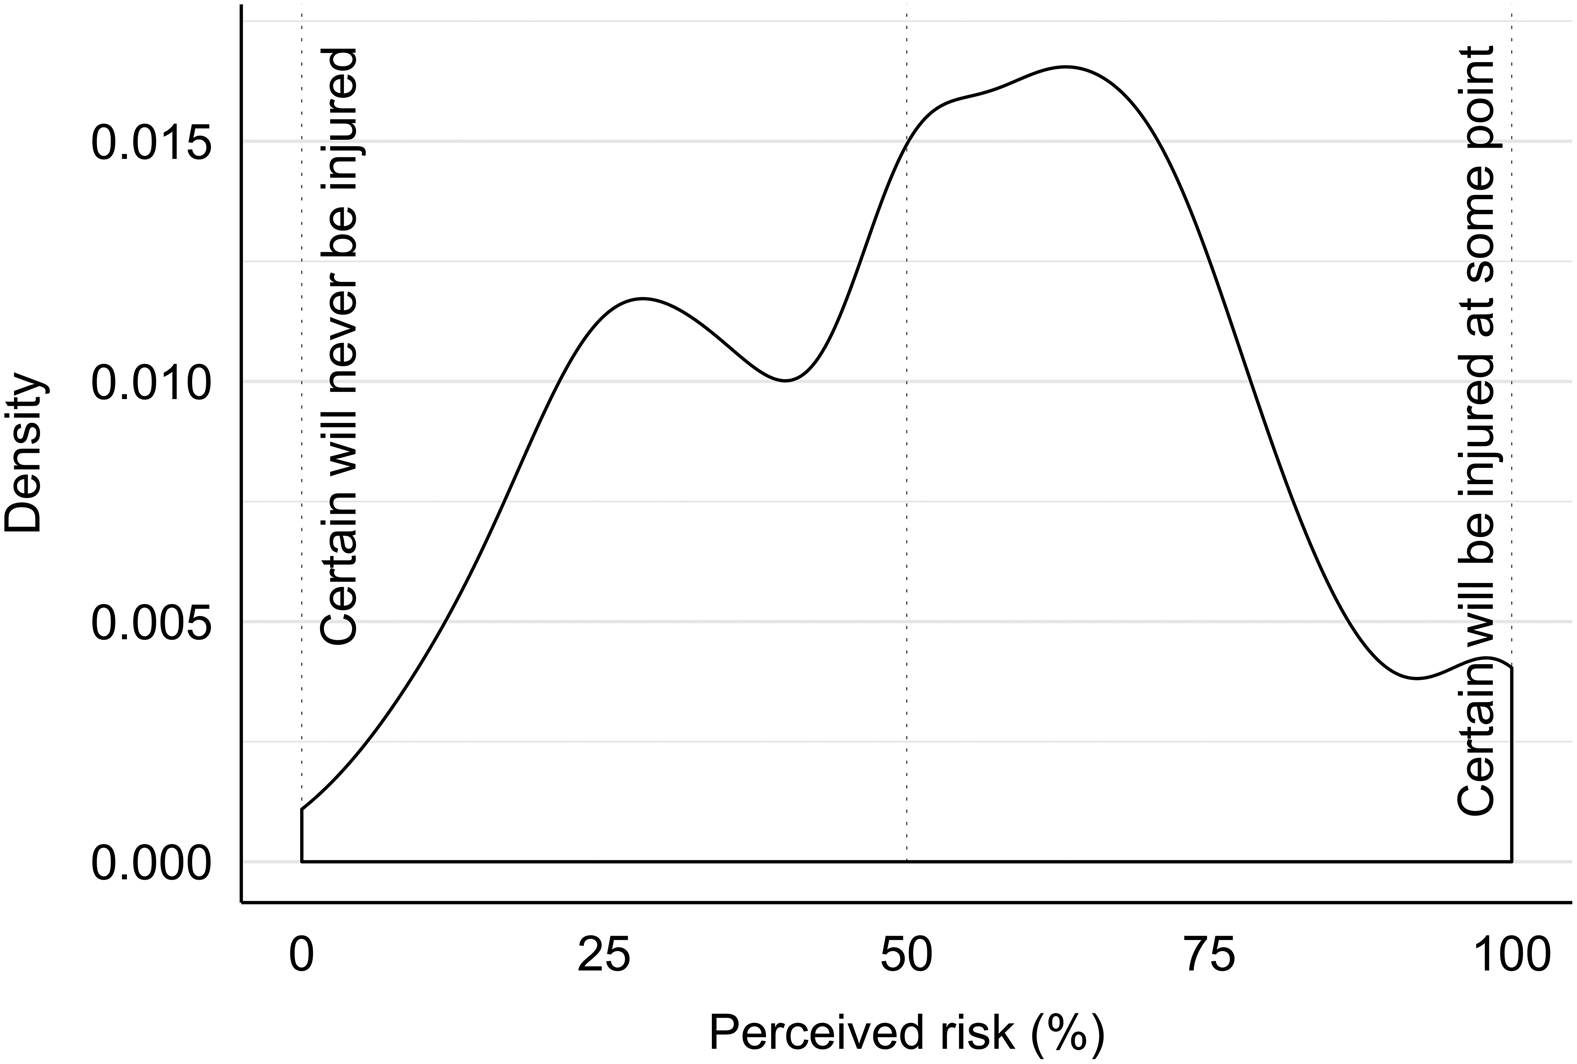
Density plot to demonstrate the distribution of perceived risk of paragliding (n=1226), from 0% (“certain will never be injured”) to 100% (“certain will be injured at some point”).
Logistic regression was performed to ascertain the effects of flying hours, currency, and risk perception on the likelihood of respondents reporting an incident or near miss in the survey. The fit of the logistic regression model was statistically significant (χ2 (3)=45.0, P<0.001). There were statistically significant increases in the likelihood of reporting an incident or near miss with increasing hours and increased perception of risk, and a reduction with a lengthening gap between flights (Table 2). Expressed in terms of odds, for each additional hour flown, the odds of having an incident or near miss were fractionally increased by a factor of 1.003; with every additional week’s gap between flights, the odds of having an incident or near miss were fractionally reduced by a factor of 0.976. Equally, with every percentage-point increase in perceived risk, the odds of having an incident or near miss were fractionally increased by a factor of 1.013.
Logistic regression of the effects of flying hours, gap between flights, and perceived risk on the likelihood of reporting an incident or near miss
Respondents were asked what proportion of their flights had been logged, on a 5-point scale (from “none” to “all”). The majority (n=1266, 77%) of respondents logged “most” or “all” of their flights. Respondents used 1 (or a combination of) flight instruments (n=868, 52%), paper or electronic logbooks (n=865, 52%), online tools (n=577, 35%), or other means (n=113, 7%). They were also asked how to indicate how their responses to the survey were generated (Figure 5), using another slider question (from 0 [“from memory”] to 100 [“from records”]). The responses clustered around each of the extremes. This was also reflected in, for example, the hours data, in which responses tended to either be very precise or were rounded to the nearest 10 or 100 h.
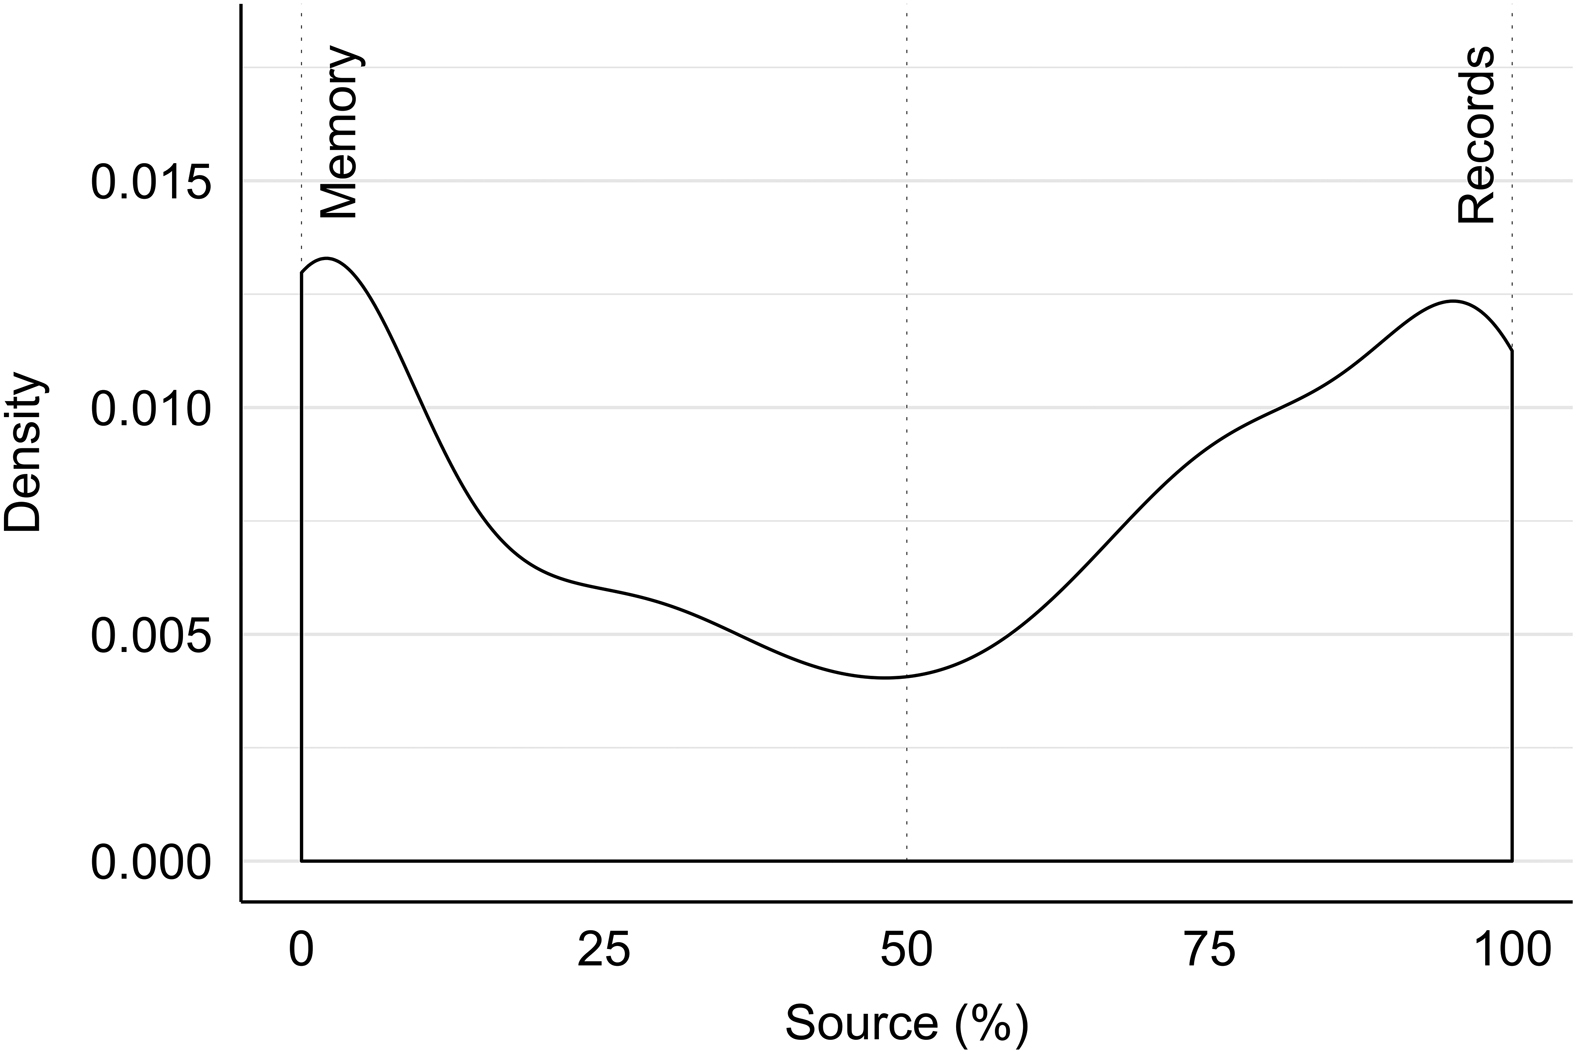
Density plot to demonstrate the distribution of how responses to questions were generated (n=1344), from 0% (“memory”) to 100% (“from records”).
The survey data yielded a rate of 29 incidents leading to serious injury per 100,000 flights. However, as described in the introduction, the survey could not have captured incidents severe enough for a pilot to have left the sport midway through the year or fatal incidents. Consequently, the flying activities reported by the BHPA respondents to the survey were used as a denominator for the EHPU incident database reports, which included midyear reporting and fatalities. Three-hundred sixty-eight (22%) of the respondents to the survey were members of the BHPA. Their age was 52±11 y, and they had been flying 12 (5–21) y and 373 (121–900) h.
In 2019, they flew 35 (16–70) h and 41 (21–70) flights each, making a total of 18,452 h in 20,382 flights. The majority flew throughout the year (n=214, 58%) on EN-B wings (n=193, 52%), and the longest gap between flights was 8 (5–13) wk. Eighteen BHPA members (5%) reported an incident, 5 (1%) involving a hospital stay longer than 24 h. Eighty-seven (24%) reported near misses. In these parameters, the BHPA subset was similar to the rest of the cohort surveyed (BHPA members flew slightly fewer hours per year and were slightly older) and to BHPA membership data for the same time-period.
If the activities of the BHPA respondents could be considered typical of BHPA members in general, then it could be estimated that the total hours flown by all BHPA members in 2019 was 188,475 h in 218,903 flights. In the EHPU incident database, there were 3.0 (2.5–4.3) fatal injuries and 44 (40–60) serious injuries per year among BHPA members in 2012–2019. The rates would therefore be 1.6 (1.3–2.3) fatalities and 23 (21–31) serious injuries per 100,000 h of paragliding, or 1.4 (1.1–1.9) deaths and 20 (18–27) serious injuries per 100,000 flights among UK paraglider pilots.
The database offered some additional insight into incidents, which corroborated the findings of the survey. Of the 1000 incidents reviewed, 26 (3%) had fatal, 387 (39%) serious, and 248 (25%) minor injuries, and in 339 (34%) cases the pilot was unhurt. Most injuries occurred during local flights (n=587, 59%) and training flights (n=245, 25%), rather than cross-country flights (n=62, 6%). The landing approach and landing were the flight phases most likely to lead to injury (n=393, 39%), followed by takeoff (n=206, 21%) and ridge soaring (n=189, 20%). Fatal injuries were predominantly those to the head and body, whereas serious and minor injuries were typically to the lumbar spine or limbs. The type of glider instability that led to injury was only specified in 440 reports (44%), but asymmetric collapse was most common (n=165, 38%), followed by spin (n=61, 14%) and frontal collapse (n=52, 12%).
Information on reserve parachute deployment was available for 270 (n=65%) of 413 incidents in which the pilot sustained serious or fatal injuries. The reserve parachute was not deployed in 256 incidents (95%). In the remaining 14 incidents, the reserve was deployed accidentally twice (causing injury) and deliberately on 12 occasions. Where deliberately deployed, it opened successfully on 6 occasions; there was insufficient altitude on 5 occasions but only a single “failure to open.” It could not be gathered from the data whether any of the fatally injured pilots had attempted to deploy their parachutes but failed.
Only 48 (5%) of the 1000 incident reports were due to equipment failure, of which 20 related to the harness, 15 to the wing, and 5 to the reserve parachute deployment handle. Seven incidents related to a failure of tow launching equipment. Eight hundred sixty-three (86%) reports alluded to some aspect of pilot error.
Discussion
In the survey, most flights were local, and most flying hours were spent in cross-country flight. (Cross-country flying involves leaving the vicinity of the takeoff hill to search for lift elsewhere, typically leading to a longer flight.) This distinction was important when considering “exposure” to paragliding, as exposure to the risks of launch and landing might be best expressed by numbers of flights, whereas exposure to the risks of flying would be better represented by time spent in the air.
There is a school of thought that pilots who fly regularly, building up hours while being acutely aware of risk, are less likely to be involved in incidents than those who fly rarely and perceive the sport to be very safe. These data suggested the contrary: that the likelihood of reporting an incident or near miss increased fractionally for every additional hour flown and decreased fractionally with every additional week's gap between flights. This ran counter to the “currency” model (“the more flying, the safer the pilot”) and instead pointed to an exposure model (“the more flying, the greater the risk exposure”). Intriguingly, with every percentage-point increase in perceived risk, the odds of having an incident or near miss were fractionally increased by a factor of 1.013. The distribution of hours in the sample was skewed heavily toward beginners, and it may be that these effects would no longer persist once pilots reached mastery, which might require 2000 h or more. 9
Paragliding appeared almost twice as risky as general aviation in the United Kingdom, which recorded 0.73 deaths and 11.2 serious injuries per 100,000 flights between 2012 and 2016. 10 It also had approximately twice the fatality rate of sport parachuting (skydiving), where the rate of fatal injuries was 0.74 per 100,000 in an analysis of 539,885 jumps (excluding tandem jumps, military parachuting, and airplane crashes). 11
The overwhelming majority of reports, in both the survey and incident database, alluded to some form of pilot error. As with the aforementioned incident rates, to make paragliding more comparable to other forms of aviation, these errors were grouped in the results using HFACS terminology. Despite the differences between paragliding and other forms of aviation, and the shortcomings of self-reported paragliding data, the results were like those from past analyses of commercial and general aviation in the literature (Table 3), classified by HFACS categories.12,13 Skill-based errors, in particular control input errors, were the most common. The higher number of decision errors and the lower number of violations in paragliding spoke of the greater responsibility placed on paraglider pilots to choose how, when, and where it was appropriate to fly, as well as the lack of rules, regulations, and procedures compared to other forms of aviation. The higher number of perceptual errors was again expected, given the reduced reliance on instrumentation in paragliding, although it was interesting to note that misjudgment of distance was also the most common perceptual error in general aviation. 13 Equally, in a detailed analysis of 125 sport parachuting fatalities, the most frequent causes of incidents were control errors, mid-air collisions, loss of altitude awareness, poor choice of equipment, and medical incapacitation. 14
Comparison of paragliding errors to those from commercial and general aviation
Frequencies (percentages) of causal factors in incidents, alongside analyses from commercial and general aviation classified by HFACS categories. Because the incidents often included more than 1 causal factor, the percentages in the table do not add up to 100%.
Unlike errors, which had much in common with other disciplines, the distribution of injuries was specific. This reflected both the energy and orientation of the impacts involved. With the pilot suspended in a harness and likely to impact vertically or with legs down, forces would be transmitted up through the lower limbs, pelvis, and back, with fractures at points of biomechanical vulnerability. Isolated limb and spinal injuries were the most common serious injuries reported. Indeed, lower limb fractures and compression fractures of the vertebrae at the junction of the thoracic and lumber spine (T12–L2) have also been reported in other canopy sports.15,16
Thirty percent of the incident and near miss reports included a wing collapse. This emphasized the importance of rotational forces and asymmetry in paragliding incidents, the necessity for pilots to train in the prevention and timely management of collapses, and for emergency equipment and procedures to be considered in that context. Strikingly, the reports in the EHPU incident database indicated that the reserve parachute was rarely deployed, even where it might have prevented injury or death. The foundation laid by this study, including the mapping of error to HFACS, is a bridge to more rigorous causal analysis in paragliding incidents. Traditional responses to incidents have focused on the unsafe acts themselves, be they errors or violations of procedure. These, by definition, were always too late.
Limitations
The study had 3 key limitations: low response rate, self-reporting, and limited generalizability. The response rate was low (25%, n=1788). This may have been due to the short window for response, the subject matter, or the perceived relevance or arduousness of the survey.
The organization and reporting structures in paragliding are patchy, reflected in the limited information available from the EHPU incident database. Reliance on self-reporting was therefore necessary (except for fatal incidents). Self-reporting is particularly problematic in extreme sports, given the limited training and the complex, dynamic environment. 17 Pilots may be unaware of all the factors that led to an incident, may misattribute their significance or their interactions, or may fail to correctly recall their own reactions. When flying solo, impairment due to environmental stress or medical incapacitation may go unrecorded. Because respondents were surveyed retrospectively rather than prospectively, their responses to the risk perception question may have been directly colored by whether they had an incident during 2019. Equally, any incidents or injuries had not caused respondents to leave the sport or stop their subscription to the magazine.
Finally, the results may not have been generalizable to the broader community of pilots. The respondents were a self-selected cohort who had already chosen to subscribe to a free flight publication. Cross Country magazine was written in English and the invitation and survey were delivered in English, so the study was biased toward English speakers. Respondents may have been more engaged with the sport (by virtue of subscribing to a magazine) than other pilots. Equally, they have been more or less experienced. There was no accepted definition of the “average pilot” against which to compare. Concerns around the generalizability of the sample were particularly acute for the incident rate estimates because they used the BHPA subset and the 368 BHPA respondents only equated to 7% of the 5385 members of the BHPA in 2019.
Given these limitations, both the incident rates and the conclusion of the logistic regression should be treated with caution and refined through continued study. Future approaches might include making a pilot’s annual flying license renewal contingent on providing activity and incident data or, alternatively, following a cohort of pilots prospectively. The cohort would be asked to log all flying activities, incidents, and near misses over several flying seasons (to account for variation in weather conditions). Then their reports could be corroborated with data from their flight instruments. This approach would also help assess the effectiveness of existing reporting systems.
Conclusions
It appeared that increased flying hours exposed pilots to a slight increase in risk, contrary to the belief that more flying reduces risk. Pilot errors in glider control and in decision-making, not in equipment malfunction, were the key issues, consistent with other disciplines. Future safety interventions should focus on improving back protection, pilot training, and glider control and encouraging timely reserve parachute deployment.
Footnotes
Acknowledgements
Acknowledgments: The statistical analyses in this chapter were reviewed by Dr Juliana Pugmire, University of Glasgow. We gratefully acknowledge the assistance of David Thompson (BHPA Senior Technical Officer) in obtaining the incident data and of Ed Ewing (Editor, XC Magazine) and the Lanarkshire and Lothian Soaring Club (LLSC) Committee in reviewing the survey instrument.
Author Contributions: Study concept and design (MW); acquisition of the data (MW); analysis of the data (MW); drafting of the manuscript (MW); critical revision and approval of final manuscript (all authors).
Financial/Material Support: None.
Disclosures: None.