
Abstract
Introduction
Wintertime thermal inversions can lead to the accumulation of small particulate matter (PM2.5). Despite an association between respiratory hospital admissions and elevated PM2.5 levels, many people continue to exercise outdoors during inversions. This study compared pulmonary function and exercise performance during periods of low and high ambient PM2.5 concentrations.
Methods
Forced vital capacity and forced expiratory volume in 1 s were measured outdoors before and after two 3200 m running time trials: one with low ambient PM2.5 (0.6–14.7 microgram·m-3), and the other during high PM2.5 (19.1–42.5 micrograms·m-3). A 10 cm visual analog scale (VAS) administered postexercise quantified subjective ratings of respiratory discomfort.
Results
The PM2.5 differential between trials was ≥18 micrograms·m-3 for 10 healthy runners. Despite feeling more respiratory discomfort (P=0.044) during the bad air trial (VAS: 4.6±1.8 cm) compared with the good air trial (VAS: 2.9±1.8 cm), the 3200 m run time (low PM2.5: 13:54±1:34 min:s; high PM2.5: 14:07±1:44 min:s) was not different (P=0.261) between trials. Postexercise forced vital capacity was not significantly different (P=0.846) between the low (4.86±1.00 L) and high (4.84±0.95 L) PM2.5 conditions. Similarly, the difference in postexercise forced expiratory volume in 1 s was not significant (P=0.750) between trials (4.22±0.89 L vs 4.23±0.85 L).
Conclusions
Neither run time nor pulmonary function of healthy adults were adversely affected by an acute bout of exercise in elevated ambient PM2.5, equivalent to yellow or orange on the air quality index.
Introduction
Air temperature typically decreases with increasing altitude, but this pattern reverses during a thermal inversion, with a warm air layer acting as a cap above a cold air layer. The right mixture of seasonal changes, meteorological events, and topography can facilitate a thermal inversion. For example, the combination of a high-pressure system over a narrow, snow-covered valley bordered by high mountains can be the optimal scenario for temperature inversions. 1 The inversion acts as a cap, not allowing air pollutants to escape. During persistent inversions that remain for days, air pollutants can accumulate to unhealthy levels. 1
Cache Valley in northern Utah is one such location that is susceptible to wintertime thermal inversions and the poor air quality that sometimes occurs with these episodes. 2 This is a rural, agricultural valley, with the population center (Logan, UT) tallying only about 50,000 residents. Despite its modest size, Logan is ranked 11th in the United States in the American Lung Association’s 2019 report on 24-h particle pollution, just behind the major metropolitan areas of Los Angeles (seventh), Salt Lake City (eighth), Seattle (ninth), and Pittsburgh (10th), but ahead of Phoenix (13th) and Sacramento (15th). 3 Furthermore, one of the worst single episodes of particulate air pollution in the United States occurred in Cache Valley during a wintertime thermal inversion in January 2004. 4 Thus, the magnitude of air pollution associated with a thermal inversion can be substantial.
The pollutant of greatest concern during inversions in Cache Valley is particulate matter of aerodynamic diameter ≤2.5 micrometer (PM2.5). PM2.5 is small enough to be deposited in the alveoli and is associated with an inflammatory response in human lung cells. 5 Correspondingly, a relationship exists between hospital visits for asthmatics and increased levels of air pollution that coincide with temperature inversions. A 41% increase in emergency department visits in Salt Lake City, Utah, occurred during inversions that lasted ≥4 d from 2003 to 2008. 6
The United States government created a color-coded system called the air quality index (AQI) to warn the public of dangerous air pollution levels. This color-coded system progresses from green (satisfactory with little to no risk) to yellow, orange, red, purple, and maroon (emergency conditions). PM2.5 is one of the pollutants included in the AQI. For more about the AQI, visit the United States government’s AirNow website. 7
Despite known health risks and the AQI to warn the public, some individuals still exercise outdoors during inversions with high PM2.5 levels. Theoretically, aerobic exercise should exacerbate the health risks associated with air pollution because ventilation rate and depth are increased during exercise. 8 Consequently, the more vigorous the exercise the greater the dose of pollution for a given PM2.5 value. Research documenting the effects of acute PM exposure on aerobic performance is lacking, but there is some evidence of impairment when exposure is chronic. For example, Chinese children living in a high-pollution district had a reduction in predicted maximal oxygen consumption (VO2 max) of 1.53 mL·kg-1·min-1 per 10 micogram·m-3 increase in annual mean PM10 compared to children living in less polluted districts. 9 The authors noted that the reduction of cardiorespiratory fitness was due to long-term exposure and was independent of short-term exposure.
We previously studied the health and performance effects of a 20-min cycling time trial during elevated ambient PM2.5 and found no negative effects on pulmonary function, markers of inflammation, or exercise performance. 10 However, thermal inversions were uncharacteristically mild that winter, and the PM2.5 was elevated to only the yellow range on the AQI. Thus, our goal was to follow up the previous study with another exercise bout during an episode of more severe air pollution. The aim of the present study was to compare pulmonary function and 3200 m run times during trials with low and high ambient PM2.5 concentrations.
Methods
Study Design
The study design was within-subjects repeated measures, such that each participant ran a 3200 m time trial under 2 conditions: 1 during a “green” AQI day with PM2.5 <12.0 microgramd·m-3 and the other during a “yellow” or “orange” AQI alert day with PM2.5 >12.0 micrograms·m-3. Trial order was randomized to an extent, but the investigators conducted as many tests as possible when a strong thermal inversion with the likelihood of high PM2.5 pollution was present. Consequently, only 2 of 10 participants ran their low PM2.5 trial first. We did not detect any influence of trial order. Projected inversions were anticipated using a variety of weather forecasting tools in an effort to notify participants in advance of a planned testing day. These forecasting tools included the inversion forecast from the Utah Climate Center at Utah State University 11 and the air quality forecast for Cache County from the Utah Department of Environmental Quality (DEQ). 12
Participants
Regular exercisers were recruited by word of mouth and by using research flyers posted throughout the university campus. Inclusion criteria were age of 18 to 35 y and regular performance of at least 150 min·wk-1 of aerobic physical activity. Additionally, potential participants verbally confirmed that they were fit enough to give a maximal effort on a 3200 m run and that they planned to exercise outdoors throughout the winter, even in potentially cold weather or during bad air quality days. Exclusion criteria included known respiratory disease, including asthma. Prospective participants completed the physical activity readiness questionnaire to screen for major health concerns. All participants signed a written informed consent document approved by the institutional review board of Utah State University (protocol #7158) that detailed the procedures, risks, and benefits of study participation. Participants were paid $20 for completing the study.
Preliminary Procedures
Consent was obtained indoors in the exercise physiology laboratory. Subsequently, height was measured to the nearest 0.1 cm with a wall-mounted stadiometer (Seca 216, Seca Corp., Ontario, CA), and weight was measured to the nearest 0.1 kg with a digital scale (Seca 869, Seca Corp., Omtario, CA). Forced vital capacity (FVC), forced expiratory volume in 1 s (FEV1), and peak expiratory flow (PEF) were measured with a Micro 1 hand-held spirometer (Micro Direct, Inc., Lewiston, ME) using the standardized spirometry procedures outlined by the American Thoracic Society. 13 This initial indoor pulmonary function test served as a baseline.
Testing Procedures
All trials were completed during February 2016. All time trials were conducted on an outdoor all-weather 400 m running track at the local high school/community center. The inside lane of the track was cleared of ice and snow prior to all testing for the safety of the participants and to ensure consistent track conditions. Each 3200 m time trial was run individually to eliminate the psychology of competing or pacing with other runners. The protocol for each trial consisted of 1) the pretrial pulmonary function test measured outside, 2) a 5-min self-selected warm-up, 3) 3200 m time trial run with postexercise heart rate collected immediately (within 5 s) upon crossing the finish line, 4) 5-min recovery cool-down, 5) completion of a visual analog scale (VAS), and 6) posttrial pulmonary function test measured outside. Participants were instructed to “give their best effort” for each 3200 m run trial. Time was measured with a standard stopwatch (Champion Sports, Marlboro, NJ), and heart rate was measured with a Polar FT1 heart rate monitor (Polar Electro Inc., Bethpage, NY). The VAS served as a subjective measurement of the participants’ “respiratory distress.” Participants simply placed a single pencil hash mark on a 10 cm line that served as a continuum, with the anchor of one end of the line being “none” and the other end being “severe.” The VAS is a commonly used measurement of pain and thought to be a valid assessment of the intensity or magnitude of discomfort. 14 The hourly data for Cache County from the Utah DEQ website 12 was used to record the PM2.5 value at the time the participant ran. The corresponding temperature was obtained from the National Weather Service.
Statistical Analyses
Data were checked for normality with Shapiro-Wilks tests. Means and standard deviations were calculated. Mean differences in the run times, immediate postexercise heart rate, and VAS between trials of low and high PM2.5 were evaluated with paired t tests. Mean differences from the spirometry tests (FVC, FEV1, and PEF) were analyzed with a 2-way repeated-measures analysis of variance (time [baseline, pre, post] × PM2.5 condition [low, high]). Main effects were analyzed with a Bonferroni adjustment. A P-value of <0.05 was accepted as statistically significant. All statistical analyses were conducted using SPSS version 25 (IBM, Inc., Armonk, NY).
Results
Twenty-five people completed the preliminary screening. The intent was to have all 25 complete both 3200 m running trials; however, strong inversions did not develop during the latter portion of the winter. Consequently, only 13 completed two 3200 m trials. The differential in PM2.5 between the 2 trials was low (<10 micrograms·m-3) for 3 participants, so their data were excluded. The trial for 1 runner’s “good” air day occurred with a PM2.5 of 14.7 micrograms·m-3, which corresponds to a “yellow” AQI; however, this participant was retained because the PM2.5 for the other trial was 42.5 micrograms·m-3 (an “orange” AQI). The PM2.5 for the other 9 participants (0.6 to 6.0 micrograms·m-3) was well within the green AQI for their “good” air trial. The high PM2.5 trial occurred during either a yellow (n=3) or an orange (n=7) AQI for all participants. Thus, the analyzed data were for 10 participants (8 males, 2 females). The lowest differential in PM2.5 between trials for these remaining 10 participants was 18.0 micrograms·m-3; thus, there was a clear distinction between “good” air and “bad” air trials for these runners. The sample was homogeneous and could be described as young (20.9±1.9 y) with a normal body mass index (21.8±2.2 kg·m-2).
Given the reduced number of participants from the planned sample of 25, a post hoc power analysis was run using the observed values for sample size (n=10), alpha, and effect size. Statistical power was ≥95% for main effects of each of the pulmonary function measures. However, power dropped to 52% for run time.
All data were normally distributed (P>0.05) with no statistical outliers. Table 1 compares the low PM2.5 trial and the high PM2.5 trial for all variables of interest. Figure 1 displays individual changes in run time and measures of pulmonary function between the 2 trials. The difference in PM2.5 levels between trials was significant, as was the subjective respiratory distress (VAS) immediately following the high PM2.5 run. Furthermore, the change in VAS scores between trials was significantly correlated with the change in run times (r=0.681; P=0.030). However, the differences in run times, immediate postexercise heart rate, and pulmonary function measurements were not significantly different between trials. The main effect of time was significant for FVC (P=0.009) such that FVC was higher prerun than postrun, but the difference in FVC between low and high PM2.5 conditions was not significant (Table 1). There were no significant differences (P>0.05) in the other spirometry measures (FEV1 and PEF) or the time × PM2.5 condition interactions (P>0.05).
Comparison between 3200 m run trials during conditions of low and high PM2.5
FEV1, forced expiratory volume in 1 sec; FVC, forced vital capacity; PEF, peak expiratory flow; VAS, visual analogue scale.
Data are presented as mean±SD with range and 95% confidence intervals in parentheses.
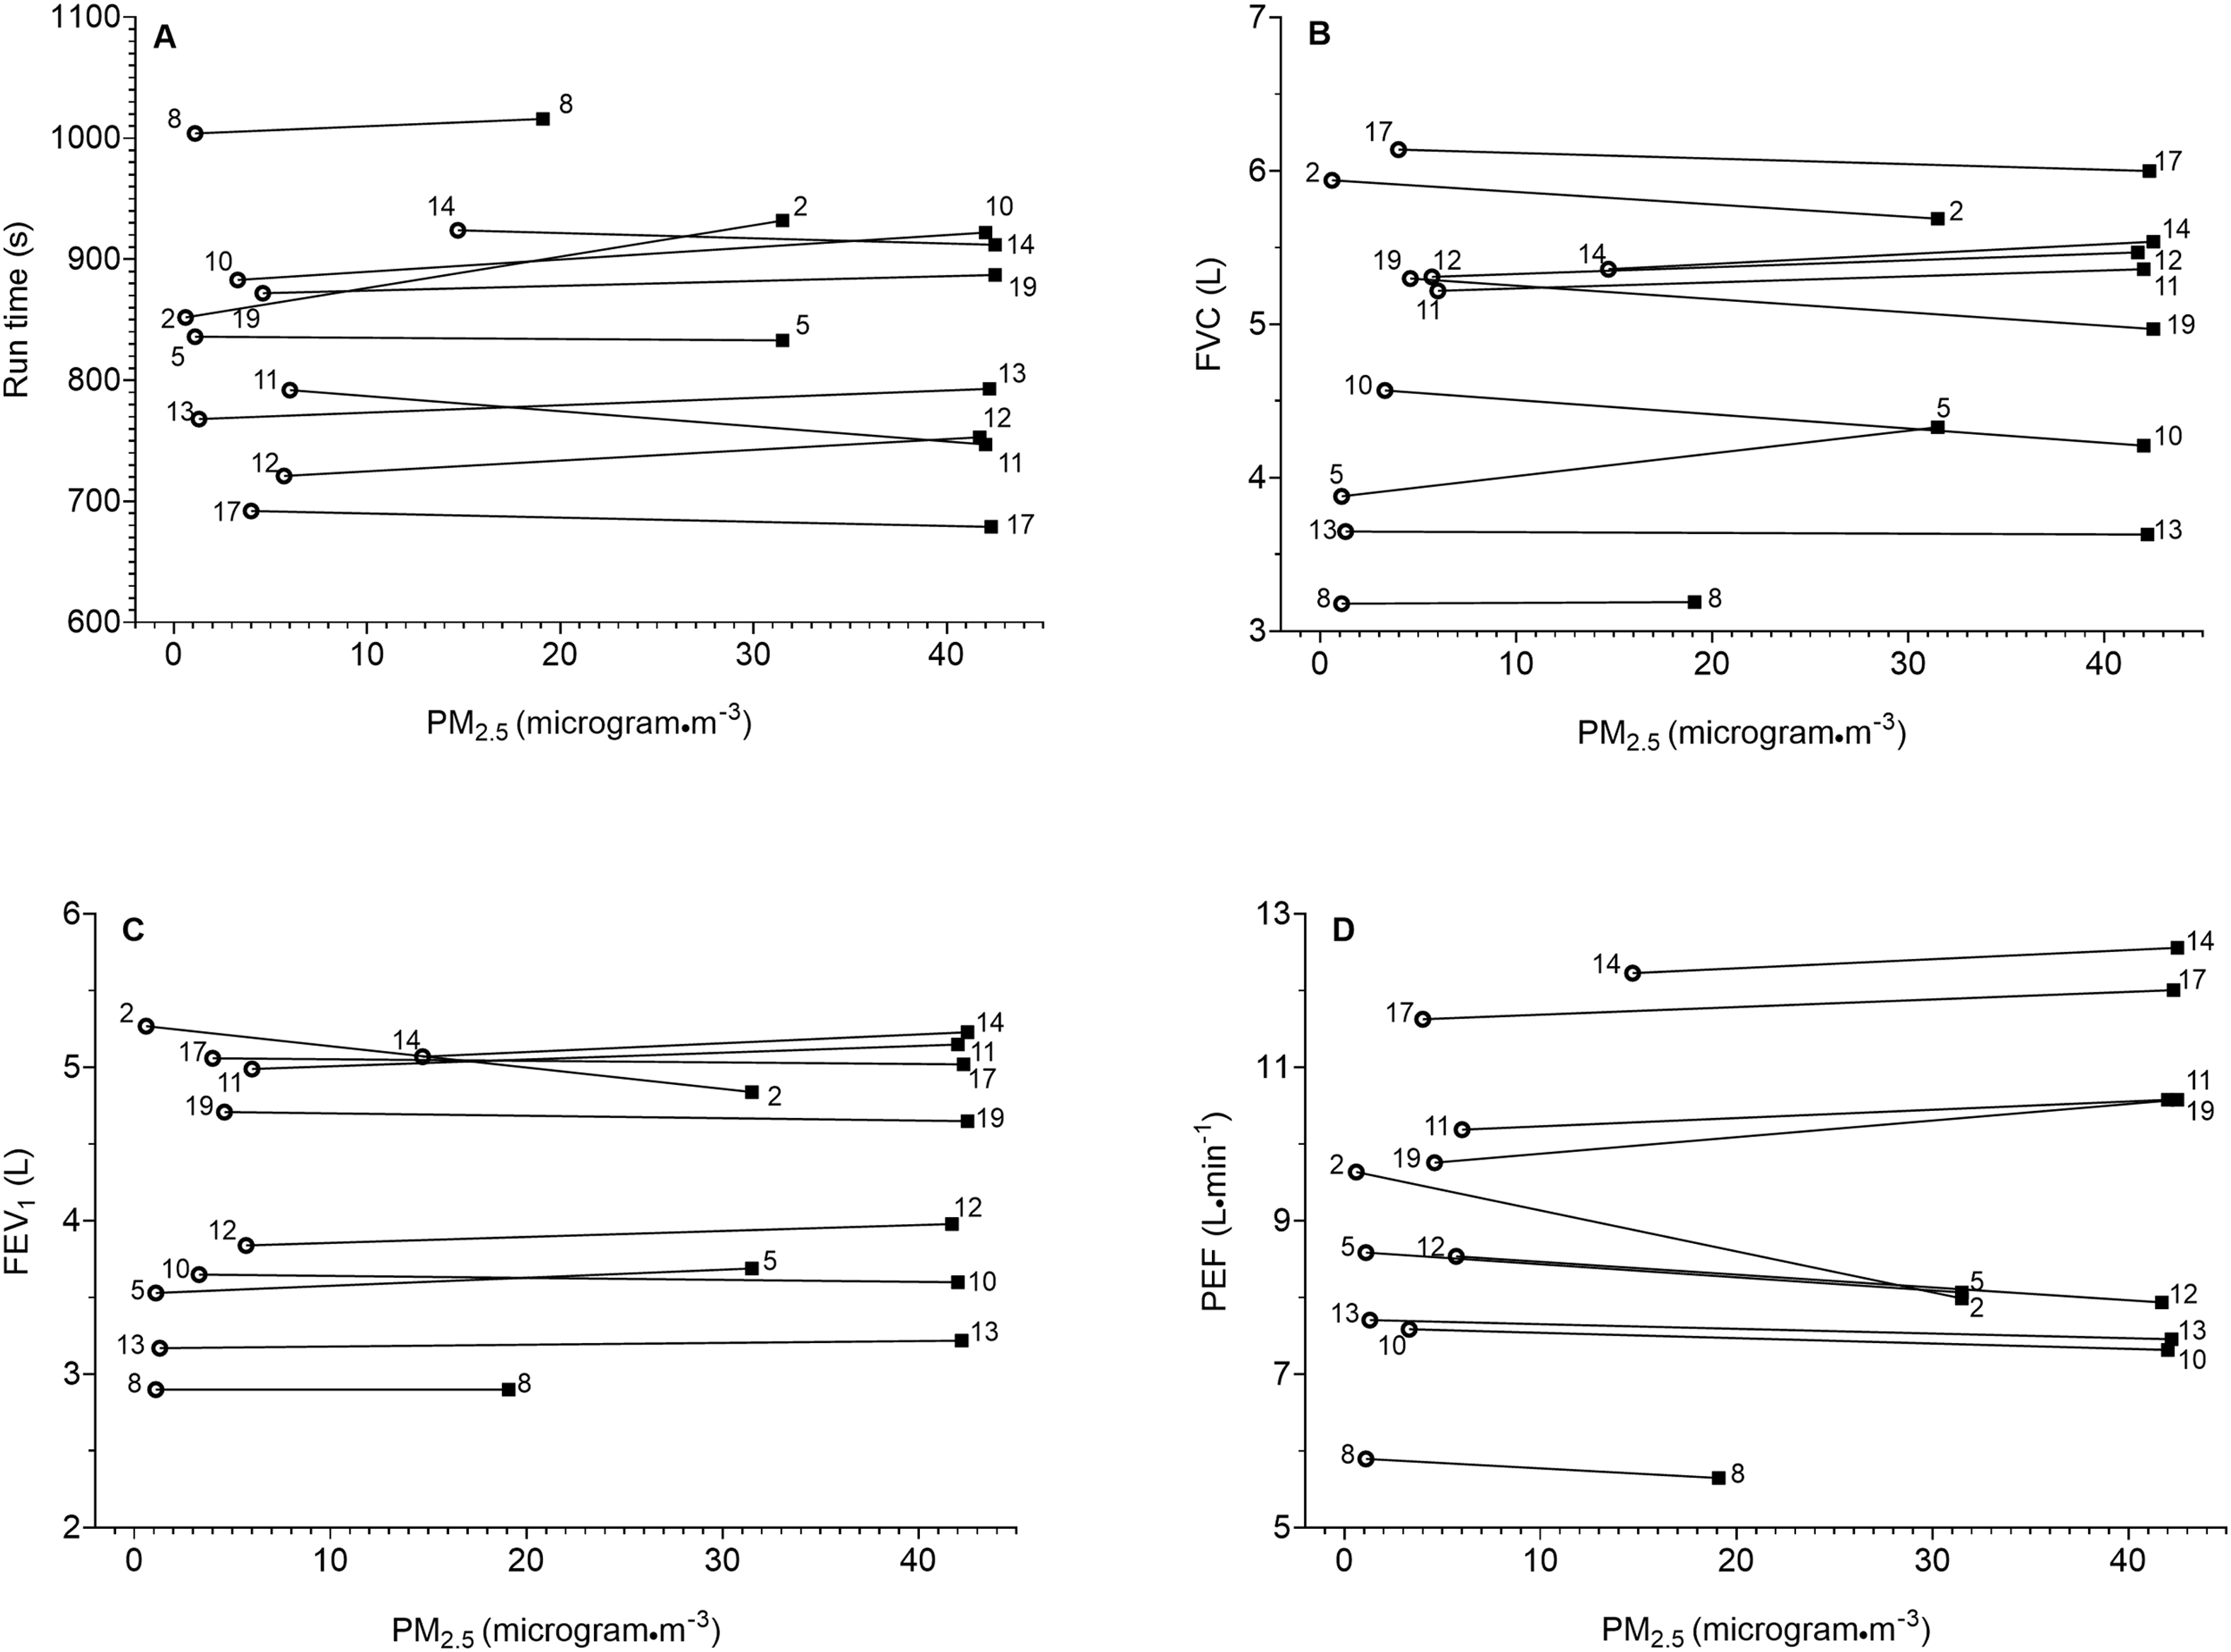
Individual change between low and high PM2.5 trials for (a) run times, (b) FVC, (c) FEV1, and (d) PEF. Open circles represent low PM2.5 trial and dark squares represent high PM2.5 trial. Subject participant numbers are next to the markers. FEV1, forced expiratory volume in 1 s; FVC, forced vital capacity; PEF, peak expiratory flow.
Discussion
Previously, we attempted to study the effects of ambient PM2.5 pollution on aerobic exercise, but the study was limited by mild thermal inversions yielding only small increases in PM2.5. 10 The highest PM2.5 concentration during that study was only 17.7 micrograms·m-3, corresponding to yellow AQI, and the mean difference between high and low PM2.5 trials was only 9.3±3.0 micrograms·m-3. Thus, there was not much of a difference in the PM2.5 concentration between trials of good air quality and diminished air quality in the previous study. In contrast, the present study occurred during a persistent inversion with much higher PM2.5 concentrations. Participants ran in PM2.5 concentrations as high as 42.5 micrograms·m-3, corresponding to orange AQI. Furthermore, the differential in PM2.5 between runs completed in good and poor air quality was at least 18.0 micrograms·m-3, and this differential averaged 33.5±6.9 micrograms·m-3; thus, there was a marked difference in air quality between the 2 trials in the present study. However, despite participants subjectively feeling more respiratory distress during the high PM2.5 trial, as evidenced by significantly higher VAS scores, the poor air quality did not affect run times or pulmonary function. This finding of a nonsignificant difference for run time should be interpreted cautiously because the study may have been underpowered for this analysis given the small sample size and the variability in performance across the sample.
It is important to note that study participants were young, healthy, and fit with no self-reported respiratory ailments. The warning for an orange AQI is that “members of sensitive groups may experience health effects; the general public is not likely to be affected.” 7 Our findings support this statement; there were no obvious negative consequences for pulmonary function and aerobic performance for healthy adults exercising in orange AQI conditions even though the exercise bout was vigorous. The results could have been very different if the participants had respiratory or cardiovascular disease. For example, decreases in peak oxygen consumption of 15% per 10 micrograms·m-3 increase in ambient PM2.5 have been reported for patients undergoing cardiac rehabilitation. 15 This decrement was observed even at low PM2.5 concentrations within the standards for acceptable air quality.
Our findings of no negative impact on pulmonary function and run performance should be interpreted with caution. It would be a mistake to assume that there is no increased health risk to exercising outdoors in conditions of elevated PM2.5 concentration. To the contrary, hundreds of studies document a relationship between diminished air quality and increased hospital visits for those with asthma. Additionally, a significant correlation specific to elevated PM2.5 during inversions and increased emergency department visits has been reported. 6 The health implications for individuals without respiratory disease exercising outdoors in high PM2.5 conditions are not as well documented, but laboratory research suggests that even small amounts of PM2.5 are damaging to healthy lungs. A single low dose of PM2.5 caused lung tissue inflammation and oxidative stress in healthy mice. 16 Similarly, significant gene level upregulation associated with the inflammatory response occurred when cultured human bronchial epithelial cells were exposed to Cache Valley PM2.5. 5 Based on these studies, a more appropriate interpretation of our findings is that pulmonary function and exercise performance are simply not precise enough measures to be influenced by an acute exposure of moderate levels of PM2.5.
Very high concentrations of PM2.5 may be needed to negatively affect FVC, FEV1, PEF, and exercise performance in healthy individuals. For example, 12 fit males completed 2 running bouts at 85 to 90% of maximal heart rate for 30 min: 1 on a campus free of vehicle traffic and the other near a major highway with high particulate pollution from vehicle emissions. The high-exposure site had PM1 levels 34 times greater than the low PM1 site. Although there was a statistically significant decrease in FEV1 following the exercise at the high PM1 site, the researchers noted that the decrease was not clinically relevant. 17 Thus, even with large increases of pollution, pulmonary function might not be precise enough to detect changes from an acute pollution exposure. Likewise, changes in exercise performance may not match the deleterious effects of acute pollution exposure, just as changes in performance were not observed after acute cigarette smoking. Researchers demonstrated that smoking 2 cigarettes immediately before running on a treadmill did not significantly affect work capacity at an intensity of 4 mmol of blood lactate or a heart rate of 170 beats·min-1. 18 The authors theorized that 2 cigarettes did not create a high enough concentration of the pollutant (carbon monoxide, in the case of smoking) to negatively affect oxygen transport enough to be observed during an exercise test. Thus, although it is widely accepted that each cigarette smoked has negative health consequences, exercise performance can be maintained after acutely smoking; the same outcome of negative health consequences but sustained exercise capacity is likely true of acute PM2.5 exposure.
Conducting an exercise study in ambient air pollution provides a more “real world” condition than a laboratory-based study of individual pollutants. However, administering trials during thermal inversions with variable PM2.5 concentrations presents many logistical challenges, and we offer these points to consider for investigators who might want to follow this line of research. First, although thermal inversions can be predicted and anticipated, like any weather forecast, there is considerable variability in predicting with a high degree of accuracy when a thermal inversion will occur. Second, the presence of a thermal inversion does not necessarily result in a high concentration of PM2.5. However, when a thermal inversion persists for several days, air quality tends to progressively worsen. Third, like temperature and wind speed, PM2.5 concentration is variable throughout the day. Because of the difficulty of predicting high PM2.5 concentrations, both the investigative team and study participants need to be available and willing to participate on short notice. Fourth, because of the nature of thermal inversions, exercise trials typically take place when the weather is very cold. Additionally, snow-covered ground facilitates a thermal inversion, so investigators must clear the testing area for participant safety.
Limitations
Some of the logistical challenges led to study limitations. Although an attempt was made to conduct the low PM2.5 trial and high PM2.5 trial under similar temperatures, it was significantly colder during the high PM2.5 pollution trial. This did not appear to affect the performance of our participants, but it could have been a contributing factor in the difference in VAS between trials. Our participants lived in Cache Valley and thus were acclimated to the cold and accustomed to exercising in it. Nevertheless, cold stress can potentially degrade aerobic performance 19 and postexercise spirometry. 20 Another potentially confounding factor from the cold was that the Micro 1 spirometer was used in temperatures below the manufacturer’s recommendations. However, the spirometer was calibrated indoors with a 3 L calibration syringe (series 5530, Hans Rudolph, Inc., Kansas City, MO) before and after outdoor trials, and it held calibration. Furthermore, the pulmonary function values for all trials were within the predicted values for the age, sex, and height of our participants.
The PM2.5 concentrations were obtained from the Utah DEQ weather station in Cache Valley. These data are available only as an hourly average, so the real-time concentration at the time the participant was running could vary from this hourly average. Additionally, this station was located several miles away from the running track where the trials took place. According to a Cache Valley air pollution expert, the PM2.5 concentration is fairly consistent along the valley floor during thermal inversions (R. Martin, personal communication, January 2016). Nevertheless, there was likely some variation in PM2.5 concentration between the testing site and the DEQ PM2.5 monitor. Small, portable monitors such as the Airbeam (HabitatMap, Inc., Brooklyn, NY) now allow for site-specific measurement of PM2.5 concentration. These were not available at the time of this data collection but may offer a solution for future investigations. However, several recent environmental field investigations have showed that although these miniaturized monitors have good reliability, they are only moderately correlated with reference measures and tend to be biased with increasing PM2.5 concentrations.21,22 The best solution for future research to overcome this limitation might be to conduct trials as close to the DEQ monitors as possible.
Another limitation was that it was impossible to blind the participants to the PM2.5 condition. To individuals familiar with thermal inversions, as our participants were, it is obvious when a persistent inversion is in place. Additionally, the media alert the community to the AQI color during inversions. Thus, our participants knew when they were running in the high or low PM2.5 condition. This knowledge could have subconsciously influenced or biased their VAS, as the VAS is a subjective measurement.
Finally, the small sample size is a limitation. The greatest impact of the reduced sample size on the study was found for the run time variable. Even though participants were an average of 13 s slower during the high PM2.5 condition, this was not statistically significant. Additionally, heart rates were recorded only at the finish line. Because runners were trying to achieve their best time, they may have accelerated approaching the finish; thus, the immediate postexercise heart rate is likely higher than their average heart rate over the entire 3200 m distance.
Conclusions
Young, healthy adults felt more respiratory distress running a 3200 m time trial on a day with elevated PM2.5 compared to a low PM2.5 day. However, there were no significant differences in running time, immediate postexercise heart rate, FVC, FEV1, or PEF between trials. Previous research suggests that even a small dose of PM2.5 air pollution has negative health consequences, but our findings indicate that tests of pulmonary function and exercise performance are not precise enough to be influenced by acute exposures of moderate amounts of PM2.5. However, our findings are limited to a small study sample (10 healthy, recreationally active adults), distance run (3200 m), and elevated PM2.5 exposures of 19.1 to 42.5 micrograms·m-3.
Footnotes
Acknowledgments
We appreciate the efforts of Devin Vance, Levi Brandley, Andrea Thomas Brandley, and Jake Stark in helping to clear the track of snow and ice and provide assistance with participant recruitment and data collection.
Author Contributions: Study concept and design (DRW); obtaining funding (DRW); acquisition of the data (DRW, DCB); analysis of the data (DRW, DCB); drafting of the manuscript (DRW); critical revision of the manuscript (DCB); approval of final manuscript (DRW, DCB).
Disclosures: None.
Funding
Financial/Material Support: This research was funded by a Seed Program to Advance Research Collaborations (SPARC) Grant from the Office of Research and Graduate Studies at Utah State University.