
Abstract
Introduction
Previous research identified a trend for increasing numbers of injuries sustained while rock climbing. This study investigates whether that trend continued and describes characteristics of climbing injuries.
Methods
The National Electronic Injury Surveillance System registry was searched for rock climbing injuries in US emergency departments in 2008 through 2016 among patients aged ≥7 y. Variables included each patient's age, diagnosis, injured body part, mechanism of injury, and disposition. Injuries were graded using International Mountaineering and Climbing Federation injury grades. National estimates were generated using sample weighting.
Results
An estimated 34,785 rock climbing injuries were seen in emergency departments nationally, a mean of 3816 per year (SD 854). The median age of injured climbers was 24 y (range 7–77), with those aged 20 to 39 y accounting for 60% and males for 66%, respectively. Fractures (27%) and sprains and strains (26%) were the most common types of injuries. The most frequently injured body parts were lower extremities (47%), followed by upper extremities (25%). The most commonly fractured body part (27%) was the ankle. The knee and lower leg accounted for 42% of all lacerations and were 5.8 times as likely as lacerations to other body parts. Falls were the most common mechanism, accounting for 60% of all injuries.
Conclusions
This study reports continued increase in annual numbers of climbing injuries. Whether this is based on a higher injury rate or on a higher number of climbers overall cannot be stated with certainty because no denominator is presented to estimate the injury rate among climbers.
Introduction
Rock climbing, and especially indoor climbing, is an increasingly popular sport worldwide. 1 With climbing's inclusion into the Olympic program for Tokyo in 2020, this trend will likely continue. 2 With the increased popularity of competitive sport climbing, an increase in injury rate and severity may be expected. 3 Although the sport of rock climbing originated from mountain climbing, it was developed into a sport in itself within the 1980s and early 1990s, based on the free climbing scene in Yosemite Valley. A parallel development occurred in the Elbsandstein in former East Germany.4,5 An analysis of the separate disciplines of climbing shows that overall, alpine (traditional) climbing has higher injury risk than sport and indoor climbing. 6 –10 Alpine and ice climbing have more objective dangers that affect climber safety. 5 In alpine climbing, injuries mostly occur through falls and affect the lower extremity. 1 ,5,11,12 Most injuries in sport climbing are overstrain injuries of the upper extremity while performing a strenuous move. 5 ,11,12 In bouldering, many injuries are related to the foot and ankle, resulting from falls. 3 Objective reporting of injury site and severity vary between studies according to injury definition and methodology used.5,12 This creates differences in injury/fatality metrics and conclusions that, in turn, make interstudy comparisons difficult.5,13 To minimize these differences, in 2011 the International Mountaineering and Climbing Federation (UIAA) Medical Commission developed an injury grading system that was proposed to be used in future climbing studies. 13 The 6 UIAA grades of injury severity are shown in Table 1.
International Mountaineering and Climbing Federation injury classifications 16
Modern belay and safety equipment evolved, and studies in the 1990s on rock climbing injuries showed a higher injury rate and severity than more recent analyses5,11,14–16 With improved belay and safety equipment, injury rates may be expected to decline. On the other hand, new techniques and dynamics (eg, high indoor climbing walls) may increase injury rates.2,3 Thus, regular re-evaluation of injuries associated with climbing is necessary. This may be through studies of climbing populations,7,12,17–24 patients in certain centers that focus on climbing injuries,25,26 injuries at certain climbing walls over time, 8 competition,10,27 a competition circle, 21 web-based questionnaire, 17 or analysis of national data banks. 1 National datasets, in particular, offer the chance for longitudinal research.
Nelson and McKenzie 1 evaluated the National Electronic Injury Surveillance System (NEISS) registry for rock climbing injuries treated in US emergency departments (ED) in the years 1990 to 2007. Within this period there was a rise in annual ED presentations for rock climbing injuries, from an estimated 1617 cases in 1990 to an estimated 2637 cases in 2007. 1 Following the same criteria as Nelson and McKenzie, 1 this study aimed both to establish whether growth in rock climbing injuries continued after 2007 and whether the demographic/distribution of the injuries differed between the previous study and 2008 to 2016. In addition, injuries were graded with the UIAA score 13 to enable comparison with other studies presenting or reviewing injury severity. 5 ,11,28
Methods
The Consumer Product Safety Commission (CPSC) maintains the NEISS, a national register of ED presentations collected from around 100 hospitals in the United States and US territories. Probability weighting enables the sample to extrapolate national estimates for the ∼5000 EDs in the wider United States and US territories. In essence, the NEISS sampling frame consists of 5 strata, 4 according to hospital size and the fifth being children's hospitals. Hospital weightings are initially equal to the inverse of the probability of selection at the stratum level, which are then adjusted for nonresponse or hospital mergers. The total number of ED visits each year is used to generate a ratio adjustment to the weighting of each hospital, based on the anticipated number of hospital visits for the NEISS sample of hospitals. In this way, the weightings are adjusted each year to match the actual number of ED visits to hospitals in the NEISS sampling frame, which are a known quantity suitable for calibrating the weights. 29 Whenever a hospital is removed from the sampling frame, the highest ranked hospital within the same stratum is invited to replace the departing hospital. Because weights are recalibrated each year, longitudinal analyses of national estimates are possible even with a dynamic sampling frame; each year, the previous year's de-identified data are made available through the CPSC website.
NEISS data for 2008 to 2016 were imported into Windows Notebook as tab-delineated text. Product code 1258 identifies injuries related to “climbing gear/equipment” in the NEISS dataset. 1 Initially, 1089 cases were identified as involving product code 1258. Each case narrative was read, and cases involving children aged 6 y or less (n=27) were excluded, as were cases not involving rock climbing (n=178), such as injuries from ice climbing, mountaineering, or other activities not associated with rock climbing. The remaining dataset included 884 presentations to US ED for rock climbing injuries in persons aged 7 y or older. A human research ethics application was submitted to the institutional review board of the Divers Alert Network, but this analysis of publicly available de-identified data was ruled exempt from requiring approval.
VARIABLES
As with the Nelson and McKenzie study, 1 data regarding each patient's age, diagnosis, injured body part, and disposition were classified into categorical variables. Three age groups were formed: 7 to 19 y, 20 to 39 y, and ≥40 y. Diagnoses were classed as soft tissue (including abrasions, contusions, hematomas, and crush injuries), lacerations (including punctures and avulsions), sprains and/or strains, dislocations, fractures and amputations, concussions, and other. All injuries were graded using the UIAA score for injury severity. 13 Injured body parts were classed as involving the head (including the neck, face, ears, eyes, and mouth), torso (including the upper and lower trunk, hips, and pubic region), upper extremities (including the shoulders, arms, hands, and fingers), lower extremities (including the legs, ankles, feet, and toes), or other (including injury codes for other, internal injuries, 25–50% of the body, and all parts of the body). Disposition was classed as not hospitalized (left without being seen, treated and released, or held for observation for <24 h) or hospitalized (admitted or transferred to another hospital). Each case narrative was read, and, where noted, fall height was classed as ≤6 m (20 ft), or >6 m (20 ft). The mechanism of injury was classed as an overexertion (eg, felt pain while performing a move), struck by an object, a hit or strike, a fall, or other.
ANALYSIS
Data were imported into SAS version 9.4 (SAS, Cary, NC) for analysis. With the exception of the total number of NEISS cases, reported data represent national estimates, and all statistical tests were performed on national estimates. The dataset met CPSC criteria for reliability (ie, >20 actual cases in any 1 cell, >1200 estimated cases nationally, and a coefficient of variation <0.3). 30 Parametric bootstrapping was performed to estimate the mean number of rock climbing injuries seen nationally each year in US EDs, with a 95% CI and SD. Linear regression was performed to assess any trend in the annual estimated number of injuries. Variables of interest were compared between binary variables using χ2 tests with Cochran-Mantel-Haenszal odds ratios and 95% CIs. No tests for significant differences were performed in this study; however, the number of odds ratios presented requires that readers exercise caution when interpreting 95% CIs that approach 0 at either limit.
Results
Between 2008 and 2016, there were 3,441,545 ED presentations recorded, representing a national estimate of 127,206,510 injuries. Of these, 884 (0.03%) were attributed to rock climbing, representing 34,785 nationally (0.03%), a mean of 3816 per year (95% CI 2107–5525, SD 854). The estimated annual number of cases is presented in Figure 1 with a linear trendline. The gradient of the trend for the increasing number of cases per year is given in Equation 1, where y is the number of years after 2007, and n is the national estimate of cases.
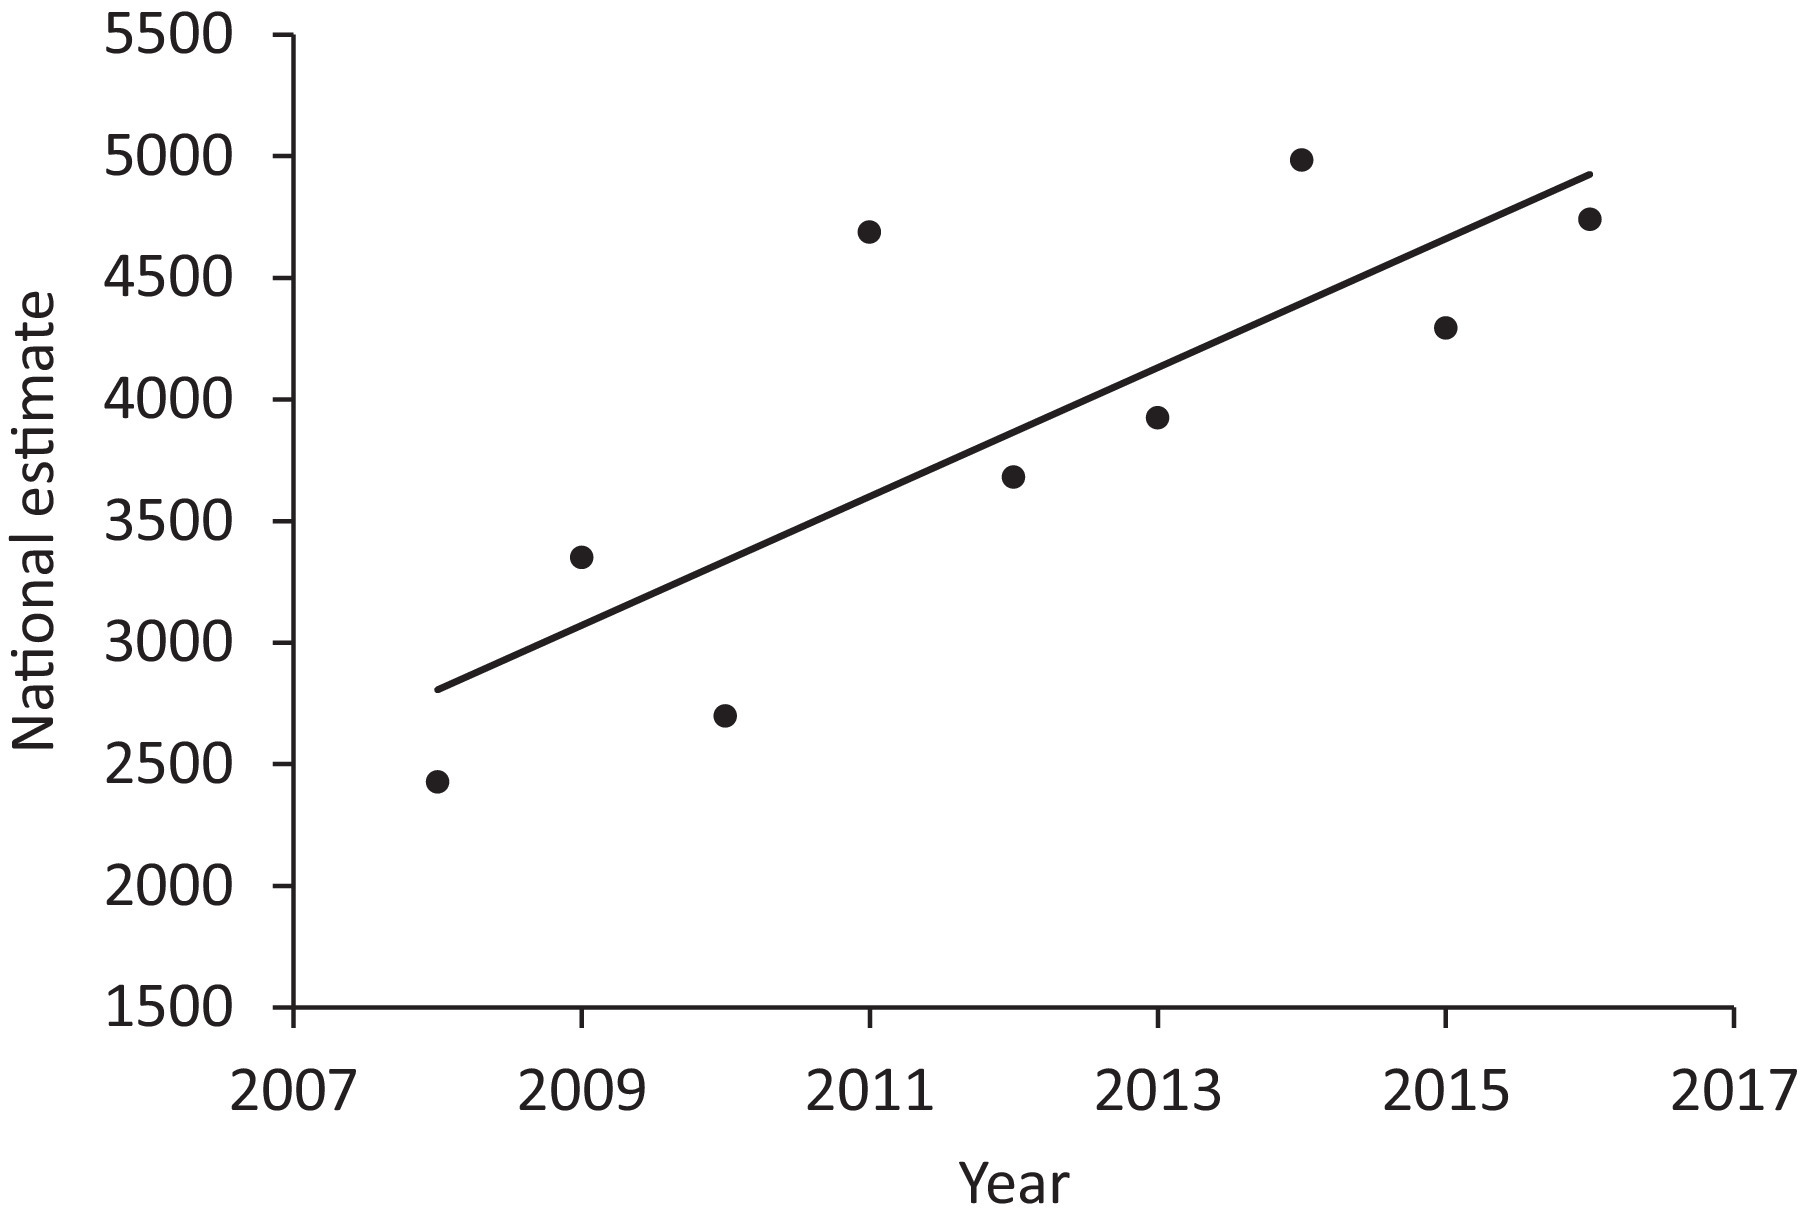
Estimated number of rock climbing injuries by year, 2008–2016 (range 2426 to 4983).
The median age of the injured climbers was 24 y (range 7–77), with those aged 20 to 39 y accounting for 60% of the ED presentations. Males accounted for two-thirds of injured climbers (Table 2).
Characteristics of rock climbers presenting at US emergency departments
INJURY DIAGNOSIS AND INJURED BODY PART
Fractures and sprains and strains were the 2 most common types of injuries, at 27% and 26%, respectively, followed by soft-tissue injuries, lacerations, and dislocations (Table 2). Other injuries (21%) made up the remainder. The most frequently injured body parts were lower extremities (47%) and upper extremities (25%), followed by the torso and the head (Table 2). Of the fractures, the most commonly injured body part (27%) was the ankle (n=2533, OR=1.48, 95% CI 1.40–1.56). The ankle also accounted for 48% of the sprains and strains (n=4435, OR=9.98, 95% CI 6.60–7.38). The knee and lower leg accounted for 42% of all lacerations (n=1583) and were 5.8 times as likely as lacerations to other parts of the body (95% CI 5.4–6.2). The shoulder accounted for 27% of all upper extremity injuries (n=2400), the elbow 16% (n=1425), and wrist 15% (n=1276). Among lower extremity injuries, the ankle was again the most commonly injured (n=7527, 46%), followed by the foot (n=3135, 19%) and lower leg (n=2978, 18%). Table 2 presents injured body parts and diagnosis by age group.
MECHANISM OF INJURY AND FALL HEIGHT
Falls accounted for 60% of all rock-climbing injuries, followed by hitting or striking, overexertion, and being hit or struck by an object. Compared with other causes of injury, the odds of falling as the cause decreased with age (Table 3). Of the 20,802 falls, 8262 (40%) resulted in a fracture (OR 6.8, 95% 6.4–7.3) and 4930 (24%) resulted in a sprain or strain. Among climbers who did not experience a fracture, the risk of a sprain or strain was 1.3 times as likely as experiencing another type of injury (95% CI 1.3–1.4). Climbers injured by hitting or striking (n=1800, 26%) were 4.7 times as likely to experience a laceration as another type of injury (95% CI 4.4–5.0). Among injuries resulting from overexertion, sprains and strains were the most common consequence (n=2467, 48%, OR 3.2, 95% CI 3.0–3.4).
Injured body parts, diagnosis, and mechanism by disposition, age, and sex among rock climbing injuries
Bold indicates Cochran-Mantel-Haenszel P < 0.0001 that the OR = 0.
Not reliable because national estimates <1200.
Not applicable because no cases were hospitalized.
Fall height was identified from case narratives in 10,140 cases (29%). Among those, falling from a height >6 m (20 ft) (n=2711, 27%) increased the odds of a fracture by a factor of 2.5 (95% CI 2.3–2.8). Falling from a height ≤6 m (20 ft) (n=7428, 73%) increased the odds of a sprain or strain by a ratio of 3.9 (95% CI 3.3–4.5). Fractures (21%) were 8.3 times as likely as other types of injuries to result in hospitalization (n=2040, 95% CI 7.6–9.0). There were also an estimated 1418 lower leg injuries that resulted in hospitalization, which were 1.1 times as likely to result in hospitalization as other injuries (95% CI 1.0–1.2).
INJURY GRADING
There were <1200 estimated cases with a UIAA grading of 1, 30,922 with grade 2, 3485 with grade 3, and <1200 with grade 4. Therefore, only grades 2 and 3 were further investigated (Table 4). Compared with other grades of injury, grade 2 injuries were 1.4 times (95% CI 1.2–1.5) as likely to involve the ankle as the injured body part, and grade 3 injuries were 5.5 times (95% CI 5.0–6.1) as likely to result from falling.
Analysis of injury grading
UIAA, International Mountaineering and Climbing Federation; OR, odds ratio.
Compared with all others.
National estimate <1200.
DISPOSITION
An estimated 2851 patients (8%) were hospitalized. Of the 1953 of those for whom the fall height was determinable from the case notes, 50% fell 6 m (20 ft) or less, and 50% fell >6 m (20 ft). Among those hospitalized, the odds of the injured individual being male were 1.6 times that of being female (95% CI 1.5–1.7).
Discussion
Our study is a follow-up analysis of NEISS data to be compared with a prior analysis of these data from 1990 to 2007. 1 Since 2007, an additional 265 cases have accumulated per year (Equation 1), almost doubling the number seen in EDs over the study period from around 2500 to nearly 5000. This may be due to the ever-increasing popularity in climbing overall,3,31 an increase in relative difficulty, or some combination of both. This trend will likely continue with the inclusion of climbing into the Olympic program for Tokyo 2020. 2 It must be noted that the Nelson and McKenzie study included children under 7 y of age, but we considered these to be “playground injuries” because children so young are not considered sport climbers. 28 The mean age in the Nelson and McKenzie study was 26 y, and although the distribution of age was not normal in our sample, the mean age in this study was 26.7 y (SD 12.1).
From 1990 to 2007, the lower extremities were the most frequently injured body parts, accounting for 46% of all injuries; ankle injuries accounted for 19%. 1 In our follow-up analysis, a similar 47% of all injuries also involved the lower extremity. The ankle also lead in numbers of fractures and sprains and in UIAA grade 3 injuries. Falls accounted for 60% of all rock climbing injuries, followed by hitting or striking an object and overexertion (15%). In the prior study, falls were the mechanism of injury, where known, in more than three-quarters of all rock climbing injuries (78%), and overexertion was the cause in only 3%. 1
The proportion of injuries caused by hitting or striking an object increased from about 7% in the prior study 1 to about 20% currently. Classifying case narratives can be relatively subjective (eg, when “hitting or striking an object” is implied but not explicitly stated). Falling and hitting the wall through the pull of the rope, which produces a so-called “rock hit” trauma, 32 is technically both a fall and collision with an object. Thus, any difference in studies may be, at least in part, due to different injury mechanism classifications.
In the present analysis, we classified injuries in accordance with the UIAA grades (Table 1). 13 Given these data were from US ED, UIAA grade 1 injuries were almost not found in the data. Other studies even exclude grade 1 injuries completely from the injury analysis 5 ,8,24 because they mostly receive self-therapy. Grade 2 injuries were the most common and, by definition, were 106 times as likely to involve sprains or strains than other UIAA grade injuries. Similarly, compared with other UIAA grade injuries, grade 3 injuries were 12 times as likely to involve fractures. The ankle was more likely injured among grade 2 injuries than among other grades, and the mechanism was nearly 4 times as likely to be due to a hit or strike than in other UIAA grade injuries. In UIAA grade 3 injuries, the mechanism was 5.5 times as likely the result of a fall than in other UIAA grade injuries, meaning that falls resulted in more serious injuries. Grade 4 injuries were rare, and grades 5 and 6 were not reported (grade 6 injuries are defined as immediate death and could not be entered into this study). 13 Furthermore, grade 5 injuries, which are defined as “Acute mortal danger, polytrauma, immediate prehospital doctor or experienced trauma paramedic attendance if possible, acute surgical intervention, outcome: death,” 13 were not detected in this analysis because no such outcomes were reported. In a recent analysis of data from the National Emergency Department Sample, it was reported that less than 1% of climbing-related ED visits resulted in death. 33
In comparison with other analyses of climbing injuries,5,8–12,15,17–19,21–25,27,34–42 the NEISS data unfortunately do not give any information about the specific type of rock climbing being performed when the injury was sustained. It is well known in the climbing literature that various types of climbing (eg, alpine or traditional climbing) vs indoor climbing and bouldering result in different injury incidence rates, severity, grading, and injury types.5,28 Also, they present with different injury causes. In traditional and alpine climbing the most frequent injury cause is a fall, and the injury is based on the lower extremity; in sport climbing, however, the most frequent cause is performing a strenuous move, and the injury is to an upper extremity.5,11 Concerning sex distribution, studies in general show no influence of sex. 5 ,12,22,24 Our present study found 66% were male, but no information about sex distribution among the US climbing population is known; thus, these numbers may just represent the distribution among climbers. Nelson and McKenzie 1 report a mean age for rock climbing injuries of 26 y (95% CI 25–27) and Schöffl et al 43 of 28 y (95% CI 13–52), which is similar to our findings. Concerning the injury location, so far most research indicates the upper extremity to be the most injured body regions in nonalpine rock-climbing. 24 ,35,38,39,43,44–45 Schöffl et al 46 reported 247 of 604 (41%) climbing injuries (sport climbing, indoor climbing) treated in a climbing injury specialized unit involved the hand, a finding that was reproduced in a more recent analysis, 25 although that clinic specializes in the diagnoses of hand and finger injuries. 47 Two studies that analyzed climbing injuries treated in US hospitals or EDs reported most climbing injuries involved the lower extremities and resulted from big swings into a wall or big falls.1,15 In another recent study on rock climbing injuries, trauma involved the lower extremities (foot, toe, and ankle) in 50% of injuries, whereas upper extremities accounted for 36% of the injuries. 11 Neuhof et al 24 found an even injury distribution between the upper (43%) and lower extremities (41%) for sport climbing injuries.
Chief among the limitations of this study are that national estimates may not accurately reflect the true occurrence of rock climbing injuries. Although climbing gyms may be founded in any location, the geographical distribution of natural cliffs may not match the distribution of hospitals in the NEISS sample. Even so, because the weightings are adjusted annually to allow time series analyses, the main finding still stands that climbing injuries are on the rise and have been since the Nelson and McKenzie study, which used the same sampling frame. Another limitation is that it is likely not all individuals with rock climbing injuries present at an ED, and many are likely treated by other facilities (eg, at urgent care facilities). Fatalities are also not routinely recorded in NEISS because, post-mortem, they are often not taken to an ED. Therefore, the true burden of rock climbing injuries is likely greater than reported in this study. It should also be acknowledged that without reliable participation denominators such as the number of climbers in each year or the number of hours spent climbing, the incidence rate of rock climbing injuries cannot be estimated. Such estimates were beyond the scope of this study. In addition, because NEISS data are de-identified, multiple presentations cannot be accounted for when describing injured climbers.
Conclusion
Our present analysis of US ED patients treated for rock climbing injuries confirms a continued increase in overall numbers of climbing injuries, as predicted in a prior analysis. 1 Whether this is based on a higher injury rate or on a higher number of climbers overall cannot be answered by this study. Late reports are finding an increasing number of climbers and increasing severity of rock climbing injuries, based on the so-called newbie syndrome (nonsportive beginners climbing, falling, and getting injured because of a lack of overall muscular development and coordination) and increased dynamic movements with greater heights in “new age” commercial bouldering gyms.3,48 Only time will tell if this trend will continue, given climbing's addition as an Olympic sport. 49
Footnotes
Author Contributions
Conceived and designed the study (PB, IS, JC, VS); collected the data from the CPSC and analyzed the data (PB); interpreted the results of the analysis, wrote and/or revised the manuscript, and approved the final submission (PB, IS, JC, VS).
Financial/Material Support
None.
Disclosures
None.