
Abstract
Introduction
This study investigated skin vasomotor responses in the fingers and toes during cooling and rewarming with and without normobaric hypoxia.
Methods
Fourteen volunteers (8 males and 6 females) were exposed to gradual air cooling (mean±SD: −0.4±0.1oC·min−1) followed by rewarming (+0.5±0.1oC·min−1) while breathing normoxic air (FIO2 0.21 at 761±3 mm Hg) or hypoxic gas (FIO2 0.12, at 761±3 mm Hg, equivalent to ∼5000 m above sea level). Throughout the gradual cooling and rewarming phases, rectal temperature was measured, and skin temperatures and laser Doppler skin blood flow were measured on the thumb, little finger, and great and little toe pads.
Results
During gradual cooling, skin temperature but not deep body temperature decreased. No differences in cutaneous vascular conductance were found for the toes or thumb (P=0.169 great toe; P=0.289 little toe; P=0.422 thumb). Cutaneous vascular conductance was reduced in the little finger to a greater extent at the same mean skin temperatures (34.5–33.5oC) in the hypoxic compared with normoxic conditions (P=0.047). The onset of vasoconstriction and release of vasoconstriction in the thumb and little finger occurred at higher mean skin temperatures in hypoxia compared with normoxia (P<0.05). The onset of vasoconstriction and release of vasoconstriction in the toes occurred at similar skin temperatures (P=0.181 and P=0.132, respectively).
Conclusion
The earlier vasoconstrictor response and later release of vasoconstriction in the finger during hypoxic conditions may result in a greater dose of cold to that digit, taking longer to rewarm following the release of vasoconstriction.
Introduction
Cold injury is a frequent pathological consequence of exposure to altitude (>2800 m). 1 At altitude, hypoxia coexists with other stressors, in particular cold and dehydration. The central and peripheral responses to local and whole body cooling and, separately, the responses to natural or simulated altitude exposures have been investigated in detail. In contrast, the combination of these stressors has had less focus within integrated human research, 2 despite their frequent combined occurrence in the natural world.
Cold exposure results in cutaneous vasoconstriction that lowers skin temperature, particularly in the extremities, and reduces heat transfer from deep body tissues to the environment. 3 Thus, a sustained period of vasoconstriction helps to preserve deep body temperature but increases the risk of frostbite and nonfreezing cold injury (NFCI), such as immersion foot or trench foot. 4 The addition of a hypoxic stimulus (acute or chronic exposure) can prolong cold-induced cutaneous vasoconstriction by slowing rewarming.5,6 Keramidas et al 6 reported the acute effects of breathing a hypoxic gas mixture (FIO2=0.14) on hand skin temperature during rapid cooling in 8°C water. They found no differences in the rate of hand skin cooling between normoxic and hypoxic conditions. This finding may be expected, as immersion in cold water would rapidly lower skin temperature and promote a strong generalized sympathetic response, prompting rapid and maximal vasoconstriction, which would likely be a stronger stimulus for peripheral vasoconstriction than hypoxia. Cooling of the digits while maintaining the rest of the body in a thermoneutral state may also allow cold-induced vasodilatation, a cyclical increase in local tissue temperature that accompanies a temporary return of blood flow to the digit. 7 No differences in cold-induced vasodilatation response were found between normoxic and hypoxic conditions when the body remained warm and the hand cooled. 6
Gradual whole body cooling in a cold air environment during exposure may reduce mean body temperature and maintain sympathetic tone; therefore, cold-induced vasodilatation is less likely to occur. 8 In the work of Keramidas et al, during the air rewarming, postimmersion thumb skin temperatures were significantly lower when breathing hypoxic gas compared with normoxic air. 6 They suggest that the lower skin temperatures during rewarming of the hand in hypoxia may be due to a reduced skin blood flow response; however, blood flow was not directly measured in their study.
Any additional reduction in skin blood flow caused by hypoxia in a cold environment increases the “dose of cold” (a stimulus that results in physiological changes due to reductions in the environmental temperature and is applied for a period of time) experienced by the extremities and has the potential to increase both the number and severity of cold injuries. In this way, hypoxia may increase the risk of NFCI for a given air temperature. Although the exact dose required to increase the risk of NFCI is unclear, there are documented cases of NFCI that provide evidence of the conditions and duration of cold air exposure required9,10; however, a range of factors may contribute to the mechanism of injury and its severity. 11
The feet are more exposed to conditions likely to cause NFCI, 12 have a lower blood flow, and can maintain vasoconstrictor tone when deep body temperature is thermoneutral. 13 In addition, behavioral temperature regulation may be slower to respond to cooling of the toes; cortical models indicate that greater discomfort would be felt in the fingers during simultaneous cooling of both fingers and toes. These factors suggest that vasomotor and behavioral responses to changes in temperature in the feet may be different from those of the hands on exposure to cold and hypoxic environments. However, this hypothesis has not been tested in a dynamic air environment, similar to that seen when at altitude, with participants warming and cooling with exercise and rest, shelter and exposure, and the vasomotor response switching from constriction to dilatation. It is the sensitivity of the cutaneous vasomotor response to such changes that determines the “dose” of cold experienced and therefore the risk of cold injury. Thus, it was hypothesized that 1) during a standardized cooling and rewarming profile, vasoconstriction and release of vasoconstriction would occur at higher skin temperatures when breathing a hypoxic gas mixture (FIO2=0.12), compared with normoxic air; and 2) vasoconstriction would occur earlier during cooling and be released later upon rewarming in the toes compared with the fingers.
Methods
Volunteers
Fourteen healthy, nonsmoking volunteers (8 males and 6 females) gave written informed consent to participate in this study ([mean±SD] age 23±2 years, height 1.72±0.11 m, mass 74.7±13.8 kg). Potential volunteers were excluded if they had sojourned at high altitude; flown in the month preceding the experiment; or reported peripheral vascular disease, Raynaud’s, or NFCI to any digits. This study was approved by the University of Portsmouth Science Faculty Research Ethics Committee (SFEC 2014-018).
Procedures
Volunteers, wearing shorts and a vest, were instrumented with a rectal thermistor (Grant Instruments [Cambridge] UK, Ltd), which was self-inserted 15 cm past the anal sphincter; skin thermistors (Grant Instruments) were applied to 7 sites (chest, arm, thigh, calf, forearm, and distal pad of the right index finger and right great toe). Multichannel laser Doppler probes (VP1T/7 Moor Instruments, Axminster, UK) were attached to the pads of the right thumb and little finger, great toe, and little toe and remained in position during both normoxic and hypoxic conditions. A pulse oximeter finger sensor (Nonin 7500, Plymouth, MN) was positioned on the middle finger of the right hand, and a 3-lead electrocardiograph was attached for calculation of heart rate (HR). Volunteers also wore a respiratory mask (Hans Rudolf, Shawnee, KS) for the duration of the study for the measurement of end-tidal oxygen and carbon dioxide tensions (PETO2 and PETCO2) using a rapid-responding oxygen and carbon dioxide analyzer (Rapidox, St. Ives, UK). Rectal and skin temperatures were recorded at minute intervals on a Squirrel 2020 electronic data logger (Grant Instruments). Laser Doppler (moorVMS-LDF, Moor Instruments), pulse oximeter, and oxygen and carbon dioxide gas analyzers were connected to an analogue to digital recorder (PowerLab, AD Instruments, Australia) and were sampled at 400 Hz, 60 Hz, and 400 Hz, respectively; minute means were calculated.
Participants cycled on a cycle ergometer (Monark, 874E, Vansbro, Sweden) at an external work rate of 60 W for 10 to 15 min in a temperature-controlled chamber (ambient temperature 30
Blood pressure (HEM-705C, Omron, Milton Keynes, UK) was recorded immediately before the start of cooling and at the end of the passive rewarming phase of each condition. During the experiment, volunteers breathed normoxic air for 1 ambient cooling–rewarming cycle and a humidified hypoxic gas mixture (FIO2=0.12) for the other ambient cooling–rewarm cycle. The order of presentation of the gas mixtures was balanced. During the hypoxic condition, volunteers were switched to breathing the normobaric hypoxic gas mixture 5 minutes before the chamber air was cooled (Figure 1). The chamber wet bulb globe temperatures were measured (Edale Instruments, Cambridge, UK) and recorded at minute intervals using a data logger (Squirrel 800 Logger, Grant Instruments), and the fraction of inspired oxygen and carbon dioxide concentrations (FIO2 and FICO2) were measured at 5-min intervals.
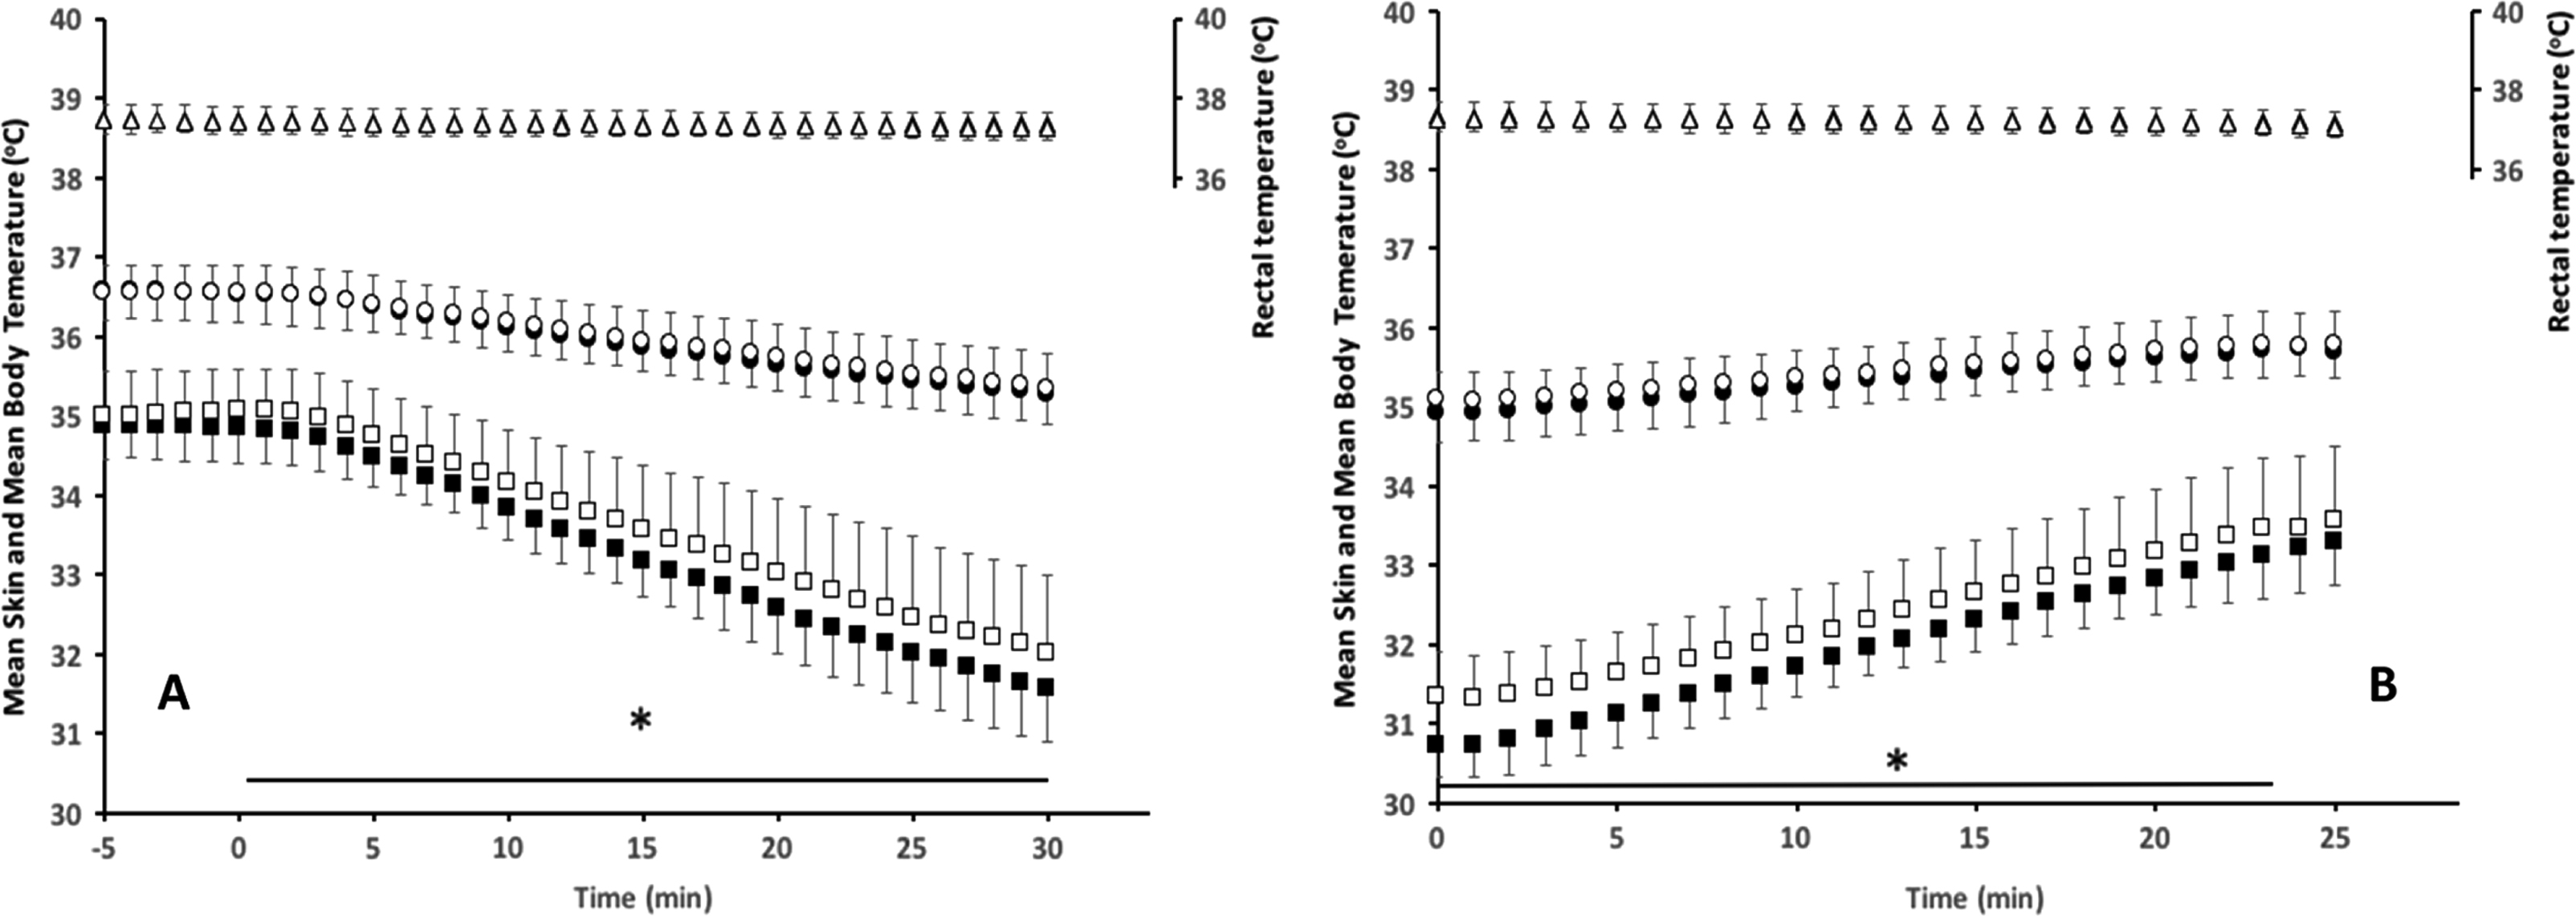
Rectal temperature (mean±SD) (triangles), body temperature (circles), and skin temperature (squares) in response to ambient gradual cooling (A) and rewarming (B) in normoxic (filled) and hypoxic (open) conditions. * P<0.05 difference between hypoxic and normoxic conditions.
Thermal comfort and thermal sensation were assessed for the whole body using visual analogue scales, modified from Zhang and Zhao, 15 at 5-min intervals during the exposures. The scales used consisted of a 20-cm continuous visual analogue scale ranging from “Very Hot” (0 cm); “Hot”; “Warm”; “Slightly Warm”; “Neutral”; “Slightly Cool”; “Cold”; to “Very Cold” (20 cm) for thermal sensation. Thermal comfort ranged from very comfortable (20 cm), comfortable (16 cm), just comfortable (12 cm), just uncomfortable (10.5 cm), uncomfortable (4 cm), to very uncomfortable (0 cm). On both thermal perceptual scales, the worded descriptions adjacent to the scales were used as a guide, and volunteers could position their vote at any point along the 20 cm scale.
Data Analysis
Weighted mean skin temperature and weighted mean body temperatures were calculated.16,17 Cutaneous vascular conductance (CVC) was calculated as the ratio of laser Doppler blood flow to mean arterial pressure (MAP).
Visual inspection of the minute-by-minute CVC was used to establish the onset of vasoconstriction, maximal vasoconstriction, and release of vasoconstriction. These points were determined independently by 2 of the investigators (HM & JRH), using a priori definitions (Table 1), following the same process previously described by Maley et al. 18 Where there was disagreement, the investigators met to decide upon the points collaboratively.
Definitions for a priori determination of the vasoconstriction and release of vasoconstriction
SkBF, skin blood flow.
Statistical Analysis
A priori power calculations using data from Keramidas et al, 6 power at 0.8 and α = 0.05, determined that 13 volunteers would provide appropriate power. However, to balance the design, 14 volunteers were recruited. Statistical analyses were undertaken using SPSS (IBM Version 22, New York, NY). After tests for normality, repeated measures analysis of variance was used to establish whether differences in deep body temperature, cardiorespiratory, skin blood flow variables, and subjective responses occurred during normoxic and hypoxic exposures.
A factorial analysis of variance was used to compare the skin blood flow responses between hypoxic and normoxic conditions. The skin blood flow responses at 0.5°C mean skin temperature increments were compared between hypoxic and normoxic environments and with other skin temperature increments (temperature [8] × condition [2]). Paired samples t tests were used to establish whether the mean skin temperatures recorded at the onset of vasoconstriction, maximal vasoconstriction, and release of vasoconstriction were different when breathing hypoxic gas and normoxic air. Significance was set at P≤0.05; data are presented as mean±SD. Cohen’s D effect sizes were also calculated, with values of 0.6, 1.2, 2.0, and 4.0 equaling a moderate, large, very large, and extremely large effect size, respectively. 19
Results
Table 2 shows the cardiopulmonary responses to cooling and rewarming in hypoxic and normoxic environments. As expected, PETO2, PETCO2, and SPO2 were significantly reduced and HR and MAP were increased during hypoxia compared with normoxia (PETO2, P<0.001; PETCO2, P=0.003; SPO2, P=0.002; HR, P=0.013; MAP, P=0.001). MAP increased between baseline and normoxia (P=0.009), and both MAP and HR increased in hypoxia compared with baseline (MAP P=0.001; HR, P=0.003). PETO2 and PETCO2 were reduced (PETO2, P<0.001; PETCO2, P<0.001; SPO2, P=0.004).
Cardiopulmonary responses to cooling and rewarming in hypoxic and normoxic environments when at rest
P<0.05 different to baseline.
P<0.05 between normoxic vs hypoxic conditions.
Mean rectal temperature was maintained at 37.3±0.3oC in normoxia and in hypoxia (P=0.363, Figure 1). Mean body temperature reduced during cooling and increased during rewarming, but temperatures did not differ between normoxic and hypoxic conditions (P=0.464; Figure 1). The cause of the reduction in mean body temperature was a reduction in mean skin temperature; hypoxic conditions resulted in higher mean skin temperatures during cooling and rewarming (P<0.05) but were not different at baseline before cooling. Accordingly, mean skin temperatures are compared rather than mean body temperatures. In subsequent figures, skin blood flow responses will be displayed against mean skin temperature, rather than a function of time, reflecting the stimulus for changes in blood flow.
Cutaneous Vascular Responses of the Toes to Changes in Mean skin Temperature
Figure 2 shows the CVC responses of the great toe and little toe to mean skin temperature change during whole body cooling and rewarming in air. As expected, when mean skin temperature fell, there was a reduction in CVC. However, the CVC responses did not differ between the normoxic and hypoxic cooling conditions (P=0.169 great toe; P=0.289 little toe). Additionally, during the rewarming process, CVC responses did not differ between normoxia and hypoxia at any given mean skin temperature (P=0.693 great toe, P=0.731 little toe).
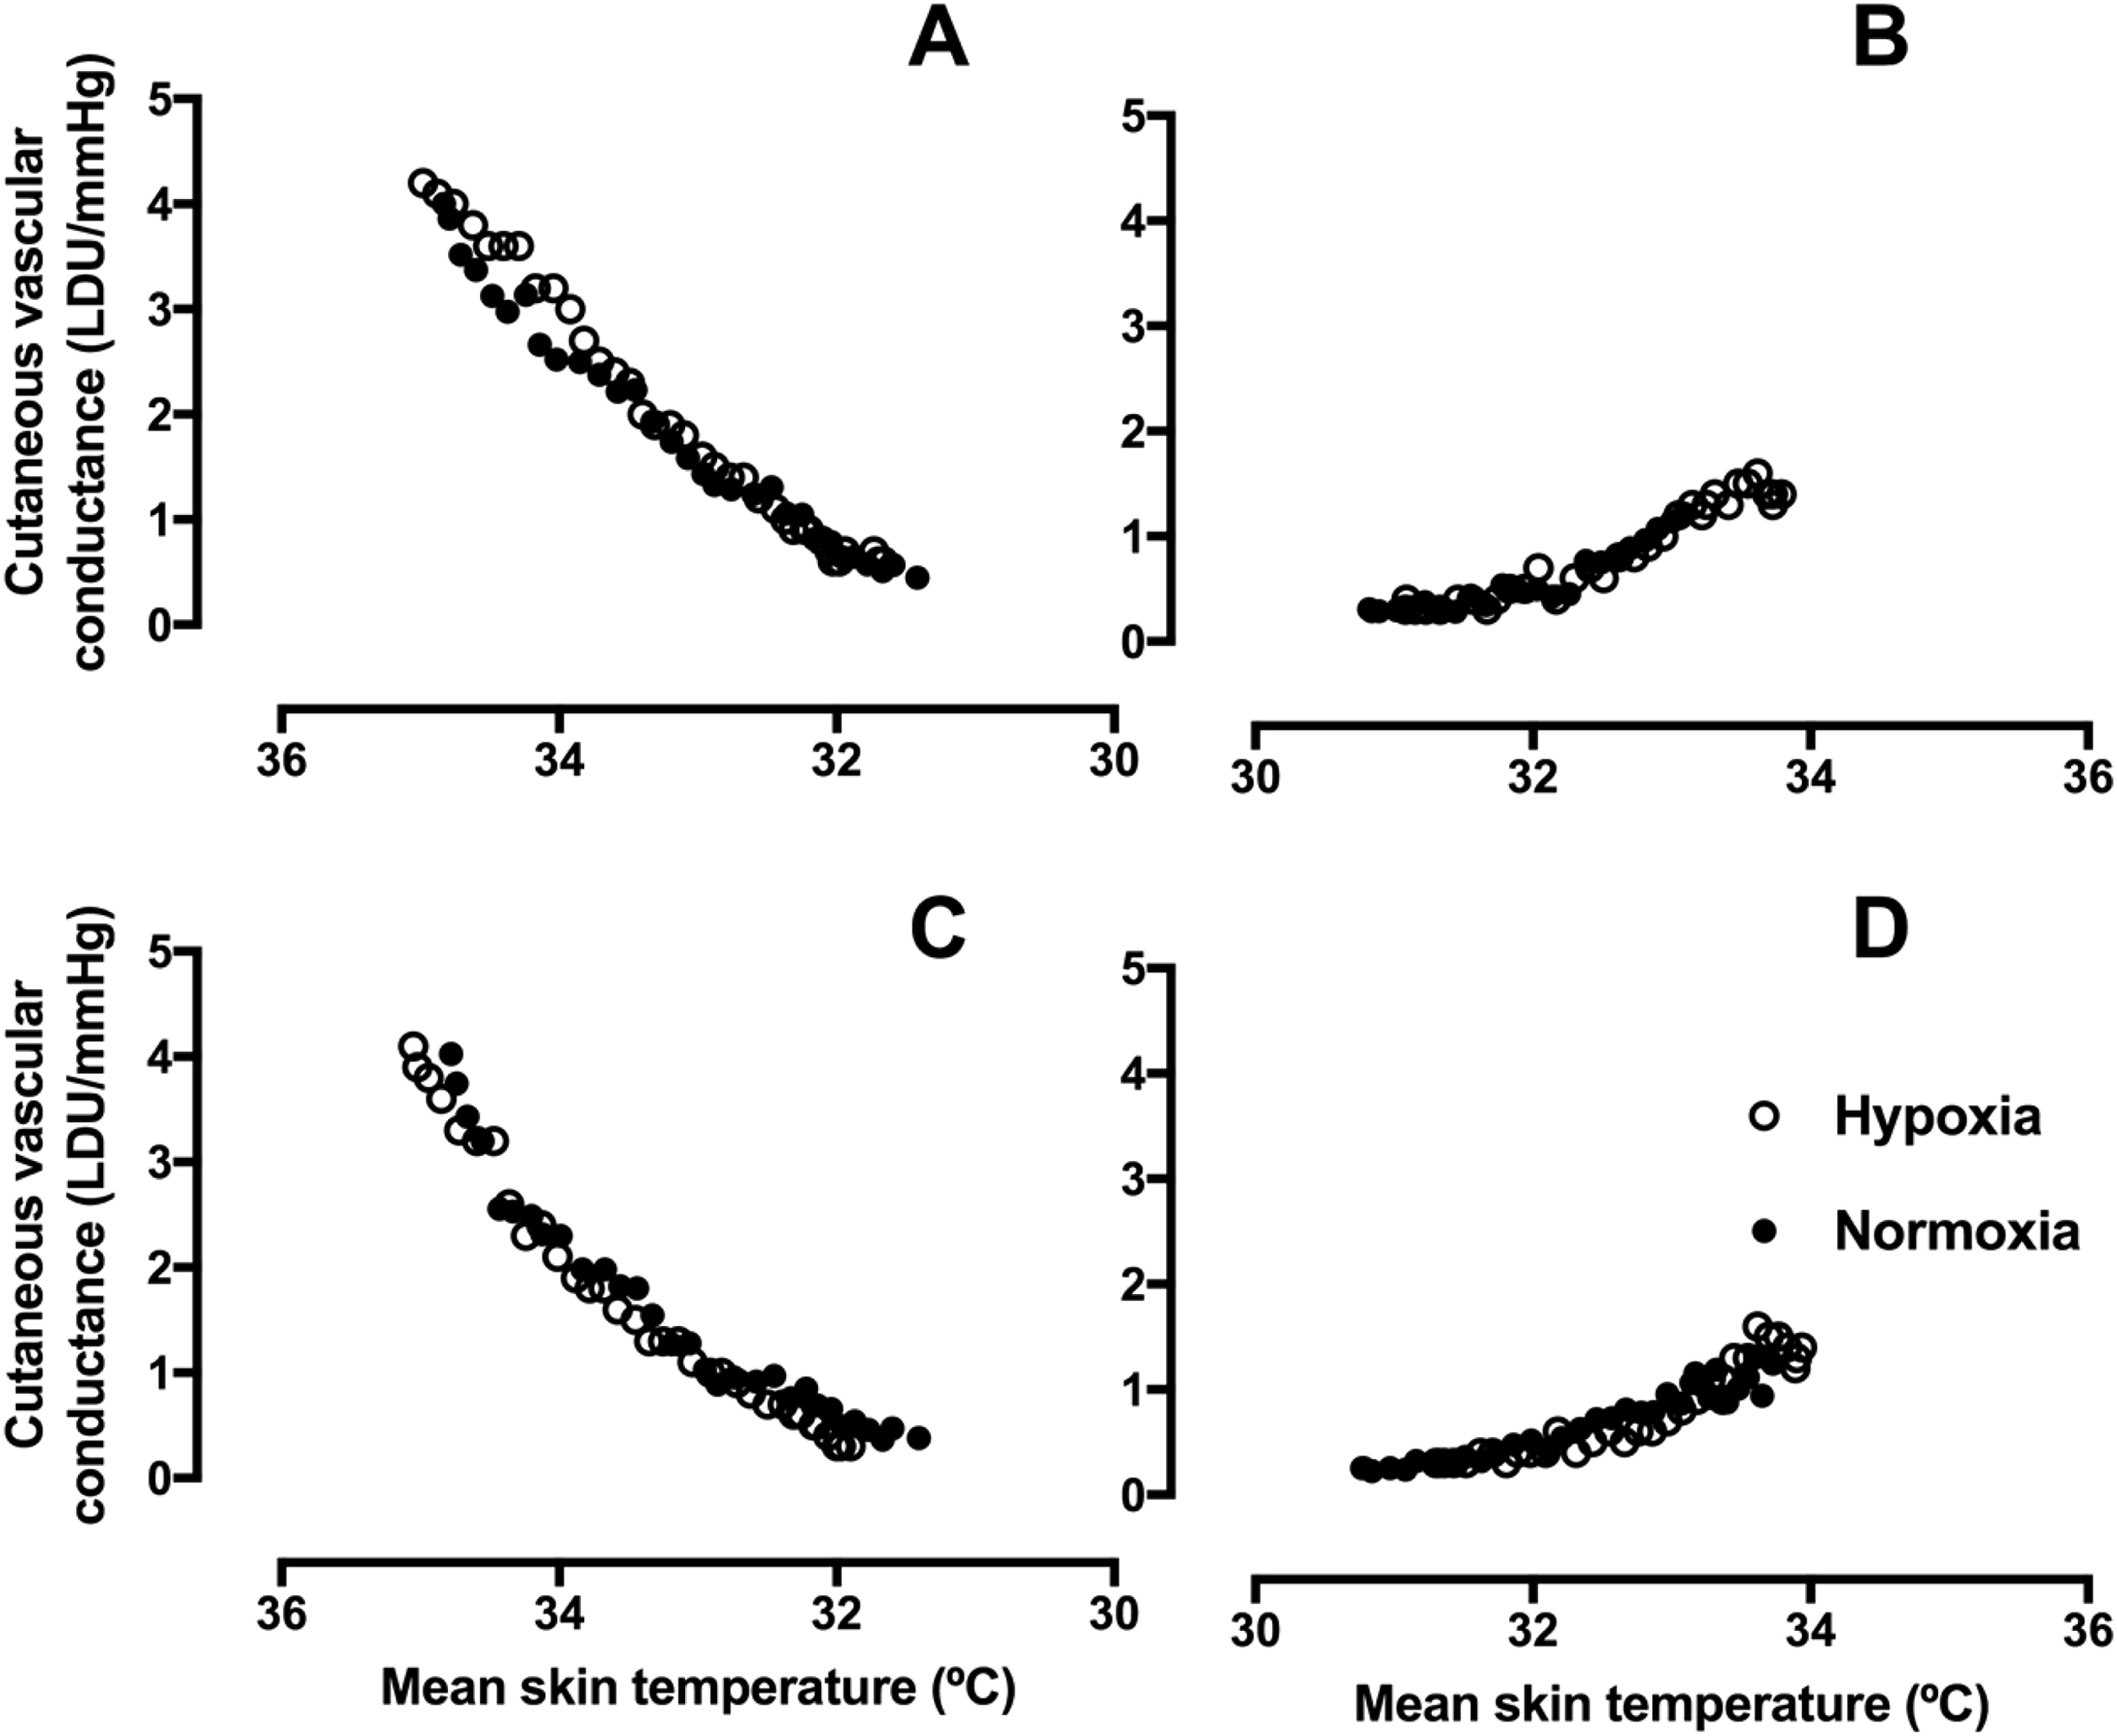
CVC (mean) response of the great toe and little toe to gradual whole body cooling and rewarming. A and B, great toe cooling and rewarming, respectively. C and D, little toe cooling and rewarming, respectively (n=12). Normoxia, 20.9% O2 (black circles), hypoxia, 11.5% O2 (open circles). CVC, cutaneous vascular conductance.
Cutaneous Vascular Responses of the Thumb and Little Finger to Changes in mean skin Temperature
Figure 3 shows the CVC responses to mean skin temperature during cooling and rewarming of the thumb and little finger. Responses did not differ between normoxic and hypoxic exposures when the thumb was cooled (P=0.422). During little finger cooling, the CVC response to hypoxic exposure was reduced to a greater extent at the same mean skin temperatures (34.5–33.5oC) compared with the normoxic condition (P=0.047, d=0.63), but no differences were found at other mean skin temperatures. In comparison to normoxia, the CVC response to rewarming in hypoxia was reduced at a mean skin temperature of 33oC (thumb P=0.045, d=0.43; little finger P=0.040, d=0.743); at all other skin temperatures, CVC responses did not differ (thumb P>0.165, d=0.36).
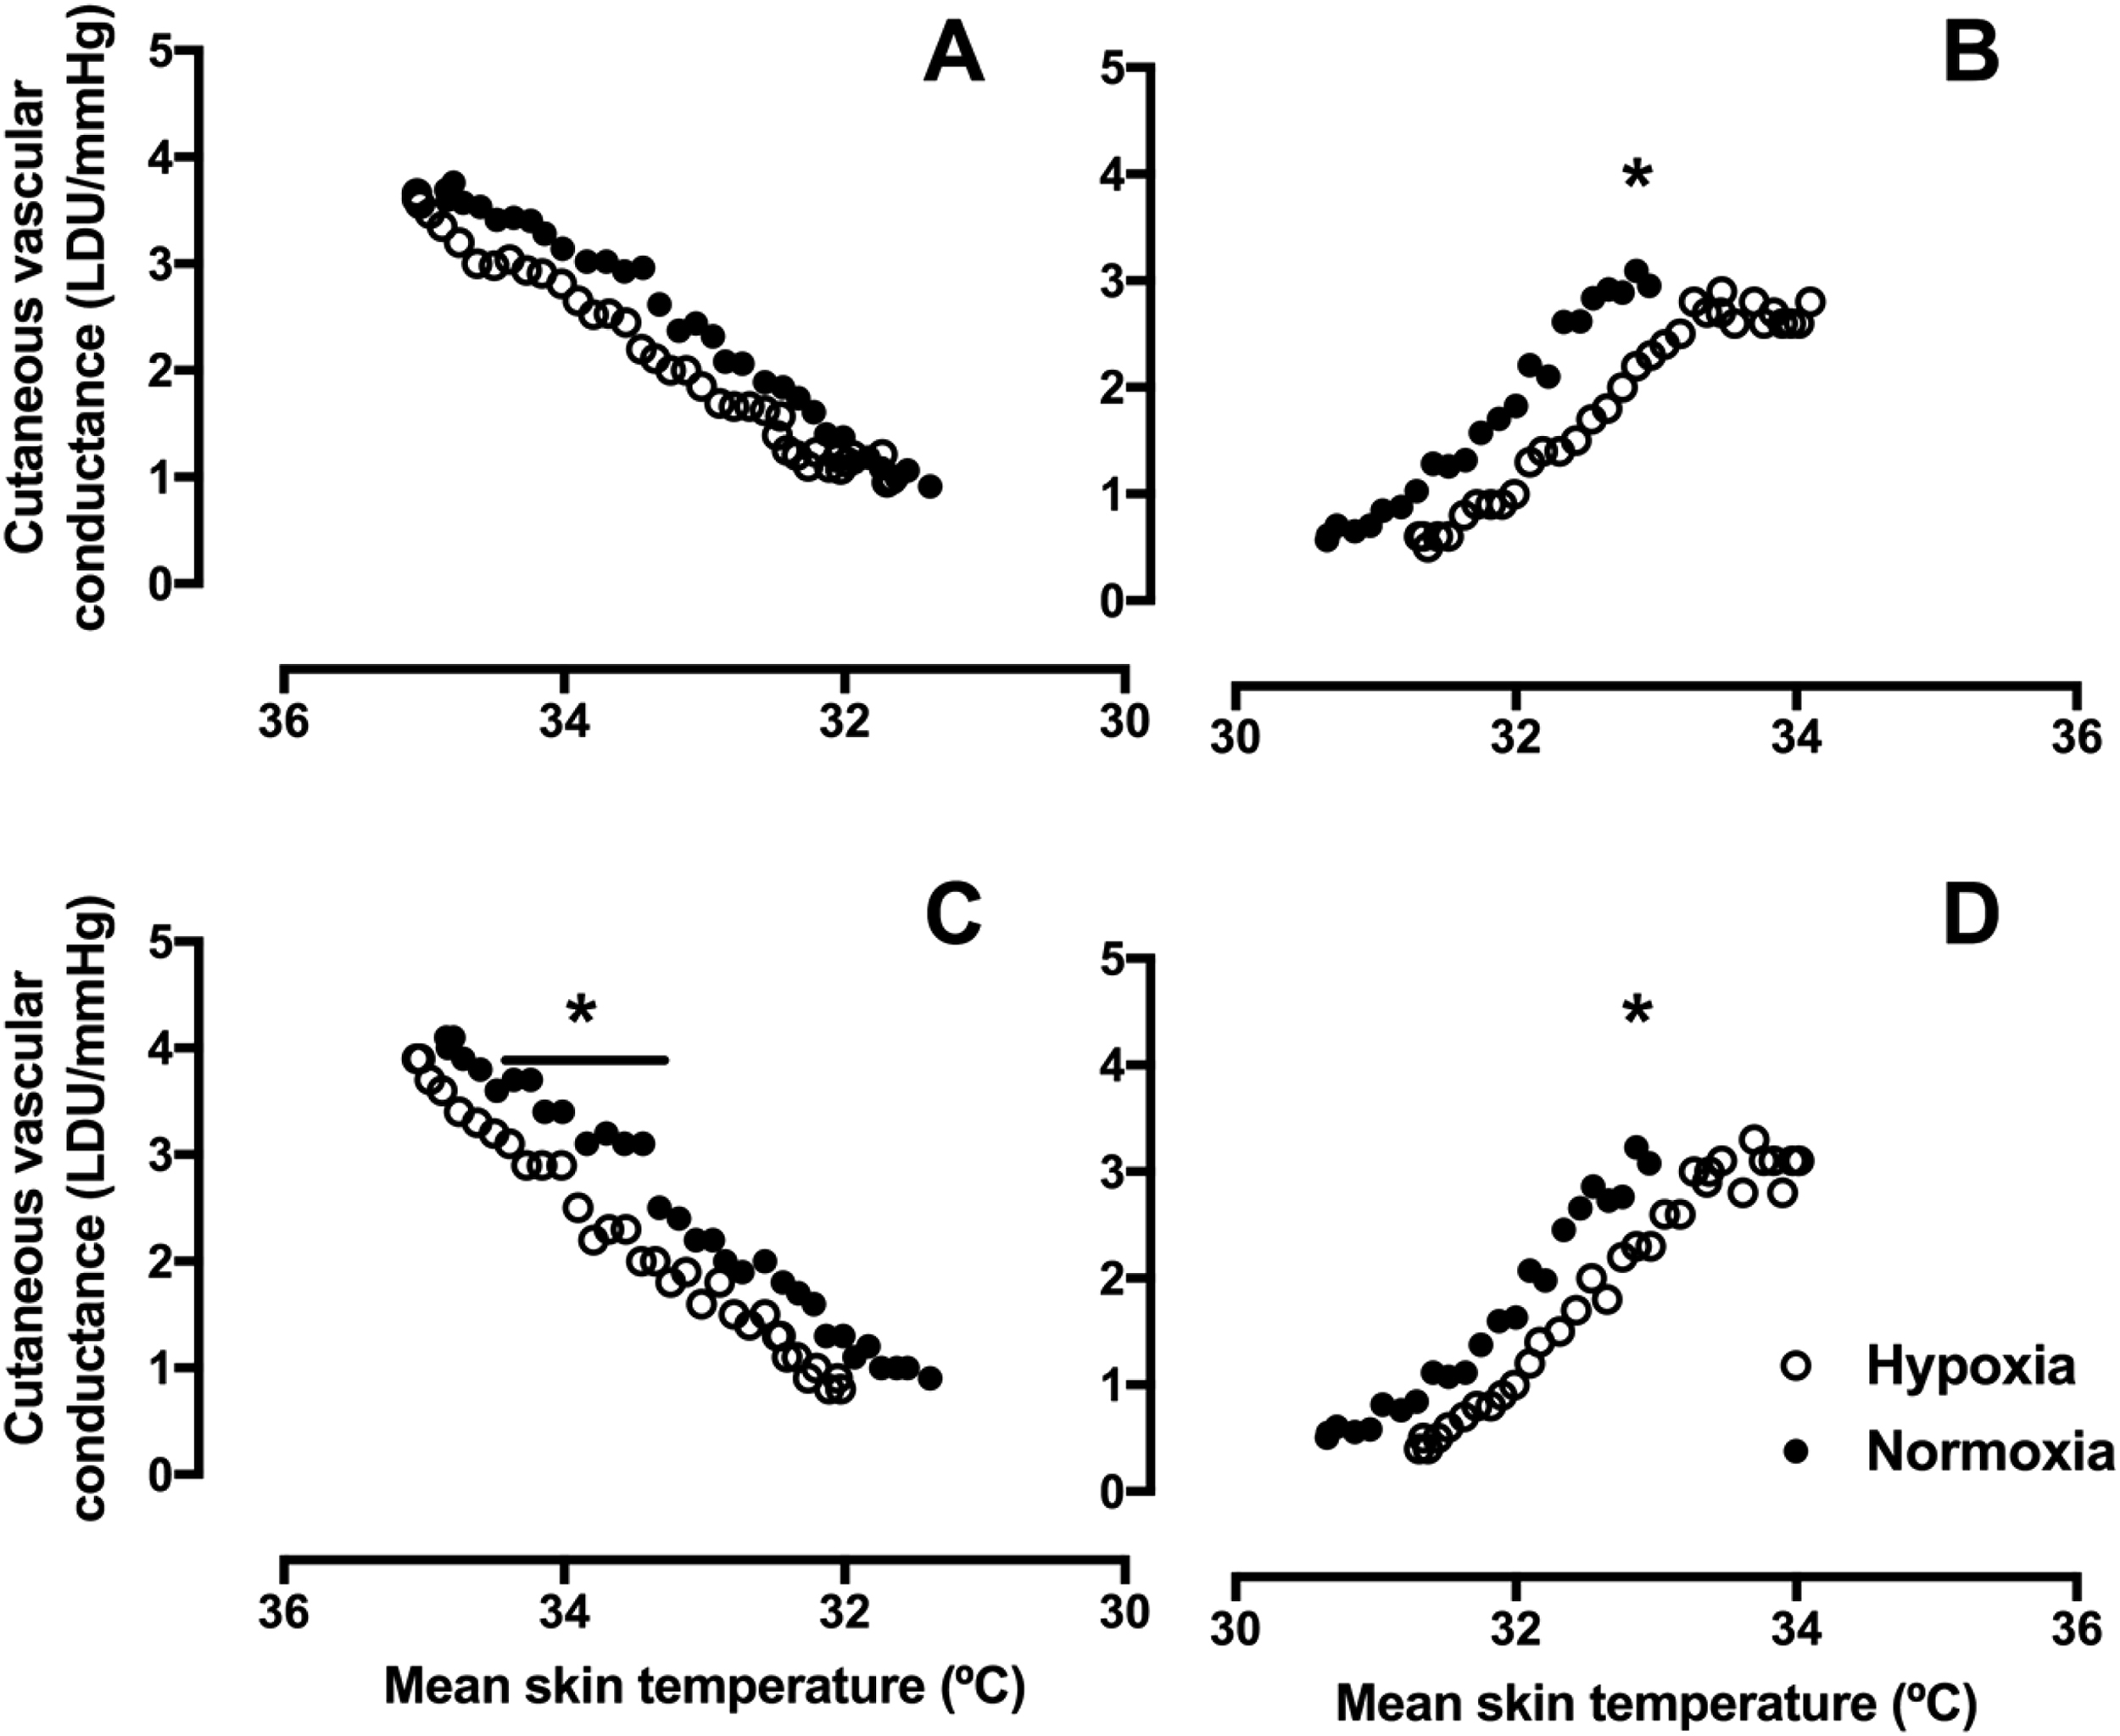
CVC (mean) response of the thumb and little finger to gradual whole body cooling and rewarming. A and B, thumb cooling and rewarming, respectively. C and D, little finger cooling and rewarming, respectively (n=14). Normoxia, 20.9% O2 (black circles), hypoxia 11.5% O2 (open circles). *P<0.05 for normoxia vs hypoxia. CVC, cutaneous vascular conductance.
Mean Skin Temperature at the Onset of, Maximal, and Release of Vasoconstriction
Table 3 shows the mean skin temperature at the onset of vasoconstriction, maximal vasoconstriction when cooling, and release of vasoconstriction when rewarming. The thumb and little finger constricted and dilated at higher mean skin temperatures in hypoxia than in normoxia (Table 3). This is in contrast to the responses of the great toe and little toe, where mean skin temperature did not differ at any point in normoxic and hypoxic conditions (Table 3).
Weighted mean skin temperatures (mean±SD, oC) at the onset of vasoconstriction, maximal vasoconstriction, and release of vasoconstriction in normoxic (N) and hypoxic (H) conditions.
P≤0.05 site-specific differences between the toes and finger.
Table 4 shows the local skin temperatures at the onset of, maximal, and release of vasoconstriction in hypoxic and normoxic conditions. Although there were no differences in the vasoconstriction and dilatation responses in hypoxic and normoxic conditions for local toe and thumb skin temperature, greater little finger skin temperatures were measured in hypoxia at maximal vasoconstriction (P=0.036, d=0.38) and release of vasoconstriction (P=0.039, d=0.39), with a trend for greater skin temperatures at the onset of vasoconstriction in hypoxia (P=0.059, d=0.78).
Local skin temperatures (mean±SD, oC) at the onset of vasoconstriction, maximal vasoconstriction, and release of vasoconstriction in normoxic (N) and hypoxic (H) conditions
The cooling and rewarming times were different for each individual; however, mean cooling times did not differ between normoxia and hypoxia (normoxia 32.5±12.5 min and hypoxia 34.0±13.5 min, P=0.117). Similarly, rewarming time was also not significantly different between normoxia and hypoxia (normoxia 22±10.5 min, hypoxia 26.0±12.0, P=0.121), but there was a small effect (d=0.4). In addition, the between-condition cooling and rewarming durations showed strong positive correlations (cooling r=0.825, P=0.009; rewarming r=0.762, P=0.003). Further correlations revealed that body mass was positively related to the cooling duration (r=0.599, P=0.033) but not to rewarming (r=−0.333, P=0.266).
Subjective Responses to Normoxic and Hypoxic Cooling
The subjective responses to cooling and rewarming are shown in Figures 4 and 5. As expected, there are main effects of temperature for votes on both thermal comfort and thermal sensation (P<0.001) during cooling and rewarming. During cooling, there were no main effects of hypoxic exposure on votes on either thermal comfort (P=0.774) or temperature sensation (P=0.350). In contrast, during hypoxic rewarming, volunteers were less thermally comfortable (P=0.039) and had cooler temperature sensations (P=0.048) than during normoxic rewarming.
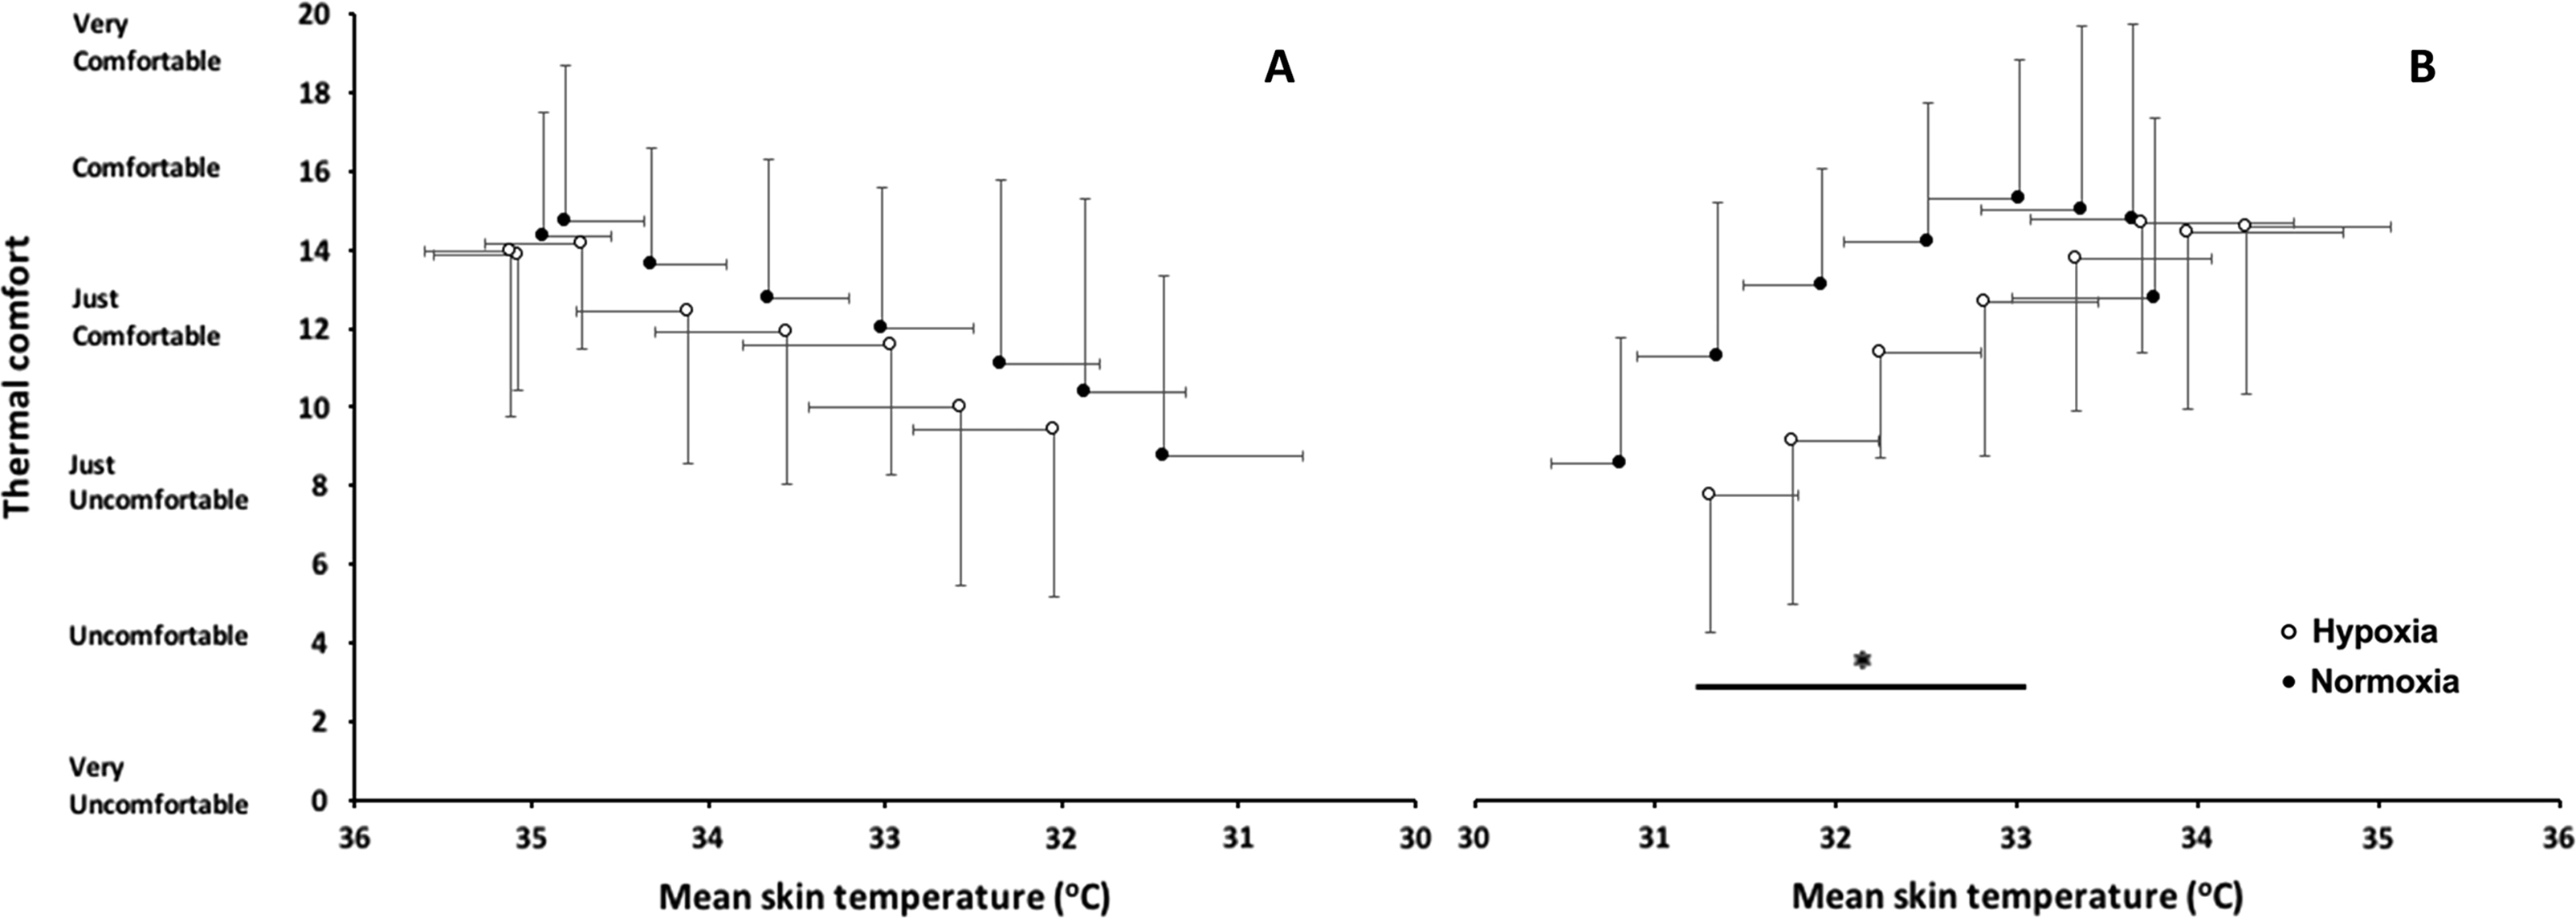
Thermal comfort (mean±SD) against mean skin temperature during (A) cooling and (B) rewarming (n=14). Normoxia, 20.9% O2 (black circles), hypoxia 11.5% O2 (open circles). *P<0.05 main effect of condition.
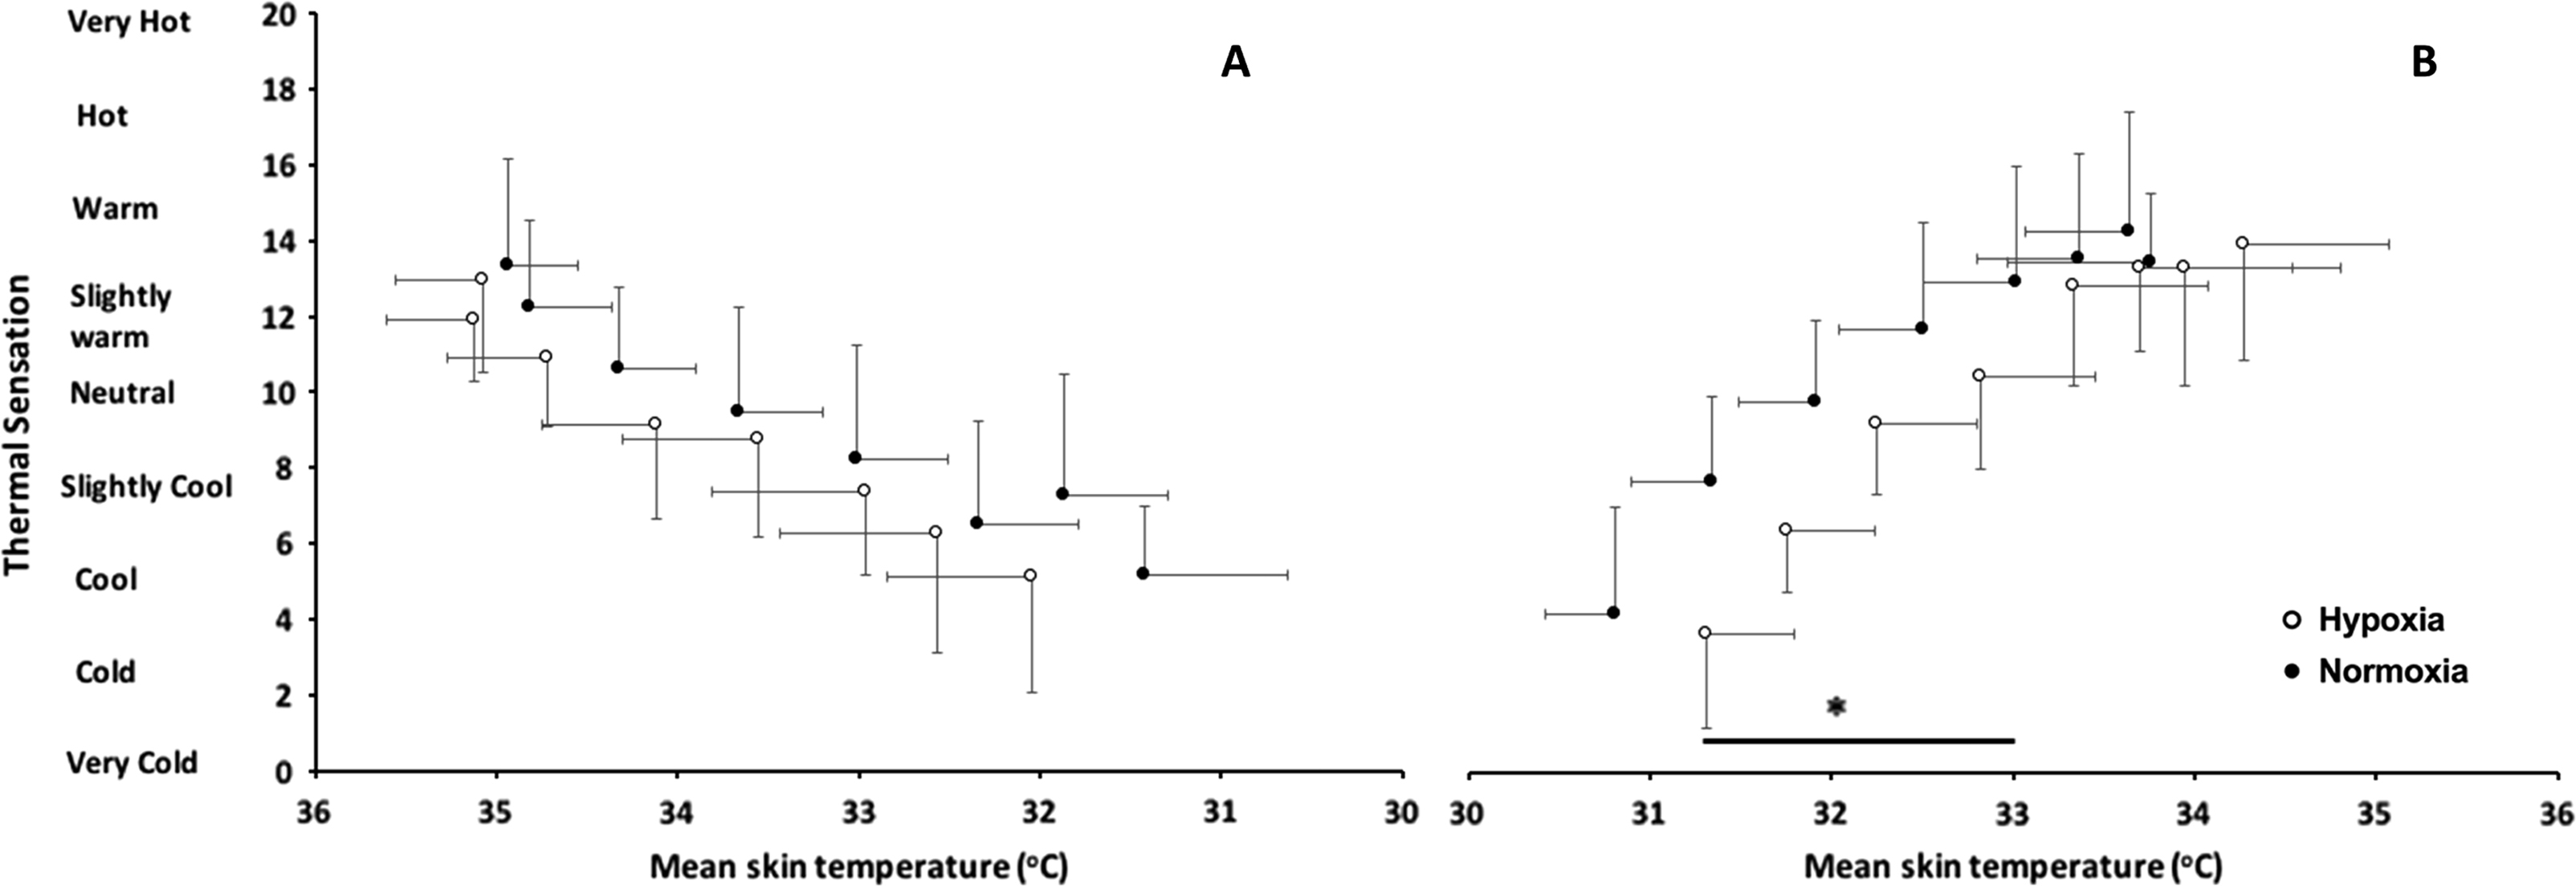
Temperature sensation (mean±SD) against mean skin temperature during (A) cooling and (B) rewarming (n=14). Normoxia, 20.9% O2 (black circles), hypoxia 11.5% O2 (open circles). *P<0.05 main effect of condition.
Vasomotor Differences Among the thumb, little finger, and toes
In normoxia, the onset of vasoconstriction occurred at higher mean skin temperatures in the toes than in the fingers (P=0.044, d=0.32). In contrast, no differences in the mean skin temperature at the onset of vasoconstriction in the fingers and toes were found during hypoxic exposure. Likewise, no differences between the mean skin temperatures at maximal vasoconstriction were found between the fingers and toes in either hypoxic or normoxic conditions. Finally, release of vasoconstriction in the thumb and little finger occurred at significantly lower mean skin temperatures than in the toes during normoxic (P=0.001, d=0.35) but not hypoxic exposures (Table 3).
Discussion
The present study identifies the skin blood flow responses of the thumb, fingers, and toes to gradual cooling and rewarming in combination with an acute hypoxic exposure. This study found that acute exposure to normobaric hypoxia in combination with skin cooling resulted in little finger and thumb vasoconstriction at higher mean skin temperatures compared with the normoxic condition, but this was not apparent in the toes. Similarly, the release of vasoconstriction occurred at higher skin temperatures in hypoxia than in normoxia in the thumb and little finger but, again, not in the toes. Therefore, the primary hypothesis that vasoconstriction and the release of vasoconstriction would occur at higher skin temperatures in hypoxia can be accepted for the fingers but not for the toes. Additionally, onset and release of vasoconstriction were found to occur at higher mean skin temperatures in the toes than in the little finger and thumb.
This study provides a clearer determination of changing vasomotor responses, particularly at the onset of vasoconstriction, during normoxic and hypoxic conditions. This was possible by gradually cooling the air, in comparison to the rapid local or whole body cold water immersions used in previous studies. 6 ,20,21 The prolonged finger rewarming in hypoxia observed in the present study has also been reported elsewhere.5,6 This may be the consequence of the greater sympathetic response to hypoxic environments or related to the hypoxic hyperventilation and hypocapnia that result in reduced perfusion of the extremities. 22
In the current study, vasoconstrictor responses during hypoxic and normoxic exposures were complete by mean skin temperatures of 30oC, local skin temperatures of 23oC, and air temperatures greater than 13oC, while deep body temperature was maintained. Once vasoconstriction was confirmed at all test sites, gradual rewarming was performed. The ambient temperature range (30–13°C) at first appears rather distinct from the ambient conditions likely to be experienced at altitude and those that may result in prolonged vasoconstriction and possibly NFCI. When clothing is factored in, the microclimate temperature range generated between garments and the skin is closer to the ambient temperature range used in the present study, where minimal clothing was worn. For instance, Cernych et al 23 exposed volunteers dressed in long-sleeved shirts and leggings to ambient conditions of 8°C; the microclimate next to the skin was in the region of 23 to 30°C. Additionally, A Ha et al 24 exposed volunteers dressed in ski suits and various undergarments (maximum clo of 2.5) to ambient temperatures of 0°C and air flows of 0.26 m·s-1; they recorded mean skin temperatures between 31 and 35°C.
NFCI is considered a reperfusion injury that develops after a single period or multiple periods of prolonged vasoconstriction. 25 Typically, NFCIs have been found when ambient conditions fall between 15 and −0.5°C for prolonged durations. 4 ,26,27 This may be either exposure of naked skin to the environment or in conditions in which the microclimate next to the skin falls and is maintained below 15°C for some considerable time. Our results indicate that the ambient conditions were cold enough to induce maximal vasoconstriction. It seems that hypoxia may also increase the mean skin temperature at which maximal vasoconstriction and the release of vasoconstriction occurs in the thumb and little finger. If exposed for prolonged durations in temperatures that maintain a vasoconstricted state, hypoxia may extend the period of poor perfusion of cooled tissues and may increase the risk of NFCI.
The subjective perceptions of thermal comfort and sensation indicate that similar subjective responses were apparent during cooling, but upon rewarming, volunteers reported feeling cooler and less comfortable when hypoxic. These alterations in subjective responses may lead to behavioral changes in real-world settings (such as an increased exercise intensity or adding more clothing where possible) in a hypoxic environment, which may reduce the extent and duration of vasoconstriction, possibly reducing the risk of NFCI.
Site-Specific Differences in Vasomotor tone
In this study, in normoxic conditions, the toes vasoconstricted at higher mean skin temperatures than the little finger and thumb. Likewise, upon rewarming, the finger and thumb skin blood flow returned more rapidly and the skin temperatures increased at a greater rate than that measured for the toes. It seems unlikely that a single factor is responsible, and the difference may be related to the morphological, neural, and vasomotor characteristics of the feet and hands, which culminate in a greater area-specific heat flow to the hands than to the feet.13,28 In this study, the onset and release of vasoconstriction in the toes occurred at higher mean and local temperatures than in the thumb and fingers. This suggests that the toes receive a greater dose of cold. It is also possible that despite excluding those who had a history of cold injury, 2 participants may have had cold-sensitive feet or mild, undiagnosed NFCI. Their toe data were excluded from these analyses because vasoconstriction persisted during passive rewarming and subsequent exercise. This is also why no determination of the release of vasoconstriction was made; only a small number of the volunteers’ toes returned to baseline blood flow values during passive rewarming. This may be related to the sedentary nature of the experiment and the maintenance of deep body temperature during passive rewarming; further exercise was required to fully rewarm the toes of the remainder of the volunteers. Caldwell et al 28 suggests maximal vasodilatation of the toes occurs by inducing a level of hyperthermia. Indeed, the return of foot skin blood flow to enable the continuation of the experiment was promoted during this study by a short bout of cycling exercise, which increased deep body temperature by no more than 0.3oC, as has been found previously by Eglin et al. 14 Had the experiment focused solely on the fingers, the exercise bout would not have been required because maximal dilation was recorded with passive rewarming. Consequently, conclusions drawn from skin blood flow or skin temperature research using 1 site cannot be universally applied to all sites of the body, and separate site-specific investigations are necessary. 29
Studies of nonglabrous skin suggest that cutaneous vasodilatation is augmented by exposure to hypoxic conditions while applying cooling30,31 and during passive heating. 32 These findings seem contradictory to those presented for the fingers and hand in the present work and to previous work, 33 in which skin temperature was reduced in the fingers and toes during hypoxic exposure, compared with normoxia, in thermoneutral environments. These differences are a likely a consequence of the different structures and autonomic innervation of the cutaneous circulation of the glabrous sites used in the present study (the finger, thumb, and toe pads) compared with nonglabrous skin. 34 However, in the hypoxic condition in this study, a small increase in weighted mean skin temperature occurred after 5 min of breathing hypoxic gas, and the difference in weighted mean skin temperature was maintained throughout cooling. Interestingly, there were no differences in local finger and toe skin blood flow at this time. This may be a consequence of the use of nonglabrous sites used to calculate weighted mean skin temperature.
Limitations
It should be noted that particularly during the latter part of the cooling phase and the early part of the rewarming phase, the local skin temperature of the hands and feet may not be representative of vasomotor responses, but rather a reflection of gradual warming due to ambient conditions. 35 However, the ambient temperature change occurred at similar rates in both the normoxic and hypoxic exposures; this is in fact more ecologically valid because ambient conditions next to the skin may be constantly changing, depending on the level of insulation worn and environmental temperature.
The volunteers were not blinded to the gas mixture. Because skin blood flow can be affected by emotional state, 36 it may be that volunteers’ perceptions influenced skin blood flow responses. However, there are a number of thermal and nonthermal factors that stimulate change in skin blood flow. 37 Despite controlling posture and exercise during the study, it was not possible to control the volunteers’ emotion in response to the exposure. Although heart rate and subjective votes between the exposures were similar at similar ambient temperatures, this factor cannot be excluded.
This study examined the vasomotor responses of both the fingers and toes to a combination of environmental stressors (hypoxia, gradual air cooling followed by rewarming). It is concluded that vasoconstriction and release of vasoconstriction of the thumb and little finger occur at higher skin temperatures during hypoxia than during normoxia. Conversely, vasoconstriction and the release of vasoconstriction of the toes occurred at similar skin temperatures in hypoxic and normoxic environments. Consequently, site-specific research is required for separate determination of vasomotor responses considering that application of the findings from the hands would lead to spurious conclusions about the feet. It is also concluded that the earlier vasoconstriction and later release of constriction in the finger and thumb during cold and hypoxic conditions could result in a prolonged dose of cold to those digits. In applied settings, this may mean that the fingers take longer to rewarm once vasoconstricted, which may increase the risk of NFCI.
Acknowledgments: The authors thank the volunteers for their participation and patience, Mr. Geoff Long and Mr. Danny White for their technical support, Dr. James Clark (King’s College London), and Dr. Gaizka Mejuto (University of the Basque Country).
Author Contributions: Study concept and design (HM, JRH, MJT); acquisition of the data (HM, JRH, MJT); analysis of the data (HM & JRH); drafting of the manuscript (HM); critical revision of the manuscript (JHR, MJT); and approval of final manuscript (HM, JRH & MJT).
Financial/Material Support Statement: None.
Disclosure Statement: None.