
Abstract
Objective
The purpose of this study was to compare glucose and insulin responses during an oral glucose tolerance test (OGTT) in cold (C), neutral (N), and hot (H) environments.
Methods
Eleven males completed three 4-hour climate-controlled OGTT trials (C, 7.2°C; N, 22°C; and H, 43°C). Participants remained semireclined for 60 minutes before ingesting a 1.8 g/kg glucose beverage. Skin and rectal core temperatures were continuously monitored. Blood was collected just before glucose ingestion (time 0) and at 15, 30, 60, 90, 120, and 180 minutes, and analyzed for serum glucose, insulin, hematocrit, and hemoglobin. Expired gases were collected upon entering the chamber (−60 minutes), before glucose ingestion (0 minutes), and at 60, 120, and 180 minutes to determine V
Results
Rectal core temperature was greater in the H condition compared with both C and N (P < .001). Rectal core temperature was not different between C and N, whereas skin temperature was different across all trials (H greater than N greater than C). The V
Conclusions
These data indicate that after an OGTT, glucose and insulin are elevated in a hot environment.
Introduction
Many persons, such as athletes, military personnel, and firefighters, are exposed to adverse environments in which their fuel utilization and ability to recover is affected by thermoregulatory stress.1,2 The effect of environmental temperature on substrate oxidation has been studied extensively; however, much of this work has been under the stress of exercise. 3 There is a paucity of research on the direct effect of both hot and cold environments on the glucose and insulin response to an oral glucose tolerance test (OGTT) at rest.
Hot environments typically result in elevated blood glucose compared with thermoneutral environments; however, that is thought to be a result of elevated hepatic glucose output due to increased sympathetic drive. 3 A study done at rest compared four environmental temperatures—20°C, 25°C, 30°C, and 35°C—during a standard OGTT and found that glucose remained elevated 2 hours after consumption at the two higher temperatures. 4 This result is supported by others, 5 and appears to be amplified in subjects with diabetes mellitus. 6 However, none of these studies also examined the effects of cold in the same set of subjects.
We have demonstrated impaired glycogen synthesis while recovering in the heat compared to a thermoneutral environment. 7 In this study, blood glucose was elevated in the heat after postexercise feeding; thus, it was not apparent what mechanism drove the attenuation of glycogen synthesis while recovering in the heat. Core temperature was elevated during recovery in the heat, but skin temperature was not measured; 7 however, subsequent work by our laboratory demonstrated that skin temperature would be elevated under similar conditions in the heat. 8 This finding suggests that despite elevated blood glucose in the heat, and thus apparent increased glucose availability, that may not be manifest as increased glucose uptake into muscle. It remains unclear whether that is due to decreased glucose transport or to a redistribution of blood flow away from muscle.
Cold exposure, conversely, is well known to elevate energy expenditure by both shivering and nonshivering thermogenesis. 8 –10 The elevation of metabolic rate with shivering is thought to cause an increase in glucose uptake and carbohydrate oxidation. 8 –10 In the most relevant study to date, Vallerand et al 10 found that intravenous, but not oral, intake of glucose resulted in attenuated plasma glucose and insulin responses when humans were exposed to cold (10°C) compared with warm (29°C) environments. In a subsequent study, 9 the investigators found that cold exposure (10°C) elevates plasma glucose oxidation, resulting in attenuated plasma glucose after an intravenous glucose tolerance test. However, both of these studies compared infused glucose during cold exposure (10°C) compared with a warm environment (29°C), which may ignore the environmental effects on the gastrointestinal tract, as well as negating a thermoneutral control environment.
There remains a paucity of research demonstrating a clear effect of environmental temperature on blood glucose after an oral ingestion in the absence of exercise. The purpose of this investigation was to compare glucose, insulin, core and skin temperatures, energy expenditure, and fuel utilization during an OGTT in healthy males in cold (C [7.2°C]), thermoneutral (N [22°C]), and hot (H [43°C]) environments (33% relative humidity) at rest.
Methods
Subjects
Eleven healthy males volunteered for participation in the study (Table 1). Before testing, participants read and signed an informed consent form approved by the University of Montana Institutional Review Board.
Subject characteristics (n = 11)
Experimental Design
A week after preliminary descriptive testing of height, weight, body composition, and V
On the morning of the trials, subjects arrived after a 12-hour fast and were asked to void their bladders, after which nude body weights were taken. The subjects wore a standardized cotton T-shirt and shorts during all trials. Core and skin temperature was continually monitored using a data acquisition system (Physitemp Instruments, Clifton, NJ) with a rectal thermistor inserted 15 cm past the anal sphincter, and a skin temperature patch placed on the chest halfway between the nipple and the acromion process. Subjects then entered the climate-controlled chamber and remained semireclined for 60 minutes before ingesting a 1.8 g/kg bodyweight glucose beverage. During this time, a catheter was inserted in the antecubital vein with patency maintained by a saline drip. At a minimum of 15 minutes after catheter insertion, blood was collected just before glucose ingestion (time 0) and at 15, 30, 60, 90, 120, and 180 minutes after consumption. Participants remained in the environmental chamber for 4 hours, during which they were allowed to read, watch movies, or listen to music while remaining semireclined. Water was allowed ad libitum, with intakes recorded. Voided urine was collected, and 4 hours after environmental exposure, nude body weights were measured to estimate sweat loss, sweat rates, and diuresis. Expired gases were collected for 3 to 5 minutes and averages taken from a mixing chamber (Parvo Medics, Salt Lake City, UT) upon entering the chamber (−60 minutes), just before glucose ingestion (0 minutes) and at 60, 120, and 180 minutes to determine V
Body Composition
Body density was determined using hydrodensitometry and corrected for estimated residual lung volume. 12 Net underwater weights were recorded using load cells (Exertech, Dresbach, MN). Body density was then converted to body composition using the Siri equation. 13
Cardiorespiratory Fitness
To assess aerobic fitness, participants completed a graded exercise test on an electronically braked cycle ergometer (Velotron, Racermate, Seattle, WA). The initial 95 W workload was increased 35 W every 3 minutes until subjects achieved volitional fatigue. Exercise tests were performed in the laboratory at ambient temperature. Gas expiration during testing was collected using a calibrated metabolic cart (Parvo Medics) and analyzed at 15-second intervals.
Blood Analysis
Blood samples were analyzed to determine serum glucose, insulin, and plasma volume changes. Immediately after the catheter draw (3–5 mL), a small sample of whole blood (1–2 mL) was dispensed into a heparinized Vacutainer tube (BD, Franklin Lakes, NJ) to determine hematocrit and hemoglobin, with the remaining sample (2–3 mL) added to a serum separator Vacutainer and spun at 3500 rpm for 5 minutes. Serum was aliquoted into separate microcentrifuge tubes and frozen for the subsequent analysis of glucose and insulin.
Hematocrit was completed in triplicate in heparinized microcapillary tubes (70 μL, Jouan, Winchester, VA) and spun for 3 minutes. Hemoglobin was determined using a whole blood sample added to Drabkin’s reagent (Sigma, St. Louis, MO) and read on a spectrophotometer at 540 nm in triplicate. Serum glucose concentration was analyzed using infinity glucose reagent (Fisher, Middletown, VA) and read on a spectrophotometer at 340 nm (coefficient of variation = 1.1). Insulin was analyzed using an enzyme-linked immunosorbent assay kit according to manufacture instructions (DRG International, Mountainside, NJ) (coefficient of variation = 3.8). Serum insulin and glucose were corrected for changes in plasma volume using the method outlined by Dill and Costill. 14
Sweat Rate
Sweat loss was calculated using the pre-trial and post-trial nude body weight (BW) and corrected for urine excreted, saline infused, water consumed, and expiratory water. 15 Sweat loss was converted to a sweat rate relative to body surface area: 16 sweat rate (mL·min−1·m−2) = (BWpre + Water cons + IV) − (BWpost + Urine + Resp Water Loss) / BSA.
Statistics
Dependent variables were compared using two-way repeated-measures analysis of variance (time-by-trial). After confirmation of normality, in the event of a significant f-ratio, post-hoc Fisher’s protected least significant difference procedure was used to determine where differences occurred. Water balance and energy expenditure data (Table 2) were compared using one-way analysis of variance. All statistics were performed using SPSS for Windows version 19 (SPSS, Chicago, IL). Statistical significance was set at P < .05. All data are reported as mean ± SE.
Water balance during the three environmental oral glucose tolerance test conditions
Values are mean ± SEM.
Significant effect of trial (P < .05).
Hot different from cold and neutral.
Results
Body weight change during the three trials was significantly different between treatments (P=0.016) (Table 2). Post-hoc analysis indicates that there was a greater weight loss in the H trial than in both the C and N trials (P=0.015 and P=0.01, respectively). That is the result of greater sweat loss and sweat rate during the H trial (P<.001), because water intake and saline infusion did not differ between trials. Urine losses were greater during the C and N trials (P<.003), indicating a diuresis that resulted in significant water loss. That is represented in negative sweat loss and rates during the C and N trials.
Oxygen consumption (V
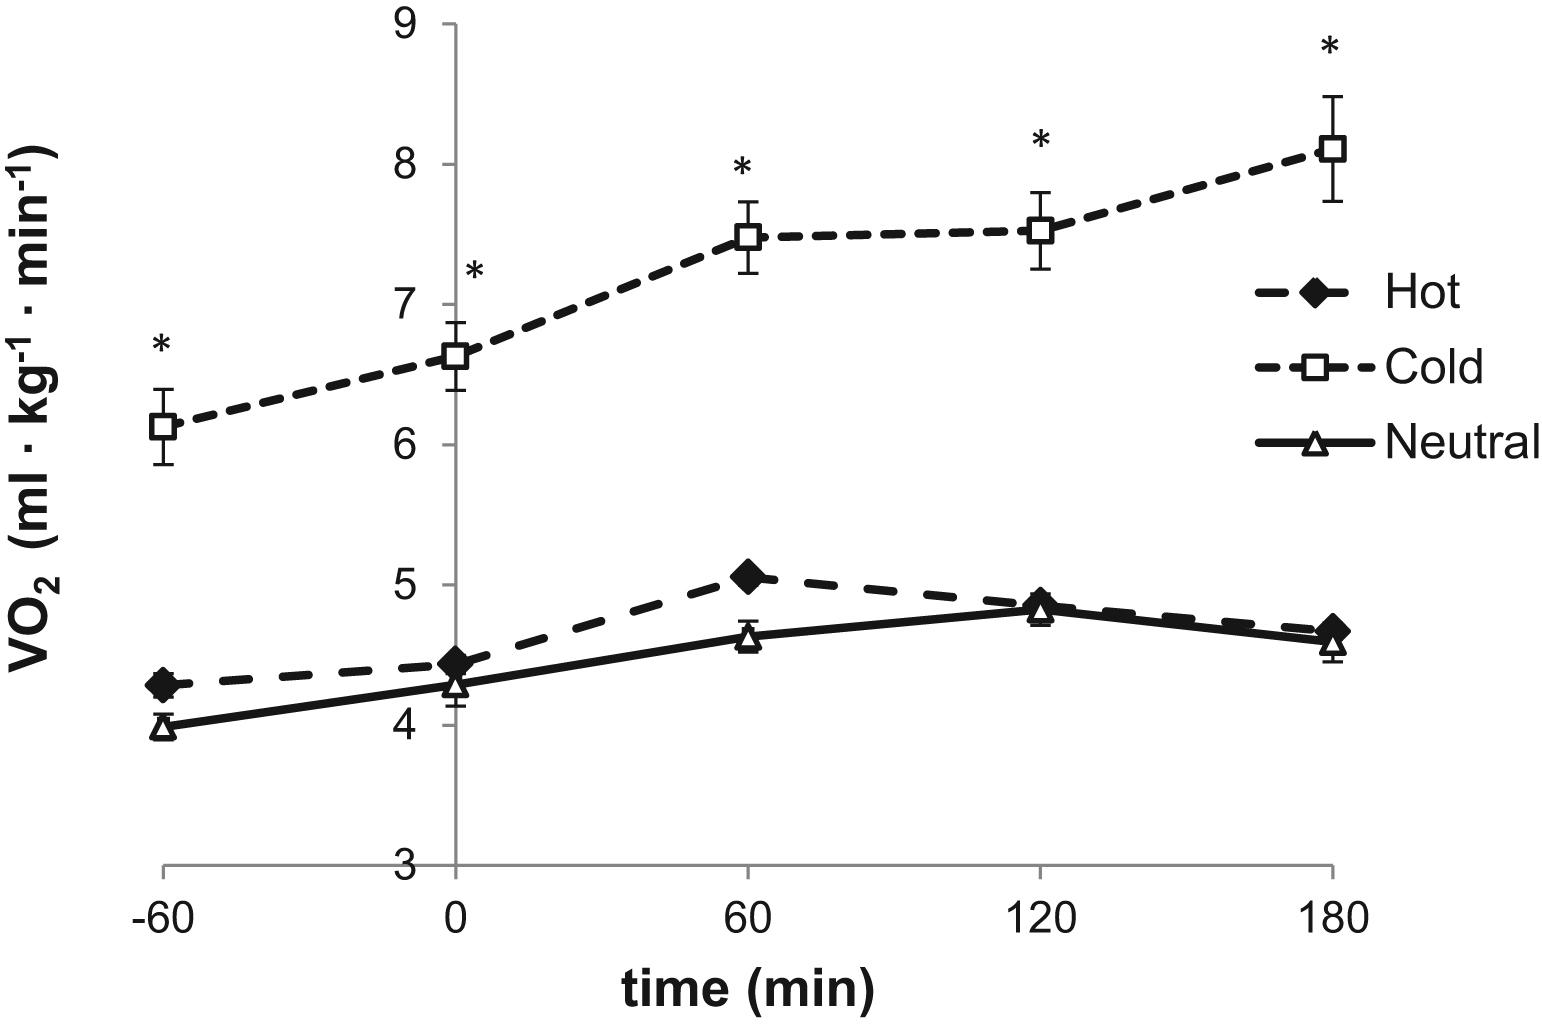
Oxygen consumption (V
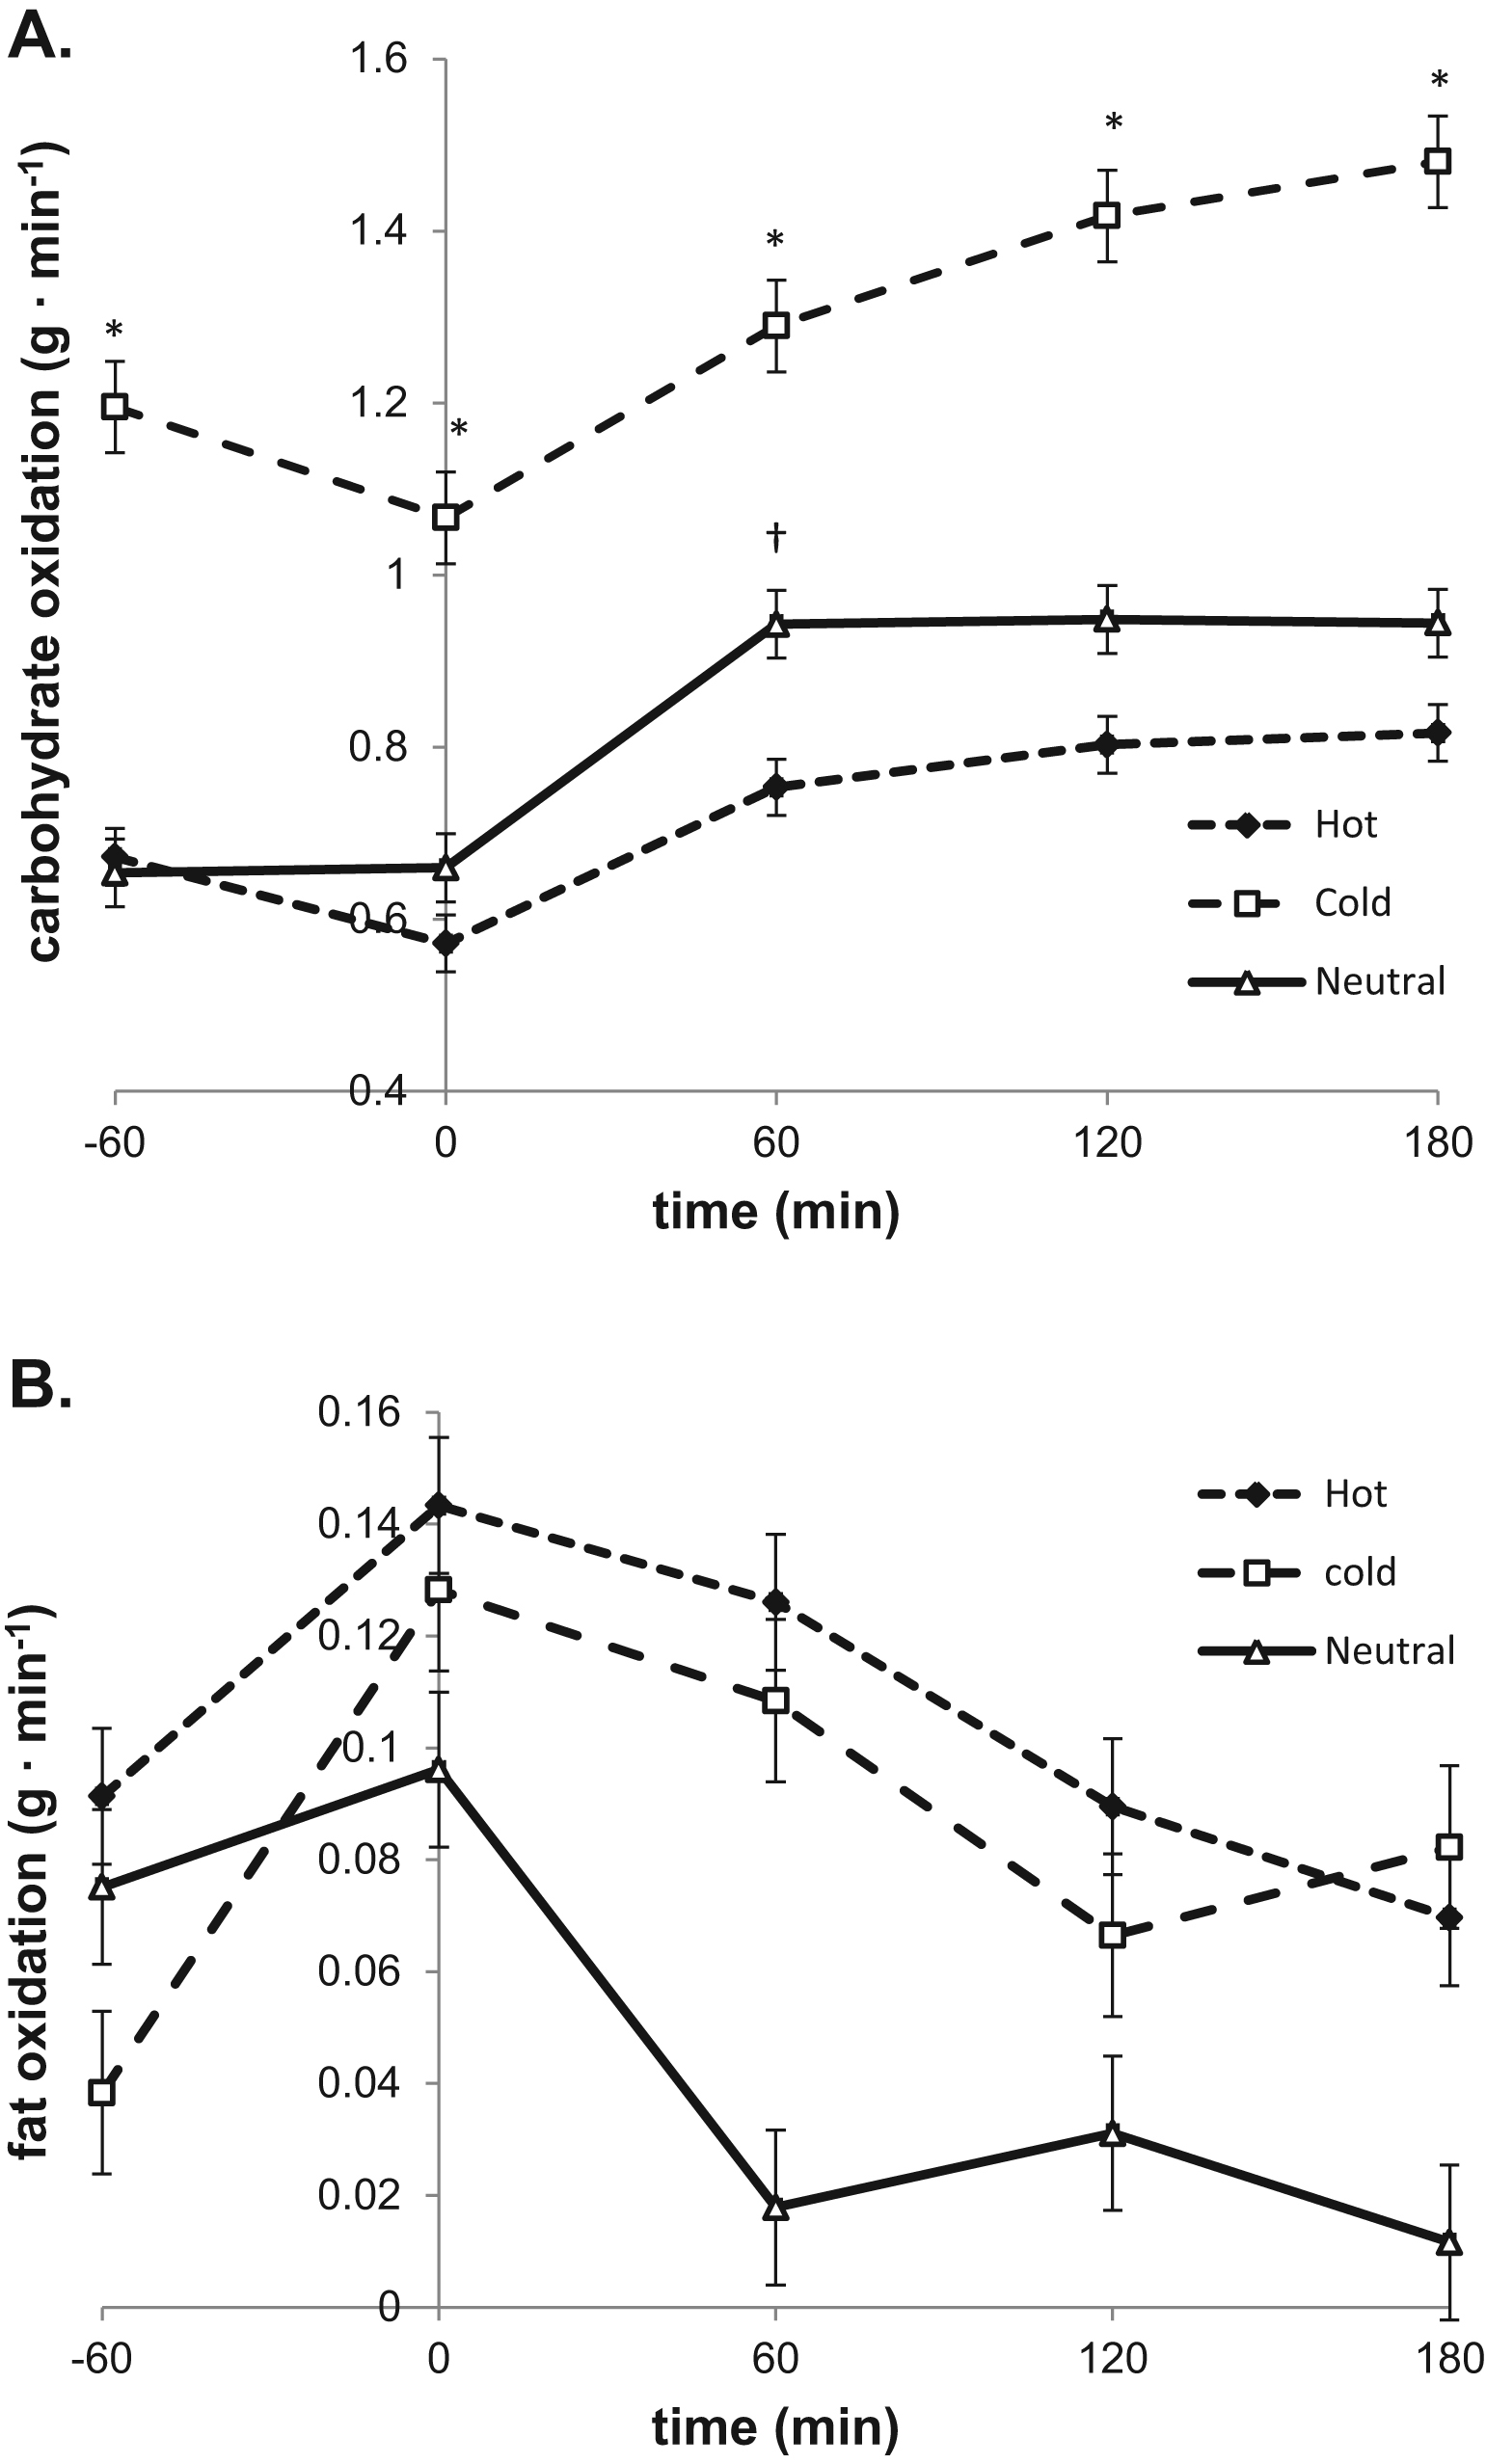
(A) Absolute carbohydrate oxidation during the 240 minutes in the climate chamber. *Cold trial (squares) different from both hot trial (diamonds) and neutral trial (triangles). †Neutral trial different from hot trial. (B) Absolute fat oxidation during the 240 minutes in the climate chamber.
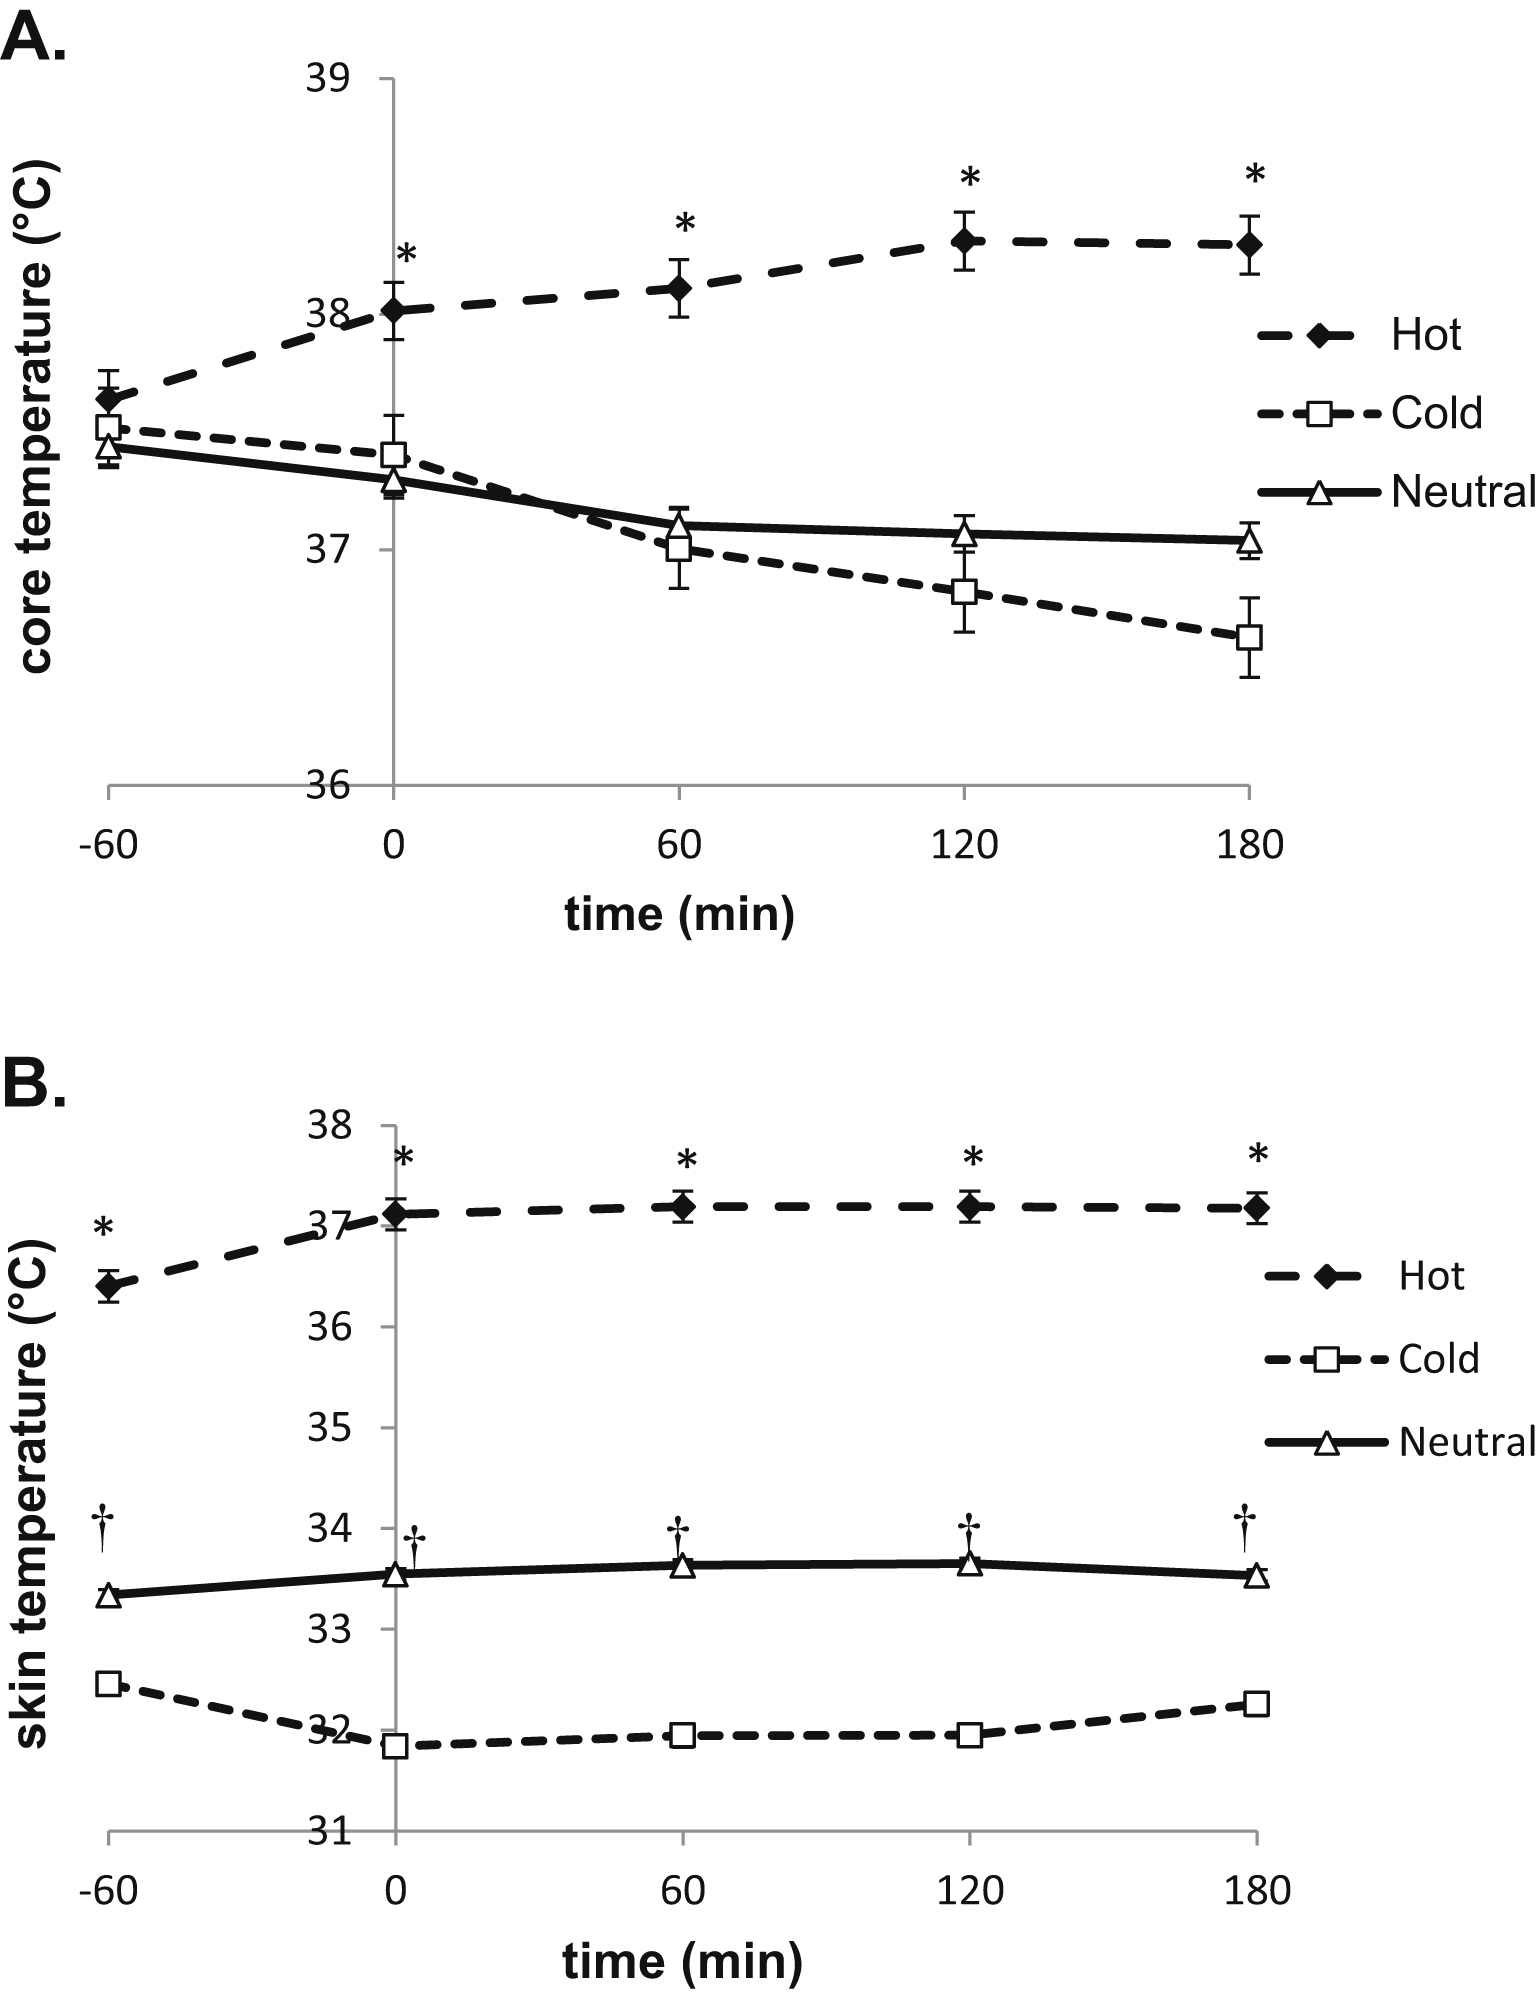
(A) Core temperature during the 240 minutes in the climate chamber. *Hot trial (diamonds) different from both cold trial (squares) and neutral trial (triangles). (B) Skin temperature during the 240 minutes in the climate chamber. *Hot trial different from both cold and neutral trials. †Neutral trial different from cold trial.
Serum glucose and insulin responses to the OGTT were corrected for plasma volume shifts (Figure 4A). There was a significant main effect of time, trial, and a time-by-trial interaction on serum glucose (P<.001). Post-hoc analysis indicated serum glucose was elevated during the H trial compared with both C and N trials from 15- to 120-minute time points (P<.002). A significant main effect of time was found for serum insulin (P<.001) (Figure 4B). There was a main effect of trial (P=.03), but not an interaction (P>.05) on serum insulin. Insulin was elevated in the H trial compared with the C trial at 60 and 120 minutes (P<.05). Glucose area under the curve (AUC) was significantly greater during the H trial compared with both the C and N trials (P<.001) (Figure 5A). Insulin AUC was not different among trials (Figure 5B).
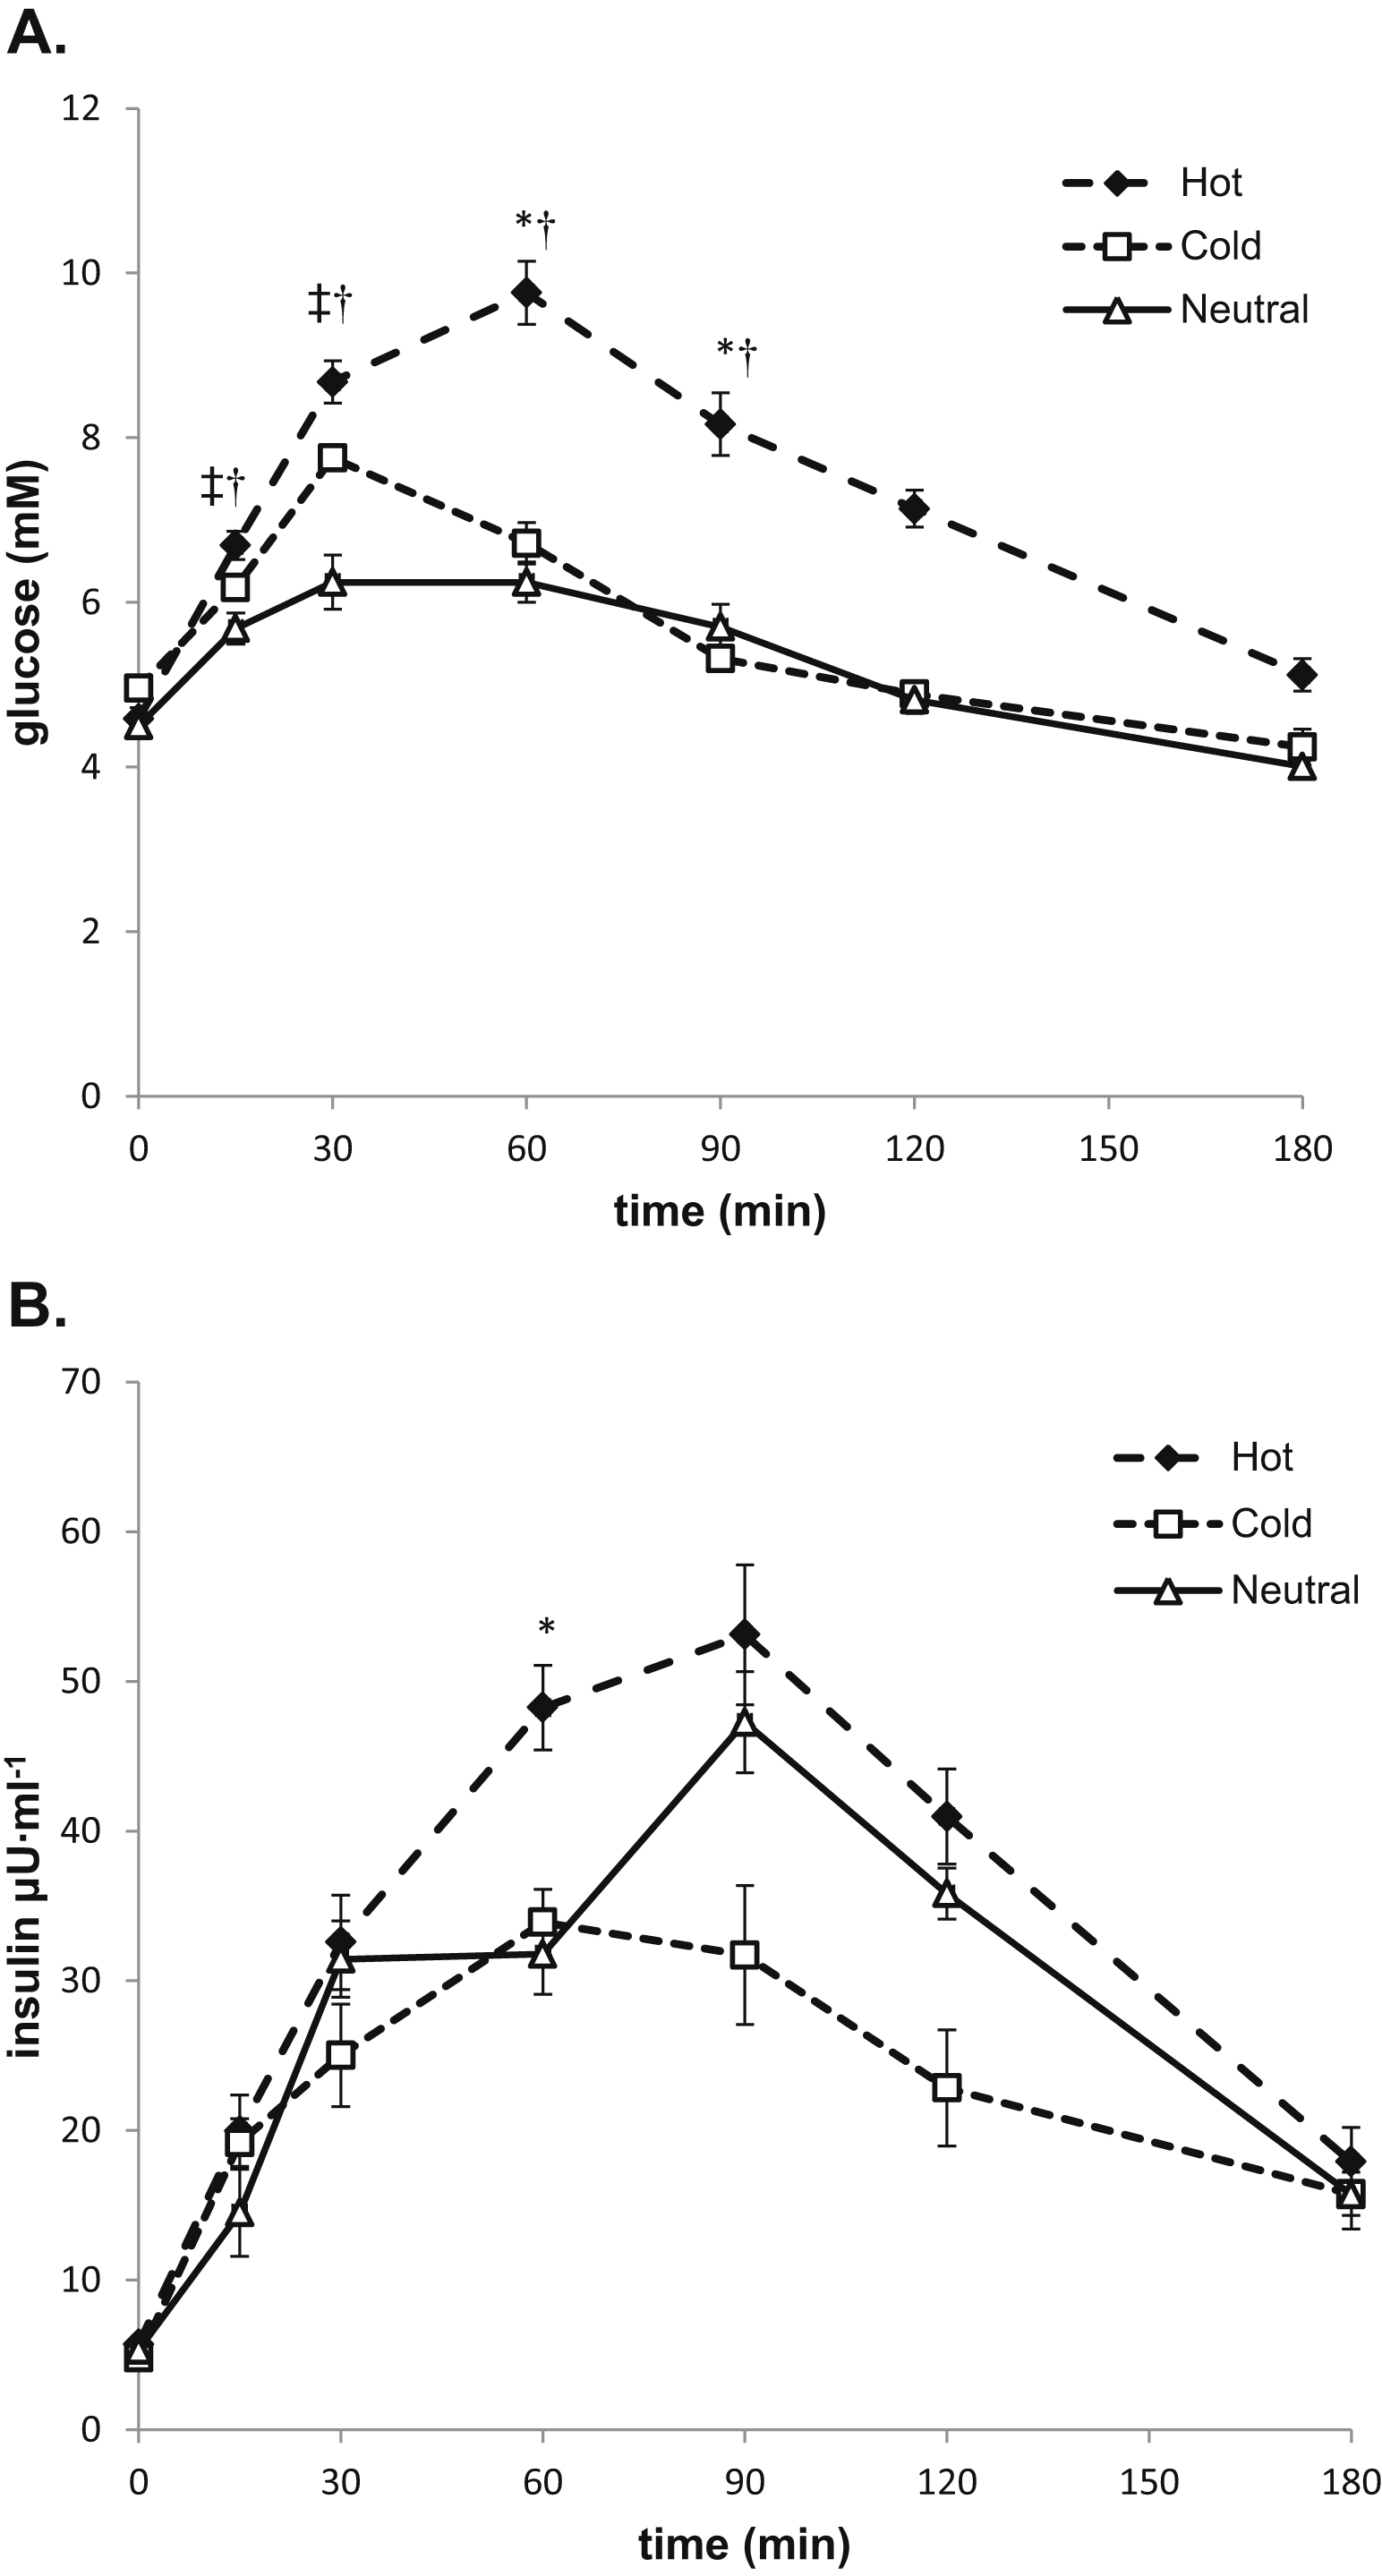
(A) Serum glucose during the 180-minute oral glucose tolerance test (OGTT). *Hot trial (diamonds) different from cold trial (squares). †Hot trial different from neutral trial (triangles). ‡Cold trial different from neutral trial. (B) Serum insulin during the 180-minute OGTT. *Hot trial different from cold trial.
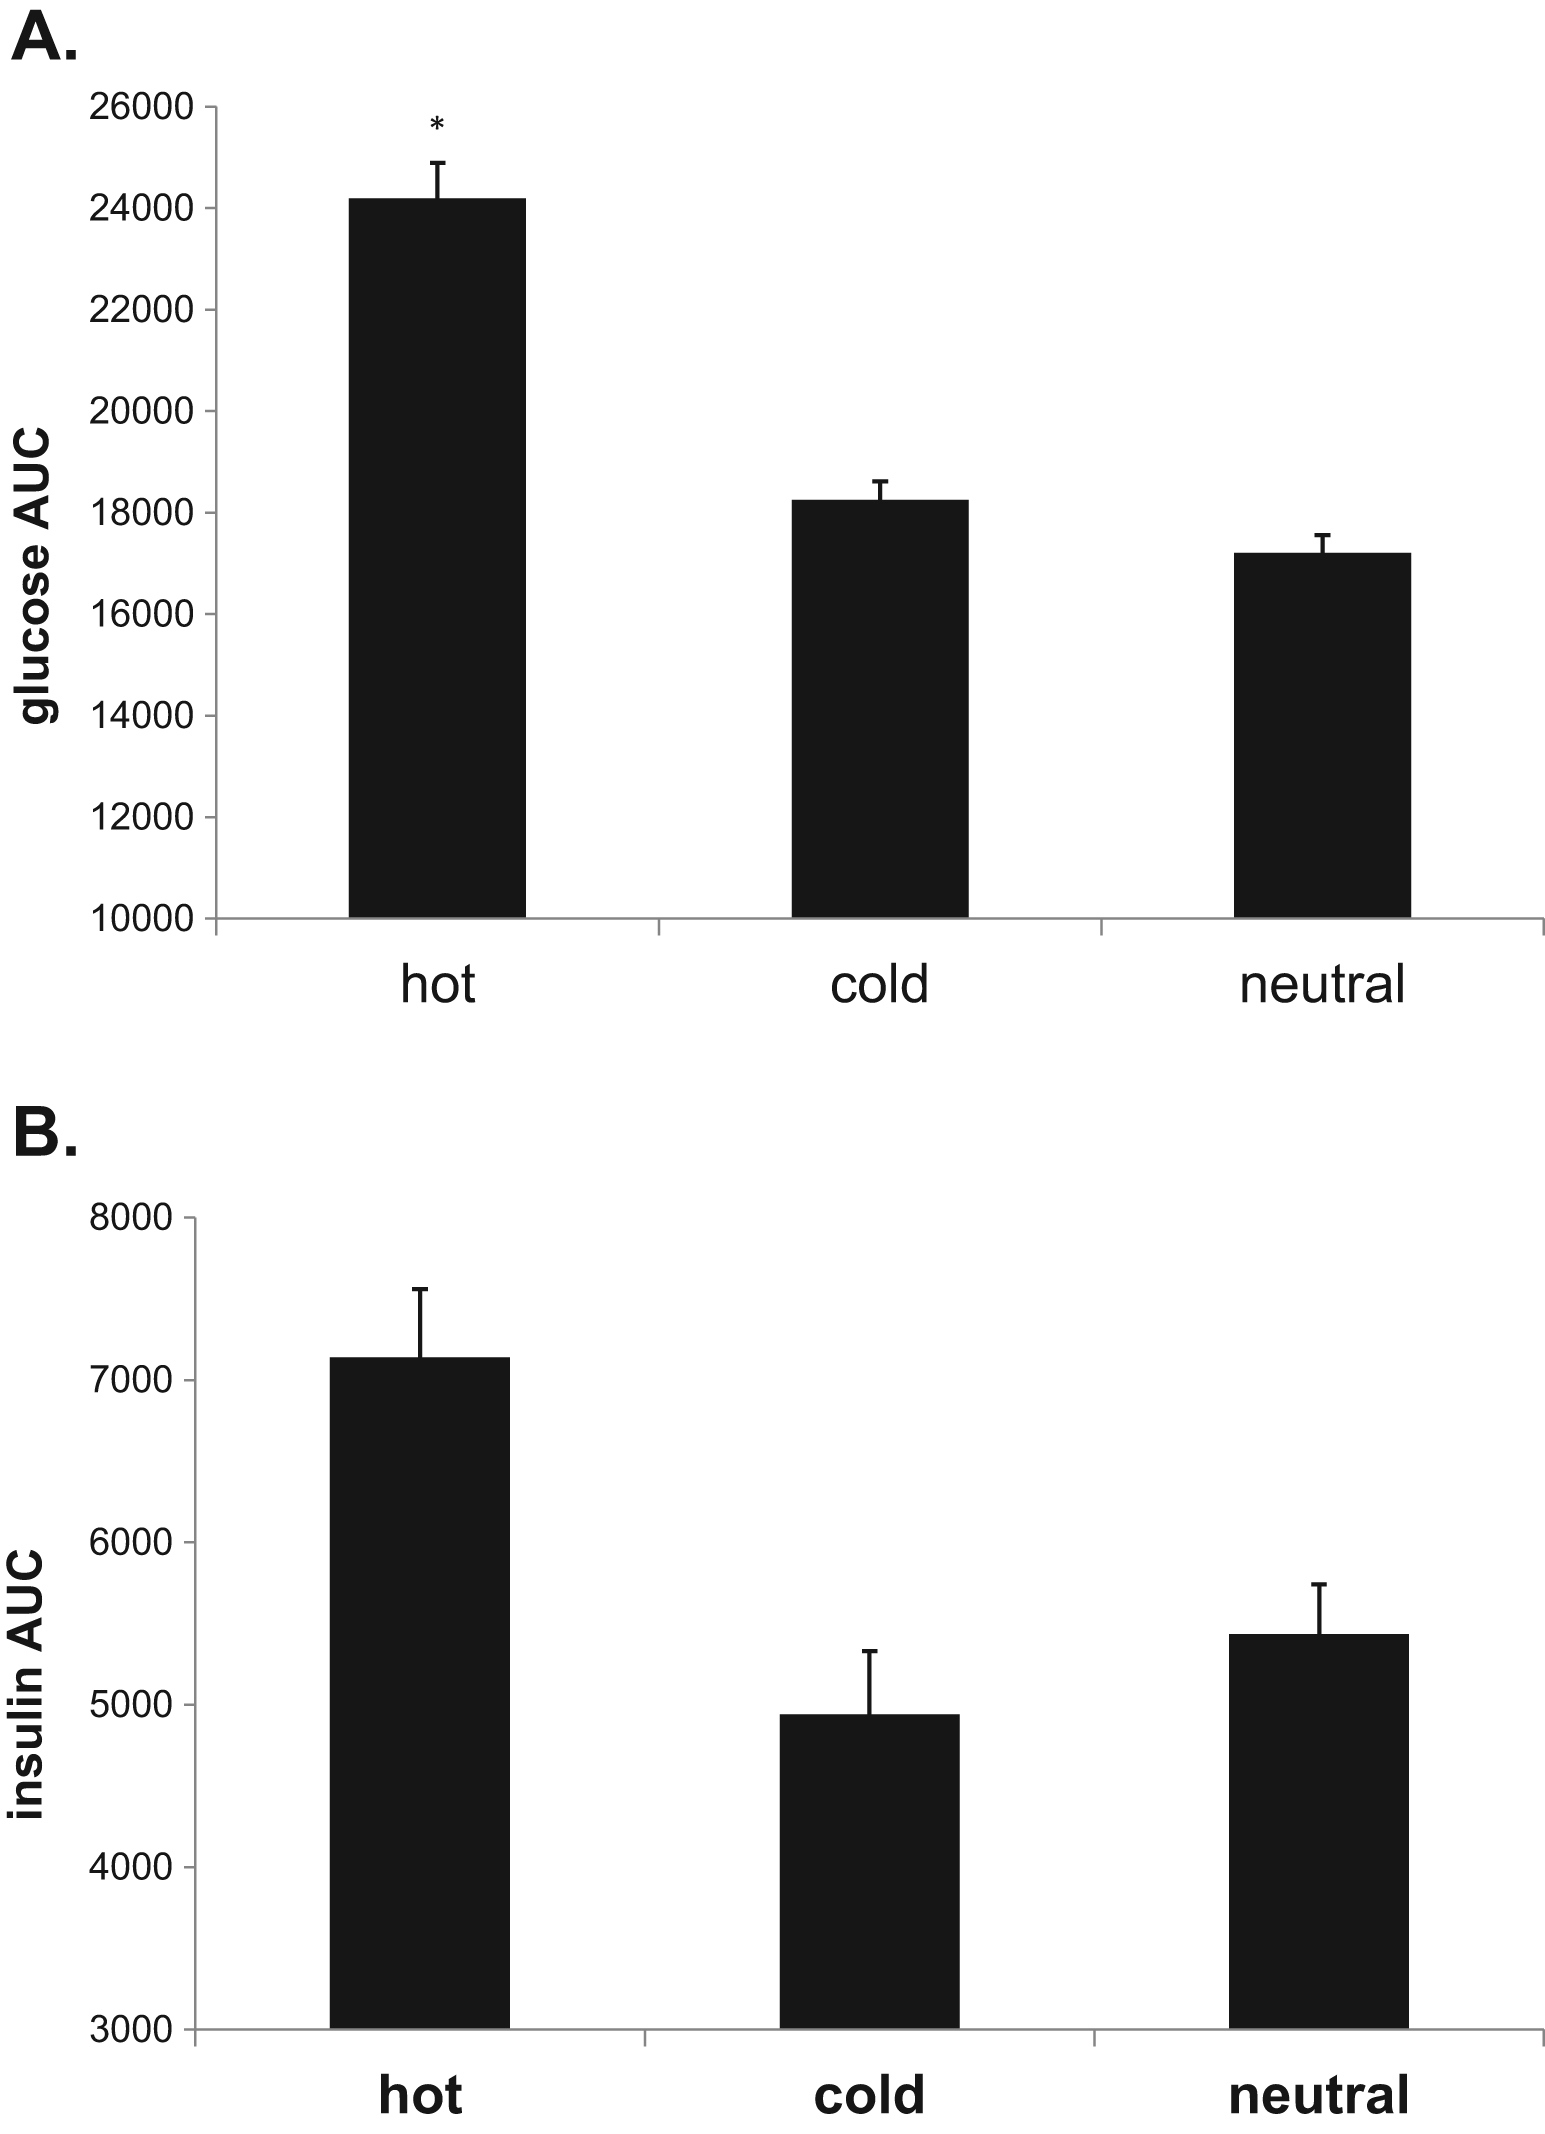
(A) Serum glucose area under the curve (AUC) during the 180-minute oral glucose tolerance test (OGTT). *Hot trial different from both cold and neutral trials. (B) Serum insulin AUC during the 180-minute OGTT.
Discussion
These data indicate that for healthy, young male subjects, environmental conditions alter the glucose and insulin response to carbohydrate ingestion. Specifically, serum glucose was elevated after carbohydrate ingestion in the heat (43°C) compared with both the cold (7.2°C) and the neutral (22°C) environments. This finding coincides with elevated V
Our data illustrate a nearly twofold increase in total 4-hour energy expenditure during the cold trial compared with both hot and neutral trials. Despite this large difference in whole body energy expenditure, there was no difference between the cold trial and neutral trial in serum glucose and insulin AUC. That may be because of the environmental effects on gastrointestinal emptying,17,18 or the elevated catecholamine response during cold exposure. Cold exposure increases epinephrine and norepinephrine several fold, which increases hepatic glucose output. 10 In subsequent work, it was demonstrated that cold exposure increases the turnover and metabolic clearance of glucose, and that this glucose oxidation is shared between plasma and muscle carbohydrate resources. 9
Our data support that finding, with the observed increased carbohydrate oxidation during the cold trial. Although we did not measure circulating catecholamines, it suggests that the elevation in whole body carbohydrate oxidation during cold exposure is not the sole reason for differences in glucose responses to a feeding. It may be that hepatic glucose output during our cold trial masked differences to the neutral trial. Indeed, when glucose is delivered during cold exposure, it reduces reliance on liver-derived glucose, indicating the importance of hepatic glucose output in the cold.
19
Serum glucose after ingestion of carbohydrates in the cold becomes a balance of hepatic glucose output, muscle uptake, and perhaps core temperature. Serum glucose in the cold trial may not have been different from the neutral trial, despite differences in V
In the hot trial, serum glucose was elevated from 15 to 120 minutes, resulting in a 33% elevation in the glucose AUC over the cold and neutral trials. Elevated glucose after a feeding at rest in the heat is supported by previous work. 4 –6 Moses et al 4 found that at temperatures of 30°C or greater, plasma glucose was elevated compared with temperatures of 30°C or less. Across four different warm temperatures tested, they found strong nonlinear relationships between core temperature (auditory) and the 2-hour plasma glucose response. They suggest that observation is due to elevated skin and visceral blood flow at the higher ambient temperatures. Although they did not have measures of cutaneous or visceral blood flow, they did show elevations in skin temperature. If skin temperature is accepted as a proxy for skin blood flow, one may speculate that the blood flow to the skin in the current study during the hot trial jeopardized glucose uptake by the insulin-sensitive tissues of muscle and fat, which is consistent with the data from Moses et al. 4 Although these two studies both involved young healthy males, similar results have been demonstrated in persons with diabetes and in tropical races.6,20
Perhaps paradoxically, heat treatment in animal models such as rats and mice have shown improvement in glucose tolerance. 21 –23 It should be noted, however, that heat treatments for animals are typically in warm water baths. That, together with the differences in cutaneous blood flow between humans and furred animals with heat exposure, may explain the differences in results with our current study in humans.
These current data may have impact in a number of different areas. Previous work from our laboratory has suggested that glycogen replenishment after exercise is jeopardized in the heat, 7 but unaffected in the cold. 24 Previous to the current study, these data were difficult to interpret. Our current study demonstrates that when cold exposed, carbohydrate oxidation increases to support the elevated energy expenditure. That does not appear to jeopardize glycogen recovery after exercise, however. 24 Previous evidence suggests that contribution from the cold-induced catecholamine-stimulated hepatic glucose output supports this elevated carbohydrate oxidation. 9 ,10,19 It now also appears that despite changes in energy expenditure and carbohydrate oxidation in the cold, core temperature and the corresponding redirection of blood flow may be more important in determining the fates of ingested macronutrients. In hot environments, blood flow to the skin reduces delivery to the insulin-dependent muscle tissue, and thus reduces glucose tolerance and subsequent glycogen synthesis. These and previous data do not rule out the possibility that heat may acutely reduce skeletal muscle insulin sensitivity—which may be important for the insulin insensitive, or for populations exposed to extremes in environment, such athletes, military personnel, and firefighters. Previously, we have also shown that acute cold exposure may enhance mitochondrial development after exercise. 8 Consistent with these data, chronic cold exposure in animals results in improved glucose tolerance and insulin sensitivity.25,26 Together, these data suggest that cold exposure may improve glucose tolerance, insulin action, and enhance mitochondrial biogenesis compared with warm and hot environments.
Conclusion
For the first time, we report the glucose and insulin response to orally ingested glucose at rest in cold, thermoneutral, and hot environments. These data indicate that the glucose and insulin response to a resting OGTT is affected by environmental temperature, with elevated serum glucose and insulin in hot environments.
Footnotes
Funding
The authors wish to thank the subjects for their investment in time and energy. This study was supported by a grant award from the Office of Naval Research (N000140910850).
Acknowledgments
The authors declare that they have no competing interests in access to these data or associations with companies involved with products used in this research. The views and conclusions contained herein are those of the authors and should not be interpreted as necessarily representing the official policies or endorsements, either expressed or implied, of the Office of Naval Research or the US government.
☆
Presented at the American College of Sports Medicine 60th Annual Meeting, May 28–June 1, 2013, Indianapolis, IN.