
Abstract
Objective
Although the majority of high altitude studies have used doubly labeled water to assess energy expenditure (EE), minimal research has examined variation in intensity levels while participating in such an expedition. The purpose of this study was to use ambulatory monitoring technology to assess EE and time spent in moderate (3.0–6.0 METS), vigorous (6.0–9.0 METS), and very vigorous (>9.0 METS) intensities during an expedition to summit a 6170-m peak in Northern Pakistan.
Methods
Twelve men and 2 women were studied. Their EE was determined from galvanic skin response, heat flux, and biaxial accelerometry using a multisensor armband. Lake Louise Scores for altitude illness assessment were obtained each morning.
Results
Average daily total EE and number of steps taken was 4173 ± 848 kcal/d (range, 3332 to 4838 kcal/d) and 26,232 ± 7210 steps/d (range, 11,788 to 34,979 steps/d), respectively. On average, subjects spent approximately 7.7 h/d performing physical activity (>3.0 METS). Of this, subjects spent 399 ± 107, 61 ± 77, and 3 ± 10 min/d at moderate, vigorous, and very vigorous intensity levels, respectively, corresponding to 88%, 11%, and 1% of total physical activity time. During summit day, subjects climbed at an intensity equivalent to approximately 42% of their high altitude predicted maximal oxygen consumption at 5100 m).
Conclusions
During a high altitude expedition, subjects predominantly exercise at a moderate intensity, with limited time spent at higher intensity levels. Use of accelerometer-based technology may provide more cost-effective and logistically easier means of assessing EE in extreme environments.
Introduction
High altitude (>2400 m) energy expenditure (EE) is an area of mountaineering and climbing that has received limited attention. It is of importance especially in regard to maintenance of body energy stores and lean muscle mass, both of which are often decreased during high altitude mountaineering expeditions. 1 Previous work has estimated an EE of 4636 kcal/d in climbers ascending between 5900 m and 8046 m during a 7-day period on Mt. Shisha Pangma, Tibet. 2 On Mt. Everest, daily EE was estimated to be 3250 kcal/d on a 7- to 10-day summit attempt. 3 In addition, others measured EE on Mt. Everest and produced EE estimates of 3274 kcal/d in base camp personnel and 5394 kcal/d in climbers. 4 A study on Special Forces soldiers completing a 6-day military field training exercise between 2500 m and 3100 m on Mt. Rainier, Washington, estimated daily EE to be 4558 kcal. 5 The majority of studies used the gold standard technique of EE measurement, the doubly labeled water method (DLW). 2 –5 The DLW technique provides the highest accuracy for EE assessment for studies of longer duration (approximately 7 days), 6 –8 yet it is costly and requires technical expertise in obtaining daily food intakes and resting metabolic rate and in collecting and processing body fluids. Furthermore, the DLW analysis provides only a total estimate of EE, not allowing for differentiation between time spent and caloric cost of performing activity of different intensities. The assessment of EE using ambulatory monitoring technology provides a simple, noninvasive estimate not only of total EE but of variations in exercise intensity. One such device is the multisensor BodyMedia SenseWear Pro Armband (SWA), which calculates EE through measures of galvanic skin response, skin and ambient temperatures, and accelerometry. Previously, the SWA has been validated against the DLW method with reasonable accuracy for studies of longer duration. 9 –11 Other validation studies for the SWA against indirect calorimetry are typically shorter in duration (1–2 hours) and yield a greater degree of error, especially with higher exercise intensities. 12 –14
Intuitively, one would assume that an increase in altitude, and subsequently an increase in the steepness of the climb, would be associated with an increase in exercise intensity and a greater EE. By contrast, it is also possible that hypoxia may significantly reduce speed of ascent and therefore result in a lower than expected total EE, or at least limit the activity to lower levels. However, to our knowledge no previous study has examined the extent to which exercise intensity varies during a typical trek or climb with the ultimate goal to summit a high altitude peak. Moreover, it is unclear how the intensity of exercise during such a trek relates to an individuals’ capacity or how the total amount of active energy expenditure is related to the incidence of altitude illness. Accordingly, the purpose of the present study was to quantify both total and variations in EE, as assessed using the SWA, during ascent of a 6170-m peak. Second, we sought to determine whether any relationship exists between exercise intensity levels and symptoms of acute mountain sickness.
Methods
The data were collected as an educational project in conjunction with the Mike Horn Young Explorers Program. Mike Horn is an internationally recognized professional explorer who provides 10-day selection camps in Chateau D’Oex, Switzerland, whereby youth 15 to 22 years of age apply to participate in the camp and, if chosen, participate in expeditions. The expedition described in the present study was aimed at summiting a previously unnamed 6170-m peak in the Karakoram Mountains of Northern Pakistan. The expedition group subsequently named the mountain “Pangaea Peak.” The research team’s role was to provide education to the Young Explorers on high altitude physiological responses, altitude illness, and EE using their own physiological data. On completion of the expedition, the Mayo Clinic Institutional Review Board, Rochester, MN, approved analysis of the physiological data for publication purposes. All data were deidentified before analysis. Fourteen recreationally active subjects (12 men, 2 women, mean age, 28.1 ± 11.8 years) from a variety of countries participated in the data collection. One subject was a mountaineering guide with high altitude experience, whereas the remainder of subjects had not been to an altitude greater than 4000 m in the month before the expedition. Furthermore, all subjects had a permanent residence at an altitude of less than 1000 m. Baseline descriptive data are provided in Table 1. Weight was measured with a Tanita digital scale Model 682-BF (Tanita Corporation of America, Inc, Arlington Heights, IL). Height was measured with a cloth tape measure. Subjects had no history of cardiopulmonary abnormalities or musculoskeletal disorders.
Subject characteristics (n = 14)
Preliminary Testing
One month before the expedition, a subset of subjects (n = 9) attended the preexpedition selection camp in Chateau D’Oex, Switzerland (Mike Horn Expedition Center Headquarters, elevation 983 m) and underwent maximal oxygen consumption testing (

Expedition Details
Physiological monitoring for the expedition involved a total of 15 days. On arrival in Islamabad, Pakistan (elevation 507 m), subjects were instrumented for EE monitoring, overnight oximetry, and altitude illness severity assessment (Lake Louise Score [LLS]). A timeline of the expedition and data analysis are provided in Figure 1. Before the first day of trekking, subjects were given instruction on safety and how to efficiently and effectively trek from camp to camp. Subjects were instructed to move at their own pace and take rest breaks when needed. All subjects went on the same route throughout the duration of the trek and had similar weighted backpacks depending on body size (approximately 7–10 kg). Time at camp was spent resting, eating meals, and preparing equipment for the next day.
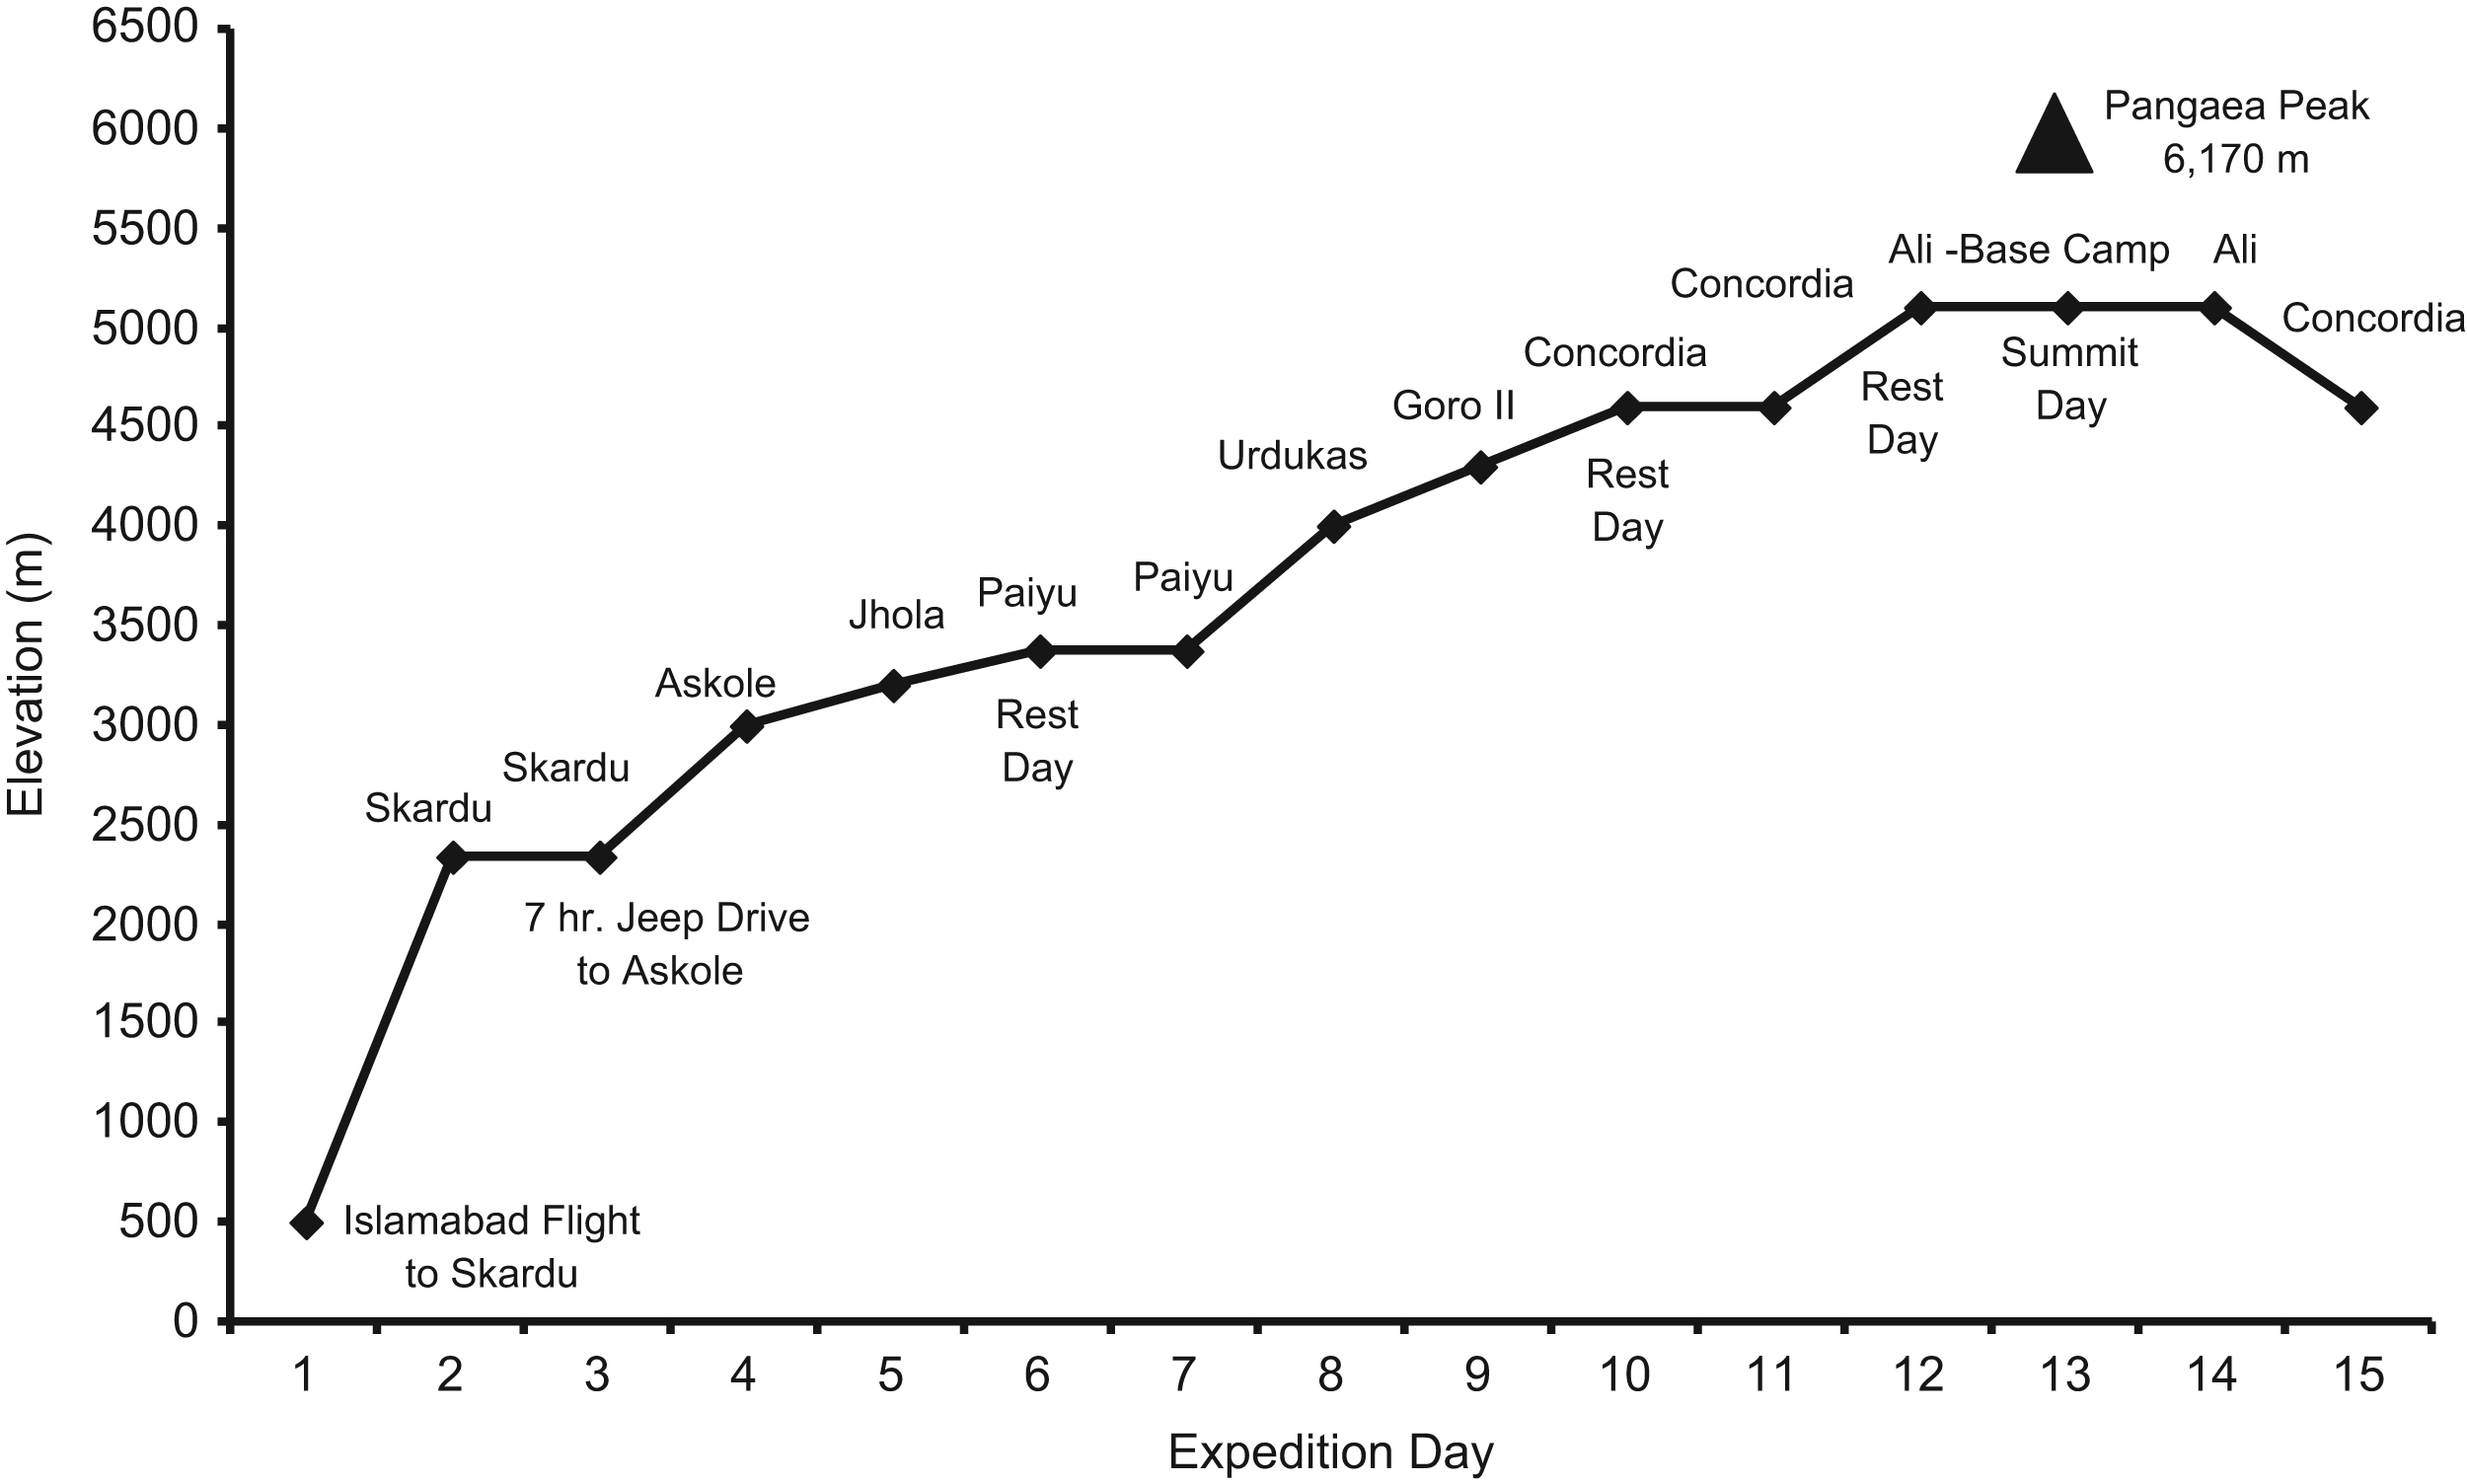
Expedition timeline. The location of the start of each expedition day is provided along with descriptions of other days.
Energy Expenditure Assessment
The SenseWear Pro Armband (SWA; BodyMedia, Pittsburgh, PA) was used to obtain daily EE. The device uses a 2-axis accelerometer, a heat flux sensor, a galvanic skin response sensor, and a near-body ambient temperature sensor to capture data. These data as well as age, sex, body weight, height, handedness, and smoking status (smoker or nonsmoker) are used in the algorithms to calculate EE. The SWA, through its algorithms, differentiates between sedentary (<3.0 METS), moderate (3.0–6.0 METS), vigorous (6.0–9.0 METS), and very vigorous (>9.0 METS) intensity levels. The armband was placed on the upper right arm on the triceps at the midpoint of the humerus facing posteriorly. It was placed on the subjects the evening of day 2 and removed days 6, 12, and 15 for data retrieval. BodyMedia SenseWear Professional Version 6.1 software provided the EE parameters for subsequent analysis. Subjects only removed the SWA when showering and for data download throughout the expedition.
Oximetry Data
Arterial oxygen saturation (Sa
Statistical Analysis
Results are presented as means, standard errors, and ranges. Paired Student’s t tests were used for comparison of EE, LLS, and Sa
Results
Expedition Details
So as to include only full EE datasets, the subject sample size was modified during the expedition. For days 1 to 9, all 14 subjects had complete datasets. At day 10, 2 subjects were removed because of acute mountain sickness (AMS) and were instructed to remain at the current elevation (4600 m) and rest while the remainder of the team ascended to 5100 m. In addition, 5 subjects’ data were removed from analysis on days 13 and 14 as these individuals did not achieve the summit. In summary, the sample sizes are as follows: days 1 to 9 (n = 14), days 10 to 12 (n = 12), and days 13 and 14 (n = 7).
Energy Expenditure
Energy expenditure parameters for the expedition are provided in Figure 2. Average daily total energy expenditure (TEE) was 4173 ± 848 kcal/d (range, 3332 to 4838 kcal/d). Group mean active energy expenditure (AEE; ie, >3.0 METS) was 2673 ± 906 kcal/d (range, 1582 to 3533 kcal/d). The number of steps taken was 26,232 ± 7210 steps/d (range, 11,788 to 34,979 steps/d). As expected, TEE, AEE, number of steps, and total physical activity time were significantly greater during all nonrest days compared with the rest day (day 10; all P < .05). Table 2 shows the variation in exercise intensity levels during the expedition. On average, subjects spent approximately 7.7 h/d performing physical activity (>3.0 METS). Of this, 399 ± 107, 61 ± 77, and 3 ± 10 min/d were spent doing moderate, vigorous, and very vigorous intensity exercise, respectively. Furthermore, this corresponds to approximately 88%, 11%, and 1% of total physical activity time spent in moderate, vigorous, and very vigorous intensities. When comparing the relationship of starting altitude to EE parameters for a given day, the time spent doing moderate intensity exercise and total physical activity demonstrated weak but significant relationships to starting altitude: r = –0.3 (P = .001) and r = –0.33 (P = .000), respectively.
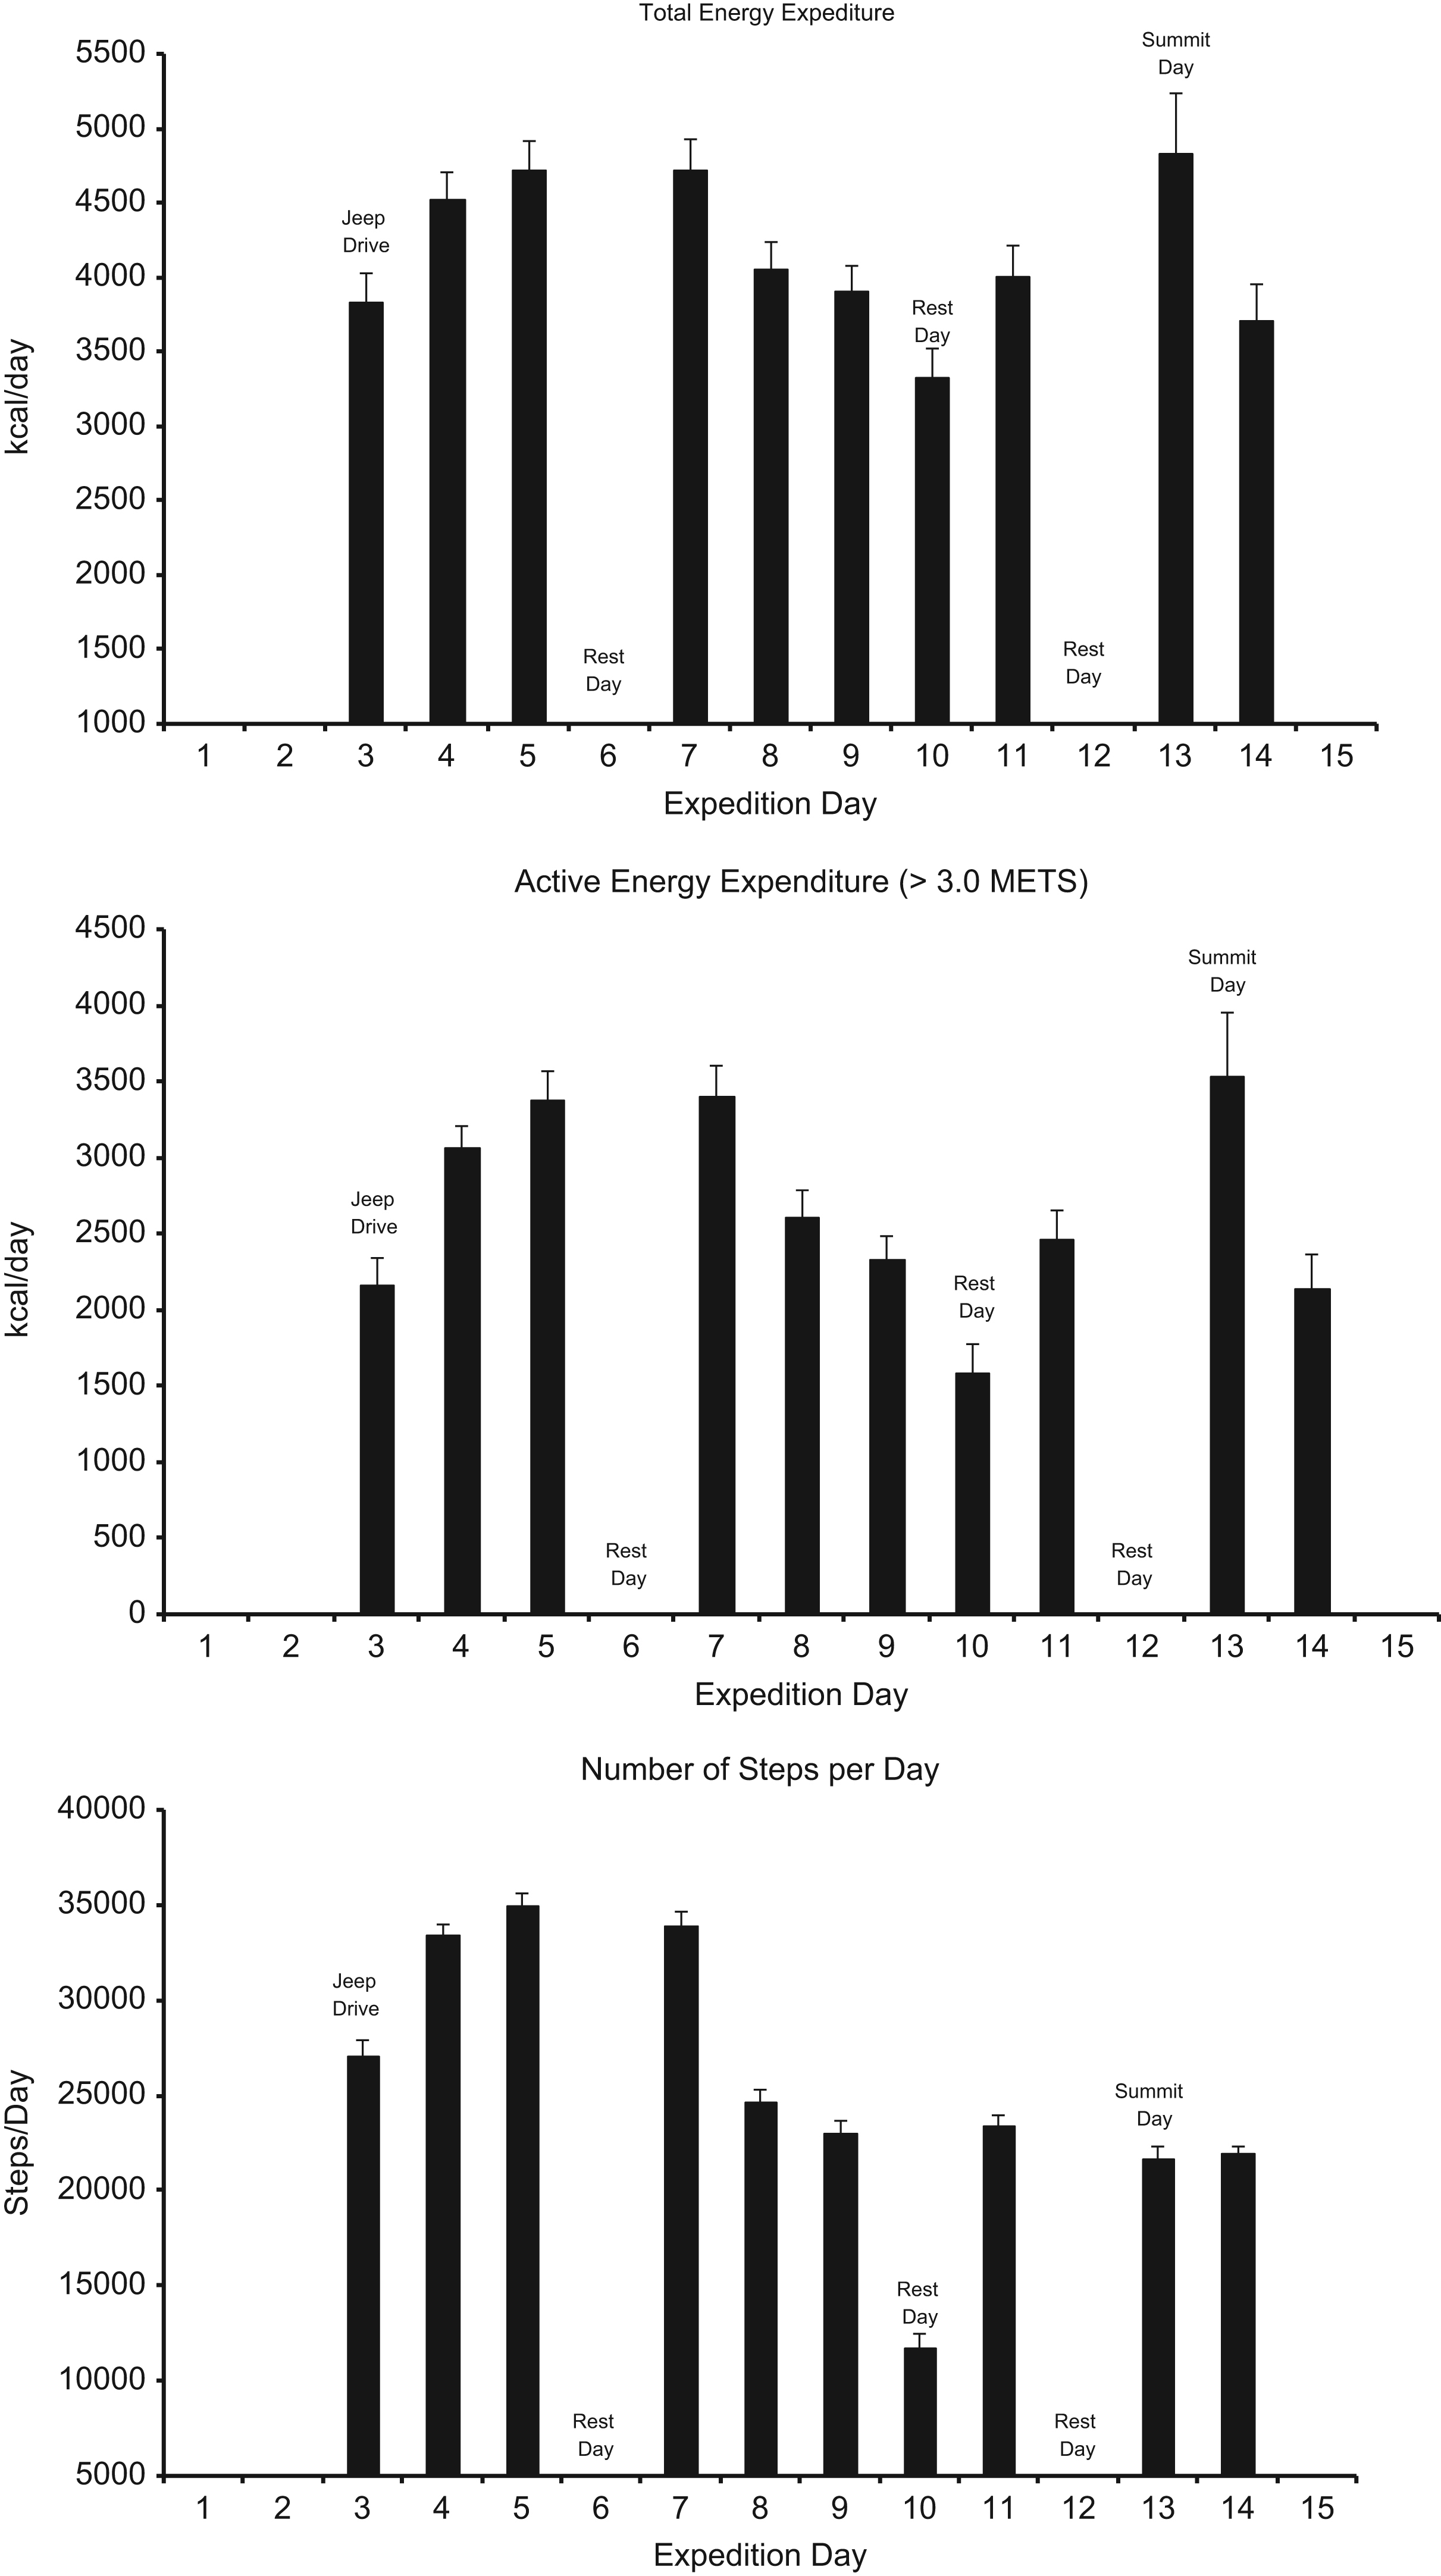
Total energy expenditure, active energy expenditure, and number of steps/d on all expedition days are all significantly different from day 10 (rest day; P < .05).
Percentage of physical activity time for moderate, vigorous, and very vigorous intensities
Data are presented as mean ± SEM. Days 1, 2, and 15 have been removed. Expedition day and the corresponding starting elevation (m) represent the column headings.
Summit Day Cardiopulmonary Response
Seven subjects who achieved the summit had an average 


Lake Louise Scores
Lake Louise Scores and oxygen saturation data are provided in Figure 3. All overnight and morning Sa
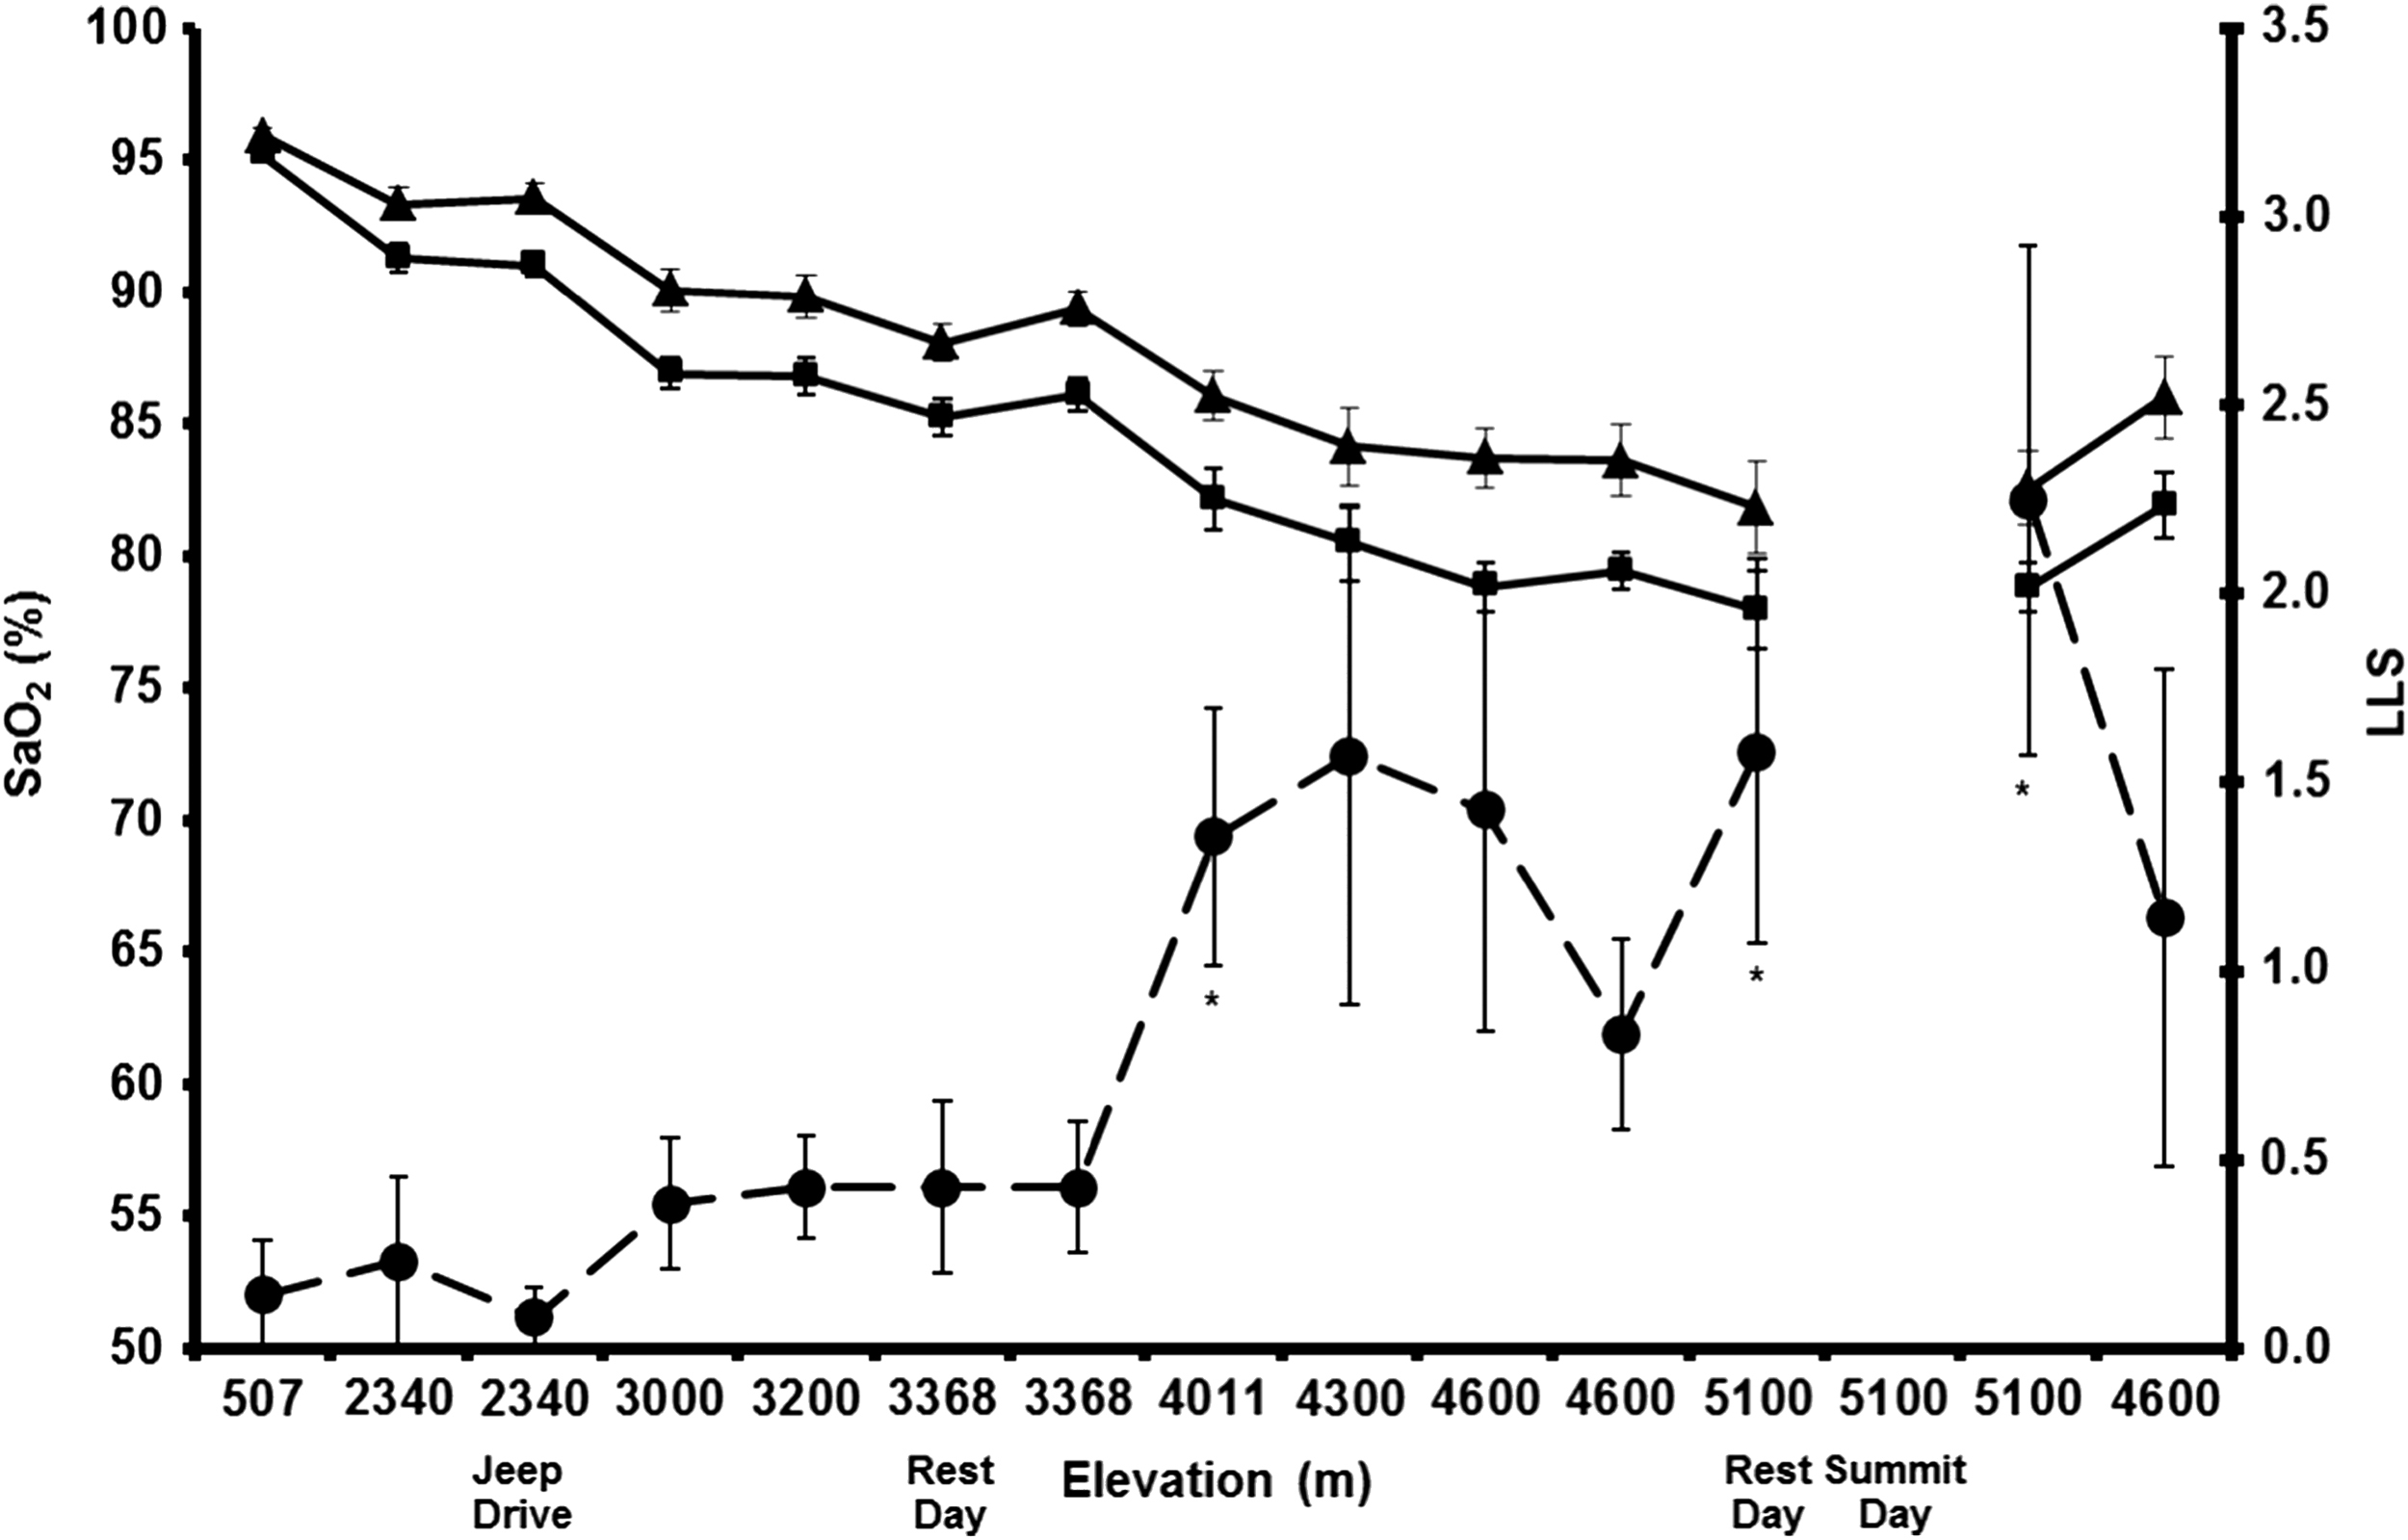
Overnight arterial oxygen saturation (Sa
Discussion
The primary focus of this study was to quantify variations in exercise intensity, specifically time spent in moderate, vigorous, and very vigorous intensity levels, during a high altitude trek to the summit of a 6170-m peak. On average, subjects spent approximately 88% of total physical activity time (range, 77%–97%) performing moderate intensity exercise (3.0–6.0 METS). On the summit day, although both TEE (4838 kcal/d) and AEE (3533 kcal/d) were the highest of any day during the expedition, subjects still spent the vast majority of time performing moderate intensity exercise (approximately 83%). Interestingly, subjects self-selected a trekking or climbing pace that was of moderate intensity whereby the results demonstrated a weak (r = –0.3) but significant (P = .001) correlation between moderate intensity time and altitude. However, this relationship might be slightly skewed by the summit day, which was anecdotally the most physically difficult day as reported by subjects. Furthermore, the summit day was the day with the greatest gain and loss in elevation (approximately 1000 m). Thus this relationship, although weak, may be more a result of the nature of the activity than a physiological response.
On average, subjects only spent approximately 12% of their time in vigorous activity and approximately 1% of time in very vigorous activity. This can partly be explained by instruction given by mountaineering guides on the initial trekking day of the expedition. It seems evident by days 4 and 5 in Table 2 that subjects initially started trekking at higher intensities, as demonstrated by longer times above moderate intensity; however, with increasing elevation, subjects spent more time in the moderate intensity level after day 6.
For recreationally active subjects to perform physical activity for extended durations, it would most likely have to be performed at moderate to low intensities. In this study, subjects performed physical activity for as little as 5 h/d (rest day, 4600 m) and up to 9 h/d (summit day). Comparing oxygen consumption data provided from the SWA to a 


Furthermore, this study adds to existing literature on energy requirements during high altitude or long-duration expeditions. Our data show an average EE of approximately 4200 kcal/d. This is in agreement with some authors demonstrating an EE of 4636 kcal/d2 and 4558 kcal/d, 5 but others have shown a lower EE of 3250 kcal/d3 and a higher EE of 5394 kcal/d. 4 All of these aforementioned studies used the DLW technique for EE assessment. Numerous potential mechanisms could lead to variability between these studies and ours. These mechanisms include but are not limited to distance trekked, elevation gained or lost, subject characteristics, pack weight, nutritional availability, environmental considerations, and study methodology.
Past studies validating the SWA against DLW in free-living adults demonstrated reasonable concordance with interclass correlations ranging from 0.80 to 0.96 and EE estimates approximately 80 to 120 kcal/d lower for the SWA compared with DLW. 9 –11 Moreover, it has been shown using indirect calorimetry that the SWA underestimated EE during treadmill walking, cycle ergometry, and stair stepping, but not arm ergometry. 14 Of note, these studies had EE values in the range of 2300 to 2800 kcal/d. Perhaps more importantly, past research using indirect calorimetry has demonstrated a threshold of the SWA of approximately 10 METS during high intensity exercise. 13 Thus, a potential limitation of the study is the possible underestimation of EE provided by the SWA, especially at higher exercise intensity levels. However, it has also been shown by some that the SWA provided an overestimation of EE during inclined walking (ie, the exercise assessed in the present study). 12 In the present study, we believe that any underestimation of time spent performing very vigorous activity by the SWA had only a minimal effect on AEE and TEE. For example, the summit day had the longest average very vigorous intensity (approximately 15 minutes). Adding an arbitrary 5 METS (extreme example) to the 10-MET threshold of the SWA, as described previously, would add an additional approximately 6 cal/min (1 MET = 1.225 cal/min in a 70-kg individual). This would correspond to a 90-cal/d increase, resulting in an approximately 2% underestimation of TEE. Furthermore, our results are within the range, although variable, of estimates from previous high altitude expeditions demonstrating an EE of 3200 to 5400 kcal/d. 2 –5 Unfortunately, we were unable to obtain a good resting baseline EE (no data for days 1 and 2) at a low altitude location because of expedition logistics. However, we used a rest day (day 10, 4600 m) during the expedition on which subjects wore the SWA. Of interest is that even on a rest day, TEE was more than 3300 kcal/d and the number of steps taken was more than 11,700, demonstrating a modest amount of physical activity. Although there is a large range of EE values from previous studies, the majority of that variability among studies can most likely be explained by discrepancies in expedition logistics such as trekking distance, elevation gained or lost, pack weight, temperature changes, team goals, location, and so forth, thus making comparisons between studies difficult.
The role of physical activity in the development of altitude-related illnesses, such as AMS remains controversial. It has been theorized that the higher the EE or possibly the higher the intensity of exercise, the greater the incidence of AMS. One study found increased AMS scores in subjects performing cycle ergometry exercise versus being sedentary in a hypobaric chamber decompressed to approximately 4800 m. Mechanisms for the increased AMS symptoms were attributed to exercise-induced exaggeration of arterial hypoxemia, a minor fluid shift, or a combination of factors. 18 In our study, there did not appear to be a relationship between our measures of activity levels and the development of AMS in our subjects; however, given the gradual ascent profile, the relative uniformity in EE across subjects, and the small number of subjects (with multiple other variables contributing to AMS), such an analysis was limited. Overall, because the AMS incidence was low along with the exercise intensity being moderate in our subjects, one could speculate that our subjects were not at a high enough intensity to induce an increased severity of AMS symptoms. Interestingly, however, elevated LLS were observed the day after the summit attempt, which was the day with the highest EE. Although not significantly related, the increase in EE in concordance with a rise in LLS does suggest that increased EE may contribute to AMS severity. A study with a larger sample size would hopefully enhance the more subtle exercise intensity–AMS relationships found in this study. Future directions for studies of this nature could be more intervention based to examine AMS symptomatology, whereas this study’s primary focus was to quantify total as well as variations in EE.
In conclusion, this is the first study to our knowledge to examine EE intensity levels during a high altitude expedition using noninvasive wearable technology. Results of the study demonstrate a predominance toward a moderate intensity (absolute and relative) pace when engaging in this type of expedition. In addition, the use of accelerometer-based technology may provide a more cost-effective and logistical means of EE assessment in extreme environments. Further research may be directed toward exercise intensity levels and duration at high altitude and their relationship to altitude illness severity.
Footnotes
Acknowledgments
The authors would like to thank the Young Explorers for their enthusiasm, commitment, and willingness to make the expedition a success. In addition, we would like to thank the Mike Horn Expedition Team for the opportunity to be part of such an extraordinary expedition. Mayo Clinic was funded through a grant from the Leslie and Lou Gonda families.