
Abstract
Objective
Very high blood creatine kinase (CK) concentrations have been observed among recent finishers of the 161-km Western States Endurance Run (WSER), and it has been suggested that there is a link between rhabdomyolysis and hyponatremia. Therefore, the purpose of this study was to compare CK concentrations of finishers in the 2010 WSER with past values, and to determine whether there was an association between blood CK and sodium concentrations.
Methods
Consenting 2010 WSER finishers provided blood samples at the finish for determination of blood CK and sodium concentrations. Finish time, age, and gender were obtained from official race results, and running experience was determined from our database as number of prior 161-km ultramarathon finishes.
Results
From 216 (66%) of the 328 finishers, median and mean CK concentrations were found to be 20 850 IU/L and 32 956 IU/L, respectively (range 1500–264 300 IU/L), and 13 (6%) had values greater than 100 000 IU/L. These values were statistically higher (P < .0001) than those reported from the 1995 WSER. The CK concentration was not significantly associated with finish time, age, gender, or running experience. Blood sodium concentrations were obtained from a subgroup of 159 runners, and the relationship between blood CK and sodium concentrations did not reach statistical significance (P = .06, r = −0.12).
Conclusions
Creatine kinase concentrations of 2010 WSER finishers are higher than values previously reported. More research should focus on explaining this observation and on whether there is a possible link between higher CK concentrations and hyponatremia.
Introduction
The Western States Endurance Run (WSER) is the first 161-km footrace on mountain trails, having evolved in 1974 from a horse race of the same distance. Medical monitoring of runners at the race dates back to the early years as a carryover from monitoring of the horses. Blood creatine kinase (CK) concentration, a marker of muscle damage that is highly correlated with myoglobin, was examined and reported from the WSER in 1980 through 19831,2 and again in 1995. 3 Before 1996, the highest recorded blood CK concentration from the WSER was 188 000 IU/L, and mean CK concentrations each year were approximately 6000 IU/L to 13 000 IU/L. These CK concentrations were higher than those observed at other events during the same period4,5 and higher than the levels previously associated with the development of renal failure from rhabdomyolysis under nonexercising conditions. 6 It was evidently not unusual for the WSER runners with high blood CK concentrations to receive intravenous fluids, 7 but the development of acute renal failure was apparently rare.
We have reported on findings from the 2009 WSER in which CK concentrations greater than 40 000 IU/L were common, 8 and 1 finisher had a peak blood CK concentration of 785 250 IU/L after being hospitalized for acute renal failure. 9 Additionally, a small sample of runners from the 2006 WSER were reported to have mean CK values at the finish of more than 20 000 IU/L. 10 These observations suggest that blood CK concentrations might now be even higher than in earlier years of the event.
The present observational study sought to examine blood CK concentrations of finishers in the 2010 WSER to determine whether the values are higher than in the past. Given our recent finding of a high incidence of exercise-associated hyponatremia in this event8,11 and the potential causal relationship with rhabdomyolysis,9,12 we also examined the association between blood CK and sodium concentrations. Finally, we examined whether CK concentrations were associated with various runner characteristics.
Methods
The study took place at the 2010 WSER. The run is in northern California and is almost entirely on single-track mountain trails reaching a peak altitude of 2667 m, with 5500 m of cumulative climb and 7000 m of cumulative descent. There are 24 aid stations stocked with various fluids, nutritional items, and salt capsules, and body mass is measured at 9 of these stations during the race. Participants have a 30-hour time limit to complete the race. Nearby ambient temperature during the 2010 event ranged from 4°C to 33°C. Approval to perform this research was obtained from our institutional review boards (VA Northern California Health Care System and Oakland University).
An analysis of blood CK concentration was offered to all race finishers at the finish line as part of the medical services provided by the event. Blood sodium concentration also was being determined among runners participating in a study on exercise-associated hyponatremia. Blood samples were obtained within minutes of race finish by professional phlebotomists from venipuncture with the subject seated. Blood sodium concentration was measured onsite within minutes of collection using an I-Stat portable analyzer (Abbott, Princeton, NJ). Blood CK concentrations were determined by a local clinical laboratory (Beckman Coulter LX20, Beckman Coulter, Brea, CA) within a few hours of samples being collected, centrifuged within 30 minutes of collection, and stored in a cooler.
Three days after the event, an e-mail was sent to all race participants requesting that any runner share with us whether any serious medical issue had developed after completion of the race. The number of prior 161-km races completed by each study participant was determined from a listing of finishes we have maintained.13,14
Statistics
Characteristics (age, gender, finish time, and number of prior 161-km race finishes) were compared among all finishers, finishers from whom blood CK and sodium concentrations were obtained, and finishers from whom only blood CK concentration was obtained using analysis of variance and the Tukey post-test (continuous data) and the χ2 test (categorical data). Pearson correlations were determined between select variables. The CK concentrations were compared between men and women with an unpaired t test, and they were compared with categorized values reported from the 1995 WSER 3 with the χ2 test. All analyses were performed with GraphPad Prism (version 5.03 for Windows; GraphPad Software, San Diego, CA). Statistical significance was set at P < .05.
Results
There were 423 starters in the 2010 WSER, and 77.5% (59 women, 269 men) finished the race. Blood for CK concentrations was collected at the finish line from 65.9% of the finishers (40 women, 176 men). Within that group, blood sodium concentrations also were obtained from 159 subjects (27 women, 132 men). Characteristics of the study participants were similar to those of the entire group of finishers except that the subgroup from whom both blood CK and sodium concentrations were obtained was statistically faster (P < .05) than the other groups (Table 1). That is because the I-Stat was intermittently nonfunctional during the terminal hours of the race (hours 28 to 30) owing to the high ambient temperatures.
Characteristics of all finishers and study participants from whom CK concentrations were obtained (CK group) and those from whom both CK and sodium concentrations were obtained (CK and sodium subgroup)
Data are reported as mean ± SD except where reported as a percentage.
CK, creatine kinase.
P < .05 compared with other groups.
The frequency distribution of CK concentrations is shown in Figure 1. Values ranged from 1500 to 264 300 IU/L, with median and mean values being 20 850 and 32 956 IU/L, respectively. There were 111 runners (51%) with values higher than 20 000 IU/L, 35 runners (16%) with values greater than 50 000 IU/L, and 13 runners (6%) with values higher than 100 000 IU/L.
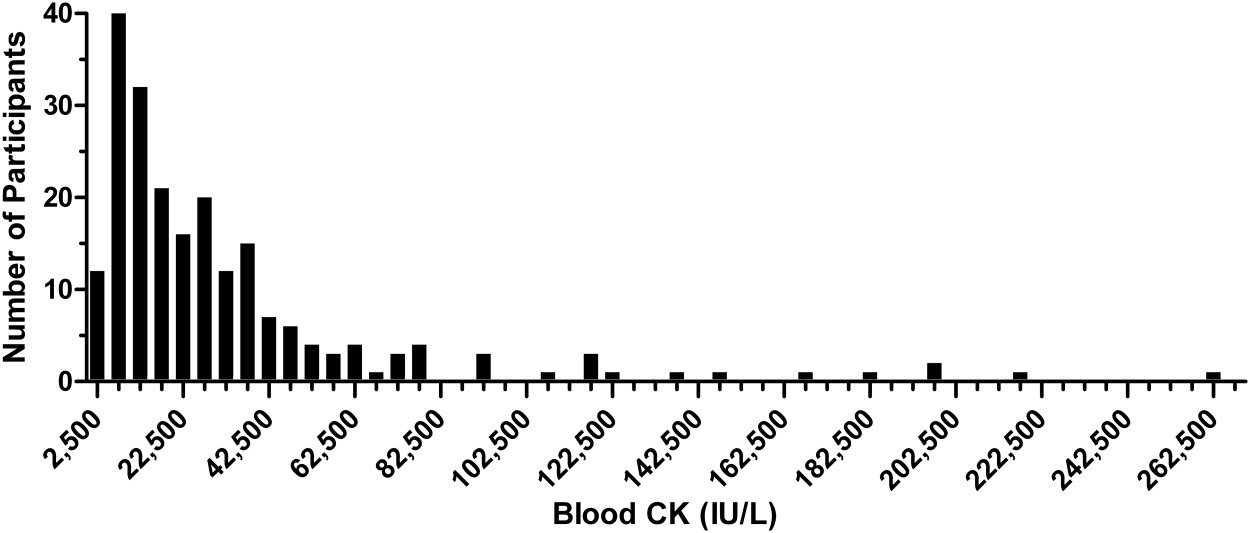
Distribution of creatine kinase (CK) concentrations. The range of each bar is 5000 IU/L centered at a tick mark.
Comparison of CK concentrations with the categorized values reported from the 1995 WSER is shown in Figure 2. There was a statistical difference (P < .0001) between years in that the present year showed a greater proportion of runners with values in the higher CK concentration categories.
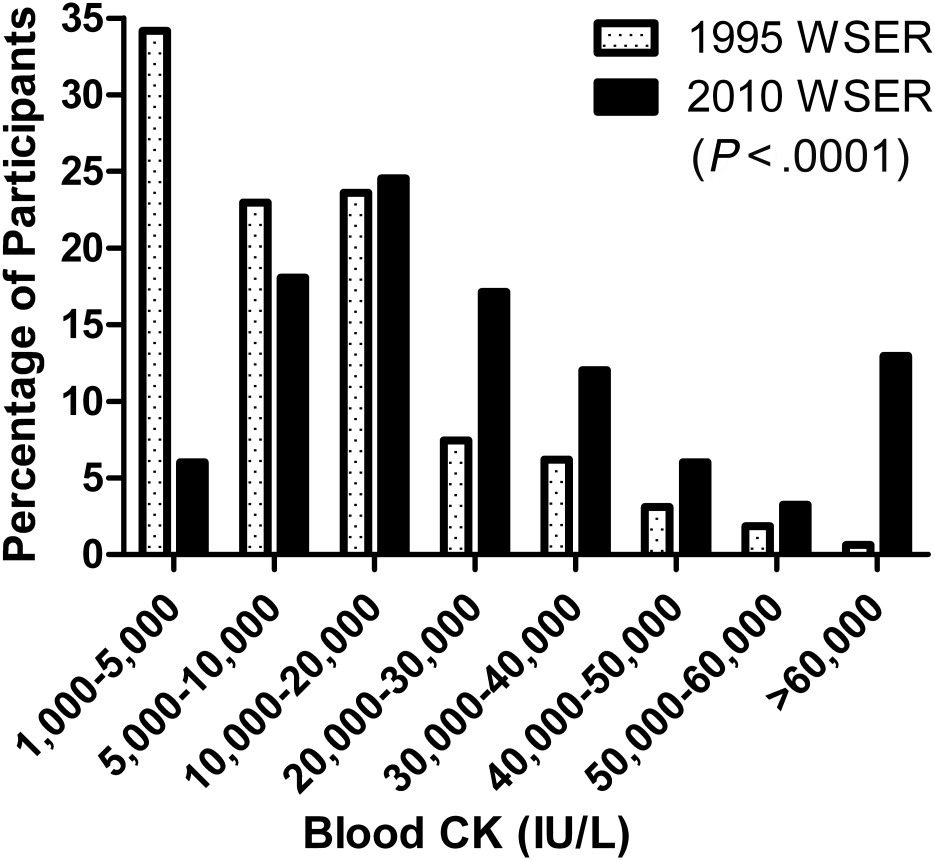
Comparison of creatine kinase (CK) concentrations between 1995 (dotted bars) and 2010 (solid bars) Western States Endurance Run (WSER) events.
Blood CK concentration was not statistically related (P = .06, r = −0.12) to sodium concentration (Figure 3), and was not significantly associated with finish time (P = .6) or age (P = .6). Additionally, CK concentrations did not differ (P = .4) between men and women. Blood CK concentration also was not significantly related to the number of prior 161-km races completed (P = .4) (Figure 4). Of note, only 1 of 26 athletes who had previously finished more than 10 161-km races had a CK concentration greater than 47 700 IU/L.
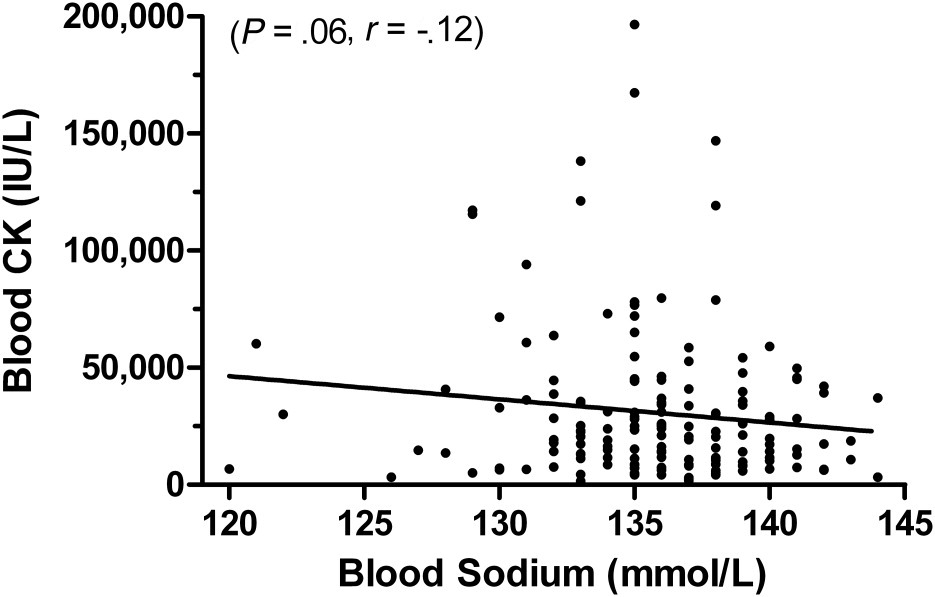
Relationship of blood creatine kinase (CK) and sodium concentrations.
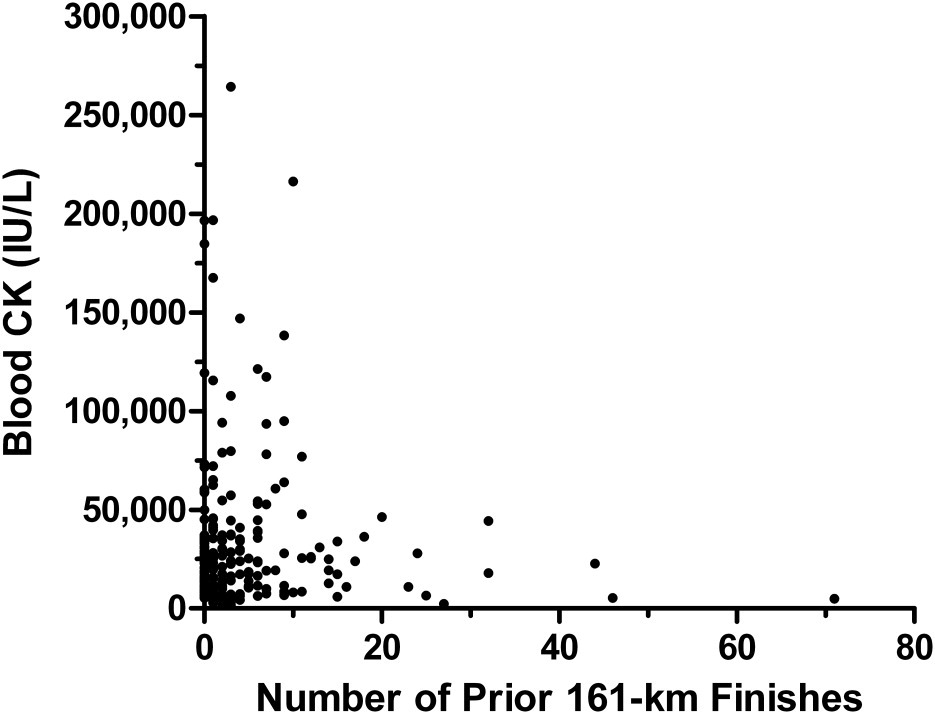
Relationship of creatine kinase (CK) concentration with number of 161-km ultramarathon finishes before the present event.
Three runners received medical management at a hospital after the event. In each case, a diagnosis of rhabdomyolysis was noted in the medical records, but none met criteria for acute renal failure (increase in creatinine of ≥0.5 mg/dL above a presumed normal baseline).
Discussion
The observed blood CK concentrations from the 2010 WSER are higher than previously reported for this same event. In the early 1980s and in 1995, mean CK values ranged from 6000 to 13 000 IU/L,1,3 and the highest recorded value was 188 000 IU/L. 3 In contrast, the mean and highest values in 2010 were 32 956 and 264 300 IU/L, respectively. Furthermore, CK concentrations were statistically higher in 2010 compared with 1995.
It should be noted that peak blood CK concentrations after an ultramarathon have been shown to be at their highest immediately after the event, 15 or at 1 to 2 days after the event.5,15 It is, therefore, conceivable that peak values might have been even higher had our measurements been delayed. Yet, the data from 2 runners who were hospitalized after the event do not support this premise, because their blood CK concentrations decreased from 196 500 IU/L to 67 000 IU/L and from 146 900 IU/L to 18 000 IU/L within 21 hours and 51 hours after the event, respectively.
The results of this work were based on blood CK concentrations obtained from two-thirds of the race finishers. This was a large proportion of the finishers and also appeared to be a representative sample of finishers, as demonstrated in Table 1. Temperature conditions were average for this event, 16 and although the finish rate was the second highest since 1986, there have been several years with comparable finish rates.17,18 As such, our data appear to be representative of a typical modern year at the WSER. The WSER is widely considered as one of the most demanding organized running events in the United States, and because the course involves considerable descent, it should not be surprising that this event produces the highest CK values observed. Eccentric muscular contractions, which are accentuated with downhill running, are known to induce the greatest increases in muscle damage.
An explanation for the higher blood CK concentrations than were observed 15 to 30 years ago is not entirely clear, but we do not believe this is a reflection of greater sensitivity of the assay. There also was no alteration in the method of blood collection, timing of the blood draws, or the storage and transport of the blood samples. Although there has been an increasing proportion of women participating in the event and an increase in the average age of participants during this period, 17 these factors also would not seem to provide an explanation. We have evidence that the finish times have not improved except among the fastest women, 17 so that does not seem to be the explanation. It is also doubtful that training intensity has decreased as we have shown the mean (±SD) highest running distance in 1 week during the 3 months preceding the 2009 WSER was 136.8 ± 42.3 km, which was statistically higher than for another large 161-km ultramarathon in North America. 19
In an attempt to identify characteristics of runners with high blood CK levels, we examined relationships among CK concentration and several variables. The present work found no statistical relationship of CK concentration with finish time, age, gender, or running experience defined by number of 161-km ultramarathons previously completed. The relationship between blood CK and sodium concentrations also did not reach statistical significance (Figure 3). Nonetheless, the emerging case reports documenting a link between blood sodium concentration and rhabdomyolysis with subsequent renal failure9,12 suggest that more research in this area is warranted. Furthermore, it should be noted that our present analysis only examined blood sodium concentration at the end of the race. It is likely that the post-race values do not fully reflect the incidence of hyponatremia that may be occurring throughout the race.
Participation in 161-km ultramarathons has grown exponentially during the last 3 decades. 14 Given this, it becomes increasingly important to better understand the normal physiological responses to such a challenge so that we can recognize when medical attention is warranted. The findings of this study confirm that present day blood CK concentrations at the WSER are higher than in the past, and indicate that values in excess of 20 000 IU/L are common but rarely result in adverse consequences among the healthy participants in this event. More research should focus on explaining the observation of increasing CK concentrations in this event, and whether there is a possible link between the higher CK concentrations and high incidence of hyponatremia.
Footnotes
Acknowledgments
We wish to thank Sierra Nevada Memorial Hospital for support from their clinical laboratory and Lodi Memorial Hospital for providing phlebotomists.
This work was supported with the resources and the use of facilities at the VA Northern California Health Care System. The work was also supported by the Western States Endurance Run Foundation.
Presented at the American College of Sports Medicine annual meeting, June 3, 2011, Denver, CO.