
Abstract
The aim of the study was to determine the time required for plasma fructosamine concentration to increase after the onset of hyperglycaemia and decrease after resolution of hyperglycaemia. Healthy cats (n=14) were infused to maintain either moderate hyperglycaemia (n=5) (actual mean glucose 17 mmol/l) or marked hyperglycaemia (n=9) (actual 29 mmol/l) for 42 days. Fructosamine exceeded the upper limit of the reference range (331 μmol/l) after 3–5 days of marked hyperglycaemia, took 20 days to plateau and, after cessation of infusion, took 5 days to return to baseline. Fructosamine concentration for moderate hyperglycaemia took longer to exceed the reference range (7 days, range 4–14 days), and fewer days to plateau (8 days) and return to baseline (1 day). In cats with moderate hyperglycaemia, fructosamine concentration mostly fluctuated under the upper limit of the reference range. The range of fructosamine concentrations associated with a given glucose concentration was wide. The critical difference for fructosamine was 33 μmol/l.
Fructosamine is the term used to describe glycated plasma proteins, and plasma concentration of fructosamine is related to blood glucose concentration (Armbruster 1987, Kennedy 1992). Plasma fructosamine concentration has been used to monitor glycaemic control in human diabetic patients since 1987 (Armbruster 1987, Kennedy 1992). It has also been recommended for the diagnosis and monitoring of canine and feline diabetes mellitus (Akol et al 1992, Kaneko et al 1992, Reusch et al 1993, Jensen 1994, Miller 1995, Lutz et al 1995, Crenshaw et al 1996). In humans, plasma fructosamine concentration reflects the mean blood glucose over the preceding 2 to 3 weeks. This time span is related to the half-life of plasma proteins (Armbruster 1987, Kennedy 1992). The half-life of plasma proteins in the cat is unknown. No in vivo studies have been conducted to determine over what time plasma fructosamine concentration reflects blood glucose concentration in cats, and how quickly plasma fructosamine concentration changes in response to changes in blood glucose. The aim of this study was to investigate the effects of chronic hyperglycaemia in vivo on plasma fructosamine concentration, in particular, the time required for concentrations to exceed and return to the reference range after induction and cessation of chronic hyperglycaemia.
Materials and methods
This study was approved by the Animal Experimentation Ethics Committee of The University of Queensland (AEEC Approval Numbers: CAMS/362/93/SPG/NHMRC, CAMS/333/93/D/PHD, CAMS/398/95/PHD/ACHF, and CAMS/576/96/PHD/ACHF). Forty-eight clinically healthy, adult mixed-breed cats from another study were used to calculate the reference range for plasma fructosamine concentration (154–331 μmol/l) (Link and Rand 1998). Fourteen of these cats were used in the infusion studies. All cats had normal glucose tolerance test results (T½=54±5 min, range 31–95 min, reference value T½≤95 min), using a simplified glucose tolerance test prior to entry into the study (Link et al 1997, Link and Rand 1998). All cats tested enzyme-linked immunosorbent assay (ELISA) negative for feline leukaemia virus (FeLV) and feline immunodeficiency virus (FIV) (Veterinary Pathology Services, Coorparoo, Qld, Australia). Cats were allocated to two groups, and were infused with glucose to maintain their blood glucose at either a high (30 mmol/l; 540 mg/dl; n=9) or moderate (20 mmol/l; 360 mg/dl; n=5) glucose concentration for 42 days. These concentrations were chosen because they were similar to those seen in naturally occurring diabetics at the time of diagnosis and 20 mmol/l (360 mg/dl) is the approximate upper limit of stress-induced hyperglycaemia observed in clinical situations (Feldman and Nelson 1996). Cats were housed in regular research cages. Cats were fed once daily in the morning and all food was removed from the cats' cages after collection of the 22:00 hour samples, so the 8:00 hour samples were fasted samples. Cats were fed standard amounts for body weight of a commercial feline maintenance diet. Cats were examined three times daily while samples were taken and were checked frequently during the day and night. Cats were homed at the end of the study.
Methodology
One week before the glucose infusion, all cats had a bilumen paediatric catheter (18 gauge×15 cm: Careflow Paediatric Bilumen Catheter Kit; Becton Dickinson, Australia) inserted under anaesthesia into one jugular vein via a surgical cutdown using the Seldinger technique (Seldinger 1953). Prior to jugular catheter placement, cats were premedicated with medetomidine 25–50 μg/kg intramuscularly (Domitor (1 mg/ml), Ciba-Geigy Australia,) and a cephalic venous catheter (20 or 22 gauge×2.5 cm; Surflo catheter, Terumo, Tokyo, Japan) was placed. Propofol anaesthesia (Diprivan (10 mg/ml); Zeneca, UK) was administered to effect (4–6 mg/kg) through the cephalic venous catheter. At the end of the procedure, the sedative effects of medetomidine were reversed with the antagonist atipamezol 63–125 μg/kg (Antisedan (5 mg/ml); Ciba-Geigy, Australia).
A 10% glucose solution (CSL, Parkville, VIC, Australia) was infused constantly into one lumen of the bilumen catheter using a volumetric infusion pump (IMED 960, San Diego, CA, USA). The other lumen was used for blood collection. A swivel device (SAIV system, International Win; Kennett Square, PA 19348 USA) attached to the ceiling of the cage connected the coiled infusion tubing to the catheter in the jugular vein. Catheter patency was maintained by flushing each lumen of the catheter with 2 ml of heparinised saline (5,000 U/ml) (20 U/ml porcine heparin; CSL, Parkville, VIC, Australia); in 0.9% sodium chloride (0.9% Sodium Chloride Intravenous Infusion BP, Baxter Healthcare, Old Toongabbie, NSW, Australia) after each blood collection.
Blood samples of 1.0 ml each were collected daily at 8:00 hours. One drop of blood was used for glucose measurement, and the remaining blood placed into 1 ml tripotassium ethylene diamine tetra-acetate (EDTA) tubes for measurement of packed cell volume and plasma fructosamine, potassium, phosphate, protein, and glucose if a high meter reading was obtained. One drop of blood was also collected at 15:00 and 22:00 for measurement of blood glucose.
All cats were supplemented with oral potassium chloride 600 mg every 48 h (Slow-K; Ciba-Geigy Australia), oral ferrous sulphate 40–80 mg every 24 h post-prandially (FeSpan, Smith Kline French. Australia), and subcutaneous sodium phosphate 0.14–1.26 ml/kg every 72 h (Phosfort 5%; Jurox Silverwater, Australia). The cats were supplemented with iron to replace the anticipated losses due to repeated blood sampling. Potassium and phosphorus were also supplemented as a precautionary measure, because increased renal loses of these elements have been reported with intravenous glucose infusion, diabetic ketoacidosis, and in diabetics (Bell and Osborne 1989, Hardy and Adams 1989, Diehl and Wheeler 1989). Plasma concentrations of potassium, and phosphorus were measured every 3 days and mean values remained in the normal range during the study (data not shown). Any cats developing ketonuria were treated with low-dose insulin therapy (porcine lente 0.2 IU/kg bid subcutaneously: Caninsulin, Intervet, The Netherlands).
Measurements
A reflectance glucose meter (Accutrend glucose meter, Boehringer Mannheim Australia) validated for use in cats was used to measure blood glucose concentration daily at 8:00, 15:00, and 22:00 hours (Link et al 1997, Link and Rand 1998). If the meter read ‘high’, an additional blood sample was collected and was measured with an automated chemistry analyser (Cobas-Mira, Roche Diagnostic Systems, Australia). A formula was then used to calculate the equivalent meter concentration (Link et al 1997).
The initial glucose infusion rate was determined as follows: R=D∗×λT where R=infusion rate, D∗=loading dose, and λT=Kglucose were calculated from the glucose tolerance test result for each cat (Riviere 1988).
Glucose infusion rates were adjusted up to three times daily to maintain the target glucose concentrations of 30 mmol/l (540 mg/dl) or 20 mmol/l (360 mg/dl), respectively.
Packed cell volume and total plasma proteins were measured daily. Packed cell volume was measured using the microhaematocrit technique (Tvedten 1989). Total plasma proteins (EDTA plasma), potassium and inorganic phosphorus (heparin plasma) were measured with an automated chemistry analyser (Cobas-Mira, Roche Diagnostic Systems, Australia).
Urine ketones were monitored daily with a urine microchemistry test strip (Keto-Diabur 2000, Boehringer Mannheim Australia) which measures the ketone bodies acetylacetic acid and acetone using the Legal's test principle. The manufacturer states the sensitivity limit for acetylacetic acid is 0.5 mmol/l and 7–12 mmol/l for acetone.
Blood collected at 8:00 hours in EDTA tubes (Sequestrene-Haematology Paediatric, Johns BioLab Scientific, Australia) was used for determination of plasma fructosamine concentration daily from day −2 to day 62 in the 42-day infusion study. Plasma fructosamine concentration was measured using a commercial assay (Unimate 3 FRUC kit, Roche Diagnostic Systems, Australia) on an automated chemistry analyser (Cobas-Mira, Roche Diagnostic Systems). Intra-assay and inter-assay coefficients of variation (CV) were determined using controls provided by the manufacturer (Fructosamine Control N (normal) and Fructosamine Control P (pathological)), and were 1.5% (intra-assay CV) and 3.7% (inter-assay CV). Intra-assay coefficients of variation were calculated from 32 within-run replicates and inter-assay coefficients of variation were derived from 39 between-run duplicates. A minimum of 20 intra-assays and 20 inter-assays are recommended for laboratory quality control (White and Fraser 1984, Broughton 1988).
The EDTA plasma for the assay of plasma fructosamine concentration and total plasma proteins were stored at −70°C until analysed in batch runs. To decrease measurement error in thawed plasma samples, the samples were thoroughly mixed, centrifuged for 10 min, and the supernatant transferred to a new sample cup before assaying. All plasma samples were assayed in duplicate.
Relative plasma fructosamine concentration (correction of fructosamine relative to total plasma protein) was calculated using the following formula from the Unimate 3 FRUC kit insert: relative fructosamine =(fructosamine × 66)/total protein where 66 approximates the mid-point of the reference range for total plasma protein concentration in cats. The laboratory reference range for total plasma protein is 54–78 g/l at the pathology laboratory of the, School of Veterinary Science, The University of Queensland.
Statistical analysis
Data were analysed with the SAS statistical package (SAS Institute Inc, Cary, NC, USA). Proc Univariate Normal was used to determine normal distribution. The statistical significance level was set at P≤0.05. All data are expressed as mean±1 standard error of the mean (̄±sem).
A repeated measures multivariate analysis of variance (MANOVA) was used to compare plasma fructosamine concentrations between the two infusion groups. A Pearson product moment correlation test (r p) was used to determine the association between plasma fructosamine concentrations and total plasma proteins for each infusion group. Plasma fructosamine concentration on day 0 was compared to the other days within each infusion group using a Student's t-test.
Duplicate plasma fructosamine concentration values from samples collected on day −2, −1, and 0 of the study were used to calculate the critical difference by analysis of variance (ANOVA). The interpretation of a critical difference is if two consecutive measurements on different days are less than the critical difference, the change in values between the different days is not significant and can be attributed to random variation. A Pearson correlation test was used to determine if there was any association between plasma fructosamine concentration and days used in the calculation of the critical difference.
The critical difference (dk) for plasma fructosamine concentration was calculated as follows:

Fasted samples from 48 cats (including the day 0 sample for the 14 infused cats), were used to calculate a population reference range for plasma fructosamine concentration. Grubbs' T-statistic was used to detect outliers (Grubbs 1969). The population reference range (95% confidence interval) for plasma fructosamine concentration based on this sample of cats was defined as ̄ ± 2.3899sd (Weissberg and Beatty 1960, Lumsden and Mullen 1978).
Results
The mean blood glucose concentration achieved over the 42-day infusion period in the high glucose infusion group was 29.0±0.3 mmol/l (522.5±5.4 mg/dl) and 17.2±0.4 mmol/l (309.9±7.2 mg/dl) for the moderate glucose infusion group.
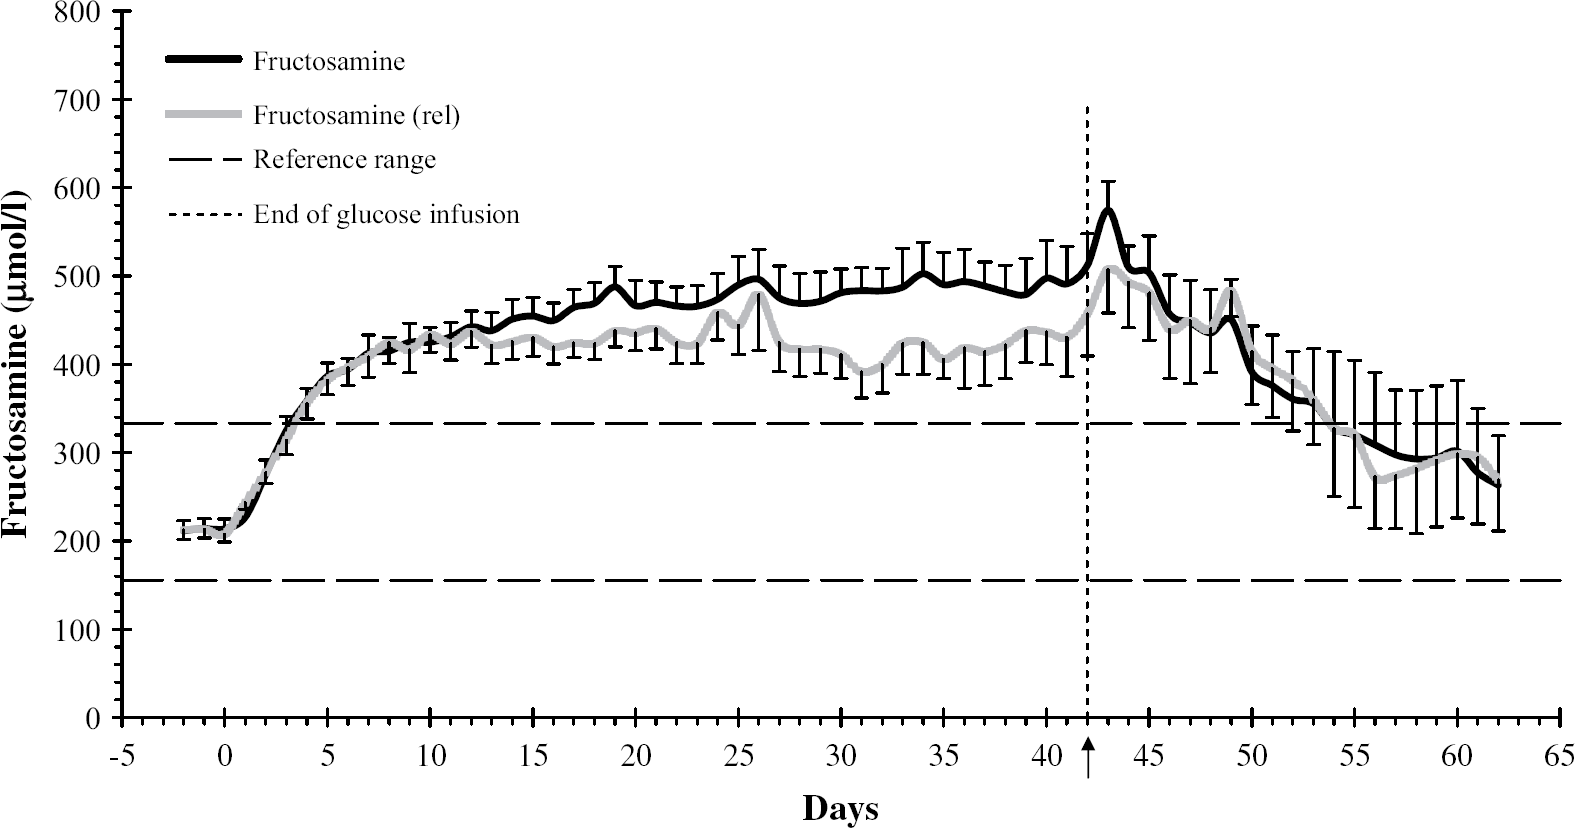
The critical difference for plasma fructosamine concentration was 32.5 μmol/l. There was no significant difference in plasma fructosamine concentrations between the high glucose infusion group and the moderate glucose infusion group from day −2 to day 4 (Fig. 1). By day 2 of the infusion, plasma fructosamine concentrations in both groups were significantly different from day 0 (P=0.004 high glucose group, P=0.016 moderate glucose group). Mean plasma fructosamine concentrations increased above the upper limit of the reference range (331 μmol/l) on day 4 (range 3–5 days) in the high glucose infusion group, reaching a plateau (466.4±28.9 μmol/l, range 400–633 μmol/l) on day 20 and continued to remain above the reference range until day 53 (355.1±62.7 umol/l; range 201.5–482.5 umol/l). The fructosamine concentrations in the moderate infusion group took longer to exceed the reference range (7 days, range 4–14 days), and on average fluctuated just under the upper limit of the reference range for most of the infusion period, having plateaued (326.9±15.1 μmol/l, range 291.5–378.0 μmol/l) at day 8. From day 5 until the end of the glucose infusion at day 42, there was a significant difference in plasma fructosamine concentrations between the two groups (P=0.0001–0.033). In the post-infusion period, the high glucose infusion group required 4 days before the decline in plasma fructosamine concentration was greater than the critical difference (32.5 μmol/l) versus 3 days for the moderate glucose infusion group. Plasma fructosamine concentration was not significantly different from baseline in the high glucose infusion group after day 47 (5 days after cessation of the infusion), and in the moderate glucose infusion group after day 43 (1 day after cessation of the infusion). However, some cats in the high glucose infusion group required longer than 6 days of normoglycaemia or mild hyperglycaemia before plasma fructosamine concentration returned to baseline levels. A repeated measures MANOVA revealed no significant difference in the shape of the two plasma fructosamine concentration curves. This shows the biological change in plasma fructosamine concentration varied at a similar rate in both groups, but was of different magnitudes.

Mean (sem) fructosamine concentrations in the high (n=9) and moderate (n=5) glucose infusion groups from day −2 to day 62 in cats infused for 42 days to maintain target hyperglycaemia of 29 mmol/l (540 mg/dl) and 17 mmol/l (360 mg/dl). The arrow and vertical dotted line at day 42 indicate the end of the glucose infusion.
Mean plasma protein concentrations in the high glucose infusion group exceeded the reference range for plasma protein for some days during and after the infusion, which might have represented mild subclinical dehydration secondary to obligate polyuria. This was not evident in the moderate infusion group. Most of these cats developed ketosis and ketonuria 19 to 34 days after the start of the infusion and were then treated with low-dose insulin therapy (0.2 IU/kg bid). A moderate correlation was found between concentrations of plasma fructosamine and plasma protein for all measurements in both groups (rp=0.37, P=0.0001) and in the moderate glucose infusion group (r p=−0.30, P=0.0001) were lower than the overall correlation. Separate correlation analyses for plasma fructosamine concentration and between hypoproteinaemic (r p=−0.45, P=0.0001), normoproteinaemic (r p=0.41, P=0.0001), and hyperproteinaemic (r p=0.15, P=0.0001) results in both groups combined or by group did not greatly increase the correlation coefficient. Approximately 20.0% and 2.1% of the changes in plasma fructosamine concentration were due to changes in plasma protein concentration in hypoproteinaemic and hyperproteinaemic cats, respectively. p=0.49, P=0.0001) (Fig. 2). The correlations between plasma fructosamine concentration and plasma protein in the high glucose infusion group (r p=0.37, P=0.0001) and in the moderate glucose infusion group (r p=−0.30, P=0.0001) were lower than the overall correlation. Separate correlation analyses for plasma fructosamine concentration and between hypoproteinaemic (r p=−0.45, P=0.0001), normoproteinaemic (r p=0.41, P=0.0001), and hyperproteinaemic (r p=0.15, P=0.0001) results in both groups combined or by group did not greatly increase the correlation coefficient. Approximately 20.0% and 2.1% of the changes in plasma fructosamine concentration were due to changes in plasma protein concentration in hypoproteinaemic and hyperproteinaemic cats, respectively.
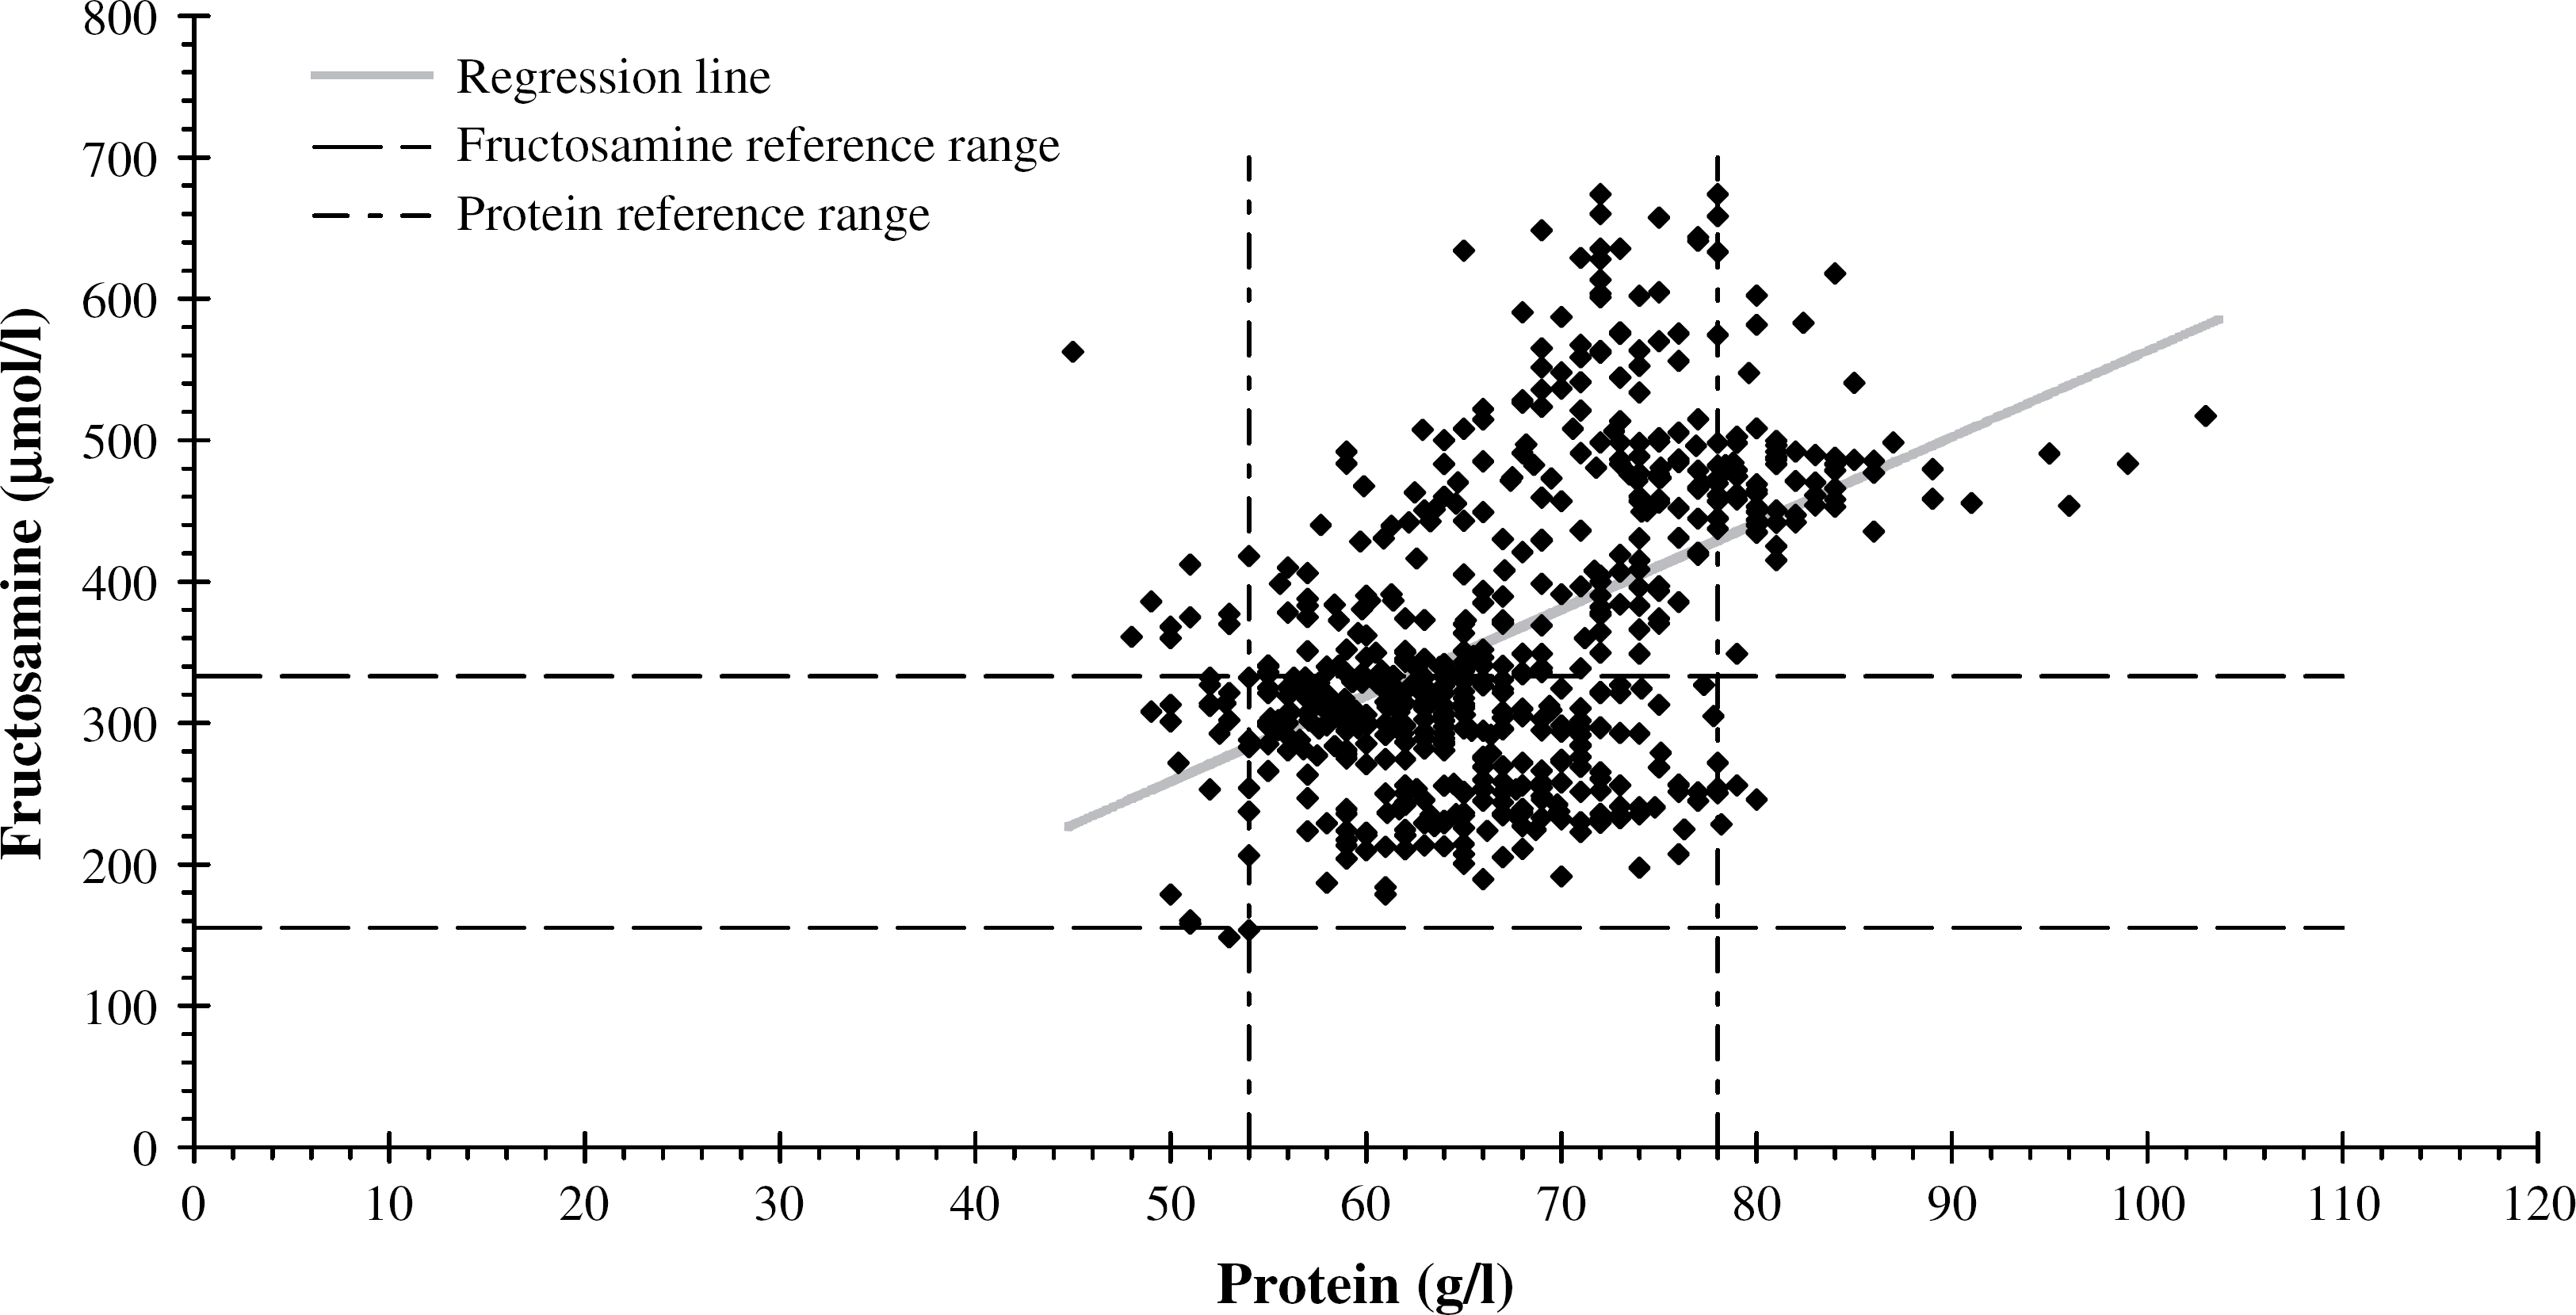
A scatter plot of fructosamine versus protein concentrations from the high and the moderate glucose infusion groups for the duration of the study (rp=0.49, P=0.0001).
In the high glucose infusion group, there was little or no difference between plasma fructosamine concentration and relative plasma fructosamine concentration (fructosamine correction based on plasma protein) from day −2 to day 26 and after day 42 to the end of the study on day 62 (Fig. 3). There was an increased difference (P=0.0003–0.0380) from day 27 to 41 due to increasing mean plasma protein concentration in this group. In the moderate glucose infusion group there was little difference between plasma fructosamine concentration and relative plasma fructosamine concentration during the 42-day infusion period (Fig. 4). Most of the mean plasma fructosamine concentration results in this group did not exceed the reference range during the infusion period but most did, however, when these values were protein corrected. Cats showed no evidence of clinical dehydration throughout the experimental study.
Mean (sem) fructosamine and relative fructosamine (corrected values based on protein) concentrations in the high glucose infusion group. Arrow and vertical dotted line indicate end of glucose infusion.

Mean (sem) fructosamine and relative fructosamine (corrected values based on protein) concentrations in the moderate glucose infusion group. Arrow and vertical dotted line indicate end of glucose infusion.
Six of the nine cats in the high glucose infusion group became ketonuric and were treated with low-dose insulin therapy (beginning between day 20 and day 34) to prevent a ketoacidotic crisis, but not to decrease glucose concentrations. Bicarbonate was only measured in the first cat and in the remaining cats, insulin therapy was initiated as soon as ketonuria was detected. In the first ketonuric cat, plasma fructosamine concentration increased by 53 μmol/l over a 24-hour period around the time marked ketoacidosis (bicarbonate 6.8 mmol/l) was developing. However, there was no significant change in this cat's blood glucose concentration. In the same cat, plasma fructosamine concentration decreased by 120 μmol/l between the second and third day of insulin therapy. About 10% and 69%, respectively, of the change in plasma fructosamine concentration could be accounted for by correcting the plasma fructosamine concentration with the plasma protein concentration. Both plasma fructosamine concentration and relative plasma fructosamine concentration values exceeded the reference range (Fig. 4). Four of the six ketonuric cats had a decrease in plasma fructosamine concentration greater than the critical difference (32.5 μmol/l) during the 5 days after instituting low-dose insulin therapy (porcine lente 0.2 U/kg bid SC), although there was no significant decrease in blood glucose concentrations.
Discussion
There are several important findings from this study. Firstly, the mean plasma fructosamine concentration exceeded the reference range after 3–5 days of marked hyperglycaemia (29 mmol/l; 522 mg/dl), and after 7 days of moderate hyperglycaemia (17 mmol/l; 310 mg/dl). The higher the blood glucose concentration, the longer it took to reach a steady state in plasma fructosamine concentration (20 days for marked hyperglycaemia versus 8 days for moderate hyperglycaemia). After cessation of the infusion, it took longer for plasma fructosamine concentration to return to baseline after marked hyperglycaemia (6 days) than following moderate hyperglycaemia (2 days). Based on the infusion and post-infusion results, a single plasma fructosamine concentration measurement most likely reflects the mean blood glucose concentration for approximately the past week. The rate of increase of plasma fructosamine concentration in cats was more rapid than in humans (Armbruster 1987, Kennedy 1992, Akol et al 1992), suggesting the half-life of plasma proteins is shorter in cats, and is approximately 1 week. The timing and magnitude of the increase in plasma fructosamine concentration were similar to in vitro findings for cats (Reusch and Hoyer 1994).
A second important finding was that plasma fructosamine concentration only intermittently exceeded the reference range during the 42 days of infusion in the cats with moderate hyperglycaemia (17 mmol/l; 310 mg/dl). This limits the usefulness of plasma fructosamine concentration in cats as a diagnostic test for moderate hyperglycaemia (<20 mmol/l; <360 mg/dl).
The sensitivity of plasma fructosamine concentration as a diagnostic test for diabetes mellitus in cats was reported as 89% and 93%, and the specificity as 55% and 86% (Akol et al 1992, Crenshaw et al 1996). Our findings are consistent with these reports, and indicate that plasma fructosamine concentration is not a reliable test for diabetes mellitus in cats when blood glucose concentration is only moderately increased (≤20 mmol/l; ≤360 mg/dl). In dogs, although the sensitivity (88%) is similar to cats, the specificity (99%) of plasma fructosamine concentration as a diagnostic test for diabetes is much higher (Jensen 1994). It is possible that stress hyperglycaemia associated with illness in cats may contribute to this poorer specificity. Illness-associated stress hyperglycaemia is reported to exceed 20 mmol/l (360 mg/dl) (Opitz 1990, Feldman and Nelson 1996), and based on the results of our study, may persist long enough to increase plasma fructosamine concentration. Dogs do not typically exhibit marked illness-associated stress hyperglycaemia. The potential danger lies in relying on a single plasma fructosamine concentration result to diagnose feline diabetes mellitus in hyperglycaemic cats. If the plasma fructosamine concentration as well as a single blood glucose concentration is markedly elevated (around 29 mmol/l; 522 mg/dl) the patient is most likely diabetic. Transient illness-associated hyperglycaemia needs to be considered in patients with moderate hyperglycaemia (around 17 mmol/l; 310 mg/dl) and minimal increase in plasma fructosamine concentration, especially if they are dehydrated and hyperproteinaemic, because of the effect of these conditions on fructosamine concentrations. However, a normal plasma fructosamine concentration does not exclude the diagnosis of diabetes mellitus. Therefore, clinicians should rely on clinical signs and serial blood glucose measurements rather than on a single measurement of plasma fructosamine and blood glucose concentration to diagnose diabetes mellitus, especially in non-ketotic cats with blood glucose concentrations around 20 mmol/l (360 mg/dl).
The plasma fructosamine concentration used as the upper limit of the reference range will affect its sensitivity and specificity for diagnosing diabetes mellitus in cats. We used the upper limit of the 95% confidence interval derived from 48 healthy cats. This reference range for plasma fructosamine concentration (154–331 μmol/l) is similar to reference ranges reported in the literature (ie, 150–406 mg/dl) (Akol et al 1992, Kaneko et al 1992, Reusch et al 1993, Lutz et al 1995, Crenshaw et al 1996). The upper limit of our reference range is lower than some of the previously reported upper limits, including an earlier report from our group using an earlier generation of the kit (Lutz et al 1995). This may reflect differences in laboratory techniques, or differences between the groups of cats used to determine the reference range, for example, client-owned cats versus research cats. This disparity in upper limit is of clinical significance when plasma fructosamine concentration is being used by a laboratory to diagnose diabetes mellitus biochemically, in the absence of detailed clinical information. Plasma fructosamine concentrations are affected by factors other than blood glucose concentration that may be present in sick cats, including hypo- and hyperproteinaemia, hyperthyroidism (Reusch and Tomsa 1999, Reusch and Haberer 2001) and possibly ketoacidosis. This again reinforces that for diagnosis of diabetes mellitus in cats, accurate clinical information is required, and measurement of plasma fructosamine concentration should not be relied on alone.
A third important finding of the study was that the range of plasma fructosamine concentrations associated with a given blood glucose concentration was quite wide, even after plasma fructosamine concentration plateaued. Concentrations ranged from 400 to 633 μmol/l with a blood glucose concentration of 523±5 mg/dl (29±0.3 mmol/l), and from 292 μmol/l to 378 μmol/l with a blood glucose concentration of 310±7 mg/dl (17±0.4 mmol/l), further demonstrating the difficulty in relying on plasma fructosamine concentration to diagnose diabetes in hyperglycaemic cats. Given the large range of plasma fructosamine concentrations for a given glucose concentration, the range of plasma fructosamine concentrations from well-controlled and poorly-controlled diabetics will likely overlap widely. For similar reasons, mean glucose concentration cannot be estimated with any confidence from plasma fructosamine concentration. Given these limitations, it may be more useful to follow plasma fructosamine concentration in an individual cat over time to assess glycaemic control.
A fourth finding was the critical difference for plasma fructosamine concentration in cats was 33 μmol/l. Knowledge of the critical difference is important for clinicians using plasma fructosamine concentration to assess the glycaemic control of diabetic patients. Practitioners need to be aware that when using plasma fructosamine concentrations for monitoring glycaemic control in diabetic cats, if the change is less than the critical difference, the change cannot be attributed to a change in glycaemic control. The critical difference for plasma fructosamine concentration measured in our study over 3 consecutive days was similar to the value reported in dogs (32.4 μmol/l) over a 5-week period (Jensen and Aaes 1992).
Fifthly, it is important for clinicians to be aware that changes in plasma fructosamine concentration as great as 120 μmol/l may occur with no change in glucose concentration. Haemoconcentration resulting from dehydration can account for only some of this change. It might be because the fructosamine assay was measuring a labile form of plasma fructosamine concentration formed during ketoacidosis, or a plasma component associated with ketoacidosis was interfering with the assay. In ketonuric cats, we observed that plasma fructosamine concentration during the initial 5 days of insulin therapy decreased by more than the critical difference in 4/6 cats, despite no change in blood glucose concentrations, although ketonuria resolved. Therefore, if serial plasma fructosamine concentration measurements are to be used to monitor glycaemic control, we recommend the use of the plasma fructosamine concentration from the day of discharge from hospital as the baseline measurement, rather than from the day of admission.
Many diabetic cats have plasma fructosamine concentrations over 600 μmol/l at the time of initial diagnosis (Kaneko et al 1992, Crenshaw et al 1996). However, in our study, even in cats with persistent hyperglycaemia of 29 mmol/l (540 mg/dl), mean plasma fructosamine concentrations rarely exceeded 550 μmol/l and never exceeded 635 μmol/l. The sudden increase in plasma fructosamine concentrations by more than 50 μmol/l over a 24-hour period in the ketoacidotic cat in our study, may explain the higher plasma fructosamine concentrations often seen in diabetic cats at initial diagnosis. The mechanism for the increase is unknown, but ketoacidosis may produce higher plasma fructosamine concentrations than expected based on blood glucose concentrations. Diabetic cats are often dehydrated at the time of initial diagnosis, which may further increase plasma fructosamine concentrations. Other factors such as lipidosis, hyperlipemia, and other metabolic changes may also affect the plasma fructosamine concentration.
Kaneko et al (1992) found no correlation between plasma fructosamine concentration and protein or albumin in cats. However, Reusch and Haberer (2001) reported a correlation between plasma fructosamine concentration and protein in normoglycaemic cats and found that 67% of hypoproteinaemic cats had significantly lower plasma fructosamine concentrations. Two similar studies in dogs found a high degree of correlation between plasma fructosamine concentration and albumin (Kawamoto et al 1992, Jensen 1993), while a third study did not recommend correction of plasma fructosamine concentration results (Jensen 1993). We did not measure albumin and, therefore, cannot make recommendations for the correction of plasma fructosamine concentration based on albumin concentration. As a moderate degree of correlation was found between plasma fructosamine concentration and plasma protein, we recommend that plasma fructosamine concentration results should be evaluated with knowledge of the plasma protein concentration. When the plasma protein concentration lies markedly outside the reference range, the plasma fructosamine concentration should be interpreted with caution and the practitioner may consider correcting the plasma fructosamine concentration relative to the plasma protein concentration.
In summary, based on the findings of this study, chronic hyperglycaemia of approximately 30 mmol/l (540 mg/dl) rapidly increased plasma fructosamine concentration, and after 3–4 days of hyperglycaemia, plasma fructosamine concentration values exceeded the reference range (331.1 μmol/l). The degree of elevation and whether values exceeded the reference range were dependent on the glucose concentration and the duration of hyperglycaemia. In general, cats with 29 mmol/l (540 mg/dl) blood glucose concentrations had elevated plasma fructosamine concentrations (mean 466 μmol/l), and cats with 17 mmol/l (360 mg/dl) blood glucose concentrations had plasma fructosamine concentrations (mean 327 μmol/l) around the upper limit of the reference range. Therefore, diagnosing diabetes mellitus based on plasma fructosamine concentration measurement alone should be undertaken with caution. When the blood glucose concentration is around 20 mmol/l (360 mg/dl), the clinician should assess clinical signs and serial blood glucose concentrations in order to rule out stress hyperglycaemia. In diabetic cats, plasma fructosamine concentration may be a useful measure of glycaemic control and probably reflects the mean blood glucose concentration for the preceding week. The range of plasma fructosamine concentrations associated with a given blood glucose concentration is wide. Therefore, serial plasma fructosamine concentrations in an individual cat over time may provide more useful information on diabetic control, rather than attempting to extrapolate a mean glucose concentration from the plasma fructosamine concentration.
Footnotes
Acknowledgements
Thanks go to Brian Bynon, Biochemistry Laboratory, Veterinary Pathology, School of Veterinary Science, The University of Queensland, Joan Hendrikz, Biological Sciences Group Statistical Consultancy, The University of Queensland, Debbie Laws, Companion Animal Sciences, School of Veterinary Science, The University of Queensland and Henry Thompson, Biochemistry Laboratory, Veterinary Pathology, School of Veterinary Science, The University of Queensland.
The Companion Animal Health Foundation of Australia; School of Veterinary Science provided the funding for this study.