
Abstract
Tissue dynamics spectroscopy combines dynamic light scattering with short-coherence digital holography to capture intracellular motion inside multicellular tumor spheroid tissue models. The cellular mechanical activity becomes an endogenous imaging contrast agent for motility contrast imaging. Fluctuation spectroscopy is performed on dynamic speckle from the proliferating shell and hypoxic core to generate drug–response spectrograms that are frequency versus time representations of the changes in spectral content induced by an applied compound or an environmental perturbation. A combination of 28 reference compounds and conditions applied to rat osteogenic UMR-106 spheroids generated spectrograms that were crosscorrelated in a similarity matrix used for unsupervised hierarchical clustering of similar compound responses. This work establishes the feasibility of tissue dynamics spectroscopy for three-dimensional tissue-based phenotypic profiling of drug response as a fully endogenous probe of the response of tissue to reference compounds.
Keywords
Three-dimensional Tissues for Screening
Living tissue is a complex system that responds to its environment in complex ways. In this sense, living tissue is a biosensor that can provide a multiparameter phenotypic profile of a pharmaceutical. For instance, multicellular tumor spheroids 1,2 are three-dimensional (3D) living tissue, which allow cells to exist in a natural 3D environment with normal cell–cell contacts and contacts to extracellular matrix (ECM). These tissues are more likely to display natural intercellular signaling and, hence, respond more naturally to applied pharmaceuticals. It is now known that cells in contact with flat hard surfaces do not behave the same as cells embedded in the ECM. 3,4 In response to this, a major conceptual and experimental shift has occurred in recent years away from two-dimensional (2D) cell cultures to 3D tissue cultures. 5 –8 Despite the advantages, one obstacle to wide adoption of the tumor spheroid model has been the difficulty to extract meaningful phenotypic responses from deep inside, especially in a high-content manner and without the need for labels.
Light scattering from tissue has become an important probe of cellular structure and dynamics. 9,10 Probing tissues with light is label free, nonionizing, and low cost. The challenge for light scattering from tissues has been how to extract high-content and context information from scattered light that can compete with the highly specific optical signals from fluorescence techniques. This has been partially achieved using low-coherence enhanced backscatter 11,12 that probes subtle structural changes in tissue layers. Light scattered from a selected depth can be partially localized by applying a coherence gate on the scattered light 13,14 as in optical coherence tomography. 15,16 Full-field coherence gating was demonstrated using dynamic holography 17,18 and was applied to multicellular tumor spheroids 19 and the mouse eye. 20 Digital holography 21 has been applied in the single-scattering regime with numerical focusing to study the refractive index profiles of cells 22,23 and in the multiple-scattering regime as a coherence gate to study the structure of tumors and effect of antimitotic drugs on tissue, 24 which is the approach we describe and use in this article.
Dynamic light scattering (DLS) in tissues falls into two regimes: quasi-elastic light scattering when light is predominantly singly scattered 25 and diffusing-wave spectroscopy 26 –28 when light is multiply scattered. The transition from single scattering to multiple scattering is particularly important for backscatter applications, 29 –32 such as in the work presented in this article. Coherence-gated DLS lies between the regimes of single and multiple scatterings. The coherence gate preferentially selects singly scattered ballistic photons. 29,32,33 Coherence gating has been applied to DLS to provide 3D information on the intracellular motions of cells. 34 This is the principle of motility contrast imaging (MCI), which has been applied to living tissue and used to study the effects of antimitotic cytoskeletal drugs on tissue dynamics. 24
In this article, we present holographic MCI and tissue dynamics spectroscopy (TDS) applied to multicellular tumor spheroids. These two related techniques use volumetric imaging based on DLS to extract high-content information from the active motion occurring inside the cells of the spheroids. MCI spatially resolves and quantifies the amount of motion in different parts of the tissue, whereas TDS performs fluctuation spectroscopy to identify the microscopic mechanisms of motion. Our specific approach is to generate drug–response spectrograms of living tissue responding to xenobiotic and environmental perturbations. These drug–response spectrograms display the changes in the fluctuating frequency content of the DLS as a function of time after the dose—much like voiceprint spectrograms. Different drugs elicit different drug–response spectrograms. The different features in the spectrograms can be related back to phenotypic effects of the drugs on the tissue. We have obtained drug–response spectrograms for several pharmaceutical compounds. By correlating the spectrograms, classes of drugs with common mechanisms can be identified.
Multicellular Tumor Spheroids
Multicellular spheroids of normal cells or neoplastic cells are balls of cells that may be easily cultured up to 1 mm in size in vitro. 35 –40 The spheroids can be used to simulate the histological and metabolic features of small nodular tumors in the early avascular stages of growth 40 and may be used to simulate the optical properties of a variety of tissues such as the epidermis and various epithelial tissues.
Beyond a critical size (about 200 μm), most spheroids develop a necrotic core surrounded by a shell of viable proliferating cells, with a thickness varying from 100 to 300 μm. The development of necrosis has been linked to deficiencies in the metabolites related to energy generation and transfer. The limiting factor for necrosis development is oxygen consumption and transport that reflects the status of the spheroid. 36,41 Early work on spheroids 42 launched the study of therapeutic strategies for cancer, especially the spheroid response to different drugs. The response to drug therapy was quantified from an analysis of spheroid volume growth delay, increase in the necrotic area, and change in survival capacity. This work focused on hypoxia and its induction by chemical agents. 43
Tumor spheroids of permanent cell lines offer a reliable model for systematic study of tumor response to therapy. 38,44 In vitro monitoring of tissue response to drugs is an area of strong interest to pharmaceutical companies. 45 Although the in vitro environment is artificial, the biochemistry, metabolism, and cell signaling response of cells grown as 3D constructs closely simulates in vivo tissue 46 –51 that would more accurately simulate in vivo growth of tumor cells in terms of their pathophysiology and response to therapy. 52 –55 This is in part because genomic profiles are preserved in spheroids but not in primary monolayer cultures. 56 –58 There have been several comparative transcriptomic studies that have tracked the expression of genes associated with cell survival, proliferation, differentiation, and resistance to therapy that are expressed differently in spheroids versus 2D cultures. For example, this was observed for cell lines from epithelial ovarian cancer, 59,60 hepatocellular carcinoma, 61 –63 or colon cancer 64 in which the expression profiles from the spheroids were more like those from tumor tissues. In addition, the 3D environment of the spheroids presents different pharmacokinetics than 2D monolayer culture and produces differences in cancer drug sensitivities between the monolayers and the spheroids. 65 –68 Therefore, in vitro experiments are a validated (and inexpensive) surrogate for in vivo response and have been used to test cancer therapeutics, such as metabolic and chemical gradients, hypoxia, cell–cell and cell–matrix contacts, and chemoresistance. 43,69 –73
Although microscopic imaging of cellular motility and motility-related gene expression is well established in 2D, 74 none of these studies considered cellular and subcellular motility as a diagnostic of cellular vitality, despite the obvious utility of this diagnostic, because there was no means of detecting motility nondestructively throughout a volume. MCI 24 provides this capability, and we have obtained motility information up to a millimeter deep in tumor spheroids.
Holographic Optical Coherence Imaging
Holographic TDS is the latest stage in an evolution of techniques that began with holographic optical coherence imaging (OCI), which is a form of full-field optical coherence tomography. 75,76 This soon progressed to MCI that spatially resolved the autocorrelation functions and used overall motion as a novel contrast agent. 24,34 Now it has evolved to TDS 77 that resolves overall motion into at least three broad frequency ranges with a tentative assignment of microscopic intracellular motion mechanisms.
The optical system for holographic OCI is shown in Figure 1A. We used a mode-locked Ti:sapphire laser (100-fs pulse duration and 100-MHz repetition rate) with a center wavelength of 840 nm and a bandwidth of 17 nm. The lens performs the Fourier transform of the object beam. The charge-coupled device (CCD) camera with a 7.4 mm pixel pitch is placed at the Fourier plane where the object beam interferes with the zero-path-matched reference beam that passes through the computer-controlled delay line. The typical object intensity for living tissue at the object plane is 5 mW/mm2, and an 8-bit CCD camera with one-megapixel resolution was used with an exposure time of 10 ms. Digital holograms were reconstructed by fast Fourier transform. An example of a 3D reconstructed tumor spheroid is shown in Figure 1B and C. The full tumor is shown in Figure 1B resting on the Petri dish. The data in Figure 1C are eroded to show only the brightest reflections. These come from the optically heterogeneous necrotic core, which casts a “shadow” on the Petri dish.
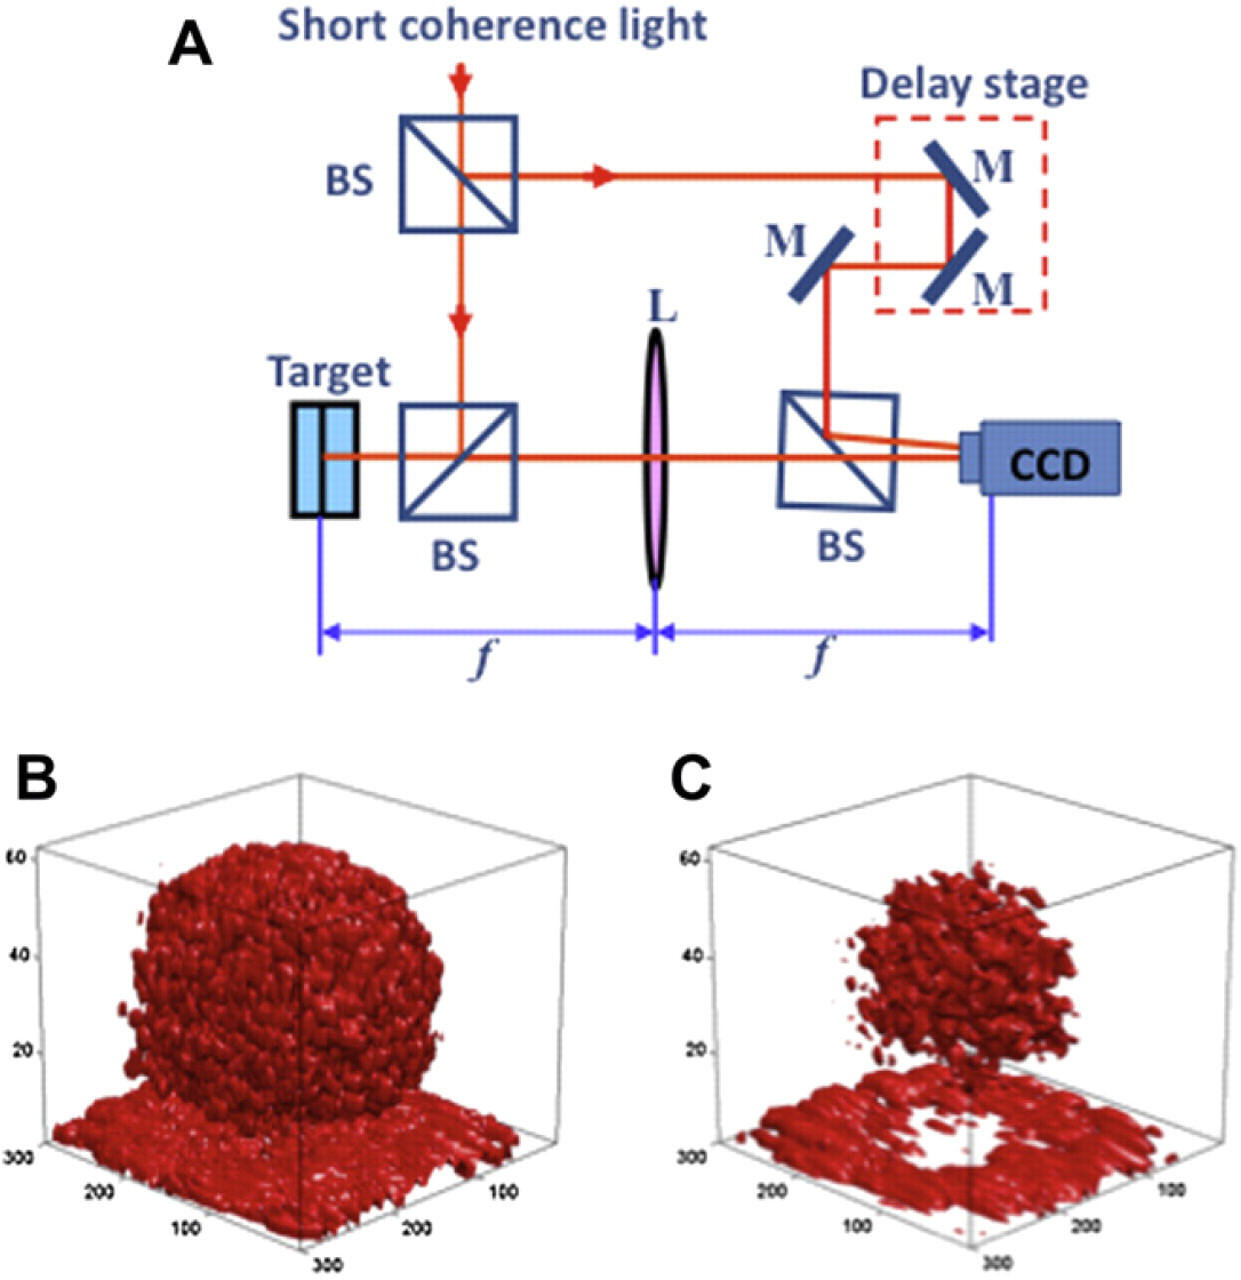
(A) Holographic OCI system and reconstruction of a multicellular tumor spheroid from OCI data. The 3D reconstructions at the bottom show all the data (B), or the high-reflectance voxels (C) that display the necrotic core and the shadow the core casts on the Petri dish.
Holographic OCI is based on off-axis digital holography using a CCD camera. The nominal speckle size on the CCD chip is approximately six pixels with approximately three optical fringes per speckle using a reference beam crossing angle of 3° at a wavelength of 840 nm. The intensity
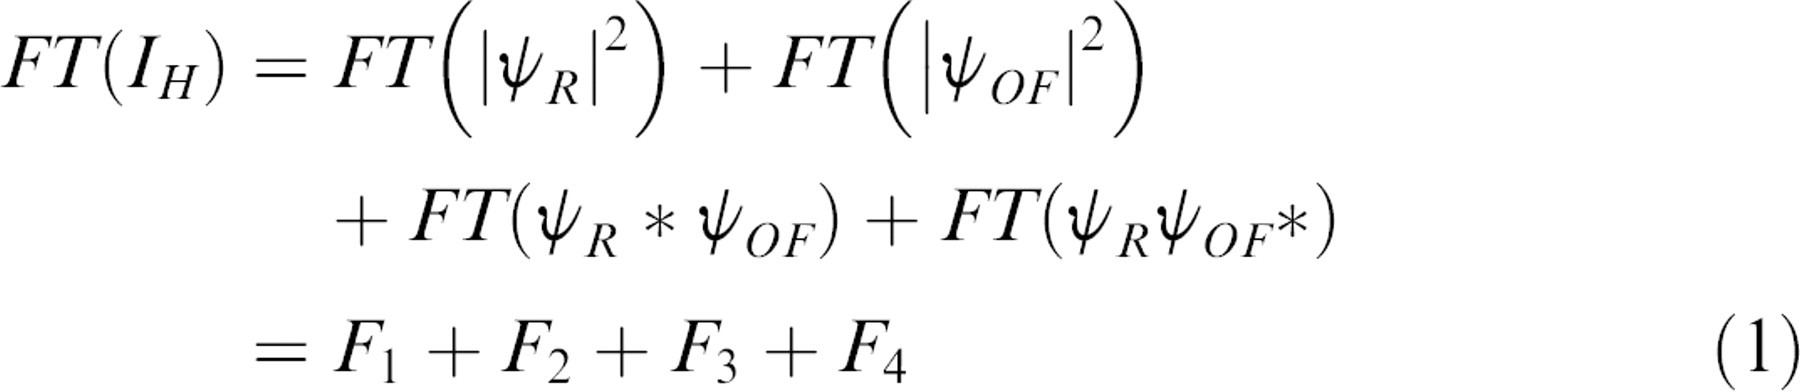
where the third term produces a holographic image, the fourth term produces a conjugate holographic image, and the first and second terms produce a zero-order image. The third and fourth terms in Eq. (1) are
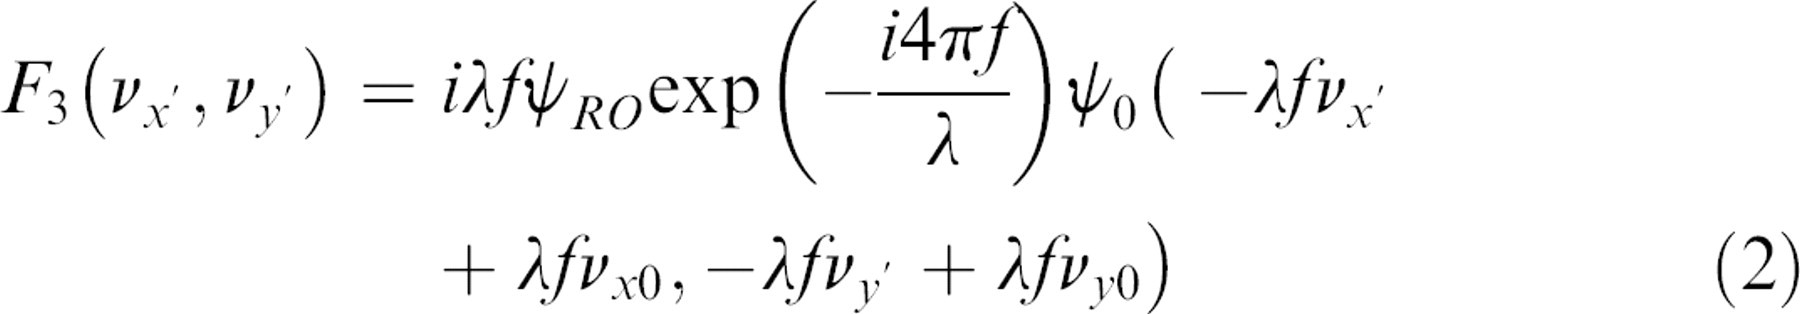
The holographic image
To remove the zero-order image, we approximate a digital hologram without interference by averaging the interference fringes over the fringe spacing interval. The fringe spacing for our crossing angle is approximately three pixels. Therefore, the digital hologram without interference is approximated by three-pixel averaging in the horizontal direction. Most of the zero-order images are removed after this zero-order suppression, the data are more stable, and it is less time consuming than acquiring a non-zero-path-matched image for zero-order subtraction. 76
The structure reconstructed in 3D is not static in living tissue, but is highly dynamic, reflecting the multitude of motions that occur on the subcellular scale. These motions include organelle transport by molecular motors, active motions of the membrane, membrane shape changes and restructuring of cell–cell and cell–ECM contacts, mitosis and cytokinesis, and necrosis and apoptosis. These motions span a range of nanometers per second to micrometers per second and cause dynamic shifts in the speckle from scattered light in the range of sub-Hertz to tens of Hertz. By analyzing the statistics of the fluctuating laser speckle during OCI, we are able to quantify the total amount of motion and use this measure as a novel contrast agent. The resulting images are called motility contrast images, and examples are shown in Figure 2. The sections are color coded by the total amount of motion, and the sections are shown for several selected depths from the top of the tumor through the midsection to the bottom. In the midsection, the motility metric provides a clear imaging contrast between the proliferating outer shell (with high degree of motion) and the necrotic core. The 3D reconstruction of the motion is displayed as a cutaway in Figure 2B. 24
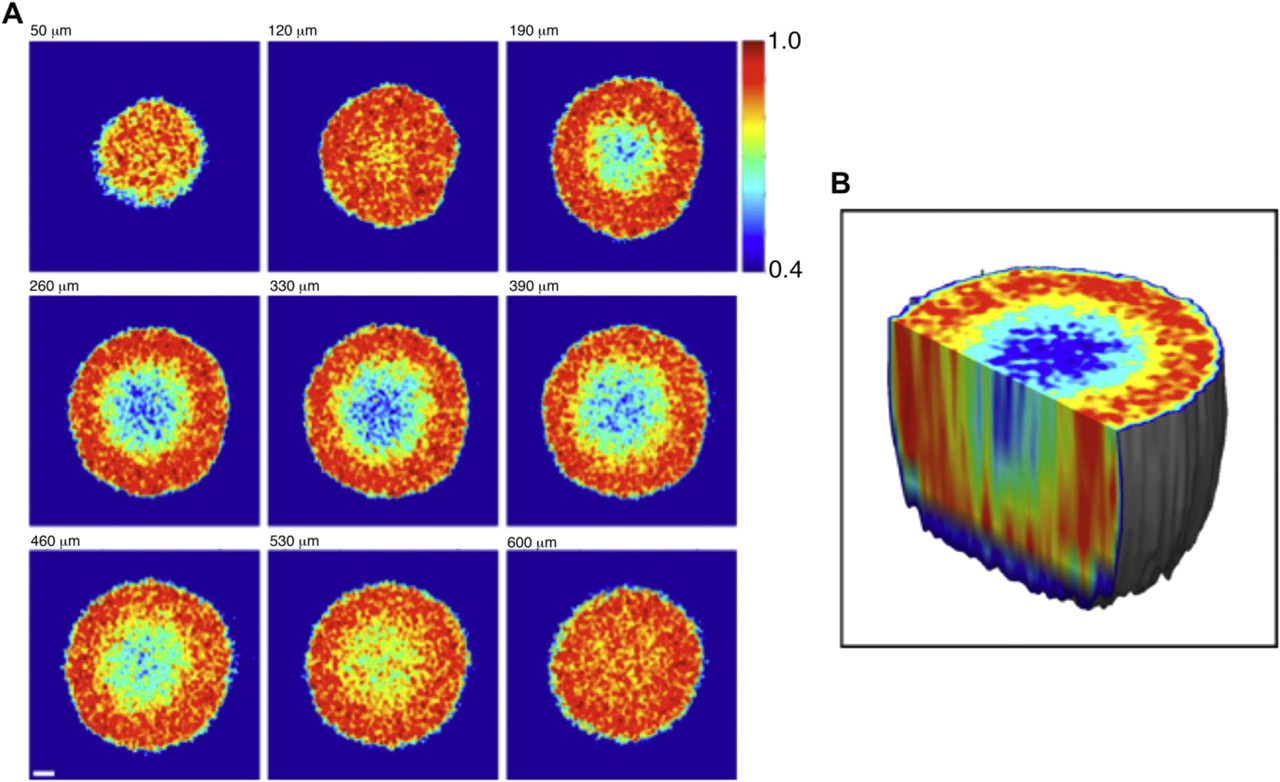
(A) MCI of an 800-μm-diameter tumor. The sections are color coded to total motion, displaying the proliferating outer shell and necrotic core. (B) The 3D MCI image that is a composite of successive sections.
Tissue Dynamics Spectroscopy
MCI provides a single metric value for the mechanical activity of a 3D voxel, which is used as the imaging contrast for Figure 2. However, the fluctuating speckle intensities have time–frequency information that is extracted by Fourier analysis into fluctuation power spectra. An example of power spectra from a tumor spheroid is shown in Figure 3 for the proliferating shell and hypoxic core of a 500-μm-diameter tumor. The shell power spectrum shows a distinct knee frequency near 0.1 Hz, but the hypoxic core appears more like 1/f noise down to the noise floor at the Nyquist sampling frequency of 5 Hz. The spectra have two to three orders of magnitude of detection dynamic range across three orders of magnitude of frequency.
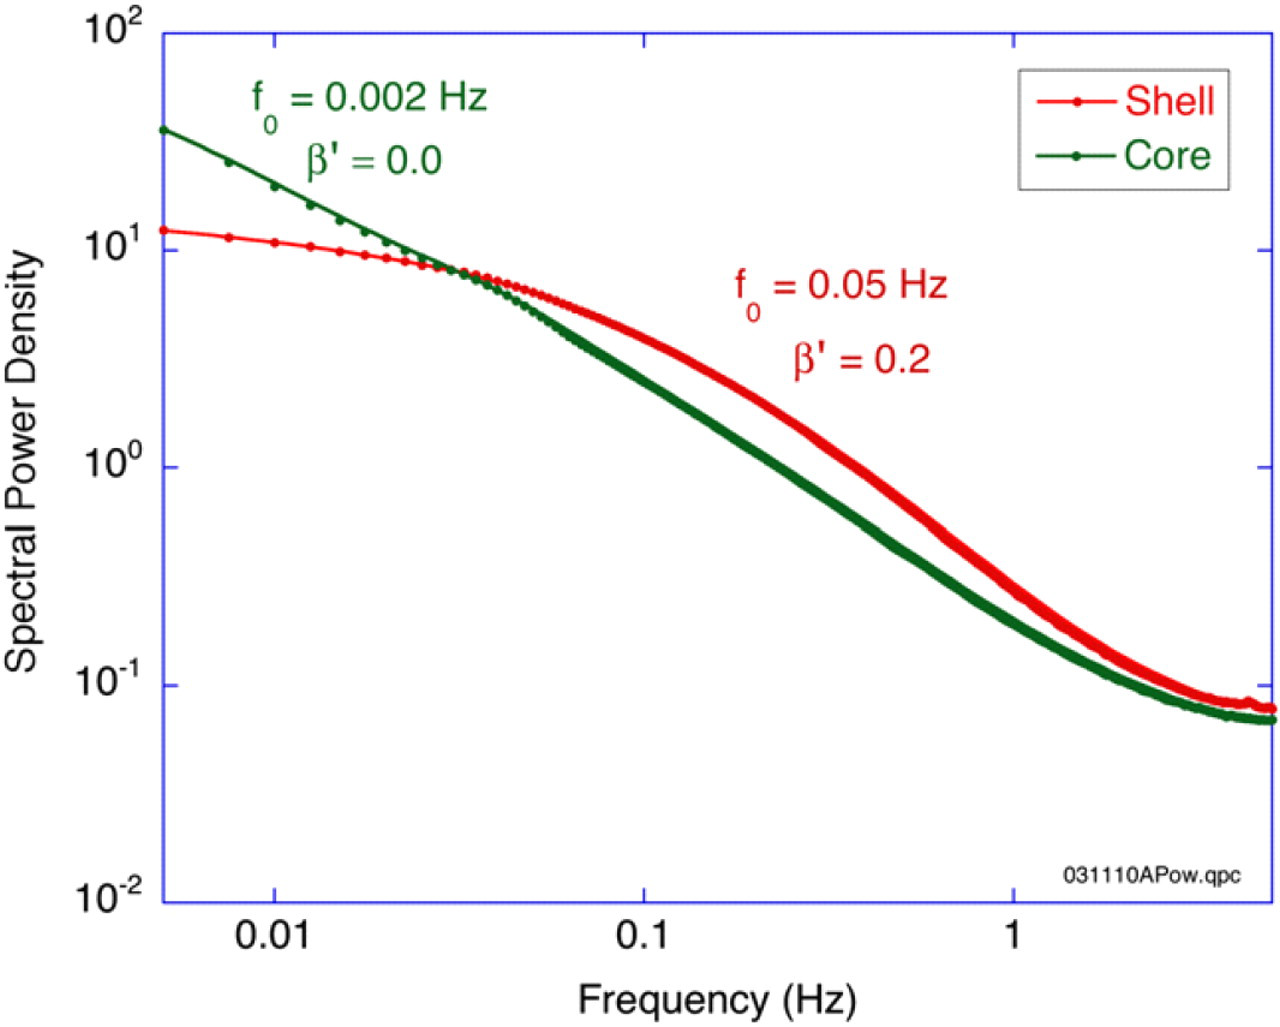
Fluctuation power spectra of a tumor spheroid for the proliferating outer shell and necrotic core. The shell shows higher frequency content and a clear knee frequency. The necrotic core displays characteristic 1/ f behavior. Both spectra converge on a noise floor at the Nyquist frequency at 5 Hz.
The power spectrum for TDS is

where FT stands for Fourier transform,
where
When perturbations are applied to a living tissue sample, the response of the tissue dynamics can be subtle, but consistent. Because both the autocorrelation and spectral density functions span a wide dynamic range over several orders of magnitude, small changes in dynamics are de-emphasized in logarithmic plots. To capture the time course of subtle changes in tissue dynamics requires a differential relative measure, which we take to be the differential relative spectrum, called a spectrogram.
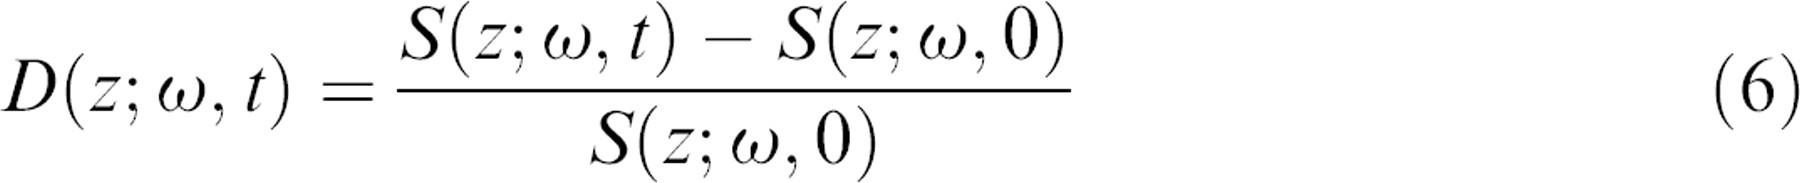
This differential spectrogram is a 2D function of frequency and time at fixed depth
As examples, two spectrograms are shown in Figure 4. The top spectrogram is for the metabolic drug iodoacetate, and the bottom spectrogram is for the antiactin drug cytochalasin D. Frequency is along the vertical axis, and time is along the horizontal axis, with the drug applied at
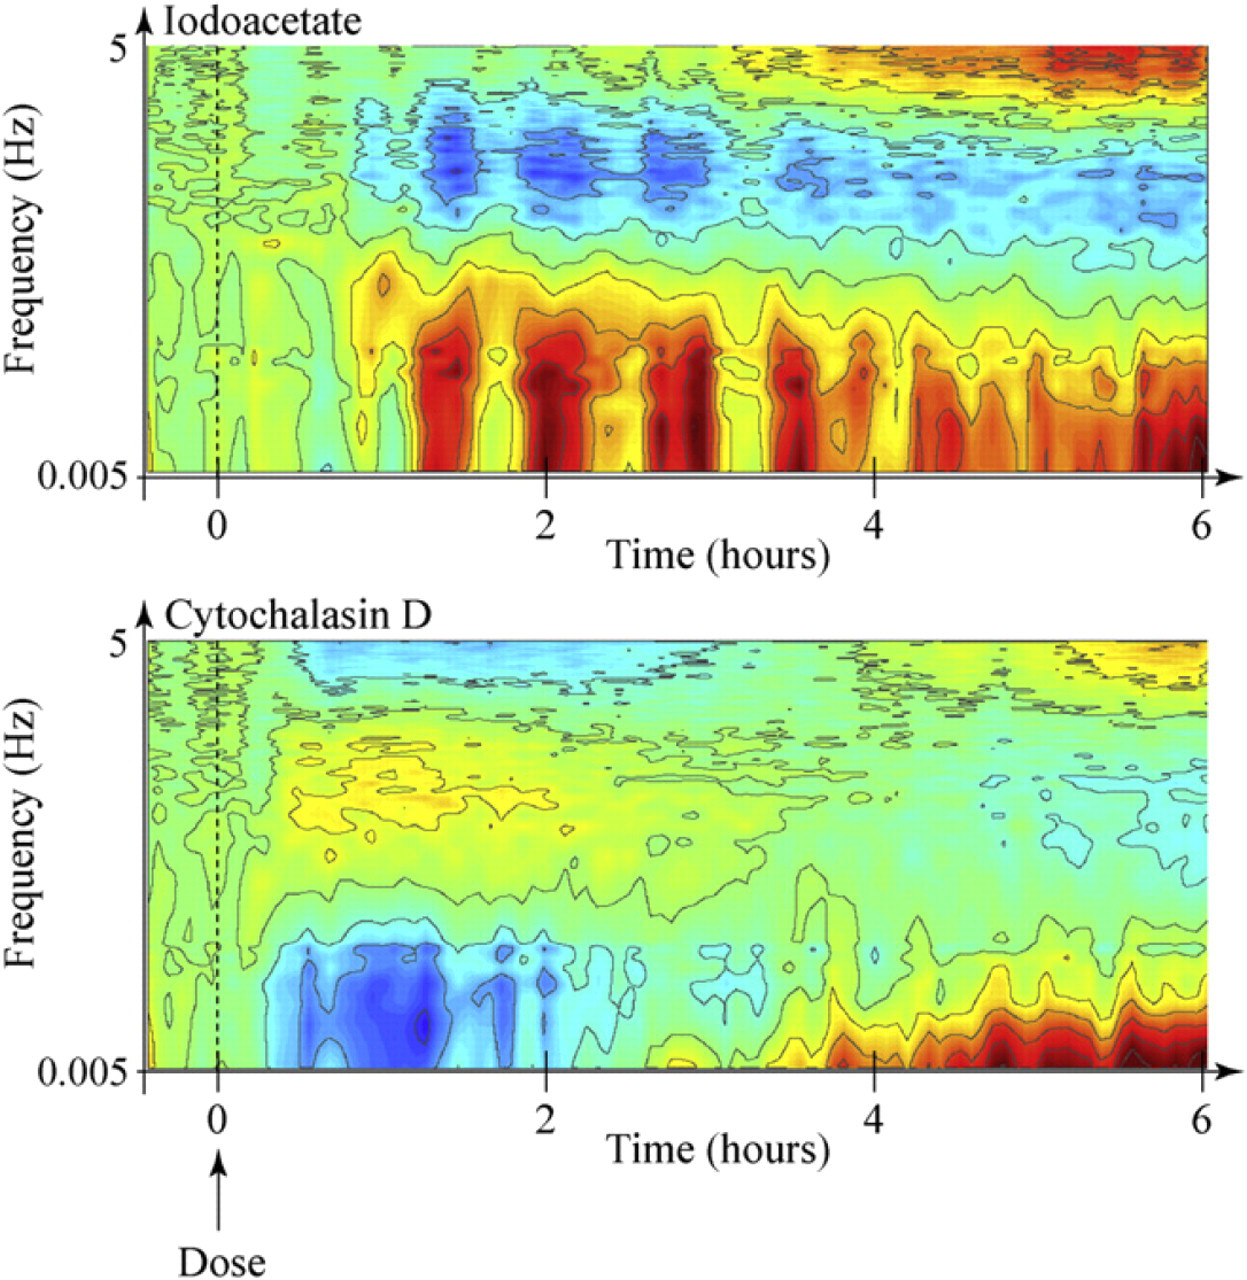
Drug–response spectrograms obtained from TDS for iodoacetate (top) and cytochalasin D (bottom). These are differential normalized spectrograms of Eq. (6). The baseline is set before the application of the drug, and only the changes in the fluctuation frequencies are displayed in color (red: enhanced motion; blue: suppressed motion). Note the striking differences in the spectrogram signatures for these two drugs.
To interpret the spectrograms, it is necessary to establish which structural features and which dynamical mechanisms are involved in observed changes in the various spectral bands. The lowest frequency in our experimental spectrograms is 0.005 Hz, and the highest frequency is 5 Hz. To make the connection between detection frequency and motion, the general relationships for single backscattering are
The general aspect of these characteristic frequencies is the connection of spatial scale with temporal scale. Cell shape changes at the scale of tens of micrometers occur on frequency scales of 0.01–0.1 Hz. Smaller membrane undulations with spatial wavelengths of micrometers occur on frequency scales of 0.1–1 Hz. Even smaller organelle and cytoskeletal motions on submicrometer scales occur on frequency scales of 1–10 Hz. This spatial–temporal trend is only semiquantitative, but it provides a general principle that may help disentangle the mixtures of frequencies that arise from multiple DLS experiments.
The effect of temperature on the spectrogram is shown in Figure 5. The baseline is set for room temperature at 24 °C. At
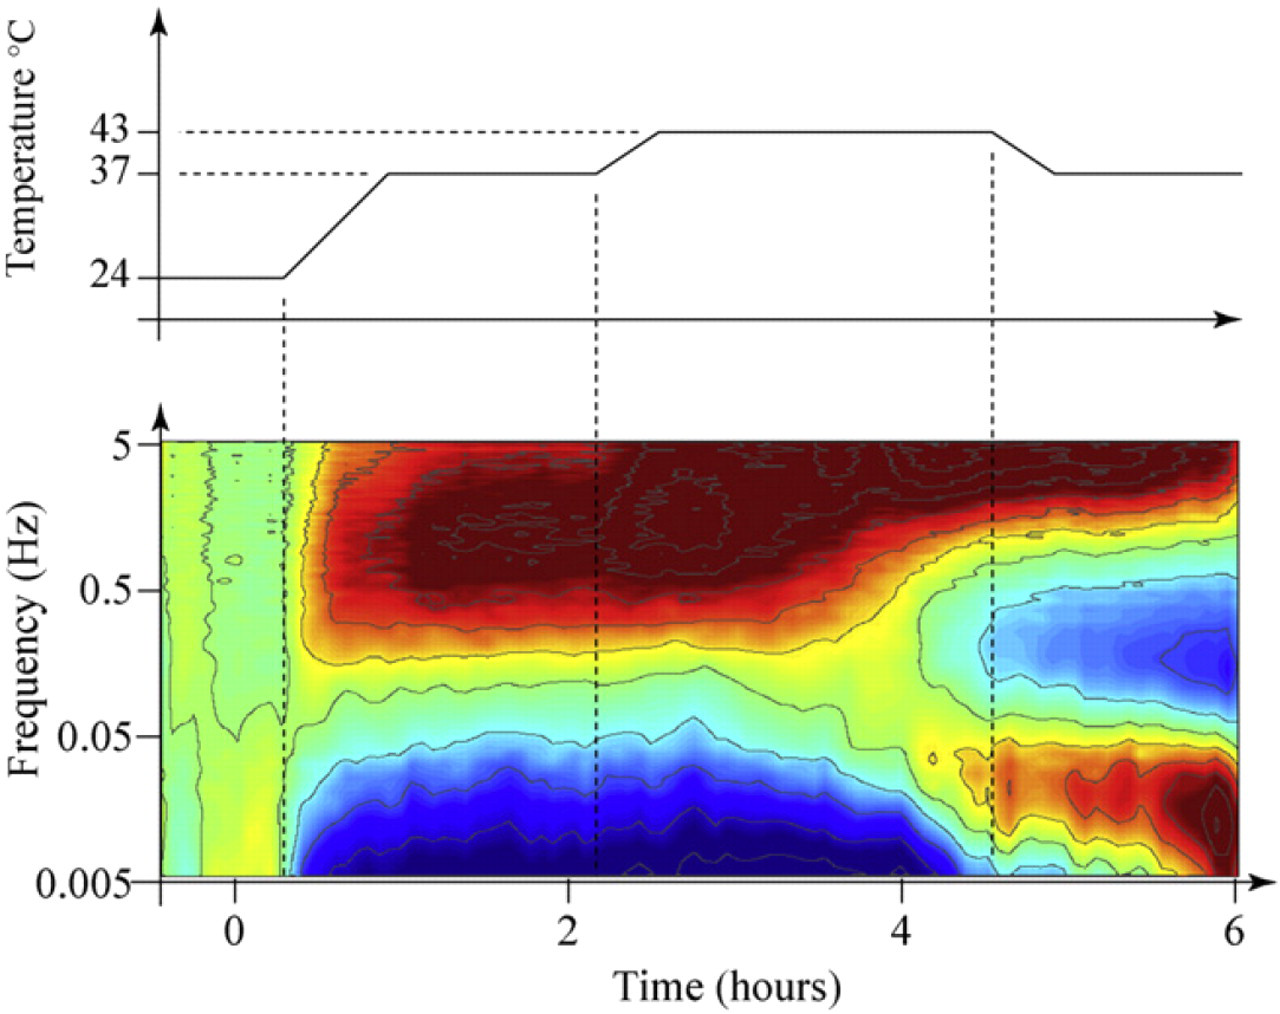
Differential spectrogram response to temperature. The baseline is established at room temperature, and the temperature is raised to physiological temperature of 37 °C, and then to 43 °C, after which it is returned to 37 °C.
The dose–response to the drug nocodazole, an antitubulin antimitotic drug, is shown in Figure 6 as a function of dose. Each dose is for a separate tumor spheroid, and the individual spectrograms of the different doses are shown in the panels on the left. The dose–response function on the right was obtained by crosscorrelating (unnormalized) the individual spectrograms with the 10-μg/mL spectrogram. This leads to the response curve that saturates above 1 μg/mL. The sensitivity is approximately 10 ng/mL with a 50% effective concentration EC50 = 60 ng/mL. The saturated response has a variability of approximately 10%, which reflects the tumor-to-tumor variability. Although we have not yet performed a multiwell statistics experiment, this level of tumor variability is anticipated to produce a
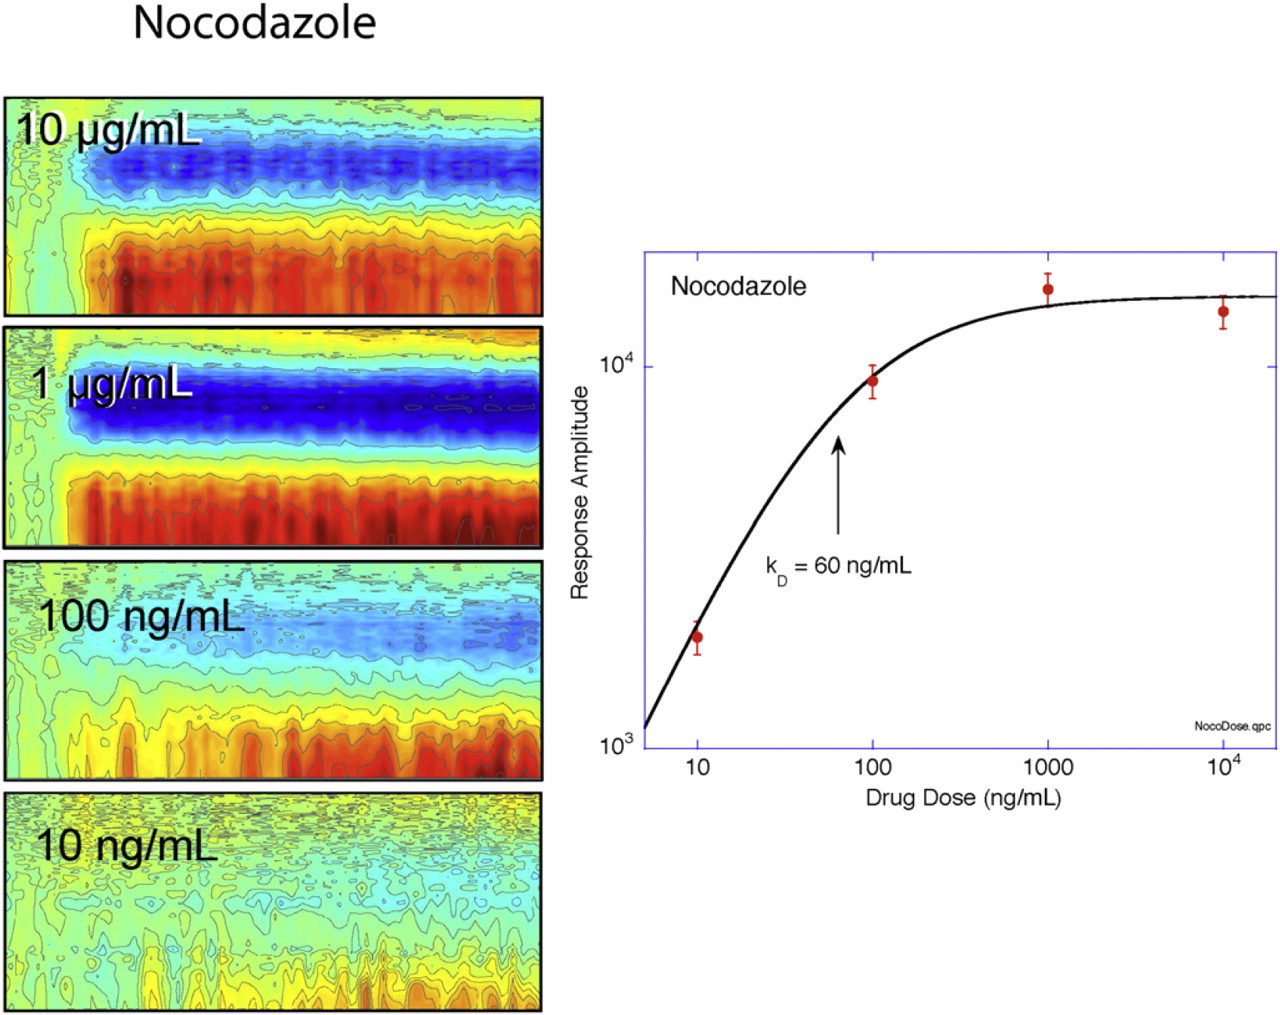
Dose response to nocodazole from 10 ng/mL to 10 μg/mL. Each dose is applied to a different tumor spheroid. The dose response has an EC50 = 60 ng/mL with a sensitivity of 10 ng/mL.
Spectrogram Correlations
We applied 28 different drugs, concentrations, and conditions to 28 different tumor spheroids and obtained the spectrograms in each case. These spectrograms are complex, showing many different types of features in response to the applied drugs. Similar drugs produced similar spectrograms, whereas widely differing spectrograms could be elicited from drugs with very different mechanisms of action. To capture the similarity or dissimilarity of the drug–response spectrograms, we calculated the cross-correlation coefficient between spectrograms specified by
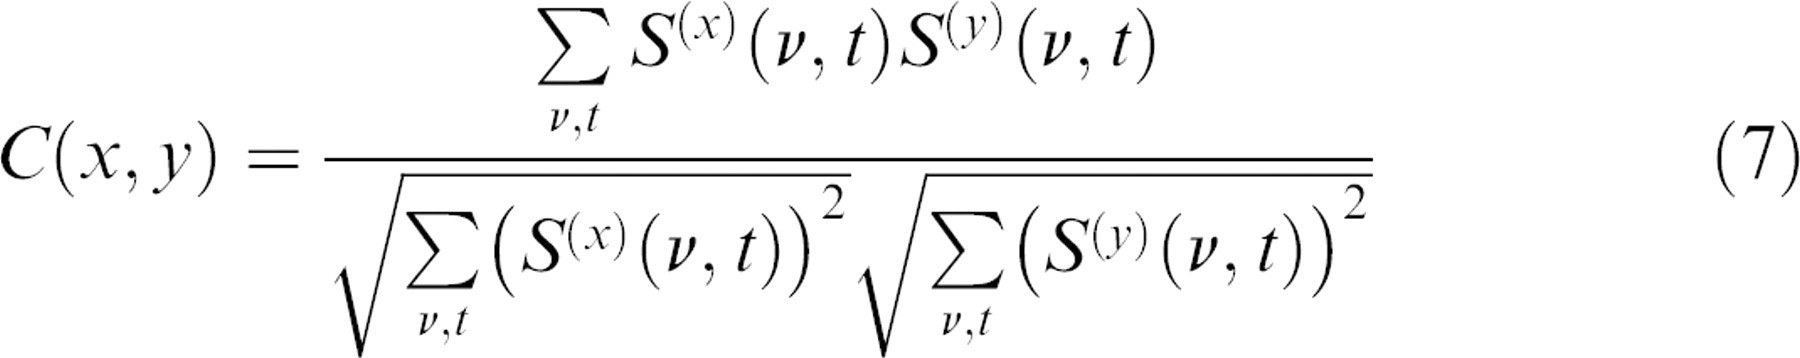
where
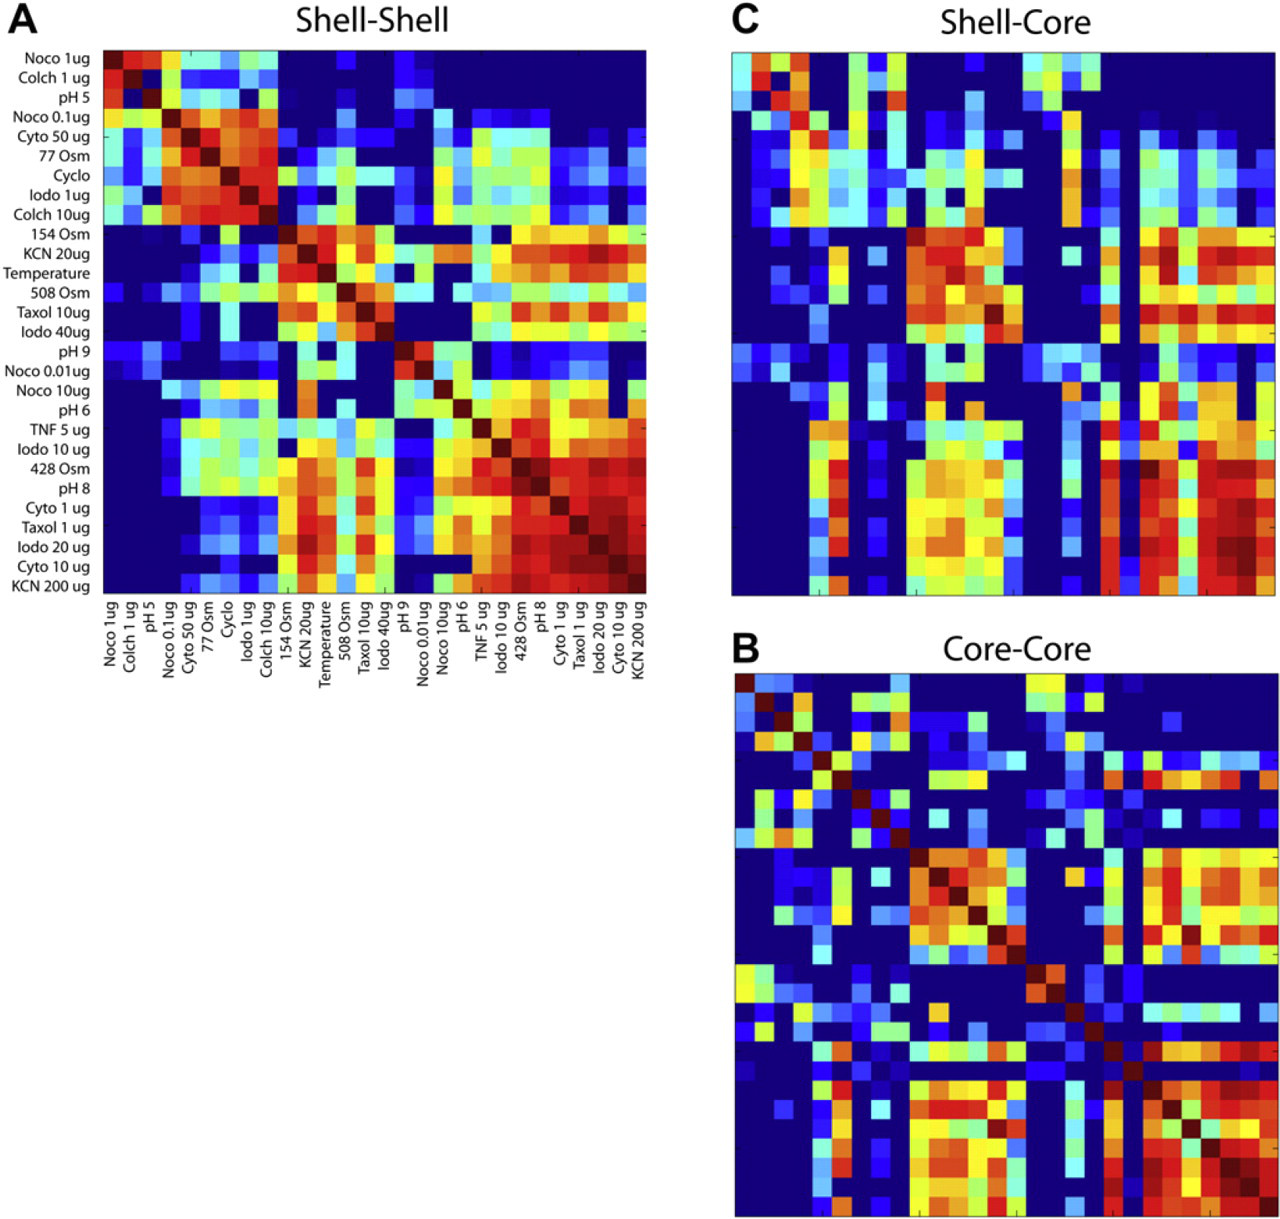
Similarity matrices after hierarchical clustering on the shell spectrograms. Red corresponds to positive correlation, and blue to negative correlation. (A) The shell–shell correlations exhibit a nearly block-diagonal structure with approximately five groups of drugs/conditions after clustering. (B) Core–core correlations for the sequence clustered by the shell. (C) Shell–core correlations for the same sequence.
The similarity matrix provides the basis for a hierarchical clustering algorithm that can group different drugs and conditions by their similar drug–response spectrograms. Each row of the
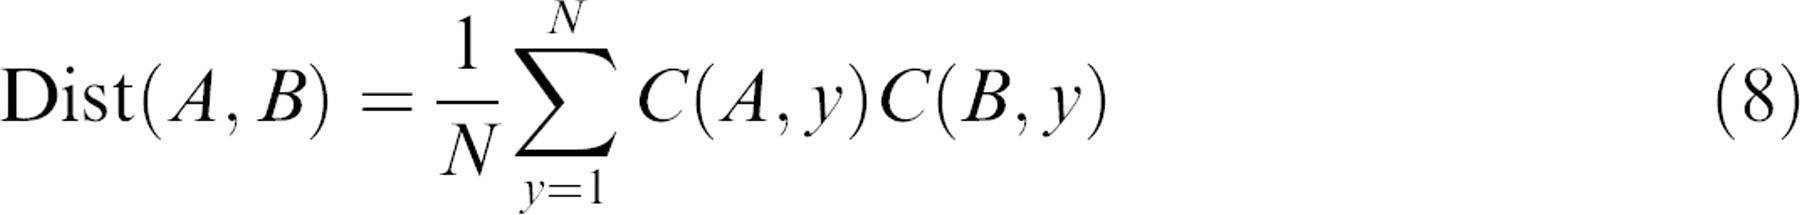
Inner products near unity correspond to “close” associations, and inner products near negative unity correspond to “far” associations.
The compounds, doses, and conditions are given in Table 1, grouped according to the hierarchical clustering of the drug responses based on the spectrograms of the proliferating shell. In a hierarchical clustering algorithm, at each stage, the two closest vectors are identified and grouped into an average vector, and the number of vectors decreases by one. The sequence of the vectors that are grouped in this way is retained until all vectors have been grouped. The sequential grouping of vectors produces a clustering of similar drug responses. The similarity matrix is rearranged according to the sequence of grouping according to the shell–shell correlations, and the result is shown in Figure 7A. The similarity matrix shows structure, with an approximately “block diagonal” appearance. If the matrix were truly block diagonal, the clustering would consist of groups of unique behaviors. However, in the case of the drug responses, there is considerable off-diagonal structure, which indicates that different groups of drug responses do share some aspects in common.
Reference compounds, doses and conditions
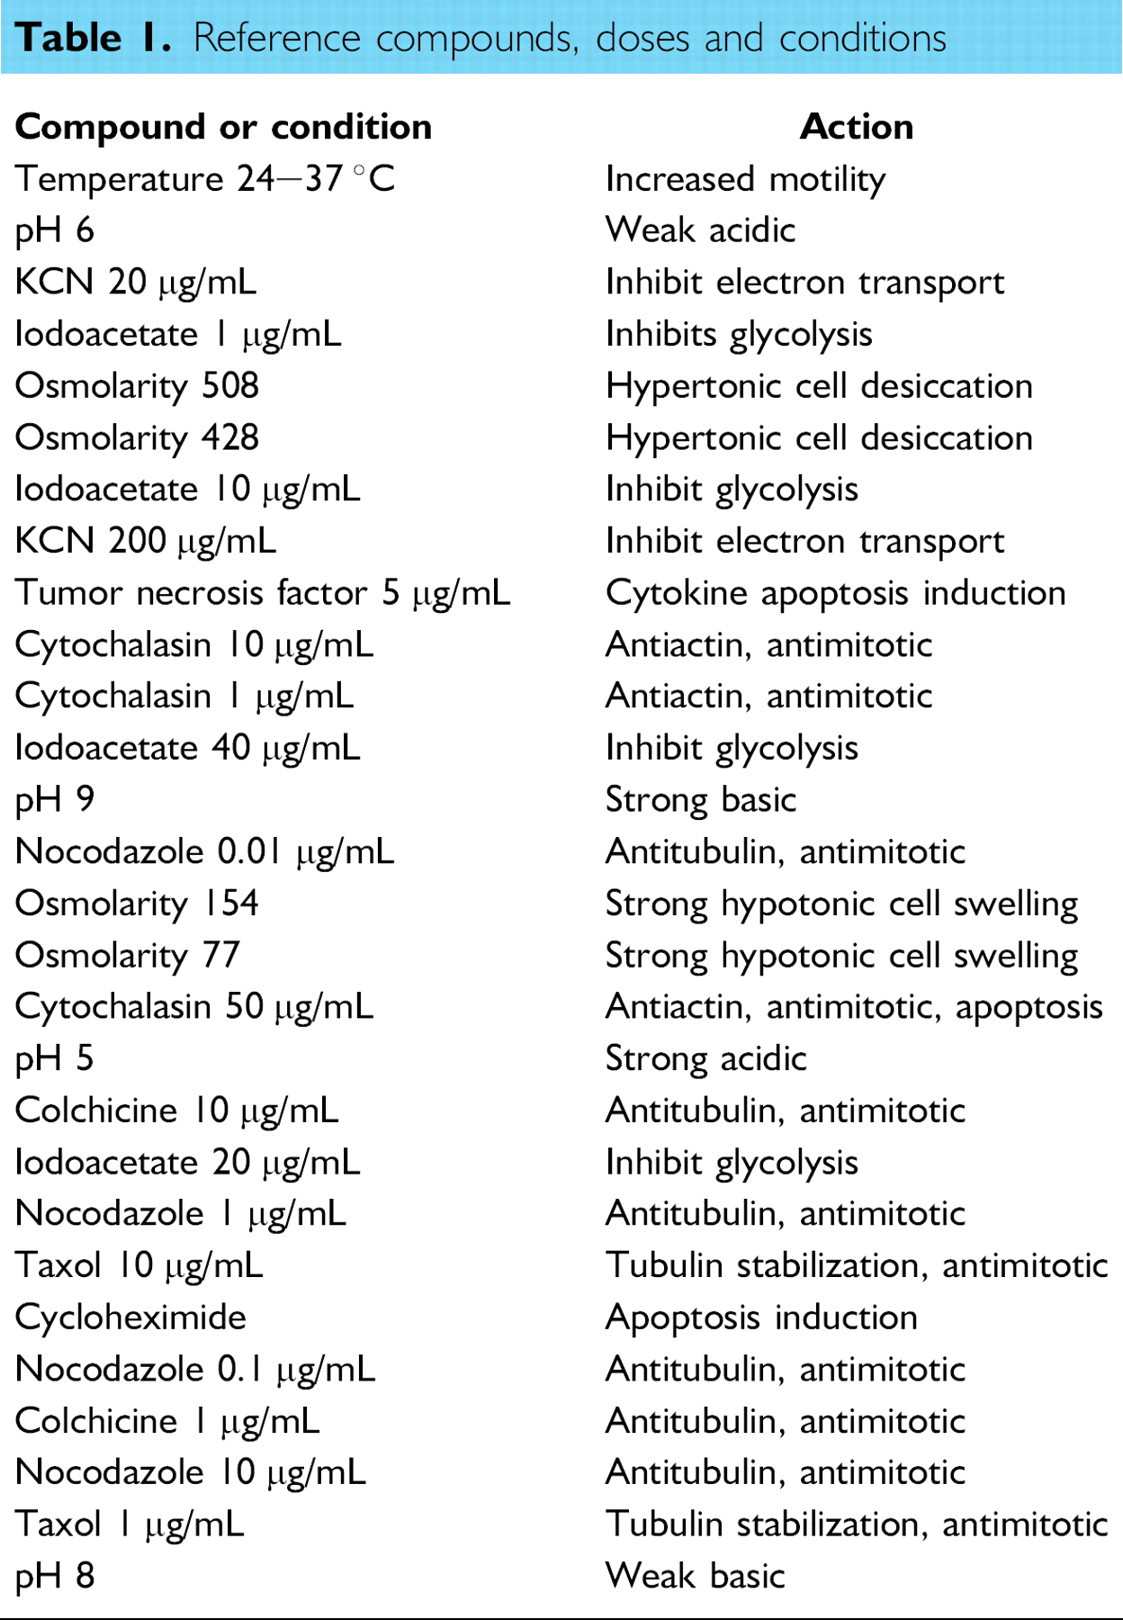
The compounds were applied at multiple different doses, some below and some above EC50. Therefore, the clustering does not automatically group similar drugs together, but instead clusters responses. If a higher dose induces apoptosis, but a lower dose does not, then the higher dose will be grouped with other drugs or conditions that induce apoptosis. In a future analysis, each drug response can be referenced to its own EC50, which would remove the dose dependence in the clustering.
The multicellular tumor spheroids have different conditions for the proliferating shell relative to the core, which tends to be hypoxic and ATP depleted. Furthermore, large tumors (larger than 500-μm diameter) have increasingly necrotic cores. TDS is volumetric (depth gated), so the response of the core can be compared with the different response of the shell. The core–core correlations are shown in Figure 7B for the same ordering as for the clustered data using the shell–shell correlations. There are many similarities in the core–core correlations, but with notable differences, and several of the blocks are missing. This is because the shell and core respond differently to the applied conditions. This is seen more clearly in Figure 7C, which is the correlation of the shell spectrograms with the core spectrograms. The diagonal elements of this similarity matrix are not all near unity, showing significant differences in the response of the core relative to the shell, even responding in the same tumor to the same conditions.
Because the core is under a different condition than the shell, the 28 conditions are doubled to 56 conditions, which can be crosscorrelated in a similarity matrix and clustered according to all 56 conditions. The resulting clustered similarity matrix is shown in Figure 8. Many of the shell and core spectrograms are clustered together (highly similar), but there are many other pairs that are separated in the clustering process because their respective spectrograms are not highly similar. This is likely a consequence of the ATP-depleted conditions of the core relative to the proliferating shell. For instance, an apoptotic response requires normal ATP concentrations and can occur in the shell, whereas the cells in the core would be forced to follow a necrotic path. This difference between apoptosis and necrosis based on ATP concentrations may be one of the differentiators between the spectrograms of the shell relative to the core. Clearly, a more systematic study of these differences between the shell and the core may uncover specific spectrogram signatures for processes such as apoptosis.
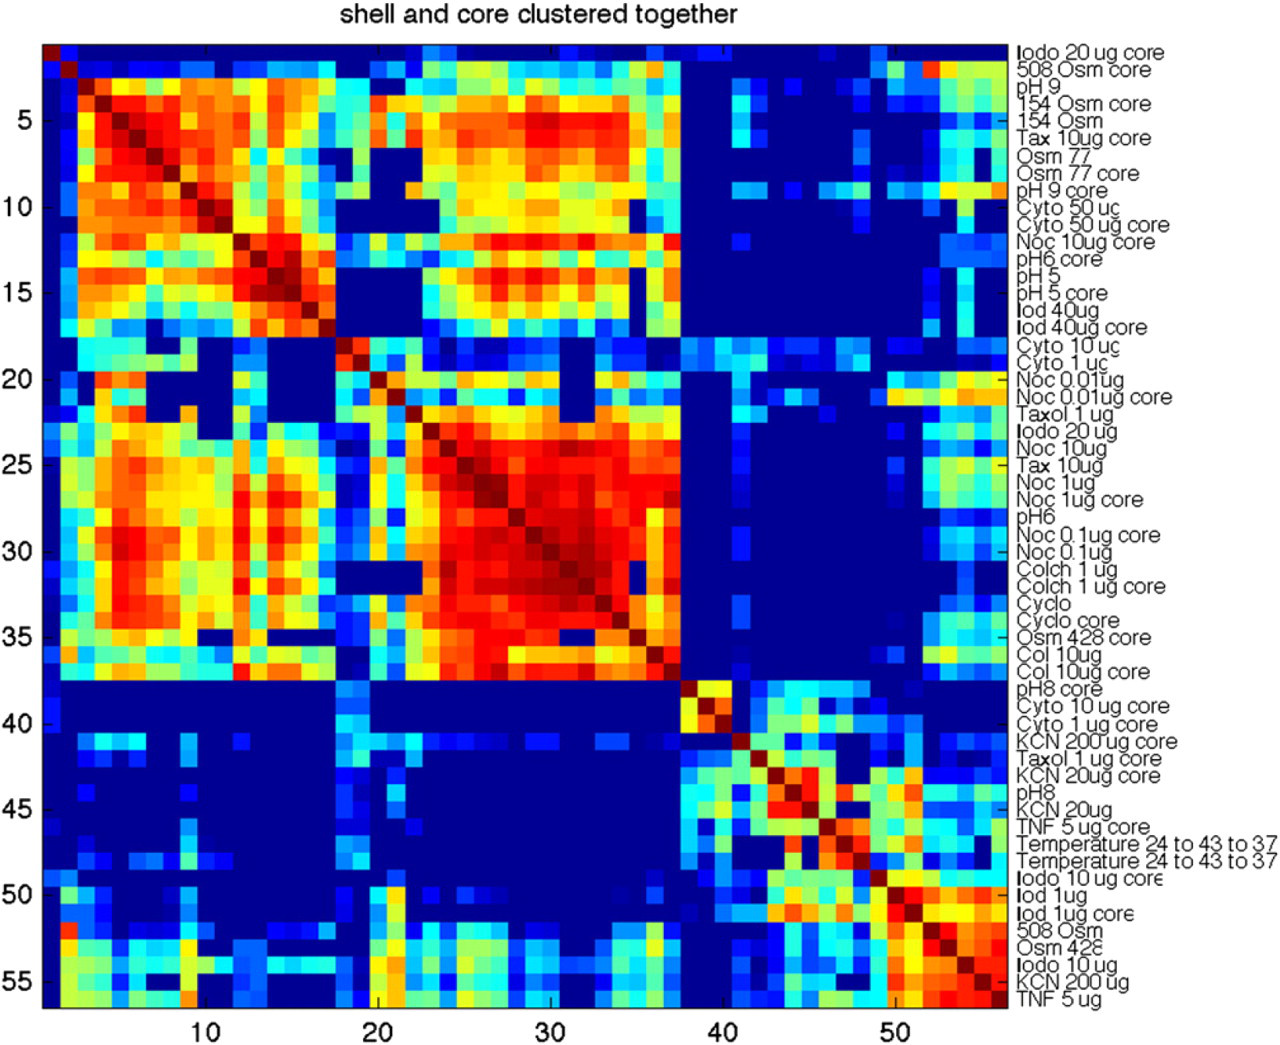
Similarity matrix for all 56 conditions, including the difference between the shell and the core. The clustering is unsupervised but tends to pair shell and core spectrograms. On the other hand, many shell-core pairs are not clustered, which may reflect different processes that occur in the hypoxic core relative to the proliferating shell.
Conclusions
The 28 drug–response spectrograms share some features in common but with additional distinguishing features that enable phenotypic profiling across a range of reference compounds and conditions that span wide functionality. The size of the test space was sufficient to perform hierarchical clustering of the drugs into groups that share responses in common. The known mechanisms of action of these reference compounds enable approximate assignments to be made for the basis of clustering in each case.
These preliminary results open the way to more detailed analysis of the spectrogram features. Just as no two voiceprints in voice recognition are identical, we hypothesize that the same will be true for drug–response spectrograms—at least for drugs with different mechanisms of action. Feature recognition software that has been developed for voice recognition may be modified for feature analysis of the drug–response spectrograms. Features become the elements of multidimensional feature vectors that can be used to construct higher fidelity similarity matrices for clustering. More importantly, specific features can be selected—for instance apoptotic signatures—and drugs can be clustered with emphasis on these features. By increasing the number of cell types and reference compounds to include standard of care, a broad phenotypic profiling library can be assembled against which to compare new drugs and their tissue dynamics responses.
Footnotes
Acknowledgments
This work was supported by the National Science Foundation grant CBET-0756005. KJ gratefully acknowledges support from the Korea Military Academy Hwarangdae Research Institute.