
Abstract
Drug-induced pancreatitis (DIP) is an underdiagnosed condition that lacks sensitive and specific biomarkers. To better understand the mechanisms of DIP and to identify potential tissue biomarkers, we studied experimental pancreatitis induced in male C57BL/6 mice by intraperitoneal injection of caerulein (10 or 50 μg/kg) at 1-hr intervals for a total of 7 injections. Pancreata from caerulein-treated mice exhibited consistent acinar cell autophagy and apoptosis with infrequent necrosis. Kinetic assays for serum amylase and lipase also showed a dose-dependent increase. Terminal deoxynucleotidyl transferase–mediated biotin-dNTP nick labeling (TUNEL) detected dose-dependent acinar cell apoptosis. By light microscopy, autophagy was characterized by the formation of autophagosomes and autolysosomes (ALs) within the cytoplasm of acinar cells. Immunohistochemical studies with specific antibodies for proteins related to autophagy and pancreatic stress were conducted to evaluate these proteins as potential biomarkers of pancreatitis. Western blots were used to confirm immunohistochemical results using pancreatic lysates from control and treated animals. Autophagy was identified as a contributing process in caerulein-induced pancreatitis and proteins previously associated with autophagy were upregulated following caerulein treatment. Autophagosomes and ALs were found to be a common pathway, in which cathepsins, lysosome-associated membrane protein 2, vacuole membrane protein 1, microtubule-associated protein 1 light chain 3 (LC3), autophagy-related protein 9, Beclin1,
Introduction
Acute pancreatitis is an inflammatory disorder of the pancreas that can lead to local and systemic complications. One-fourth of reported cases suffer severe morbidity (Bhatia, Neoptolemos, and Slavin 2001) and mortality approaches 10%. Acute pancreatitis has been attributed to multiple etiologies including pancreatic duct constriction, cytotoxicity, toxic metabolite accumulation, and hypersensitivity reactions based on clinical cases and animal studies (Underwood and Frye 1993). Drug-induced pancreatitis (DIP) is a recognized rare adverse event for a number of drug classes and for many of the most widely prescribed drugs (Badalov et al. 2007). The World Health Organization has reported that more than 500 drugs from different classes have been suspected to induce acute pancreatitis (Lancashire, Cheng, and Langman 2003). Clinically, DIP is characterized by nausea, emesis, and severe abdominal pain that can be referred and present as back pain. However, it is likely that DIP also occurs in milder forms that might present as milder abdominal discomfort and gastritis. Similar to acute pancreatitis of other etiologies, DIP in its milder forms is widely misdiagnosed or underdiagnosed and therefore underreported (Trivedi and Pitchumoni 2005). Given these facts, the true incidence of DIP is difficult to determine, although there are reports that estimate the incidence of DIP between 0.1% and 2% (Andersen, Sonne, and Andersen 2001; Balani and Grendell 2008). Sensitive and specific biomarkers for pancreatitis, in general, and DIP, specifically, remain elusive. Given these facts, it is not surprising that almost no specific physiology data or pathogenesis information exists for human DIP. Recently, postmarket adverse event reports of acute pancreatitis have brought into question the safety of several antidiabetic drugs, including exenatide (Denker and Dimarco 2006; Lyer et al. 2012). Consequently, regulatory agencies, pharmaceutical companies, physicians, and patients are all interested in new models and predictive biomarkers for pancreatitis and/or pancreatic injury. However, no animal model has been identified that can be used to estimate a drug’s potential for DIP or to investigate potential mechanisms initiating DIP. In addition, existing biomarkers (amylase, lipase) are relatively insensitive (Devanath et al. 2009) and nonspecific (Yilmaz et al. 2012).
Cholecystokinin is a polypeptide hormone produced principally by the first segment of small intestine (duodenum). Physiologically, cholecystokinin is the principle stimulus for delivery of pancreatic digestive enzymes into the small intestine. Acute pancreatitis is thought to evolve from ectopic or excessive release and/or activation of these digestive enzymes (Mansfield 2012; Sakorafas and Tsiotou 2000). The major pathological findings in human pancreatitis involve acinar cell injury and duct obstruction (Sakorafas and Tsiotou 2000). Intra-acinar activation of trypsinogen plays a central role in acinar cell injury and in the pathogenesis of acute pancreatitis (Hofbauer et al. 1998). Caerulein is a specific decapeptide analog of cholecystokinin that in supraphysiological doses can induce acute pancreatitis. Caerulein rodent models of acute pancreatitis have been established for over two decades (Kern, Adler, and Scheele 1985; Niederau, Ferrell, and Grendell 1985; Saluja et al. 1985). These models produce lesions in rodents similar to those seen in clinical cases of acute pancreatitis (Saluja et al. 1985).
In the evolution of caerulein-induced pancreatitis, autophagy has been described as a mechanism of acinar cell injury (Willemer, Bialek, and Adler 1990). More recently, autophagy has reemerged as a novel theory for induction or initiation of pancreatitis, especially through intracellular activation of trypsinogen to trypsin that leads to escalating protein degradation and further enzyme activation (Ohmuraya and Yamamura 2008; Fortunato and Kroemer 2009). Autophagy consists of the sequestration of intracellular components and their degradation by lysosomal enzymes, and thus it can serve as the major constitutive pathway for the bulk degradation of intracellular long-lived proteins. Autophagosomes form from the elongation of a double lipid bilayer membrane derived from the endoplasmic reticulum (ER) or other preexisting organelles such as Golgi membrane; this structure subsequently fuses enclosing cytoplasmic proteins into spherical organelles (Hamasaki and Yoshimori 2010; Resau et al. 1985; Takeshige et al. 1992). These autophagic vacuoles contain recognizable organelles or cytosolic content that become exposed to lysosomal enzymes. The mechanism by which acinar cell autophagy is induced is not fully understood.
Immunohistochemistry (IHC), immunoperoxidase staining, and immunofluorescence are important research tools for identifying antigens (e.g., proteins) in autophagic acinar cells of pancreatic sections. Using IHC in rats, intra-acinar cell activation of trypsinogen was previously shown to colocalize with digestive enzyme zymogens and lysosomal hydrolases at the early stage of caerulein-induced pancreatitis (Hofbauer et al. 1998). Subsequently, there have been extraordinary advances in immunofluorescence staining for studying caerulein-induced autophagy using confocal laser scanning microscopy with a large number of new fluorescent dyes (Ropolo et al. 2007). Table 1 summarizes the name, concentration, source, and target function for each antibody used in this study. These antibodies are specific to pancreatitis-associated proteins (PAP; pancreatic stress proteins), lysosomal proteases, or have been previously associated with autophagy. These markers were used to interrogate paraffin sections with IHC staining.
Antibody information for lysosome, autophagy markers, and pancreatitis-associated proteins used in this study.
Note. ATG9a (ATG9-L1), autophagy-related 9 homolog, a homologue of yeast Atg9p; IP, immunoprecipitation; Beclin 1, a homologue of yeast Atg6; LAMP2, lysosome-associated membrane protein 2; LC3, microtubule-associated protein 1 light chain 3, a homologue of yeast Atg8, LC3-I in cytosol, LC3-II in membrane; Reg3, regenerating islet-derived protein 3, a subset of the calcium-dependent C-type lectin superfamily; VMP1, vacuole membrane protein 1, or TMEM49 (transmembrane protein 49); IHC, immunohistochemistry.
The present study was designed (1) to characterize histological and immunohistochemical changes to the pancreas in an acute pancreatitis model induced by caerulein, (2) to explore the role of autophagy in caerulein-induced pancreatitis, (3) to search for pancreatic biomarkers, and (4) to elucidate the mechanisms responsible for caerulein-induced pancreatitis. Although the relevance of the caerulein model to DIP is uncertain, it is believed to well present the initiation and downstream progression escalating pancreatic acinar cell injury to the level of acute clinical pancreatitis (Rattner 1996). Multiple supporting approaches (terminal deoxynucleotidyl transferase–mediated biotin-dNTP nick labeling [TUNEL] staining, acinar cell isolation/F-actin staining, Western blot, kinetic assays for serum amylase/lipase, and immunoprecipitation techniques) were employed to study cellular and molecular mechanisms underlying caerulein-induced autophagy or apoptosis, the protein colocalization seen in autophagosomes, and the interaction of proteins and processes during pancreatitis-induced autophagy.
Materials and Method
Animals
Male C57BL/6 mice 6 to 8 weeks of age were purchased from Harlan Laboratories (Fredrick, MD). Mice were housed individually in an environmentally controlled room (18°–21°C, 40–70% relative humidity) with a 12-hr light/dark cycle. Mice were fed Certified Purina Rodent Chow #5002 (Ralston Purina Co., St. Louis, MO) and water ad libitum. The experimental protocol was approved by the Institutional Animal Care and Use Committee, Center for Drug Evaluation and Research, FDA, and conducted in an AAALAC-accredited facility in accord with the Guide for the Care and Use of Laboratory Animals, 8th edition.
Experiments
Caerulein was obtained from American Peptide Company (Sunnyvale, CA) and dissolved in phosphate-buffered saline (PBS). Nonfasted male C57BL/6 mice approximately 8 to 10 weeks old received 7 intraperitoneal injections of 10 μg/kg or 50 μg/kg caerulein, or saline (9 mice/group) at hourly intervals. One hour after the final injection, each mouse was anesthetized with isoflurane and euthanized by exsanguination with blood retained for serum harvest. A gross examination of the abdominal and thoracic organs was conducted and the pancreas collected in formalin for histopathology evaluation, TUNEL, and immunohistochemical staining, or for Western blot/immunoprecipitation analysis.
Histopathology and Tunel
Tissue sections were fixed in 10% neutral phosphate-buffered formalin, embedded in paraffin, sectioned at a thickness of 5 μm, and stained with hematoxylin–eosin (H&E). TUNEL detection of apoptotic cells was performed in formalin-fixed, paraffin-embedded, pancreatic tissue sections as recommended using the In situ Apoptosis Detection Kit (Trevigen, Gaithersburg, MD) followed by Red Counter stain C (Trevigen). Sections were then scanned using a ScanScope digital scanner (Aperio, Vista, CA) monitored in Image Scope viewer. The images were downloaded into Visiomorph (Visiopharm, Denmark) image analysis software followed by count of the TUNEL-positive nuclei normalized to the total area of the pancreatic sections.
Amylase and Lipase Measurement
Serum amylase was quantified using QuantiChrom™ α-Amylase Assay Kit (BioAssay systems, Hayward, CA). Serum lipase was quantified using QuantiChrom™ Lipase Assay Kit. Total protein was quantified by BCA Protein Assay Reagent (Thermo Scientific, Rockford, IL).
Acinar Cell Isolation, Caerulein Incubation, and F-Actin Staining
Pancreatic tissue was collected from two naïve mice, injected with Kreb-Ringer buffer (KRB) containing purified collagenase (CLSPA grade, Worthington, Lakewood, NJ) followed by mechanical shaking for 30 min. The pancreatic acinar cells were purified with 4% bovine serum albumin in KRB and preincubated in oxygen for 1 hr at 37°C. The isolated acinar cells were distributed into 6-well plates and treated with 100 nM of caerulein or saline at 37°C. After 1-hr treatment, cells were washed and fixed using 4% paraformaldehyde in PBS. Cells were permeabilized with 0.1% Triton X-100 and blocked with 5% normal donkey serum. Cells were stained with fluorescein–phalloidin (Invitrogen, Grand Island, NY) and visualized in an Olympus FV10-MCPSU confocal microscope using an 40× oil immersion objective. 4′,6-Diamidino-2-phenylindole (DAPI) at 400nM was used for nuclei staining.
Immunohistochemical Studies
Indirect immunoperoxidase procedures were performed using both manual and automated techniques. Serial 4-µm thick sections were taken from the paraffin-embedded pancreas of each mouse. Sections were mounted on gelatin-coated or SuperFrost*Plus slides. The details of the tissue section preparation, microwave pretreatment, and incubation procedures for manual staining have been previously described (Zhang et al. 2009). Briefly, sections underwent microwave antigen retrieval in a pressure cooker with Citra antigen retrieval solution (pH 6.0; BioGenex, San Ramon, CA). After microwave treatment, slides were cooled and incubated in methanol containing 0.3% H2O2 for 30 min, followed by 10% normal serum for 1 hr. The slides were incubated with the primary antibodies overnight at 4°C at the specified dilutions (Table 1). Subsequently, sections were incubated with a biotinylated secondary antibody (Vector Laboratories, Burlingame, CA) for 1 hr and then incubated with avidin-biotinylated horseradish peroxidase complex (Vector) for 30 min. The peroxidase reaction was carried out with 0.05% 3′3′-diaminobenzidine for 10 min. Finally, slides were counterstained with hematoxylin. For all antibodies, a positive reaction was indicated by a brown color. Autostaining was performed on the Discovery XT Autostainer (Ventana Medical System Inc., Tuscon, AZ) using the Ventana DAB MAP™ kit and procedures similar to those described above with antibodies and dilutions as described in Table 1. Negative controls were run with each set of slides during the staining process except for sheep anti-Reg3β for which nonimmune serum was not available at the time of primary staining. Primary antibodies were replaced with normal nonimmune serum (mouse, rabbit, or goat) at the same concentration and from the same species in which the primary antibody was produced.
Immunofluorescence Staining of Pancreas
Pancreatic sections were hydrated, microwaved in Citra antigen retrieval solution, incubated with methanol, and blocked with 10% normal donkey serum. The tissues were treated with primary antibodies for 1 hr, followed by DAPI and Alexa Fluor secondary antibodies for another 30 min. Images were captured with an Olympus FV10-MCPSU confocal microscope using a 40× oil immersion objective.
Immunoprecipitation and Western Blot
Pancreas collected from mice was frozen in liquid nitrogen. Radioimmunoprecipitation assay (RIPA) buffer containing 150 mM NaCl, 50 mM Tris-HCl pH 7.5, 0.5% sodium deoxycholate, 0.1% sodium dodecyl sulfate (SDS), and 1% Triton X-100 with protease inhibitors was used to extract total protein. The lysates were either loaded in a sodium dodecyl sulfate polyacrylamide gel electrophoresis (SDS-PAGE) gel for Western blot analysis, or incubated with LC3 primary antibody (Sigma-Aldrich, St. Louis, MO) for 2 hr, followed by addition of proteinA/G Plus-Agarose beads (Santa Cruz Biotechnology, Santa Cruz, CA) for overnight incubation. The beads were then washed with RIPA 5 times and boiled with sample loading buffer. The samples were loaded in 4 to 12% SDS-PAGE gel followed by Western blot detection.
Statistics
Data are expressed as M ± SE. Statistical analyses were performed using TUKEY’s Honestly Significant Difference (HSD) test and Student’s t-test. Multiple comparisons among different treatments were conducted within each dose group using the student’s t-test at p < .05.
Results
General Observations
No mortality was observed during the course of this acute study. By the seventh caerulein dose, high-dose animals were very lethargic with mild lethargy in the low-dose mice. No gross changes were noted in nonpancreatic abdominal organs at either dose. Although gross pancreatic changes were not identified in low-dose mice, the pancreas became grossly inflamed and edematous in high-dose mice. Pancreatic weights were not recorded therefore no comment can be provided about changes in this parameter.
Acinar Cell Pathology, TUNEL Staining, and Amylase and Lipase Levels
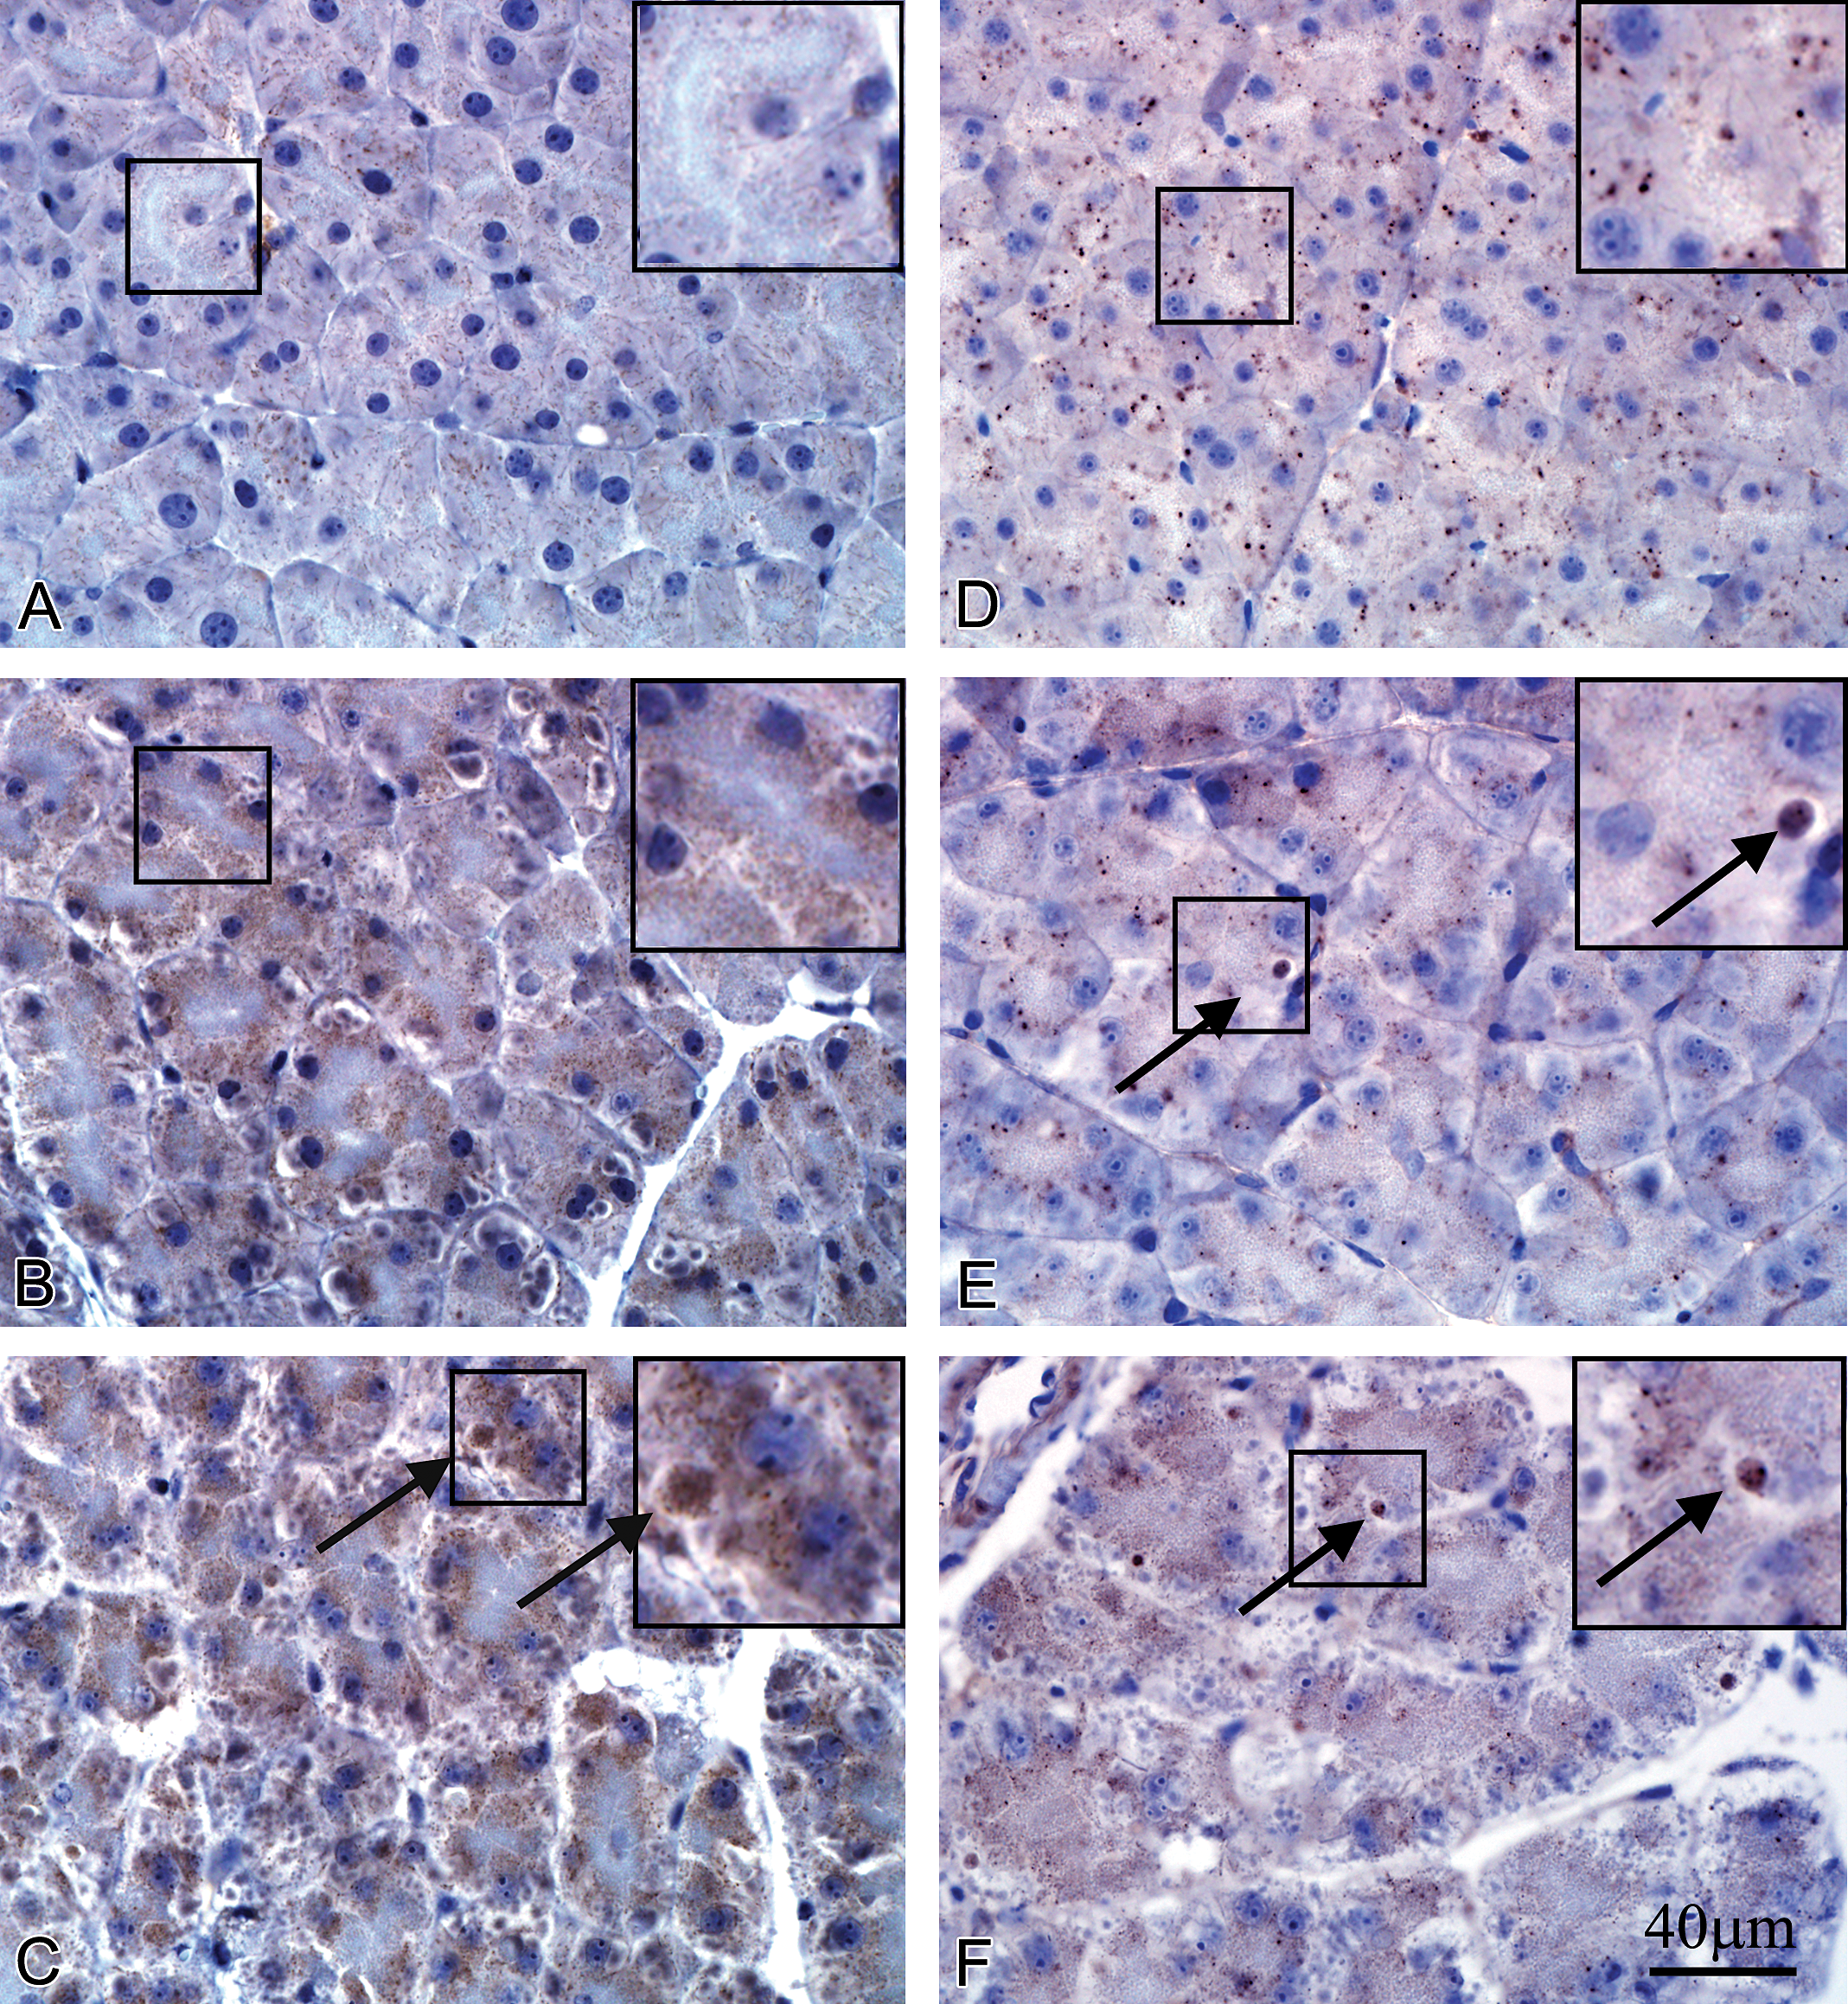
Figure 1 presents light photomicrographs of pancreatic tissue from control and caerulein-treated mice using H&E and TUNEL stains. By light microscopy, the pancreatic acini of saline control mice consisted of wedge-shaped cells arranged in grape-like clusters with basally located nuclei and cytoplasm rich with acidophilic zymogen granules (ZGs). Apoptosis was identified by TUNEL stain, which demonstrated double-stranded DNA fragmentation in the nucleus, while necrosis was characterized by nuclear swelling and rupture of the nuclear membrane. No cytoplasmic vacuoles, necrosis (Figure 1A), or apoptosis (Figure 1B) were observed in controls. In mice treated with 10 μg/kg caerulein, acinar cell apoptosis was frequently detected with infrequent acinar cell necrosis. H&E-stained sections from 10 μg/kg caerulein-treated mice showed early apoptotic cells distinguished by nuclear and cytoplasmic condensation, cell shrinkage, and a halo surrounding affected cells. Basophilic cytoplasmic condensation consistent with apoptosis and small round basophilic bodies indicative of ALs, as described in previous studies, were observed (Figure 1C). Apoptosis was confirmed by TUNEL staining (Figure 1D). In mice treated with 50 μg/kg caerulein, apoptotic bodies (Figure 1E) and TUNEL-stained nuclei (Figure 1F) were more frequently observed. In addition, fewer intact acinar cells were discernible. Collectively, the basophilic area of acinar cells appeared greatly diminished, while the volume of eosinophilic zymogen containing area appeared greatly increased. Variable sized cytoplasmic vacuoles consistent with autophagosomes were present as were autolysosomes (Figure 1E).
Light micrographs showing acinar cell pathology by H&E staining and apoptosis by TUNEL staining in mice treated with saline (control) and caerulein. (A and B) Control; no autophagic vacuoles were observed by H&E (A) and no apoptotic nuclei via TUNEL (B). (C and D) Caerulein 10 μg/kg; H&E staining (C) revealed apoptotic cells (black arrows) characterized by condensation of the nucleus and cytoplasm with a halo around the cell, apoptotic bodies (white arrow), and autolysosomes (white arrowhead); TUNEL stain (D) identified apoptotic nuclei indicated by dark blue staining. (E & F) Caerulein, 50 μg/kg; apoptotic bodies (black arrows), autophagic vacuoles (white arrow), and numerous autolysosomes (white arrowhead) observed in H&E stained section (E); and TUNEL stain (F) detected apoptotic nuclei. Scale bar = 40 μm applies to all panels. H&E = hematoxylin–eosin; TUNEL = terminal deoxynucleotidyl transferase–mediated biotin-dNTP nick labeling.
Figure 2 demonstrates dose-dependent differences in apoptotic cells and serum levels of amylase and lipase in caerulein-treated mice. The number of apoptotic cells (Figure 2A) and the serum levels of amylase (Figure 2B) and lipase (Figure 2C) significantly increased in caerulein-treated mice compared with those in saline-treated mice (Figure 2A). Overall, no significant changes were found in the total serum protein (Figure 2D).
Apoptosis quantification and kinetic assays for serum amylase, lipase, and proteins in vitro. (A) Quantification of apoptotic cells in the pancreatic tissue section. Individual apoptotic nuclei were stained dark blue with TUNEL stain. The total number of TUNEL-positive nuclei was normalized to the total area of each tissue section. The results of the cell count are presented as actual numbers of cells per square centimeters of tissue section. (B–D) The serum levels of amylase and lipase, but not proteins, in treated groups significantly increased compared with those in control groups. M ± SE are the average of samples within the same dose group (p < .05, Tukey’s HSD test). Histogram with * denote mean values that are statistically different at p < .05 compared to control and # denotes a difference between low dose and high dose. TUNEL = terminal deoxynucleotidyl transferase–mediated digoxigenin-dNTP nick labeling; HSD = Honestly Significant Difference.
Caerulein Treatment In Vitro and F-actin Staining
Caerulein-induced changes in the cellular cytoskeleton were visualized in vitro in acinar cells treated with caerulein at 100 nM for 1 hr and subsequently fixed and stained with fluorescent phalloidin. In control wells, differential interference contrast (DIC) microscopy showed intact acini with discernible individual acinar cells (Figure 3A), whereas caerulein-treated acini were less well-defined with remarkable expansion of the zymogen area within cytoplasm and less distinct borders between individual acinar cells (Figure 3B). Cells were dual labeled for nuclei (DAPI, blue) and F-actin (fluorescein–phalloidin, green). DAPI staining revealed normal nuclei in control cells (Figure 3C and E), but increased numbers of condensed apoptotic nuclei in caerulein-treated cells (Figure 3D and F). Enlarged nuclei that may be associated with cell injury were also observed in the caerulein-treated cells (Figure 3D). In control cells, F-actin appears as a thin continuous line along the basolateral membranes of acinar cells, while intense actin labeling corresponds to acinar lumena surrounded by the apical plasma membrane (Figure 3C and E). In contrast, caerulein-treated cells displayed reduction or absence of F-actin staining on the basolateral membranes and disrupted apical staining at the intercellular space (Figure 3D and F).
DIC (Normarski) imaging (A and B) and double fluorescent F-actin and DAPI labeling (C–F) of acinar cells untreated or dosed with 100 nM caerulein. (A) Appearance of zymogen granules in untreated acinar cells. (B) Caerulein-induced increase of zymogen granules. (C and E) Normal nuclei and F-actin staining along membrane and intercellular canaliculi in untreated acinar cells; E is enlarged view from within the white square in C. (D and F) Apoptotic nuclei (red square insert, white arrow) and altered F-actin staining in caerulein-treated acinar cells; F is enlarged view from within the white square in D and shows irregular distribution of F-actin. DIC = differential interference contrast; DAPI = 4′,6-Diamidino-2-phenylindole.
Acinar Cell Immunohistochemistry (IHC)
The major IHC findings for all pancreatic acinar cell markers are depicted in Figures 4 through 7. Immunolocalization of each marker is described in detail below.
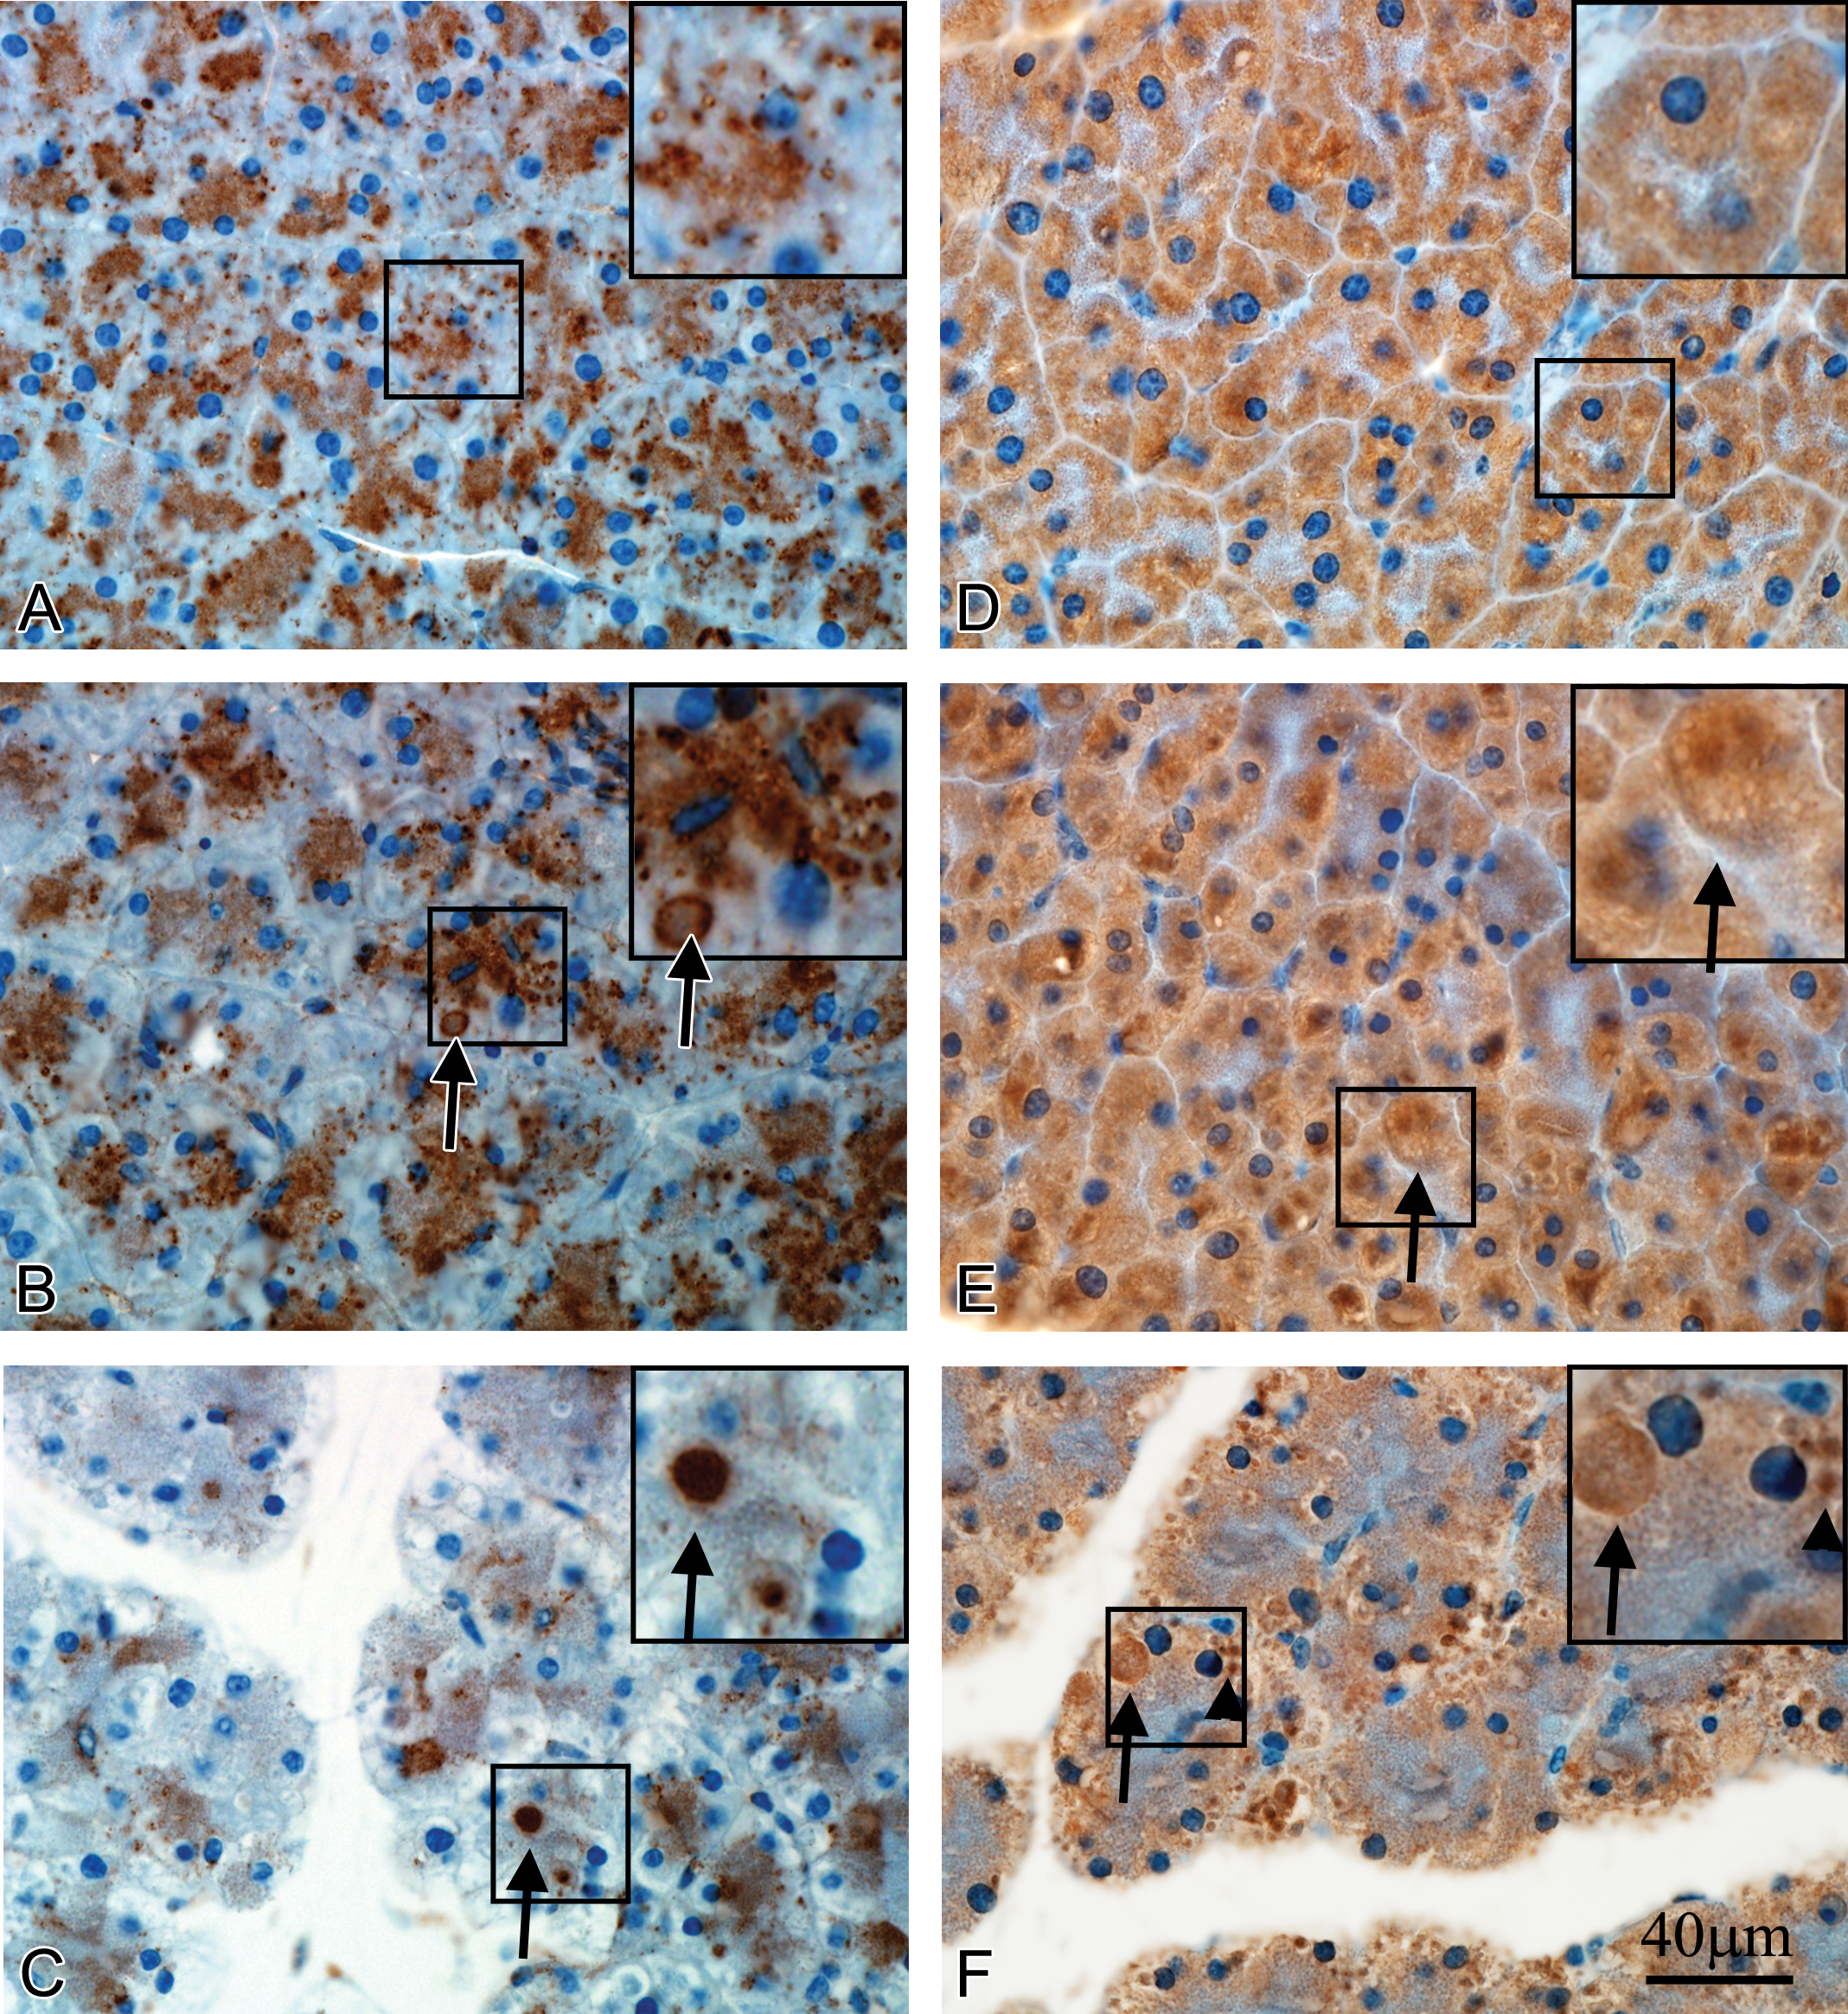
Immunolocalization of Cathepsin B and Cathepsin D in control and caerulein-treated mice. Cathepsin B: (A) Control; weak, discrete fine punctate staining in the nonzymogen (non-ZG) cytoplasm of acinar cells. (B) Caerulein 10 μg/kg; increased staining intensity and coarse instead of fine punctate staining in the cytoplasm (inset). (C) Caerulein 50 μg/kg; similar to low-dose changes accompanied by occasional positive-stained autophagosomes (black arrow). Cathepsin D: (D) Control; sparse coarse punctate staining in the nonzymogen cytoplasm of acinar cells. (E) Caerulein 10 μg/kg; decreased coarse punctate staining with appearance of positive-stained autophagosomes (black arrow). (F) Caerulein 50 μg/kg; more diffuse staining and loss of punctate pattern, with positively stained autophagosomes (black arrow). Scale bar = 40 μm applies to all panels. ZG = zymogen granule.
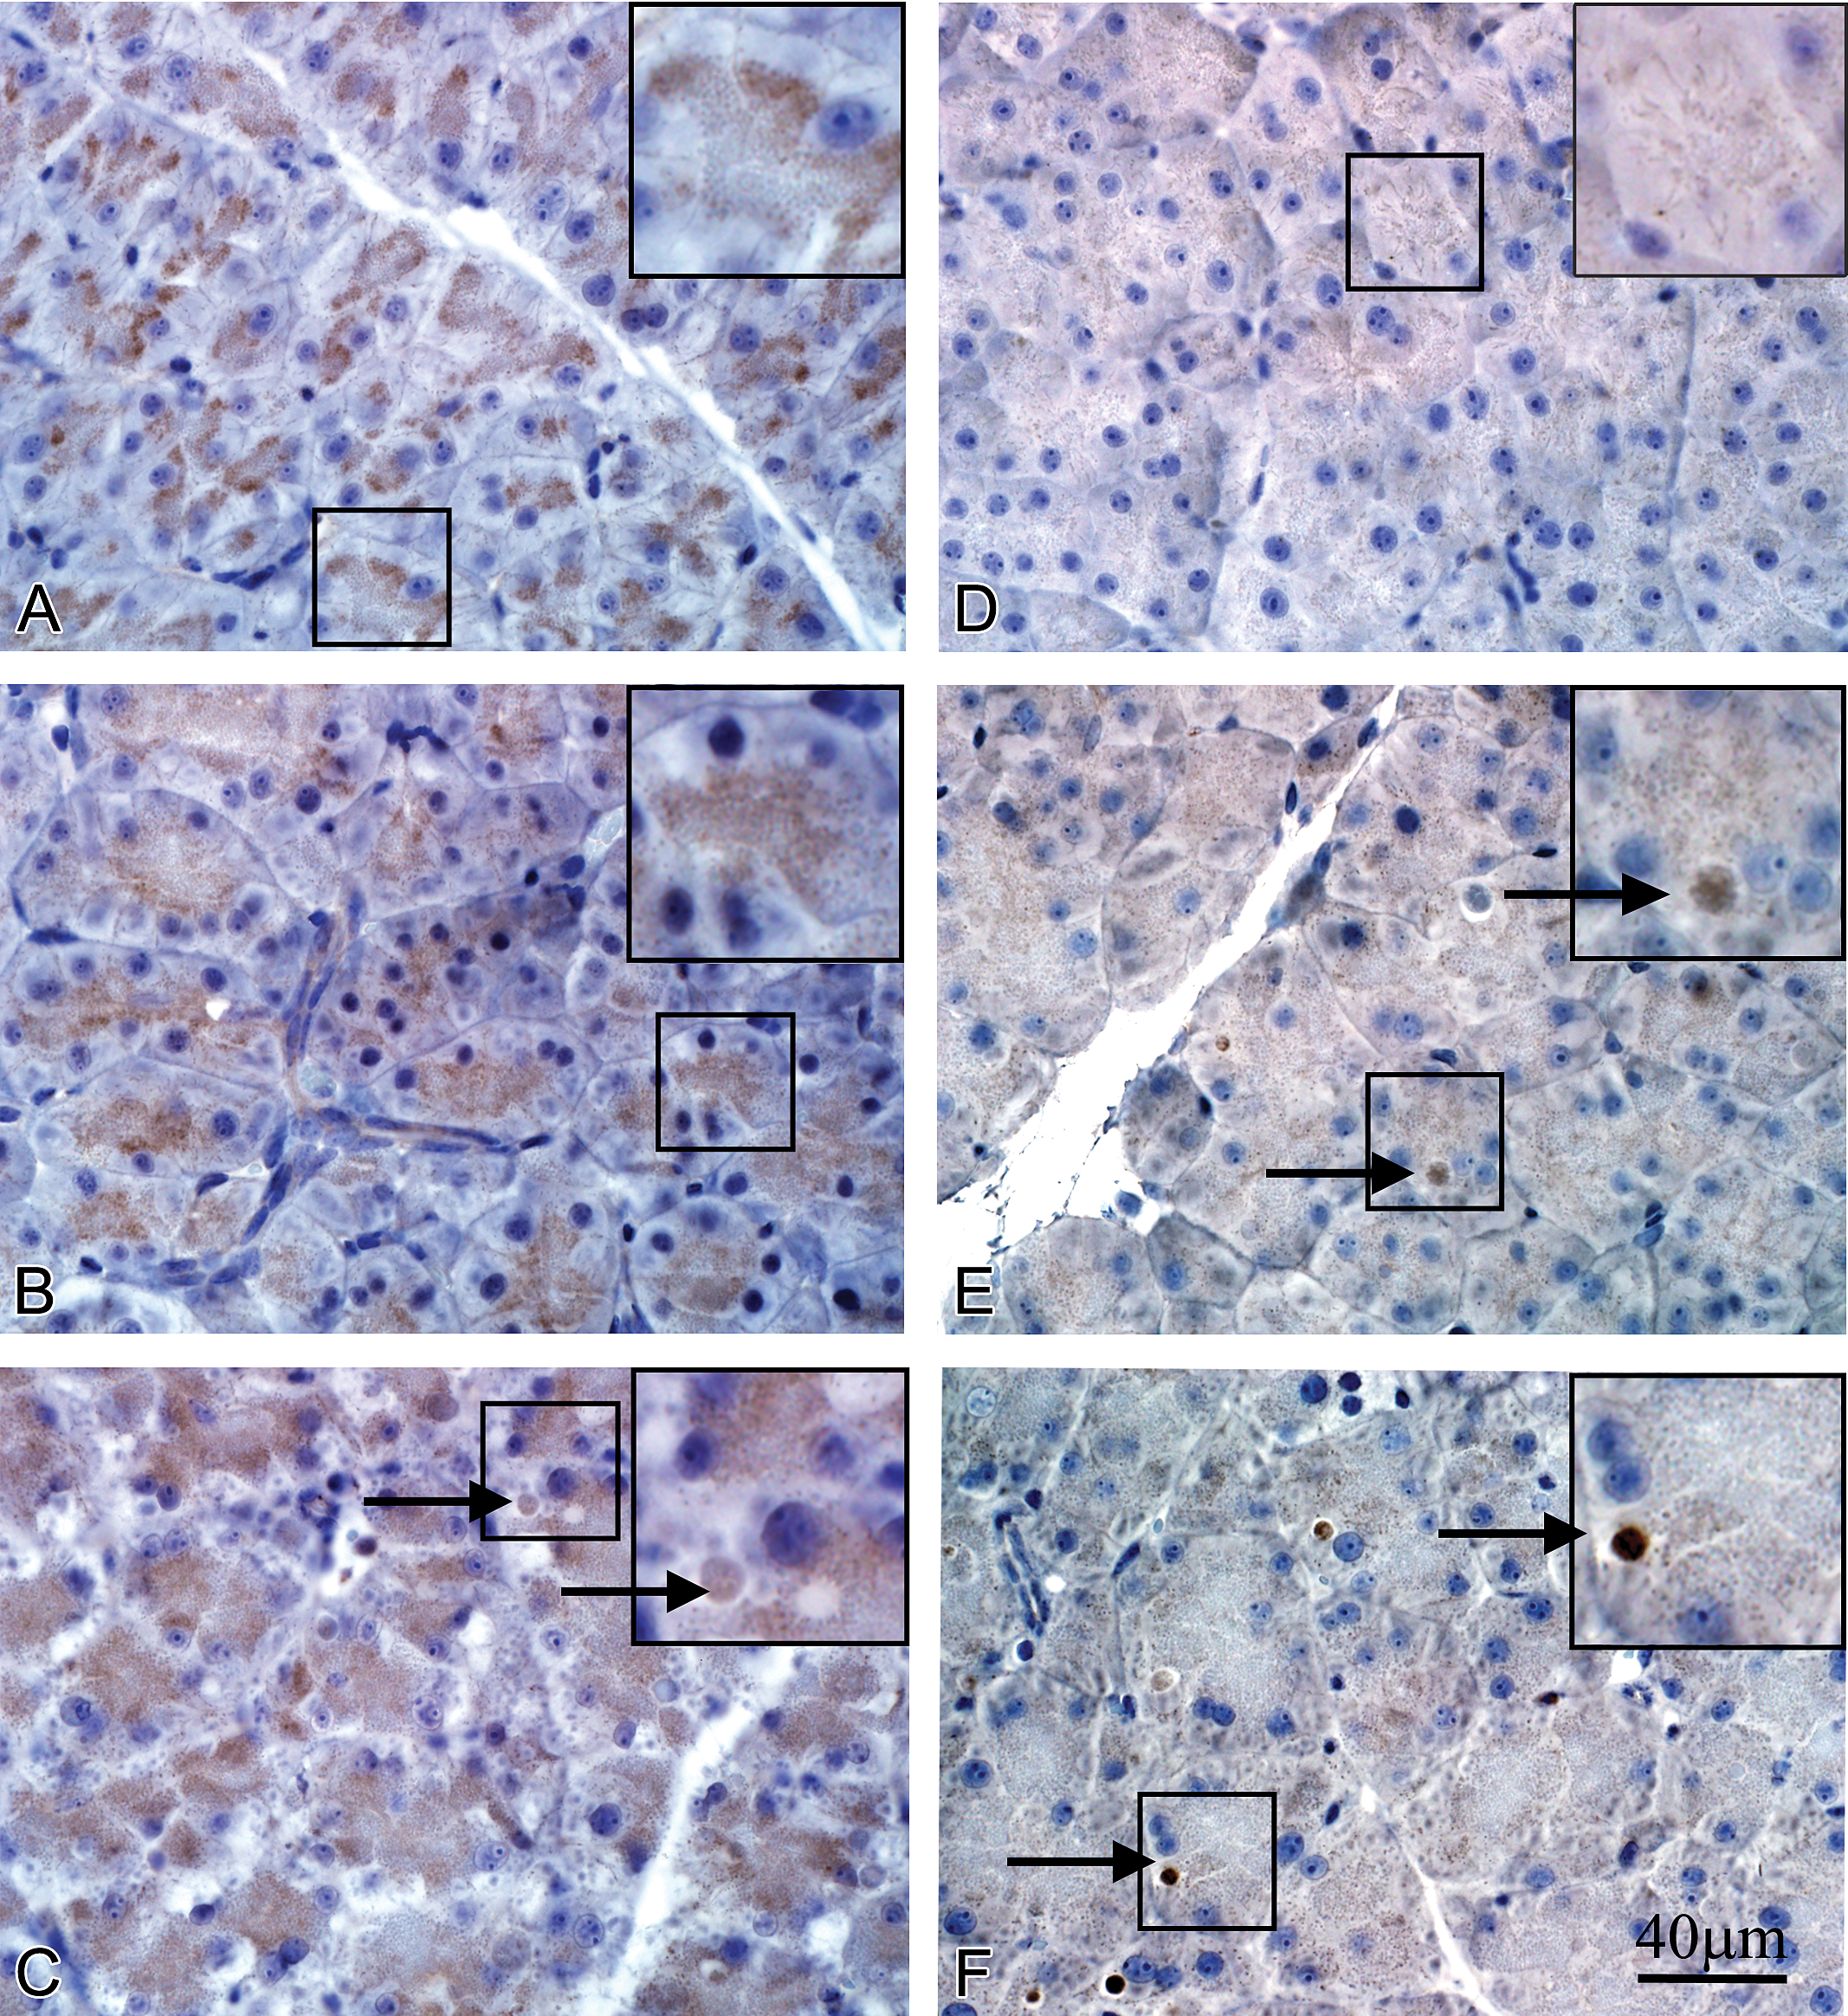
Immunolocalization of LAMP2, VMP1, and LC3 in control and caerulein-treated mice. LAMP2: (A) Control; constitutive expression as a mixture of diffuse background staining with sporadic intense punctate staining in zymogen granular zones of acinar cells (inset). (B) Caerulein 10 μg/kg; condensed (less diffuse) but more intense staining with positive autophagosomes (black arrow). (C) Caerulein 50 μg/kg; decreased staining distribution and intensity but increased positively stained autophagosomes (black arrow). VMP1: (D) Control; diffuse background staining in the cytoplasm of control acinar cells. (E) Caerulein 10 μg/kg; slightly increased general cytoplasmic staining with some focal areas of more intense staining suggestive of maturing autophagosomes (black arrow). (F) Caerulein 50 μg/kg; decreased diffuse cytoplasmic staining with many positive-stained autophagosomes (black arrow) and a cluster of small-sized autolysosomes (black arrowhead). LC3: (G) very weak expression observed in the zymogen area of control acinar cells. (H) Caerulein 10 μg/kg; appearance of coarse punctate staining. (I) Caerulein 50 μg/kg; decreased diffuse and punctate staining but with many positive-stained autophagosomes (black arrow). Scale bar = 40 μm applies to all panels. LAMP2 = lysosome-associated membrane protein 2; VMP1 = vacuole membrane protein 1; LC3 = microtubule-associated protein 1, light chain 3.
Immunolocalization of ATG9a, ATG9b, and Beclin1 in control and caerulein-treated mice. ATG9a: (A) Control; weak diffuse staining in zymogen granular zones of acinar cells. (B) Caerulein 10 μg/kg; apical shift of diffuse staining of similar or slightly increased intensity relative to controls. (C) Caerulein 50 μg/kg; increased intensity of diffuse staining in zymogen granular zones with positively stained autophagosomes (black arrow) compared to controls. ATG9b: (D) Control; very faint cytoplasmic staining, some in filament alignment in acinar cells. (E) Caerulein 10 μg/kg and (F) Caerulein 50 μg/kg; minimal change in diffuse staining with observation of a few positive staining autophososomes (black arrow). Beclin1: (G) Control; diffuse staining in the nonzymogen cytoplasm of acinar cells. (H) Caerulein 10 μg/kg; decreased cytoplasmic staining with some perinuclear concentration. (I) Caerulein 50 μg/kg; decreased diffuse staining with numerous positive-stained autophagosomes (black arrow) and autolysosomes (black arrowhead). Scale bar = 40 μm applies to all panels. ATG = autophagy-related protein.
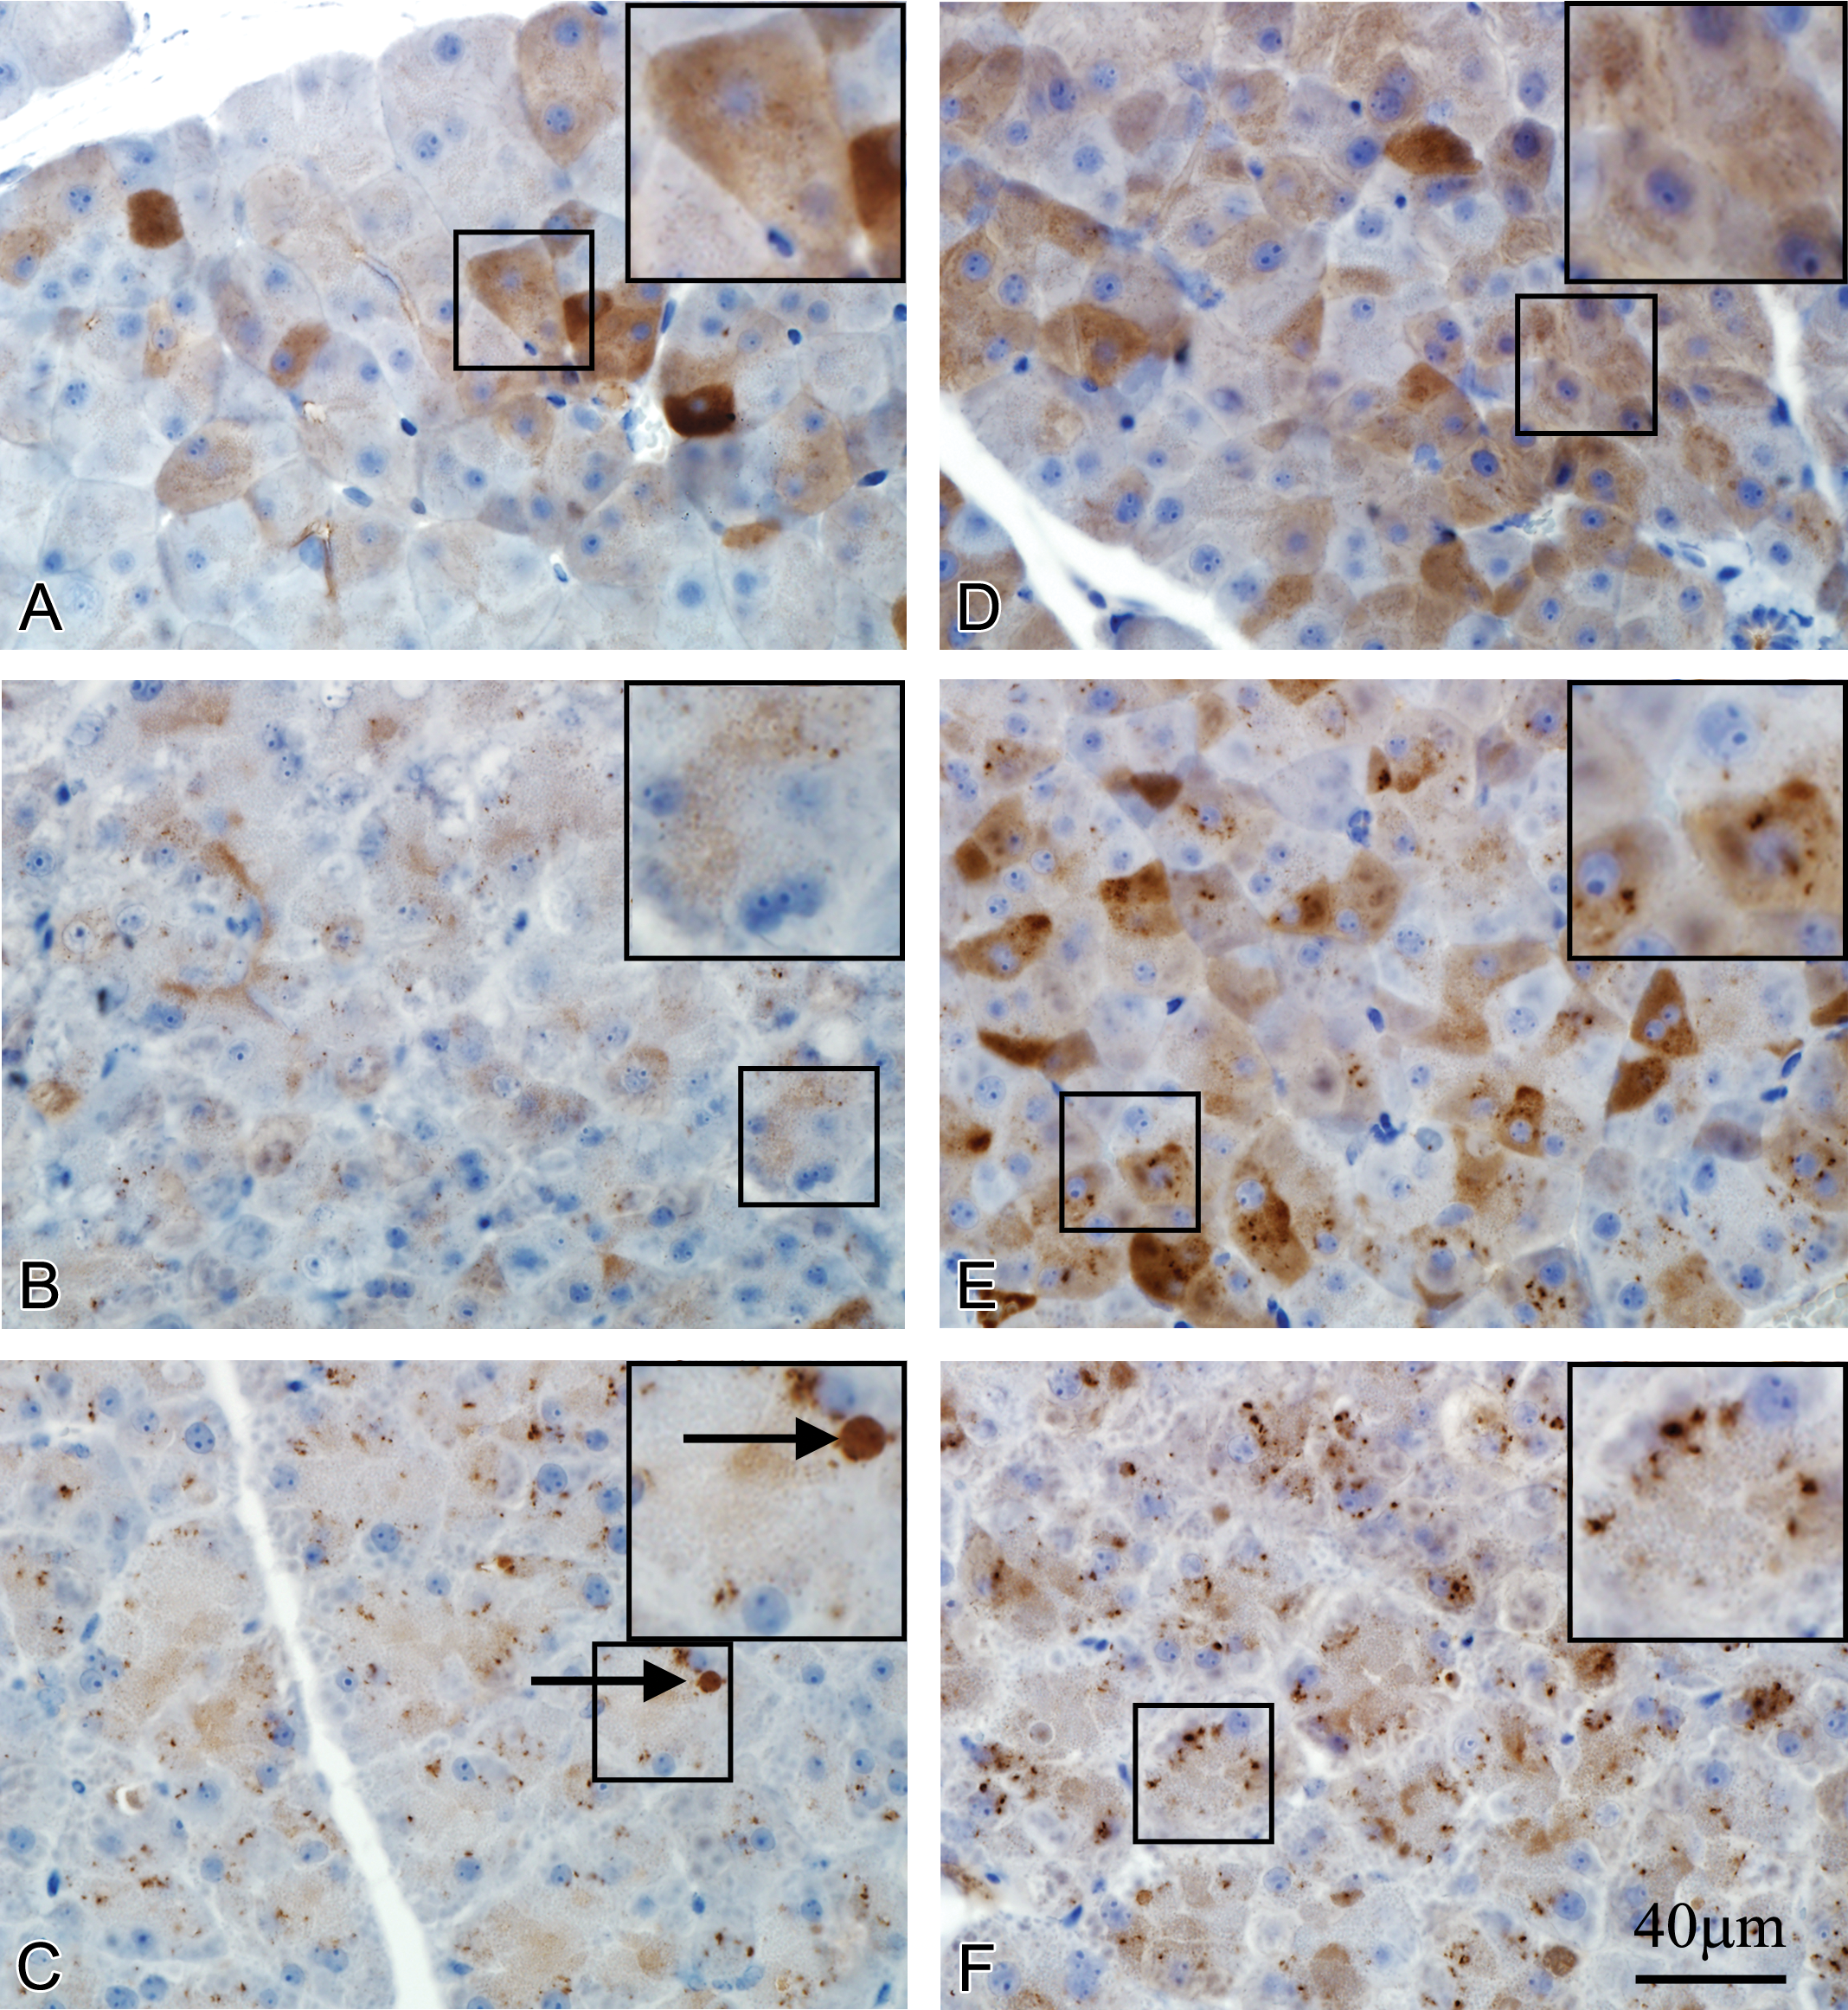
Immunolocalization of Reg3α, Reg3β, and Reg3γ in control and caerulein-treated mice. Reg3α: (A) Control; very heterogeneous cytoplasmic staining in acinar cells. (B) Caerulein 10 μg/kg; less intense cytoplasmic staining. (C) Caerulein 50 μg/kg; diminished diffuse staining with increased fine punctate staining and positive staining autophagosomes (black arrow). Reg3β: (D) Control; very heterogeneous cytoplasmic staining in acinar cells. (E) Caerulein 10 μg/kg; increased staining intensity in heterogeneous pattern. (F) Caerulein 50 μg/kg; decreased diffuse cytoplasmic staining with increased fine punctate staining in the nonzymogen zone. Reg3γ: (G) Control; weak staining concentrated in the apex of acinar cells. (H) Caerulein 10 μg/kg; increased, more intense diffuse staining with positively stained autophagososomes (black arrow). (I) Caerulein 50 μg/kg; further increase in diffuse staining with numerous positively stained autophagosomes (black arrow). Scale bar = 40 μm applies to all panels. Reg3 = regenerating islet–derived 3.
Immunolocalization of Cathepsin B and Cathepsin D
Figure 4 presents light photomicrographs of pancreatic sections stained with cathepsin B (CatB) and cathepsin D (CatD) antibodies in control and caerulein-treated mice. Weak immunoreactivity of CatB was observed in saline-treated mice as discrete fine punctate staining in the abluminal portion of the acinar cell cytoplasm, which is normally devoid of zymogen granules (non-ZG; Figure 4A). In mice treated with caerulein at 10 μg/kg, there was an increase in staining distribution and intensity, still in the non-ZG area and CatB positively stained autophagosomes and ALs observed in acinar cells (Figure 4B). Mice treated with caerulein at 50 μg/kg exhibited a further increase in staining, generally, and in both small-sized ALs and large-sized autophagosomes (Figure 4C). Immunostaining for CatD revealed sparse intense coarse punctate staining in the non-ZG cytoplasm of acinar cells in control mice (Figure 4D). In 10-μg/kg caerulein-treated mice, CatD positively stained autophagosomes were observed occasionally, although the distribution of intense punctate staining of acinar cells was decreased (Figure 4E). In mice treated with 50 μg/kg caerulein, autophagosomes were also positively staining with CatD, but ALs were both faintly positive and negative (blue color), without clear punctate staining within cytoplasm of acinar cells (Figure 4F).
Immunolocalization of Lysosome-associated Membrane Protein 2 (LAMP2) Vacuole Membrane Protein 1 (VMP1), and Microtubule-associated Protein 1 Light Chain 3 (LC3I)
Figure 5 presents light photomicrographs of pancreatic sections stained with LAMP2, LC3, and VMP1 antibodies in control and caerulein-treated mice. LAMP2 staining of acinar cells in saline-treated mice exhibited positive staining in the apical cytoplasm containing the ZGs, in which diffusely distributed background staining was intermingled with sporadic intensively stained particles (Figure 5A). This staining pattern appeared less diffuse and more intense in the 10-μg/kg caerulein treatment group (Figure 5B) although a clear change in expression could not be determined. In the 50-μg/kg caerulein treatment group, LAMP2 staining was diminished in the acinar cell cytoplasm and mostly condensed into autophagosomes (Figure 5C). Immunostaining for VMP1 showed a diffuse and relatively homogeneous background staining in the cytoplasm of acinar cells from control mice, which was somewhat more intense toward the basal membrane (Figure 5D). Given the constitutive expression of VMP1 in the ER, this could be either positive staining or nonspecific background uptake. In the 10-μg/kg caerulein treatment group, the immunoreactivity of VMP1 was slightly more intense and less homogeneous within the acinar cell cytoplasm and positively staining autophagosomes were observed (Figure 5E). In the 50-μg/kg caerulein treatment group, VMP1 immunoreactivity was decreased in the cytoplasm but increased in both autophagosomes and ALs (Figure 5F). In acinar cells of control animals, there was little or no LC3 staining (Figure 5G). In the 10-μg/kg caerulein treatment group, increased LC3-positive staining in acinar cells appeared as discrete punctate cytoplasmic staining (Figure 5H). In the 50-μg/kg caerulein treatment group, LC3-positive cytoplasmic staining was mostly restricted to autophagosomes (Figure 5I).
Immunolocalization of Autophagy-related Protein 9a (ATG9a), Autophagy-related Protein 9a (ATG9b), and Beclin1
Figure 6 presents light photomicrographs of pancreatic sections stained with ATG9a, ATG9b, and Beclin1 antibodies in control and caerulein-treated mice. In control mice, acinar cell staining with ATG9a was weakly positive in the cytoplasm and mostly concentrated in the central portion of the cell (Figure 6A). In the 10-μg/kg caerulein treatment group, there was no obvious change in staining intensity in acinar cells although staining was located more in the apical cytoplasm (Figure 6B). In the 50-μg/kg caerulein treatment group, acinar cell staining was more diffuse in the cytoplasm similar to control but a number of ATG9a-positive autophagosomes were readily observed (Figure 6C). In contrast to ATG9a, ATG9b acinar cell staining in control mice was almost negative (Figure 6D). Neither the 10-μg/kg nor the 50-μg/kg caerulein treatment groups had an apparent increase in ATG9b immunoreactivity of acinar cell cytoplasm except for a few positively stained autophagosomes (Figure 6E and F). The anti-Beclin1 antibody diffusely stained the nonzymogen cytoplasm of acinar cells in the control group (Figure 6G), which may represent either positive Beclin1 staining in the ER or nonspecific background uptake. In the 10-μg/kg caerulein treatment group, acinar cell staining concentrated in the central areas of acinar cells but overall staining intensity was slightly decreased (Figure 6H). In the 50-μg/kg group, Beclin1 staining appeared as diminished diffuse staining and condensed staining of both large-sized autophagosomes and small-sized ALs (Figure 6I).
Immunolocalization of Pancreatitis-associated Proteins (PAP), Regenerating Islet–derived 3 Protein Alpha (Reg3α, Regenerating Islet–derived 3 Protein Beta (Reg3β, Regenerating Islet–derived 3 Protein Gamma (Reg3γ)
Figure 7 presents light photomicrographs of pancreatic sections stained with Reg3α, Reg3β, and Reg3γ antibodies in control and caerulein-treated mice. The staining patterns of anti-Reg3α and Reg3β antibodies in acinar cells were comparable in control mice. Immunoreactivity of Reg3α and Reg3β was diffusely and unevenly expressed throughout the cytoplasm varying greatly in staining intensity from cell to cell (Figure 7A and D). In the 10-μg/kg caerulein treatment groups, staining for Reg3α was less intense (Figure 7B), while staining intensity for Reg3β was little changed (Figure 7E). The pattern of Reg3β staining changed with the appearance of fine punctate staining against the diffuse background and a slight increase in intensity. In the 50-μg/kg caerulein treatment groups, Reg3α and Reg3β diffuse cytoplasmic staining was greatly reduced but accompanied by an increase in coarse punctate staining (Figure 7C and F) with strong Reg3α staining of autophagosomes (Figure 7C). The staining pattern of Reg3γ differed remarkably from those of Reg3α and Reg3β. The distribution of Reg3γ immunoreactivity in the acinar cells of control mice was restricted to the apical cytoplasm and was minimal (Figure 7G). In the 10-μg/kg caerulein treatment group, there was an increase in Reg3γ staining with positively stained autophagosomes (Figure 7H). In the 50-μg/kg caerulein treatment group, staining for Reg3γ was further enhanced throughout the cytoplasm and within autophagosomes (Figure 7I).
Colocalization of LC3 and Reg3γ
Figure 8 presents light photomicrographs of serial pancreatic sections stained with LC3 (Alexa Fluo® 488, green; Figure 8A and D) or Reg3γ (Alexa Fluo® 555, red; Figure 8B and E) antibodies in control and caerulein-treated mice. IHC for the three types of Reg3 antibodies showed that Reg3γ positive autophagosomes were significantly more common than Reg3α positive autophagosomes. Thus, colocalization efforts were focused on Reg3γ colocalization with LC3 in control and caerulein-treated mice. Photomicrographs (Figure 8A, B, and C) demonstrate LC3 (8A) and Reg3γ (8B) fluorescent staining and colocalization of these two proteins (8C) in control mice. Photomicrographs (Figure 8D, E, and F) demonstrate LC3 (8D) and Reg3γ (8E) fluorescent staining and colocalization of these two proteins (8F) in mice treated with caerulein at 50 μg/kg. Autophagosomes can only be identified in the caerulein-treated mouse and are positively stained for LC3 and Reg3γ (Figure 8D and E). Colocalization of LC3 and Reg3γ in autophagosomes (Figure 8F) is evident in the pancreas of caerulein-treated mice, but no localization is seen in the pancreas of a control mouse (Figure 8C). Although, Reg3α positive staining autophagosomes were detected, colocalization with LC3 was not observed (data not shown).
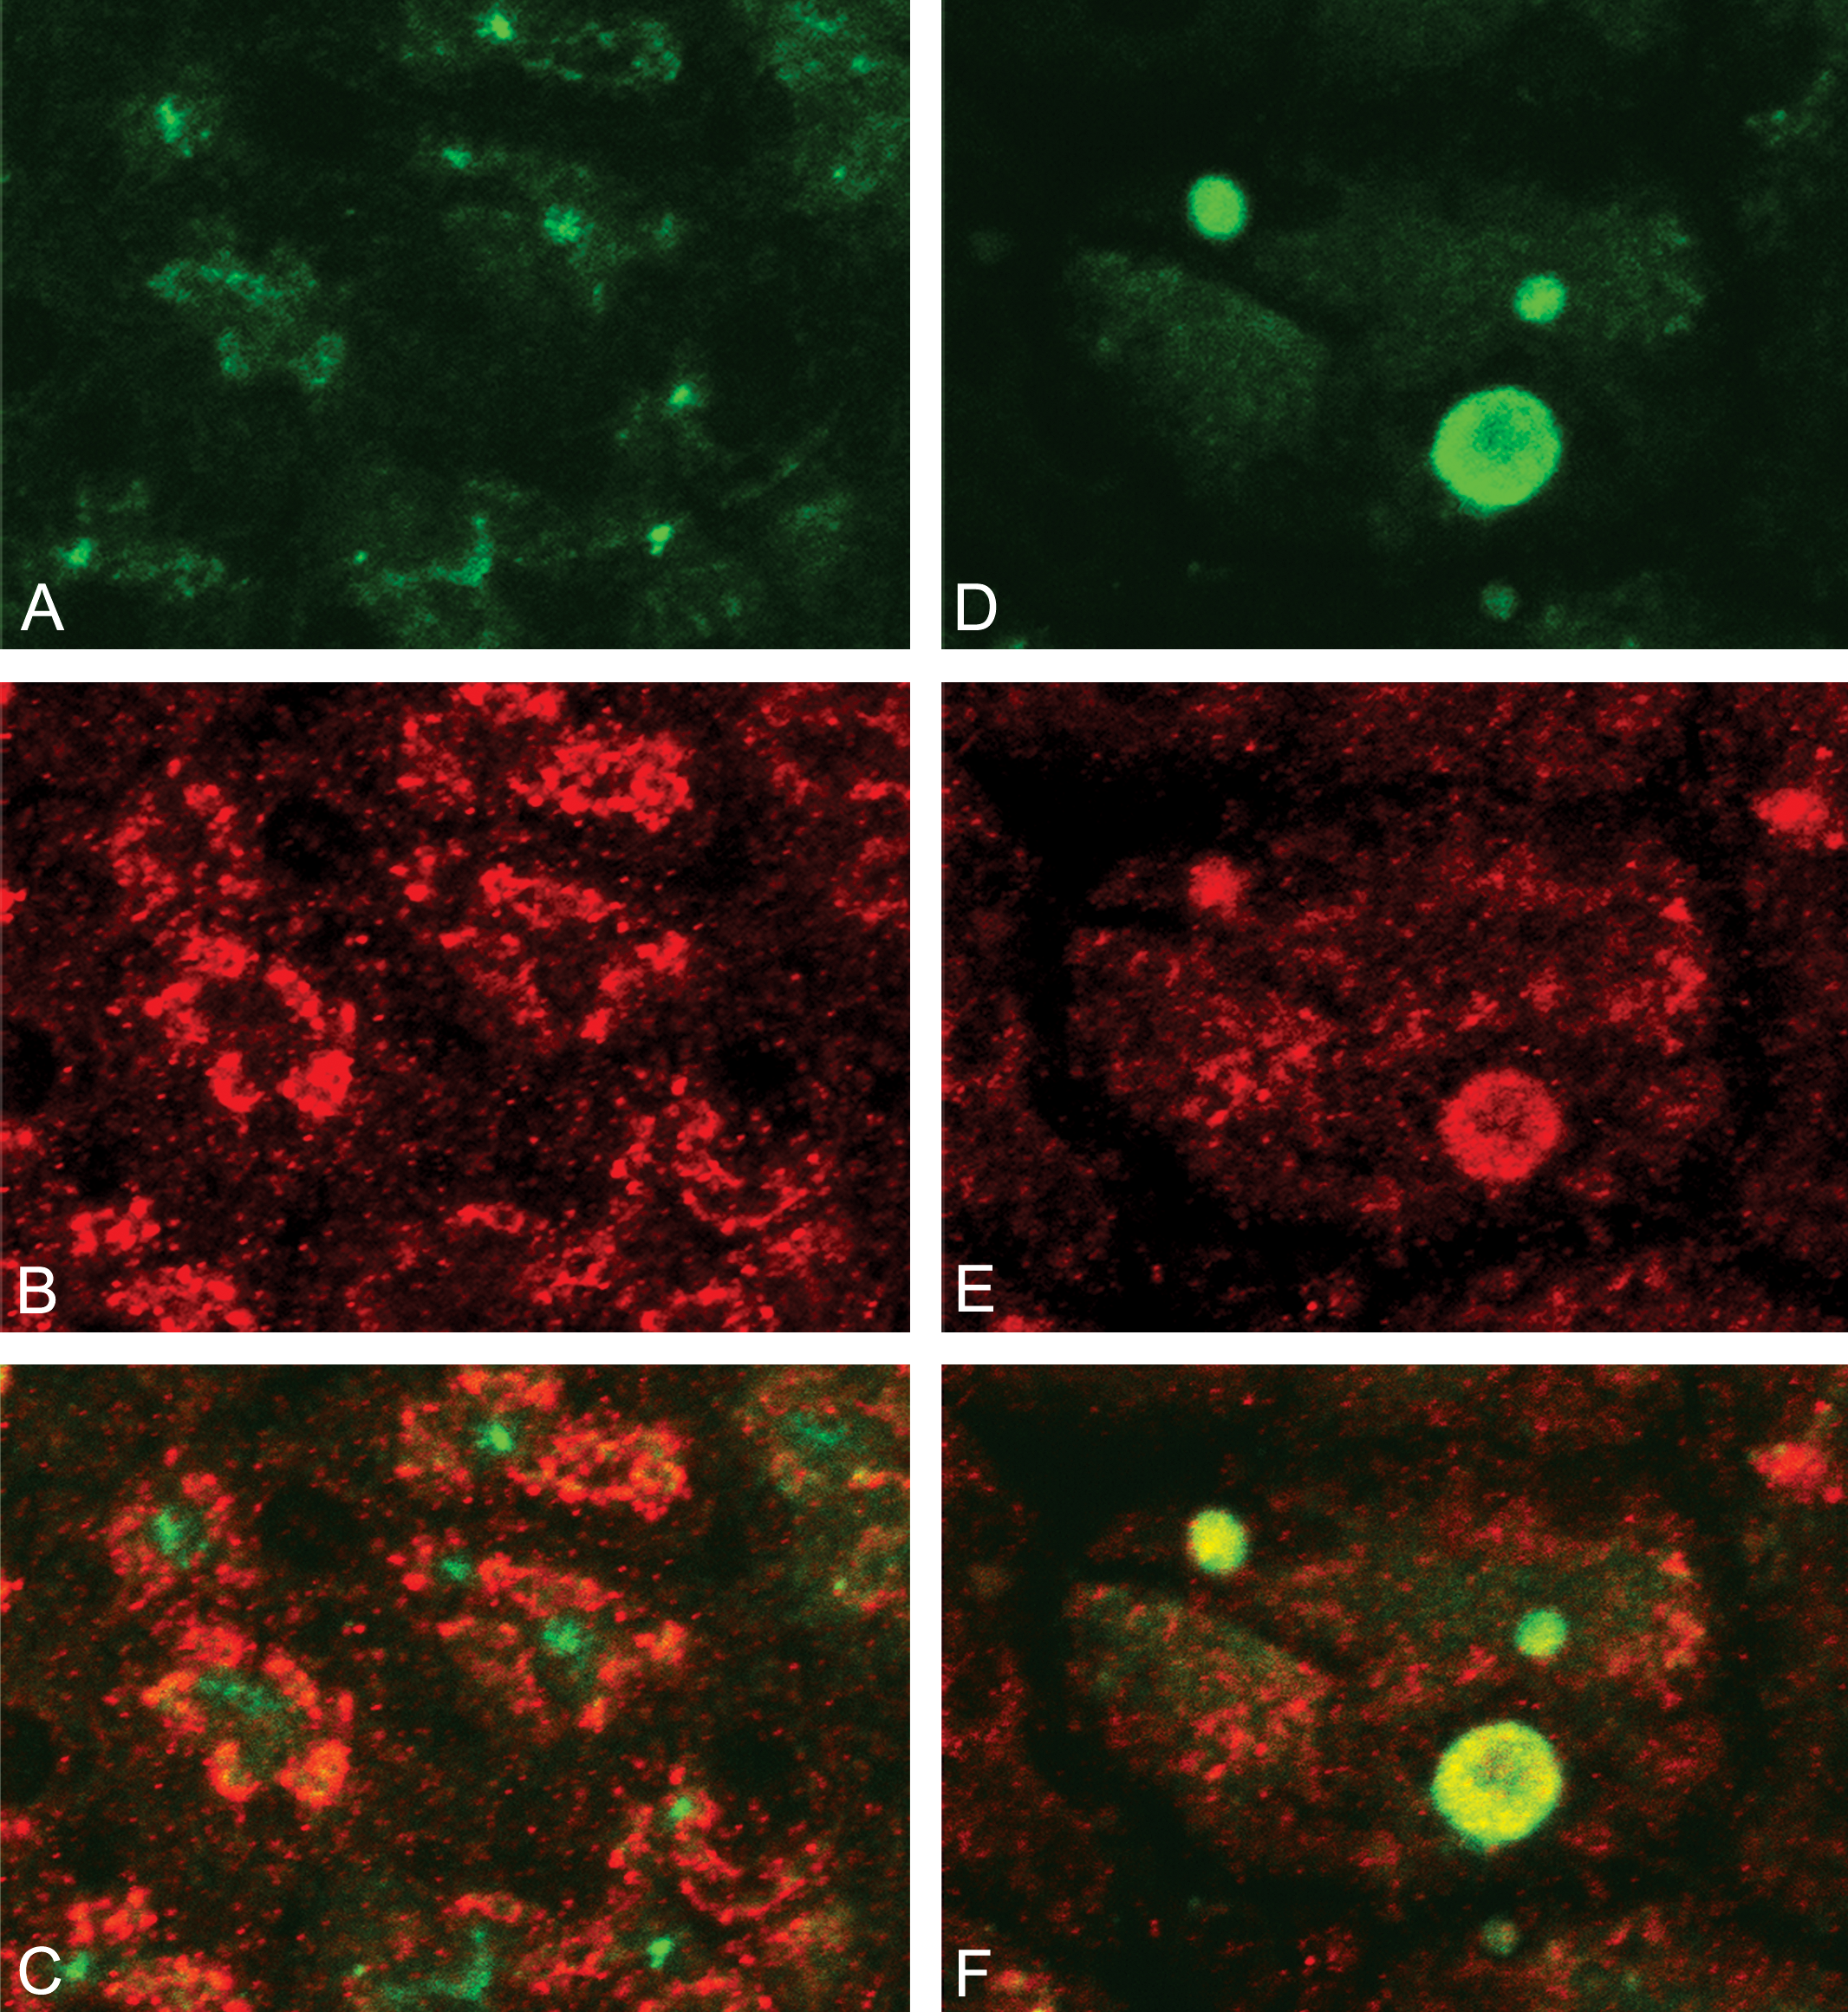
Colocalization of fluorescence labeling LC3 (green) and Reg3γ (red) in images from tissue sections of control and 50 μg/kg caerulein-treated mice. Control (A–C); no autophagososomes detected in fluorescent staining for LC3 (A) or Reg3γ (B) and no significant colocalization (C). Caerulein 50 μg/kg (D–F); autophagosomes observable in eLC3 (D) and Reg3γ (E) fluorescent images and evident colocalization of LC3 and RegIIIγ in autophagosomes (F). LC3 = microtubule-associated protein 1, light chain 3; Reg3 = regenerating islet–derived 3.
Western Blot Analysis
Figure 9 demonstrates the expression of all 11 investigated proteins as determined by Western blot of pancreatic proteins from control caerulein-treated mice. With caerulein treatment, minimal change was observed in expression of the parental form (p: 37 kDa) of CatB, but an increase was detected in the cleaved product or mature form (m: 25 kDa). Caerulein stimulated a dose-dependent increase in the parental form (p: 63 kDa) and a dose-dependent decrease in the mature form (m: 25 kDa) of CatD. LAMP2 expression was decreased in caerulein-treated mice compared to control. VMP1 expression was minimally increased with both caerulein doses. LC3 expression increased with caerulein treatment in a direct dose response. Autophagosomal form (LC3II) was preferentially concentrated by the anti-LC3 antibody/agarose beads, and it also exhibited a dose response to caerulein. With caerulein treatment, ATG9a expression decreased. Overall, ATG9b expression decreased or remained minimally changed in caerulein-treated mice compared to saline controls. In comparison, Beclin1 was definitely decreased in response to caerulein. Reg3α and Reg3β had similar expression patterns showing increases in low dose (caerulein 10 μg/kg) animals but decreased levels in high dose (caerulein 50 μg/kg) animals relative to controls. However, Reg3γ demonstrated a strong dose-dependent decrease in caerulein-treated animals. Table 2 provides a relative quantification of Western blots.
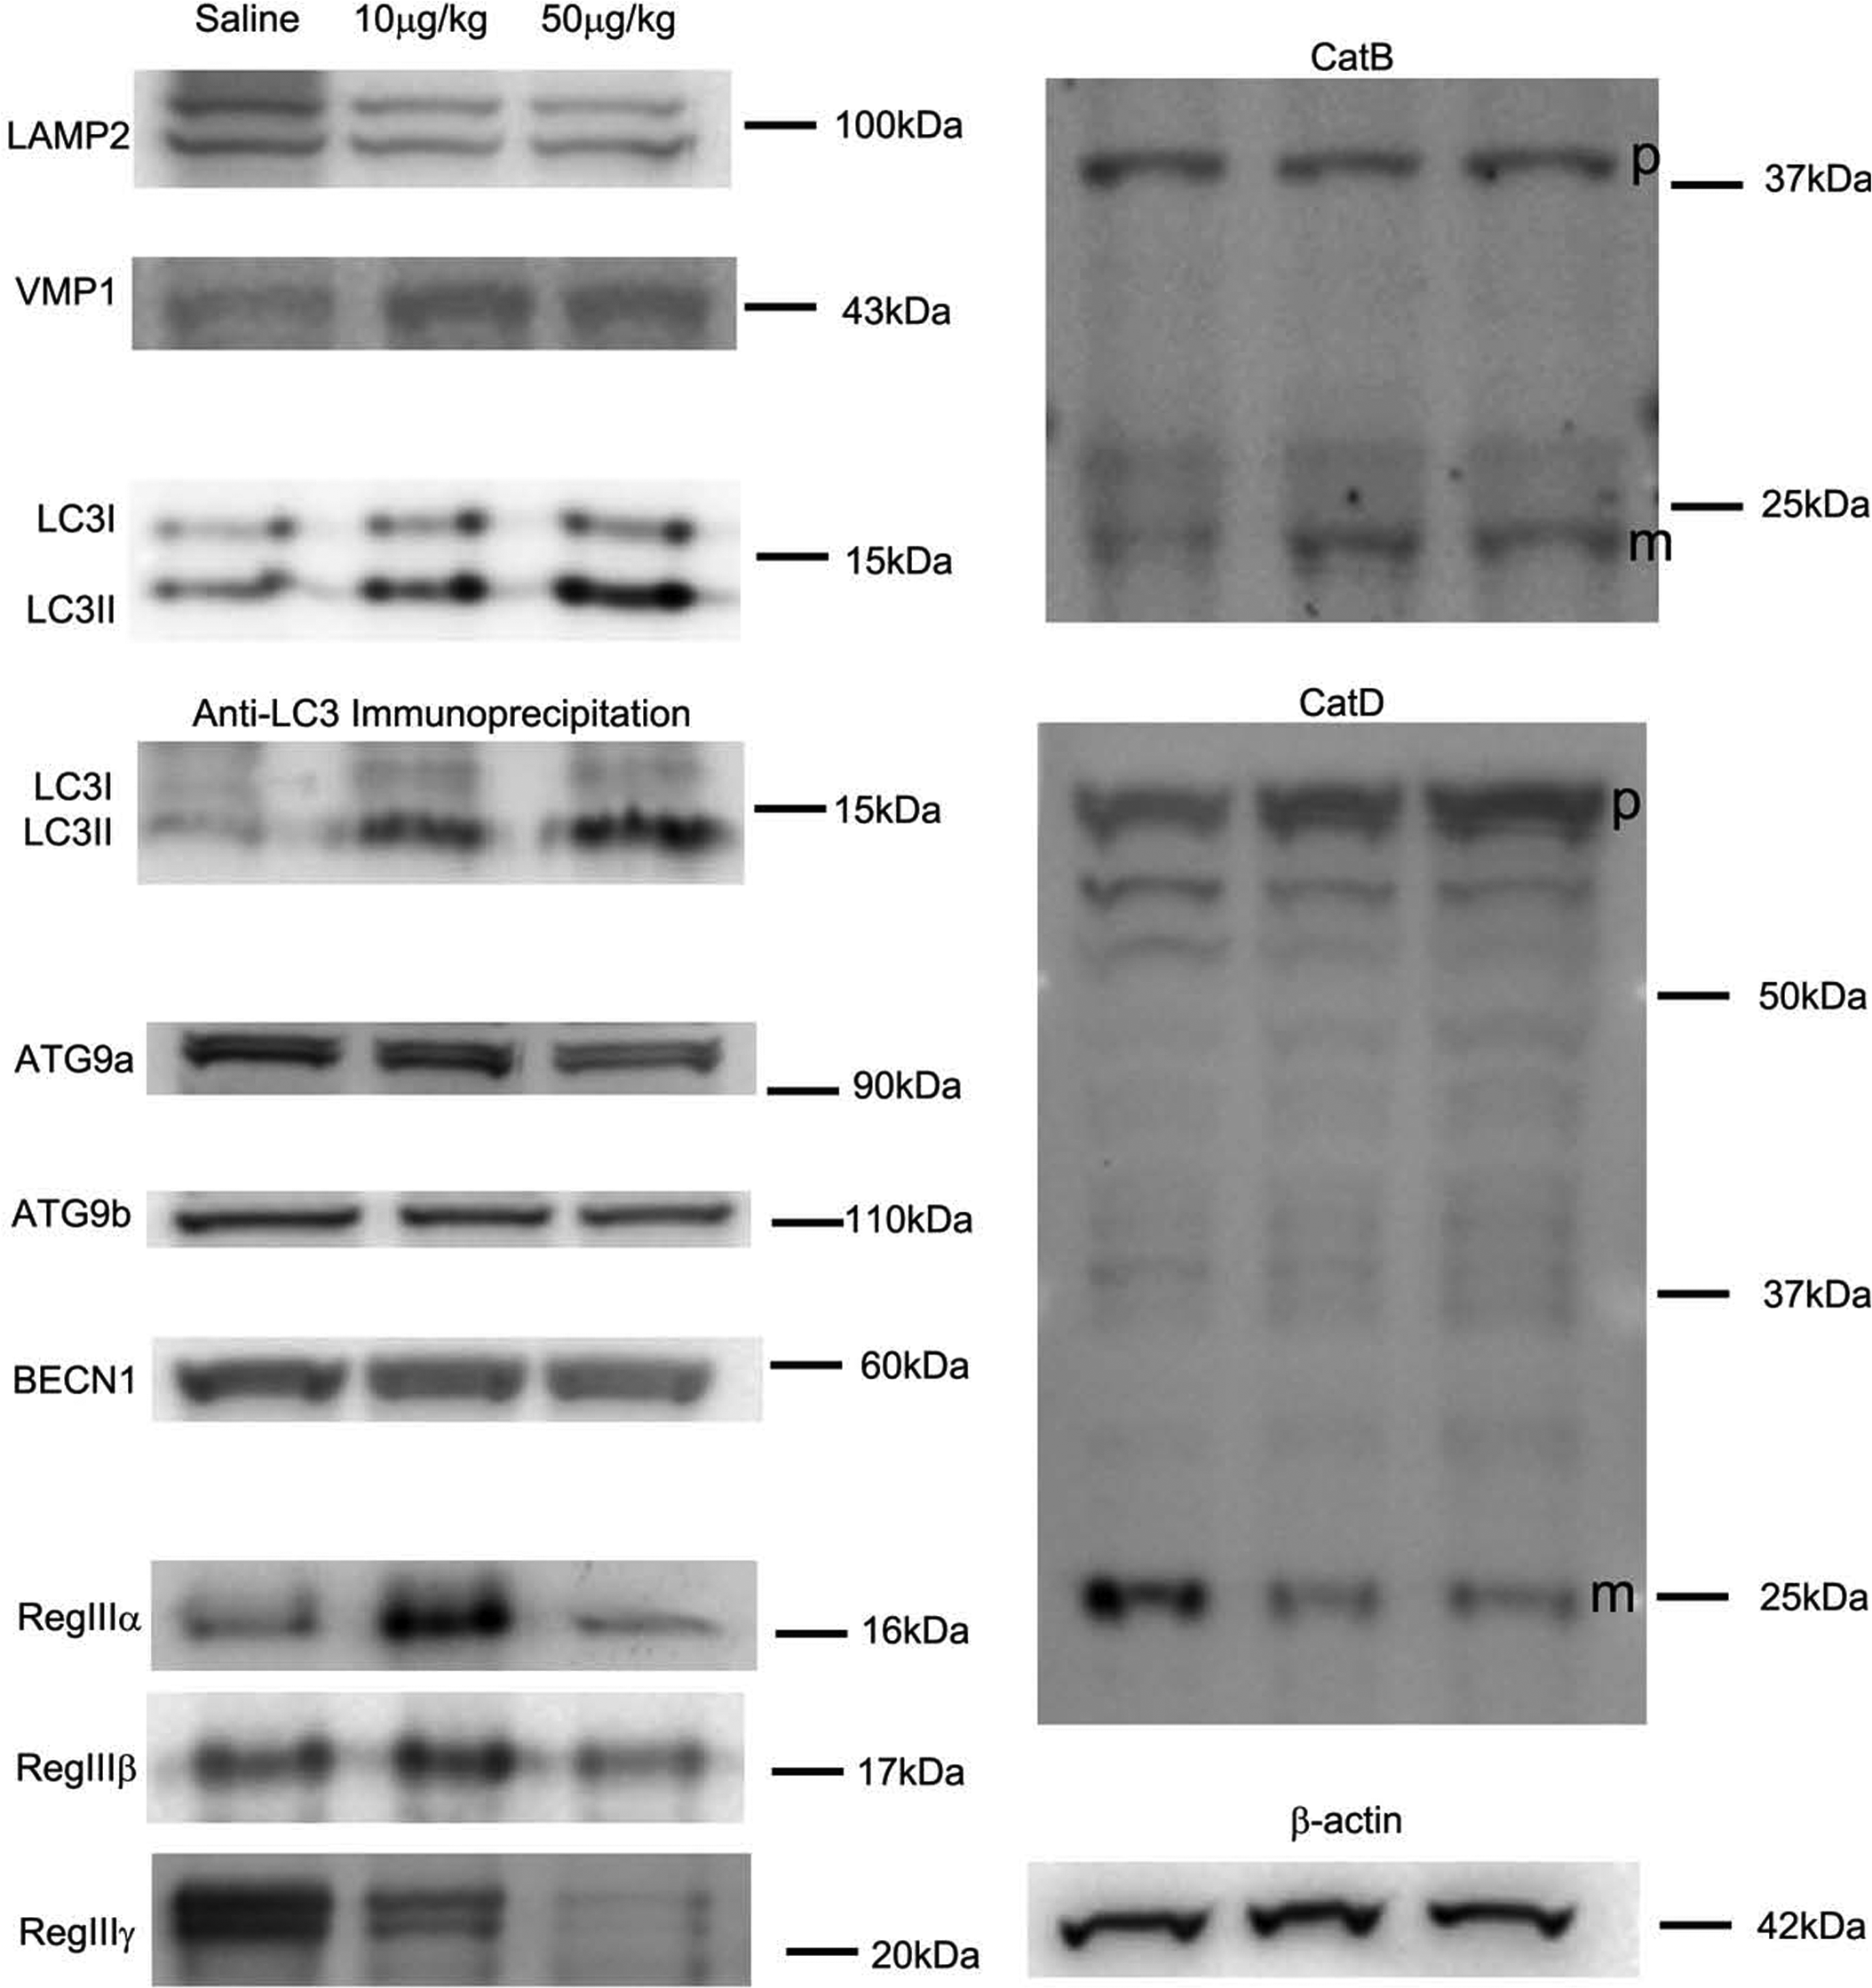
Western blot for 11 proteins. Representative Western blot for total pancreas lysate shown (left to right, saline, 10 μg/kg and 50 μg/kg); β-actin was used as a loading control. M = mature form; p = parental form.
Changes in expression of specific proteins following caerulein treatment.
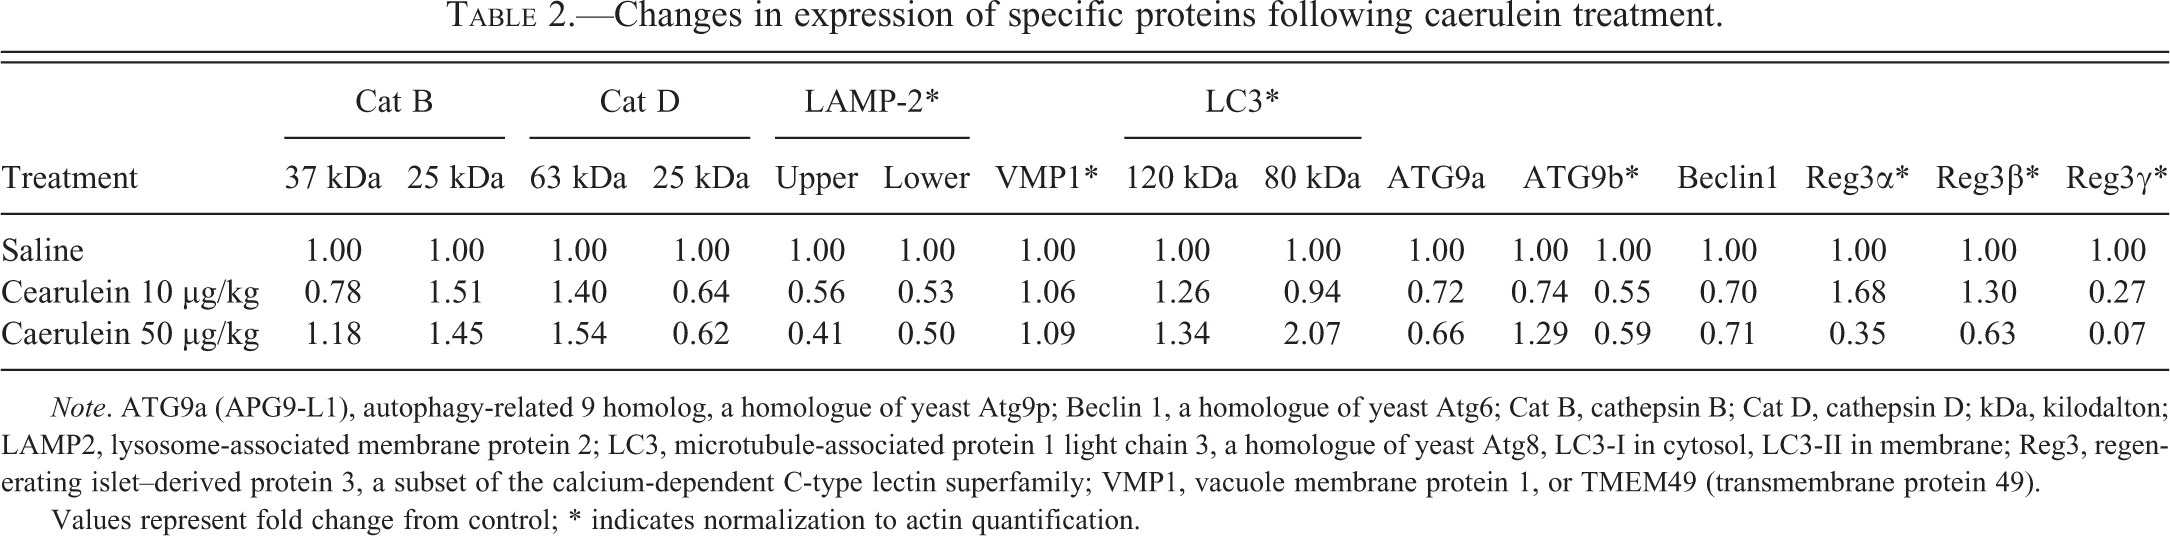
Note. ATG9a (APG9-L1), autophagy-related 9 homolog, a homologue of yeast Atg9p; Beclin 1, a homologue of yeast Atg6; Cat B, cathepsin B; Cat D, cathepsin D; kDa, kilodalton; LAMP2, lysosome-associated membrane protein 2; LC3, microtubule-associated protein 1 light chain 3, a homologue of yeast Atg8, LC3-I in cytosol, LC3-II in membrane; Reg3, regenerating islet–derived protein 3, a subset of the calcium-dependent C-type lectin superfamily; VMP1, vacuole membrane protein 1, or TMEM49 (transmembrane protein 49).
Values represent fold change from control; * indicates normalization to actin quantification.
Discussion
In caerulein-induced pancreatitis, proenzyme ZGs are fused with vacuoles containing digestive enzymes and lysosomal hydrolases at the basolateral acinar cell membrane and thus result in abnormal secretory vesicle maturation (Adler et al. 1985; Adler, Rohr, and Kern 1982; Steer, Meldolesi, and Figaralla 1984; Watanabe et al. 1984). More recently, lysosomal degradation of ZGs within pancreatic acinar cells was investigated in the caerulein-induced pancreatitis model (Hashimoto et al. 2008; Ropolo et al. 2007). These studies described mechanisms and proteins involved in autophagy and suggested a role for autophagy in intracellular trypsinogen activation. However, further work was needed to support the proposed role of autophagy in acute pancreatitis and its relationship to pancreatic digestive enzymes and the PAP or Reg3 family. To advance this understanding, 11 proteins were chosen from 3 classifications; digestive enzymes/proteins, autophagy proteins, and PAP for investigation. Findings from this investigation with their implications and relationships are further discussed below.
Early Events of Caerulein-induced Pancreatitis
Morphological changes in acinar cells can be observed as early as 30 min after caerulein injection (Watanabe et al. 1984). In the present study, early acinar cell response to caerulein-induced injury was reflected by formation of large cytoplasmic vacuoles. H&E staining suggested that these large vacuoles contained ZGs, nonzymogen cytoplasmic contents, or a mixture of both. These vacuoles likely represent increased production of ZGs and fusion of ZGs with other ZGs and/or lysosomes, or the formation of autophagosomes and ALs in caerulein-treated pancreatic acinar cells.
Autophagy has recently been reviewed multiple times as an emerging area of research activity and interest (Nakatogawa et al. 2009; Xie and Klionsky 2007). Autophagy was once thought to be a fairly static maintenance pathway for constitutive protein regulation through degradation. However, more recent findings indicate that autophagy is an extremely complex and dynamic process involved in immune and cell injury responses as well as maintenance. Autophagy malfunction is now considered a major contributor to Alzheimer’s disease and other neurodegenerative disorders (Mizushima et al. 2008; Thorburn 2008). Extensive sharing of effecter mechanisms and signaling pathways has been described for autophagy and apoptosis to the point that some believe that they can be classified as parts of the same process (Gonzalez-Polo et al. 2005; Thorburn 2008). New evidence suggests that in some situations autophagy may be induced as a first line of response that if overwhelmed results in apoptosis (Maiuri et al. 2007).
Within the present study, caerulein was found to result in acinar cell injury with both autophagy and apoptosis observed as end points (and occasionally necrosis). The study was unable to determine if autophagy was functioning in a protective role through which some damaged cells may have survived, as an alternative pathway for programmed cell death, or both. However, it was apparent that the more severe the injury to the exocrine pancreas the more prominent the appearance of, and theoretically, the functional role of autophagy. The recent availability of novel autophagy proteins for immunostaining enabled possible demonstration of the relationship of autophagy proteins to pancreatic stress and apoptosis-associated proteins. The present study was undertaken to identify the expression of these markers and their potential utility for describing pancreatic injury with the hope of applying this information to detect DIP and its potential mechanisms.
The Effects of F-actin on Autophagy and Apoptosis
It has been proposed that actin cytoskeleton alterations play an important role in selective types of autophagy (Reggiori et al. 2005). Furthermore, it has been demonstrated that in a model of apoptosis, early stages of apoptosis are associated with depolymerization of F-actin and degradation of intermediate filaments but that during autophagic cell death intermediate and microfilaments are largely preserved (Bursch et al. 2000). These findings support the notion that autophagic cell death is a separate entity of programmed cell death that is distinctly different from apoptosis which may not require intensive F-actin dynamic changes. Recently, Ryu et al. (2011) suggested that F-actin stabilization may inhibit lysosome-derived autophagic death, while F-actin depolymerization increases the number of autophagic vacuoles. The present study showed that F-actin was located predominantly in apical membrane and to a lesser extent the basal cell membrane of untreated acinar cells. This finding is similar to that reported by a group using fluorescence microscopy to visualize exocytosis in untreated pancreatic acinar cells from mice (Jang and Thorn 2011). Apical to basal changes in F-actin distribution seen after caerulein administration in this study mirror those described in previous studies (Singh et al. 2001; Singh and McNiven 2008). Nuclear enlargement was observed in apparently nonapoptotic, nonautophagic cells. We assume this is a response to caerulein that may progress to autophagy, apoptosis, and/or necrosis but are unable to specify the nature of the damage and have not definitively linked these changes to any form of cell death. However, this is a nuclear alteration seen early in many cellular toxicities especially those impacting DNA replication and repair including precancerous lesions.
Lysosomal-associated Proteins
Cathepsin B Contributes to Caerulein-induced Pancreatitis and May Participate in Intracellular Activation of Trypsinogen
Within the present study, caerulein treatment resulted in an increase in CatB positively stained autophagosomes and ALs in acinar cells. This finding implies a role for CatB in autophagy and possibly in the conversion of trypsinogen into trypsin, as discussed below. Lysosomal cathepsins are involved in autophagy, necrosis, and apoptosis (Repnik et al. 2012) and play roles in both proapoptotic and antiapoptotic signaling (Uchiyama 2001). CatB has been primarily described in proapoptotic roles (Baskin-Bey et al. 2005; Ge et al. 2006; Salvesen 2001). A previous study in mice demonstrated that the activity of the pancreatic lysosomal enzymes, including CatB, increased in acinar cells in acute hemorrhagic necrotizing pancreatitis (Rao, Furetti, and Baccino 1980). As long as a half century before, it was shown that CatB purified from beef spleen could activate trypsinogen to trypsin (Greenbaum, Hirshkowitz, and Shoichet 1959). Subsequently, it was suggested that activation of trypsinogen in vivo may trigger the autodigestive process in acute pancreatitis (Niederau and Grendell 1988). Using subcellular fractionation methods, CatB was found to partially redistribute from lysosomes to ZGs probably via fusion of lysosome and zymogens (Hofbauer et al. 1998; Saluja et al. 1987). Immunolocalization studies have also supported the activation of trypsinogen in cytoplasmic vacuoles containing CatB (Hofbauer et al. 1998). Over the intervening years, contradictory reports confused the validity of the CatB trypsinogen activation hypothesis. Eventually, a CatB knockout mouse was used to demonstrate diminished ectopic activation of trypsinogen to trypsin with caerulein injection supporting the role of CatB in the evolution of pancreatitis (Halangk et al. 2000). In the present study, a low basal expression level of CatB was observed in control mice with caerulein injection resulting in increased pancreatic expression. Western blot findings supported this increase in mature CatB. CatB was found exclusively in the nonzymogen cytoplasm in control and caerulein-treated mice, although the treated mice also had CatB staining in autophagosomes and ALs. A previous study had demonstrated CatB and trypsinogen colocalization in control and caerulein-treated animals, but showed only CatB staining within the autophagosome (Willemer, Bialek, and Adler 1990). Others have indicated that both CatB and ZGs were found within autophagic vacuoles of pancreatic acinar cells of rats and mice (Horie et al. 1971; Rao, Furetti, and Baccino 1980). The staining results from the present study suggest that, constitutively, CatB resides primarily in the central, or basal, nonzymogen cytoplasm, but may, under caerulein stimulation, interact with nearby ZGs within the acinar cell with some of those cells undergoing autophagy-producing autophagosomes and ALs. If the autophagic response is inadequate or exhausted, then CatB may participate in proapoptotic signaling as suggested by previous research (Bhoopathi et al. 2010).
Cathepsin D May Also Contribute to Caerulein-induced Pancreatitis via an Unidentified Pathway
The present study demonstrated a decrease in CatD expression but positively stained autophagic vacuoles in pancreatic acinar cells of caerulein-treated mice. The findings are consistent with observations by Watanabe et al. (1984) and suggest that CatD is also active in autophagy signaling and may contribute to caerulein-induced pancreatitis. The decrease in CatD staining is consistent with the decrease in mature CatD demonstrated on Western blot. Unlike CatB, CatD has not been extensively associated with trypsinogen activation, and thus a pathway through which CatD functions in autophagy remains unclear. CatD also has a more ambiguous role in apoptosis with multiple reports of both proapoptotic and antiapoptotic influence (Bidere et al. 2003; Castino et al. 2005; Conus et al. 2008; Hah et al. 2012). Recent studies suggest that constitutively expressed CatD may be antiapoptotic (Castino et al. 2005; Hah et al. 2012) and that accumulation of CatD could be part of autophagy/apoptotic signaling (Carew et al. 2010).
LAMP2 as an Indicator of Increased Phagocytic Activity
In caerulein-treated mice in this study, positive LAMP2 staining was shown to concentrate in autophagosomes. Cytoplasmic LAMP2 staining was slightly increased with 10 μg/kg caerulein but diminished in mice given 50 μg/kg caerulein when compared to controls. A treatment-related decrease in LAMP2 expression was also demonstrated by Western blot. These findings indicate caerulein-induced incorporation of LAMP2 positive lysosomes into autophagomes and are consistent with previous findings suggesting LAMP2 is important in autophagosome maturation and/or an indicator of intracellular trypsinogen activation. As a lysosomal-associated membrane protein LAMP2 should serve as a marker to identify cells undergoing lysosomal dependent autophagic degradation (Kanthasamy et al. 2006). Others have suggested that LAMP2 may be critical for maturation of autophagosomes (Saftig, Beertsen, and Eskelinen 2008). LAMP2-deficient mice were discovered to accumulate autophagic vacuoles in the heart and skeletal muscle (Eskelinen 2006). Recently, it was shown that trypsinogen in ZGs can colocalize with LAMP2 but that trypsinogen can not be detected in the resultant ALs (Grasso et al. 2011). This was interpreted as supporting activation and release of trypsin intracellularly believed to be a critical step in the pathogenesis of pancreatitis. Constitutive punctate LAMP2 staining in the acinar cell cytoplasm of control pancreata was observed. The staining was believed to be on the surface of lysosomes. Consistent with previous studies, ALs were LAMP2 positive in pancreatic acinar cells following treatment with caerulein. While acinar cells from low-dose (10 μg/kg) caerulein mice exhibited an increased intensity of LAMP2 staining, the distribution of this staining was reduced making it consistent with the decreased expression described by Western blot. In the high-dose (50 μg/kg) mice, LAMP2 staining was diminished in both intensity and distribution also consistent with Western blot data. As with CatD, at the higher dose this could represent lysosomal depletion. LAMP2 expression decrease has been reported in human chronic alcoholic pancreatitis (Fortunato et al. 2009). This group suggested that LAMP2 depletion may be associated with accumulation of autophagosomes which would also imply loss of expected lysosomal function.
Autophagy-associated Proteins
VMP1 as a Stress-induced Initiator of Autophagosome Formation
VMP1 is an ER transmembrane protein that in mammals becomes highly expressed in acinar cells during early pancreatitis-induced autophagy (Vaccaro et al. 2008) and as such has been labeled as a stress protein in acute pancreatitis and chronic pancreatitis (Jiang et al. 2004; Ropolo et al. 2007). VMP1 expression-induced vesicle formation in VMP1 transgenic mice (Ropolo et al. 2007) and has been associated with autophagy and apoptosis in gemcitabine-treated cancer cells (Pardo et al. 2010). Recently, VMP1 has also been implicated as a critical initiator and effecter protein for a specialized form of autophagy, termed zymophagy that operates to protect acinar cells in the face of pancreatitis (Grasso et al. 2011). VMP1 has been colocalized and associated with a variety of other autophagy-associated proteins (LC3, Atg14, and Beclin1). Consistent with these reports, VMP1 protein expression in this study was increased by caerulein exposure according to Western blot and was found in autophagosomes by IHC. These findings support the role of VMP1 in autophagosomal membrane formation that involves the binding of Beclin1 to the VMP1-ATg domain and subsequent incorporation of LC3 into the autophagosomal membrane (Vaccaro et al. 2008).
LC3 as a Marker for Autophagosomes
LC3 is a soluble cytoplasmic protein that was initially identified in conjunction with microtubules and function of the cytoskeleton. LC3 is believed to participate in the identification and enclosure of protein targets into the autophagosome (Grasso et al. 2011). Soluble LC3-I is cleaved from pro-LC3 and, after further alteration is converted into LC3-II, an autophagosome membrane-bound protein (Kabeya et al. 2000). VMP1 expression promotes the conversion of LC3-I to LC3-II (Itakura and Mizushima 2010; Tanida et al. 2005) allowing LC3-II to translocate from the cytoplasm to the autophagosomal membrane. Localization of LC3 to autophagosome structures is widely used as an experimental marker for autophagy (Mizushima, Yoshimori, and Levine 2010). In the present study, intense punctate LC3 staining was seen in the zymogen area of acinar cells from mice treated with low-dose (10 μg/kg) caerulein, while controls only showed faint diffuse cytoplasmic staining. Although this punctate staining decreased significantly in acinar cells from mice receiving high-dose (50 μg/kg) caerulein, numerous positively stained autophagosomes were recognized. Western blot indicated increases in LC3 expression especially LC3-II in acinar cells from both dose groups. The LC3 antibody employed in the present study recognized both LC3-I (cytosolic form) and LC3-II. Western blot results demonstrate that increased LC3-II expression accounts for the majority of the increase in LC3 staining and supports LC3-II as the definitive indicator for autophagosomes.
ATG9 Reservoirs Functions in Autophagosome Formation
ATG 9b (ATG9b; Young et al. 2006) and ATG9a (ATG9a; Tamura et al. 2010) were reported to be involved in the autophagy formation complex that includes VMP-1, LC3, and Beclin1 as well as other autophagy-related proteins. ATG9a is ubiquitously expressed, whereas ATG9b is highly expressed in the placenta (trophoblast cells) and the pituitary gland. In human adult tissues, expression of ATG9b is robustly induced by hypoxia (Fish et al. 2007). A recent study reported that ATG9a cycles between the trans-Golgi network and late endosomes in basal conditions with transition to LC3-positive autophagosomes during starvation. Starvation or rapamycin treatment lead to PI3KC3 and unc-51-like kinase-dependent redistribution of ATG9a from Rab7/9+ endosomes to endosomal membranes positive for LC3 (Young et al. 2006). The similarity between the trans-saccules of the Golgi apparatus and the membrane of mature ZGs (Beaudoin et al. 1983) provided the possibility that ATG9a could originate and be transported from the Golgi apparatus to ZGs. It has been shown that ATG9b can functionally complement ATG9a in this process (Yamada et al. 2005). In the present study, ATG9a staining was consistent with these reports. Constitutive ATG9b staining was minimal, and increases in staining following caerulein treatment were found localized only in autophagosomes, also consistent with a complementary function to ATG9a. Western blot revealed minimal to no change in expression of these proteins following caerulein treatment at either 10 or 50 μg/kg. Our results highlight that Atg 9 reservoirs function in autophagosome formation.
Beclin1 as an Initiation Marker for Autophagosome Formation
Previous studies have demonstrated that Beclin1 interacts with the autophagosomal initiation complex that includes VMP1. Beclin1, as part of a complex with Class III PI3K (Vps34), attaches to the VMP1-Atg domain and mediates the localization of LC3 and Vps34 to the autophagosomal membrane, leading to ER-associated autophagosome initiation (Chan 2012; Vaccaro et al. 2008; Zeng, Overmeyer, and Maltese 2006). The present experiments showed a similar pattern of staining for Beclin1 and VMP1 in high-dose caerulein samples. The similar staining patterns described in this study are consistent with and support these proteins having complementary roles (as described above) in the initiation pathway for autophagy, in which VMP1, Beclin1, and LC3 together work on the same location, the autophagosomal membrane (Vaccaro et al. 2008). Both staining and Western blot indicated a slight caerulein-induced decrease in Beclin1 expression. Whether this decrease represents exhaustion of cellular Beclin1 or some other mechanism was not determined in this study.
Pancreatitis-associated Proteins
Reg3γ as a Promising Marker for Predicting Early Pancreatic Injury
PAP, or regenerating islet–derived 3 (Reg3)-related proteins, were initially identified in pancreatic juice after induction of pancreatic inflammation (Iovanna et al. 1991). Reg3 proteins can also be induced by free radicals in vitro and can protect the cell against apoptosis (Ortiz et al. 1998). Reg3α (PAPII), Reg3β (PAPI), and Reg3γ (PAPIII) encode 175-, 175-, and 174-amino acid proteins, respectively, with 60 to 70% homology (Narushima et al. 1997). Reg3α and Reg3β genes are evenly expressed by most acinar cells but undetected in the endocrine islets (Wang et al. 2011). Reg3α protein is predominately expressed in the intestine and exocrine pancreas and is increased after caerulein treatment (Norkina et al. 2006). In addition, Wnt/β-catenin signaling activation was reported to induce Reg3α expression in Huh7 human hepatoma cells treated with LiCl (Cavard et al. 2006). This finding has been used to support the hypothesis that caerulein injection could induce epithelial cell transdifferentiation through Wnt pathway activation (Means et al. 2005). However, whether Reg3α and/or Reg3β actually play a role in Wnt-activated transdifferentiation is not known. Mouse Reg3γ RNA is detected in undifferentiated embryonic stem cells (Jing, Kehoe, and Tzanakakis 2010) defining another connection to transdifferentiation and is expressed in intestinal epithelial cells where it has an antimicrobial effect (Cash et al. 2006).
PAP, or Reg3, family proteins are stress-induced proteins that play a protective role in the exocrine pancreas. Reg3β protein, a key factor in the local response to acute pancreatitis, was upregulated in the pancreas of wild-type mice 24 hr following caerulein administration (Hamagami et al. 2009). Caerulein-induced pancreatic necrosis is less severe in Reg3β −/− mice than in wild-type mice, but more sensitive to apoptosis, suggesting a pro-necrotic, anti-apoptotic role for Reg3β (Gironella et al. 2007). Reg3β and Reg3γ expression are induced after pancreatectomy or exendin-4 treatment (De León et al. 2006). The role of these proteins, if any, in autophagy has not been described. However, given the often close signaling interactions and similarities between apoptosis and autophagy, a role is feasible. In the present study, Reg3α and Reg3β were dose-dependently decreased with caerulein treatment, while Reg3γ expression was dose-dependently increased. Furthermore, Reg3γ was found to strongly colocalize with LC3, the well-recognized autophagosome marker, in autophagosomes of caerulein-treated mice. This suggests a role for Reg3γ in autophagocytosis. Reg3α and Reg3β staining was not well associated with autophagosomes and was indirectly proportional to Reg3γ staining supporting a different role for these proteins. Western blots for Reg3α and Reg3β expression were consistent with the decreased staining in the high-dose group compared to control but demonstrated a clear increase in expression in the low-dose group relative to control that was not reflected in the tissue staining. Western blots for Reg3γ demonstrated a dose-dependent decrease in expression, a pattern completely opposite to the tissue staining pattern. Given that tissue staining and Western blot were both dose-dependent, it is unlikely that the antibody is a problem and suggests a valid relationship. We did not further investigate this discordance and have no explanation for it although binding and/or conformational changes to the protein between its in situ and denatured state have to be considered likely.
Overall, this article summarizes the responses of autophagy-related, lysosomal, and PAPs in the caerulein-induced pancreatitis model mainly by investigating their IHC staining patterns and protein expression by Western blot, neither a quantitative method. The aim of this investigation was to provide background information for potential biomarkers of DIP. Immunohistochemical electron microscopy was not undertaken, thus preventing demonstration of early changes in autophagic ultrastructures, such as fluorescently labeled endosomes, phagosomes, lysosomes, ALs, and autophagosomes. In addition, the single time point evaluated precludes detection of very early caerulein-induced morphological changes in pancreatic acinar cells. Finally, commercial antibodies were used throughout this study. The limited availability of specific antibodies, the use of polyclonal antibodies, incompletely purified antibodies, and antibodies that had not been previously optimized or successfully utilized for IHC and Western blot all impact the experimental outcome and limit definitive statements. Despite the fact that some interesting observations have been made in the present study, further study is needed to confirm the observed staining and provide insight into molecular and/or possible immunological mechanisms.
Conclusion
Consistent with previous studies, autophagosomes and ALs were discovered in caerulein-induced pancreatitis demonstrating a role for autophagy, as well as apoptosis, in the cellular response to acinar cell injury in this model. Apoptosis and autophagy were equally evident in the acinar cells of low-dose caerulein mice and more pronounced in acinar cells of high dose mice. It was undetermined whether autophagy was protective, an alternative route to cell death, or both. Expression of CatB and CatD, enzymes vital to lysosomal function and associated with both autophagy and apoptosis signaling, were altered by caerulein exposure. VMP1 and LC3, proteins previously associated with autophagy, were upregulated in this study. The induced PAP, Reg3γ, was increased with caerulein-induced injury and colocalized with the autophagy marker, LC3. This implies a role for Reg3γ in autophagy and for autophagy as a stress response. That Reg3γ expression has also been increased by exposure to a pancreatic active drug suggests Reg3γ as a candidate biomarker of early pancreatic injury that might also predict DIP.
Footnotes
The author(s) declared no potential conflicts of interest with respect to the research, authorship, and/or publication of this article.
The author(s) received no financial support for the research, authorship, and/or publication of this article.
Acknowledgment
The authors would like to thank the following people who provided technical consultation of the pancreatic acinar cell isolation and other enzymatic activity test: Dr. Veronica Sancho Bornez in Dr. Robert T. Jensen’s lab in National Institute of Diabetes and Digestive and Kidney Diseases, National Institutes of Health, and Professor Baoan Ji from University of Texas MD Anderson Cancer Center.