
Abstract
Four rat embryo fibroblast (REF) cell lines with defined oncogenic transformation were used to study the relationship between tumorigenic conversion, metabolism, and development of cell death in a 3D spheroid system. Rat1 (spontaneously immortalized) and M1 (myc-transfected) fibroblasts represent early nontumorigenic transformation stages, whereas Rat1-T1 (T24Ha-ras-transfected Rat1) and MR1 (myc/T24Ha-ras-co-transfected REF) cells express a highly tumorigenic phenotype. Localized ATP, glucose, and lactate concentrations in spheroid median sections were determined by imaging bioluminescence. ATP concentrations were low in the nonproliferating Rat1 aggregates despite sufficient oxygen and glucose availability and lack of lactate accumulation. In MR1 spheroids, a 50% decrease in central ATP preceded the development of central necrosis at a spheroid diameter of around 800 μm. In contrast, the histomorphological emergence of cell death at a diameter of around 500 μm in Rat1-T1 spheroids coincided with an initial steep drop in ATP. Concomitantly, reduction in central glucose and increase in lactate before cell death were recorded in MR1 but not in Rat1-T1 spheroids. As shown earlier, myc transfection confers a considerable resistance to hypoxia of MR1 cells in the center of spheroids, which is reflected by their capability to maintain cell integrity and ATP content in a hypoxic environment. The data obtained suggest that small alterations in the genotype of tumor cell lines, such as differences in the immortalization process, lead to substantial differences in morphological structure, metabolism, occurrence of cell death, and tolerance to hypoxia in spheroid culture.
Keywords
In vitro cultivation of tumor cells as multicellular tumor spheroids (MCTS) has greatly contributed to the understanding of the role of the cellular microenvironment in tumor biology (for review see Mueller-Klieser 1987, 1997; Sutherland 1988; Kunz-Schughart et al. 1998). These spherical cell aggregates mimic avascular tumor stages or micrometastases in many aspects and have been studied intensively as an experimental model reflecting an in vivo-like micromilieu with 3D metabolic gradients. With increasing size, most MCTS not only exhibit proliferation gradients from the periphery towards the center but they also develop a spheroid type-specific nutrient supply pattern, such as radial oxygen partial pressure gradients. Similarly, MCTS of a variety of tumor cell lines exhibit a concentric histomorphology, with a necrotic core surrounded by a viable cell rim. The spherical symmetry is an important prerequisite for investigating the effect of environmental factors on cell proliferation and viability in a 3D environment on a quantitative basis (e.g., Freyer and Schor 1989a,b; Kunz-Schughart et al. 1996, 1997; Freyer 1994, 1998).
Despite the importance of understanding metabolic alterations associated with tumorigenic conversion for the development of novel therapeutic strategies, only a few systematic studies have been undertaken using differently transformed cell lines in 3D culture. In 1996, the classical two-step carcinogenesis model of myc/ras-co-transfected rat embryo fibroblasts (REFs) proposed by Land et al. (1983) and Weinberg (1989) was established and characterized as a spheroid culture system, providing an appropriate tool to investigate microenvironmental alterations resulting from progressive transformation in vitro (Kunz-Schughart et al. 1996).
The model system used here consists of four different cell lines derived from Fisher 344 REFs with two immortalized cell clones (Rat1 and M1) representing early stages of transformation and two ras-transfected cell clones (Rat1-T1 and MR1) that are highly tumorigenic and aggressive in vivo. The immortalized cell types have an extended lifespan but demonstrate normal contact inhibition of proliferation and anchorage dependence in vitro, and they are poorly (Rat1) or nontumorigenic (M1) when injected into nude mice. T24Ha-ras transfection of Rat1 cells and c-myc1/T24Ha-ras co-transfection of REFs resulted in the two cell clones Rat1-T1 and MR1, respectively, which represent advanced stages of transformation. All four cell lines form multicellular aggregates, when attachment to an artificial substratum is prevented, but they exhibit large differences in proliferative behavior. Rat1 and M1 aggregates cease to grow in spheroid culture, whereas Rat1-T1 and MR1 spheroids show high proliferative activity, reaching maximal sizes of >1200 μm (Kunz-Schughart et al. 1996).
Although genetically closely related, the two tumorigenic cell types dramatically differ in their sensitivity to oxygen deficiency in 3D culture. Our present investigations were inspired by the observation that oxygen deficit coincided with central cell death in Rat1-T1 spheroids, whereas MR1 cells appeared to be highly resistant to hypoxia. Minimum pO2 values accompanied cell quiescence, which raises the question of whether oxygen deficiency may lead to a reduction in ATP content. The aim of our study was to systematically investigate the relationship between parameters reflecting metabolism, such as ATP content, and oxygen availability, proliferative activity, and cell death in the 3D culture system described. In addition, the impact of ras-associated tumorigenic conversion on metabolic behavior was studied by involving the nontumorigenic ancestors Rat1 and M1 that exhibit cellcycle arrest in aggregate culture despite an optimal oxygen supply.
We analyzed ATP, glucose, and lactate distributions in the four different aggregate types by imaging bioluminescence. This technique has been progressively applied in the past few years to quantitatively localize metabolites in cryosections of various biological tissues (Mueller-Klieser et al. 1988, 1991; Hossmann et al. 1992; Kuhnle et al. 1992; Dellian et al. 1993a,b; Schaefer et al. 1993; Vaupel et al. 1994; Schwickert et al. 1995; Tamulevicius and Streffer 1995; Kroeger et al. 1991, 1995; Walenta et al. 1990, 1997; Borisjuk et al. 1998; Levin et al. 1999). In addition, we determined overall glucose uptake and lactate release rates in the spheroids, utilizing standard enzyme assays. These data were correlated with the morphological phenotype, oxygen availability, proliferative activity, and grade of transformation.
Materials and Methods
Spheroid Types and Culturing
Studies were carried out on aggregates of four differently transformed Fisher 344 REF cell lines. Rat1 and M1 cells were immortalized either spontaneously or by myc transfection as described earlier (Kunz-Schughart et al. 1995, 1996). These cell lines show poor aggregation and proliferation in 3D culture, whereas the T24Ha-ras-transfected tumorigenic counterparts Rat1-T1 and MR1 yield rapidly growing spheroids. Cell aggregates were initiated by inoculating (1–2) × 105 Rat1-T1 or MR1 and (1–2) × 106 Rat1 or M1 fibroblasts into nonadherent Petri dishes (10 cm in diameter). Aggregates were transferred into 1L spinner flasks after an initiation period of 4 days and were kept in rotated suspension culture at 37C with 5% (v/v) CO2 in air. MCTS were grown in conventional culture medium (DMEM; Sigma, Muenchen, Germany) supplemented with 25 mM glucose, 5% (v/v) fetal calf serum (Gibco; Eggenheim, Germany), 10,000 IU/liter penicillin, and 10 mg/liter streptomycin (Flow Labs; Mekkenheim, Germany). The culture medium was replenished daily and the number of cells per volume of medium was maintained constant by removing adequate numbers of spheroids (for details see Kunz-Schughart et al. 1996).
Spheroid Volume, Growth, and Histology
Spheroid growth kinetics were routinely monitored by measuring two orthogonal diameters of 50 individual spheroids every 48 hr using a calibrated eyepiece reticule of an inverted microscope, and were analyzed by fitting the Gompertz equation to the experimental data as detailed earlier (Kunz-Schughart et al. 1996). Aggregate size was documented for cultures that were monitored for their content of metabolites via bioluminescence. In addition to cryohistology, hematoxylin- and eosin-stained (H&E) standard paraffin sections through the center of spheroids with different sizes allowed histological observation. The thickness of the viable cell rim and the dimensions of the nonviable (usually referred to as necrotic) central spheroid region were determined microscopically (magnification × 100–250) by histomorphological criteria, such as pyknotic nuclei, eosinophilic cytoplasm and, later on, cell disintegration, and were recorded as a function of the spheroid diameter. This morphological definition does not allow the distinction of different cell subpopulations within the necrotic process. Therefore, discrimination of cells that show morphologic alterations during the onset of necrosis but are still alive and metabolically active is not possible.
Immunohistochemical Determination of Apoptotic Cells
Apoptotic cells were observed in 5-μm median sections of paraffin-embedded MCTS of different sizes (with and without necrosis) by detecting single- and double-stranded DNA breaks using the TUNEL assay (Boehringer-Mannheim; Mannheim, Germany). All sections were double stained using DAPI as a marker for nuclei and fluorescein-dUTP for DNA strand breaks (Boehringer-Mannheim). A standard staining protocol was used. Stained sections were analyzed in a fluorescence microscope equipped with the appropriate filter sets at a magnification of X100-250 (Zeiss; Oberkochen, Germany). This test allows the detection of apoptotic cells in the viable cell rim only, because necrotic cell destruction in the spheroid center is finally accompanied by the occurrence of DNA strand breaks resulting in fluorescein-dUTP positivity.
Spheroid Conservation and Cryosectioning
To investigate ATP, glucose, and lactate concentrations using the bioluminescence technique, spheroids were shockfrozen in liquid nitrogen and were stored at −80C to avoid or minimize diffusion processes influencing local substrate concentrations. For measurements, serial cryostat sections with a thickness of 5 μm through the center region of aggregates with defined sizes were made. One section was used for histological processing and observation, and three adjacent sections allowed immediate assessment of the substrate concentrations.
Imaging Bioluminescence
Regional distributions of ATP, glucose, and lactate in cryosections of spheroids were registered via imaging bioluminescence (for review see Walenta et al. 1990; Mueller-Klieser and Walenta 1993). This technique allows the mapping of metabolite concentrations in tissue sections at a high spatial resolution. ATP, lactate, or glucose is enzymatically converted to a substrate suitable for the light reaction of bioluminescence enzymes. As a result, light emission occurs with an intensity proportional to the tissue content of the metabolite. The light emission is imaged by a highly sensitive computer-controlled video system capable of registering single photons (Argus 100 Photon Counting System; Hamamatsu, Herrsching, Germany). The video head is connected to a microscope (Zeiss) to register light emission at high magnification (Figure 1). The optical magnification used for measurement mainly determines the spatial resolution of the final image. In the present study, magnifications of X50 or X100 were used, resulting in a frame width of 2 and 1 mm, respectively. The corresponding pixel resolutions are 4 or 2 μm per pixel, taking into account a pixel size of 512 × 512 of the digital images. Because of lateral diffusion of the metabolites and light scattering, the actual resolution was further reduced to values of around 40 to 20 μm, respectively. Therefore, imaging bioluminescence in the present configuration does not allow us to distinguish between intra- and extracellular spaces, but it averages the signal of both compartments.
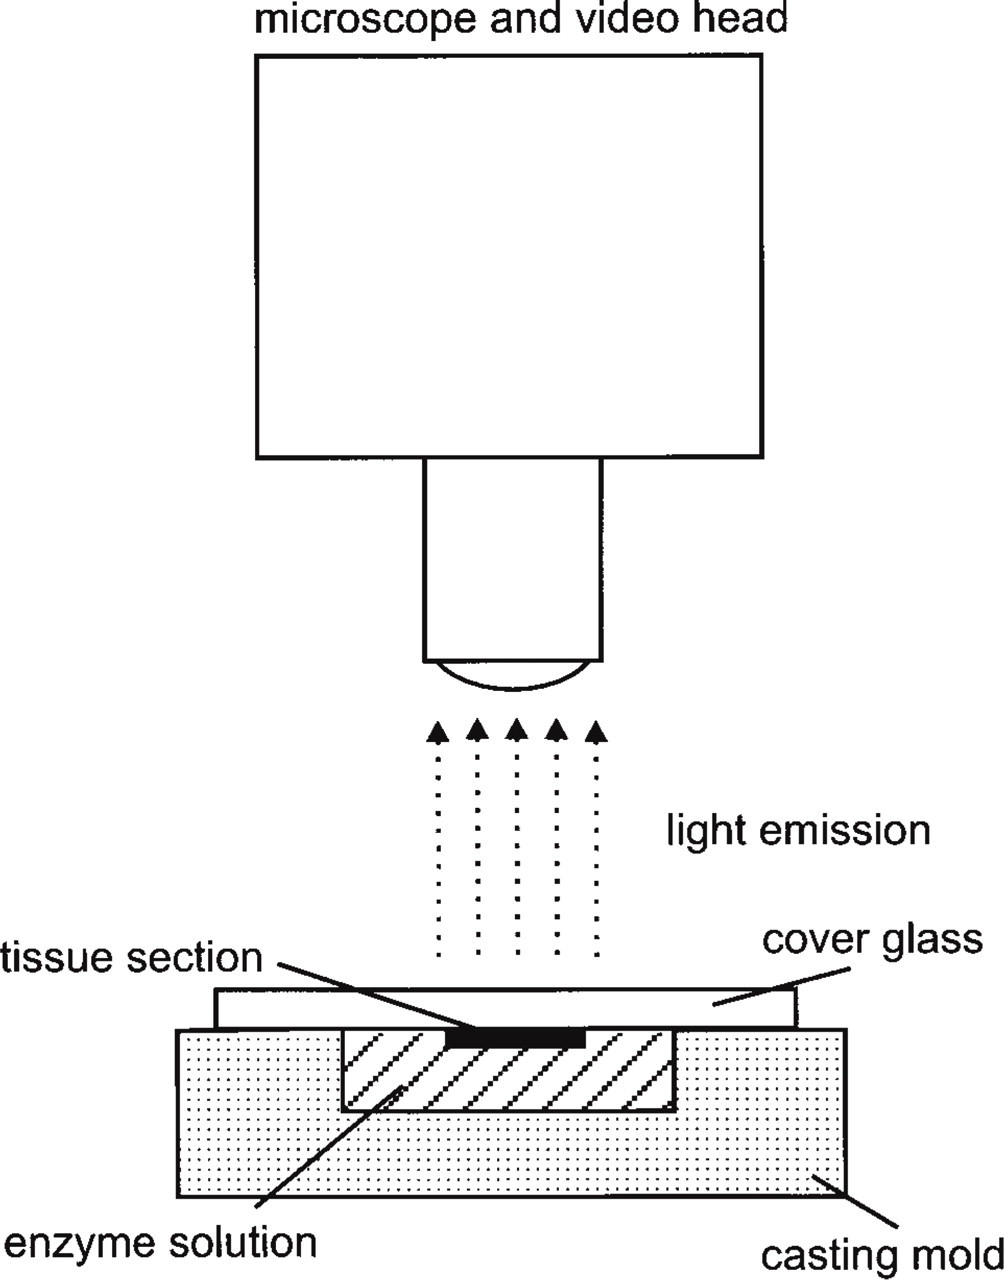
Experimental setup for imaging bioluminescence. The high sensitivity of luciferase reactions is used to register ATP, glucose, or lactate concentrations in cryosections of spheroids with high spatial resolution. For more details see text.
For each measurement, a central cryosection of a spheroid was adhered to a coverglass and kept frozen until use. The coverglass was placed upside down on a casting mold filled with a frozen solution of enzymes and co-enzymes (see below) to link the metabolite of interest to the luciferase light reaction. The mold carrying the slide was placed in a temperature-controlled chamber fixed on a microscope stage; the temperature was adjusted to 10 ± 1C for reproducible kinetics of the enzyme reaction. Subsequently, the enzyme solution and the tissue section melted and the enzyme reaction started. Light emission was registered by the video system over a period of 60 sec. Within this time interval, light intensities were digitized and accumulated in a frame memory of the computer. The intensity values of the resulting images were converted into concentration values (μmol/g tissue fresh weight) using appropriate tissue standards. These frozen standards were prepared from homogenized, heat-inactivated liver tissue containing defined metabolite concentrations and were processed similarly to the spheroid samples.
Three different enzyme solutions were applied to image ATP, glucose, and lactate levels. Each solution contained 60 g/liter gelatin, 0.3 M glycerol, and 30 g/liter polyvinylpyrrolidone (PVP) in a buffer solution. For ATP imaging, substances were dissolved in a 0.2 M HEPES buffer (pH 7.6) supplemented with 0.1 M sodium hydrogen arsenate. Subsequently, 2 mM MgCl2 and 50 g/liter lyophilized and powdered firefly lanterns were added for enzymatic reaction. Additional ingredients of the enzyme solution for glucose measurements were 100 mM ATP, 75 mM NADP, 8 mM MgCl2, 0.5 mM 1,4-dithiothreitol (DTT), 0.4 mM FMN, 8 mM capric aldehyde dissolved in 0.3 M PBS (pH 7.0). Enzymes added to link glucose to the light reaction of luciferase were 44 U/ml hexokinase, 55 U/ml glucose-6-phosphate dehydrogenase, 13 mU/ml luciferase, and 8 U/ml NAD(P)H-FMN-oxidoreductase. Lactate was determined using a solution of 50 mM L-glutamic acid, 160 mM NAD, 0.5 mM DTT, 0.4 ml FMN, 8 mM capric aldehyde, 463 U/ml glutamate-pyruvate transaminase, 67 U/ml lactate dehydrogenase, 13 mU/ml luciferase, and 8 U/ml NAD(P)H-FMN-oxidoreductase in 0.1 M PBS (pH 7.0) plus supplements mentioned above. All chemicals were obtained from Merck (Darmstadt, Germany) or Sigma. Enzymes and coenzymes were from Boehringer-Mannheim.
Glucose Uptake and Lactate Release
Glucose and lactate concentrations were assessed using standard enzyme reagent kits (Glucotest, Monotest Lactate; Boehringer-Mannheim), both based on the production of NADPH+H+ that can be detected photometrically. Glucose uptake and lactate release rates were measured in rotated suspension cultures by incubating 102-104 spheroids of defined average sizes in 50 ml of fresh DMEM. The number of spheroids to be incubated was estimated from the mean spheroid size and the average number of cells per spheroid (Kunz-Schughart et al. 1996). Aliquots of 150 μl medium were taken from each sample at defined time intervals (every hour for Rat1-T1 and MR1 spheroids, after 12 hr for Rat1 and M1 aggregates) and metabolite concentrations were recorded as a function of the incubation time. A total of six to eight aliquots (= time points) was measured per sample, the viable spheroid volume was determined as described earlier, and volume-related release/uptake rates were calculated from the time-dependent changes in the metabolite concentrations.
Results
ATP Distribution in Spheroids
Representative color-coded ATP distributions in central cryosections of ras-transformed tumorigenic Rat1-T1 and MR1 spheroids with a diameter of 920 and 930 μm, respectively, are shown in Figures 2A and 2B. The borderlines between the nonviable core and the viable cell rim are indicated by dashed circles. Rat1-T1 spheroids showed a steep drop of ATP towards the center during growth. As shown in Figure 2A, ATP is homogeneously distributed in the viable cell layer in these spheroids, whereas at a certain size almost no ATP could be found in the nonviable core. MR1 spheroids of the same size showed a different behavior: ATP in the nonviable center was reduced to only around 30% of the value found in the viable cell layer (Figure 2B).
To further analyze the relationship between ATP concentrations, cell quiescence, and viability in MCTS, ATP values from the center (innermost region of 50 × 50 μm of the aggregates) were determined as a function of spheroid size (Figure 3A). For Rat1-T1 spheroids, the ATP distribution reflected not only the thickness of the viable cell rim, which was some 200 μm in large spheroids, but also the development of central cell death. Here, ATP concentration drastically decreased from values of 1.5–2.0 μmol/g in the center of Rat1-T1 spheroids with a diameter of around 500 μm to almost zero in central regions of 800-μm large aggregates. These data imply the onset of ATP reduction with or shortly after the development of cell death, which has been documented at spheroid sizes of 500–600 μm in this particular spheroid type. In contrast to Rat1-T1 spheroids, the decline in central ATP as a function of spheroid size was much more gradual in MR1 aggregates, reflecting a different relationship between cell viability and energy status in the two spheroid types. The ATP level was 1.5–2.0 μmol/g in MR1 spheroids with a diameter of 400–600 μm, dropped to approximately 50% of the initial values in the center of spheroids with developing necroses at sizes of approximately 800 μm, and finally reached minimum ATP of 0 μmol/g in the center of 1200-μm large MR1 spheroids.
The immortalized but non- or poorly tumorigenic ancestors M1 and Rat1 were both characterized by a relatively homogeneous ATP distribution in aggregate culture. Representative ATP images and H&E-stained histological sections are shown in Figures 4A and 4B, showing that ATP concentration in these aggregate types with maximal mean diameters of approximately 200 μm measured around 0.6 μmol/g, which is considerably lower than the central ATP level in small Rat1-T1 and MR1 spheroids by a factor of 3–4, as detailed in Figure 3A. However, taking into account the lower overall cell density of M1 aggregates compared to the other spheroid types, the actual intracellular ATP concentration could be as high as in the ras-transfected tumorigenic counterparts (for details see Appendix). For both immortalized aggregate types, ATP concentrations did not change significantly as a function of location in the spheroids. A slight decrease from the periphery towards the center was seen in some but not all M1 aggregates. This was unexpected because a dramatic loss in cell density from outer to inner aggregate regions was shown for this aggregate type (Figure 4A).
Glucose Distribution and Uptake in Spheroids
Figure 5A represents the color-coded glucose distribution in a Rat1-T1 spheroid with a diameter of 920 μm (parallel section to Figure 2A). Unlike the results of the ATP concentration measurements, glucose distributions in frozen central sections of Rat1-T1 and MR1 spheroids were quite similar. Whereas small Rat1-T1 and MR1 aggregates with a diameter of <600 μm and the periphery of large spheroids showed glucose concentrations close to the medium level between 20 and 25 μmol/g, glucose in the center of large 3D cultures was significantly reduced. This is summarized in Figure 3B, documenting central glucose concentrations as a function of the spheroid diameter. Minimal glucose level in central spheroid regions was 3–5 μmol/g and was detected in spheroids with sizes >900–1000 μm. For the two tumorigenic spheroid types, no clear correlation between development of cell death and/or thickness of the viable cell rim and the glucose distribution could be determined. Despite an earlier emergence of central cell death in Rat1-T1 spheroids, central glucose concentrations were not significantly different in the two spheroid types at similar sizes. Although there was a substantial drop in central glucose concentration with increasing spheroid size for both cell types, values did not fall below a range of 3–6 μmol/g, i.e., a concentration range in which these cells grew well in monolayer culture.
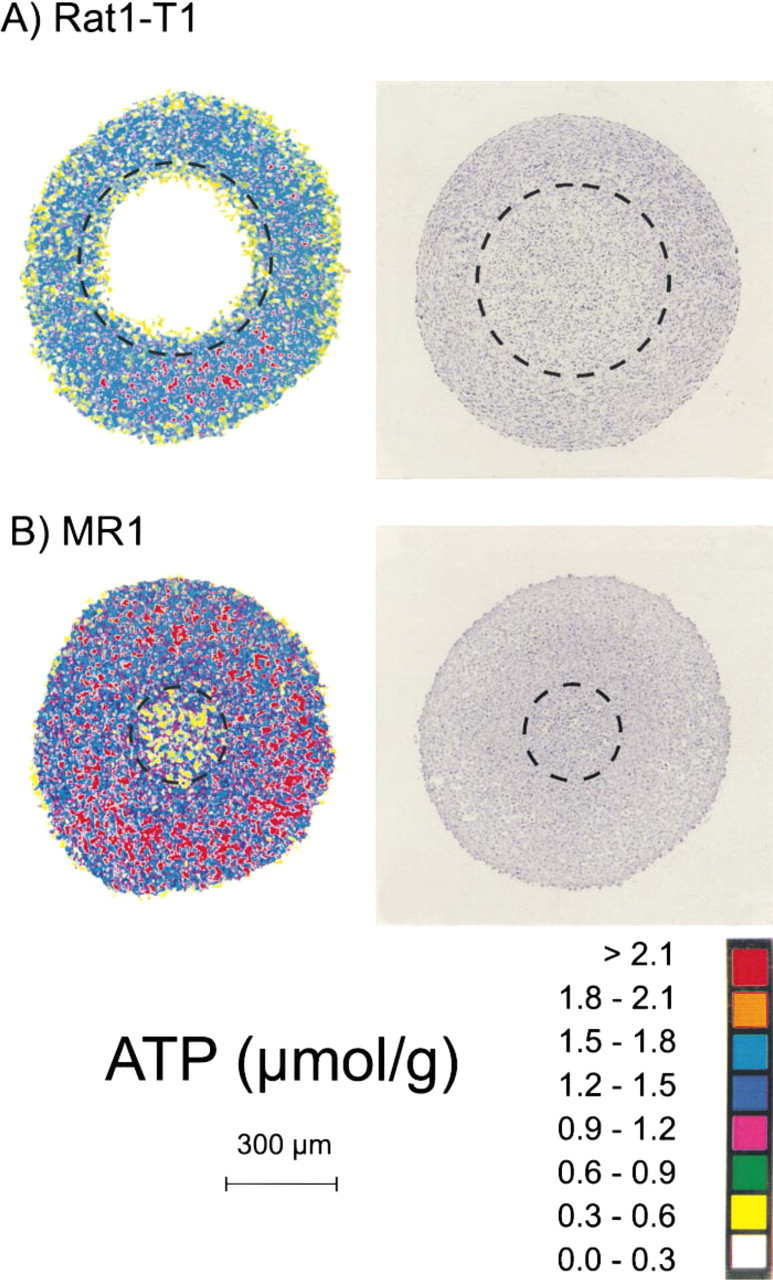
Images of regional ATP distributions and H&E-stained histology in median cryosections of spheroids from REFs transformed to different extents. (
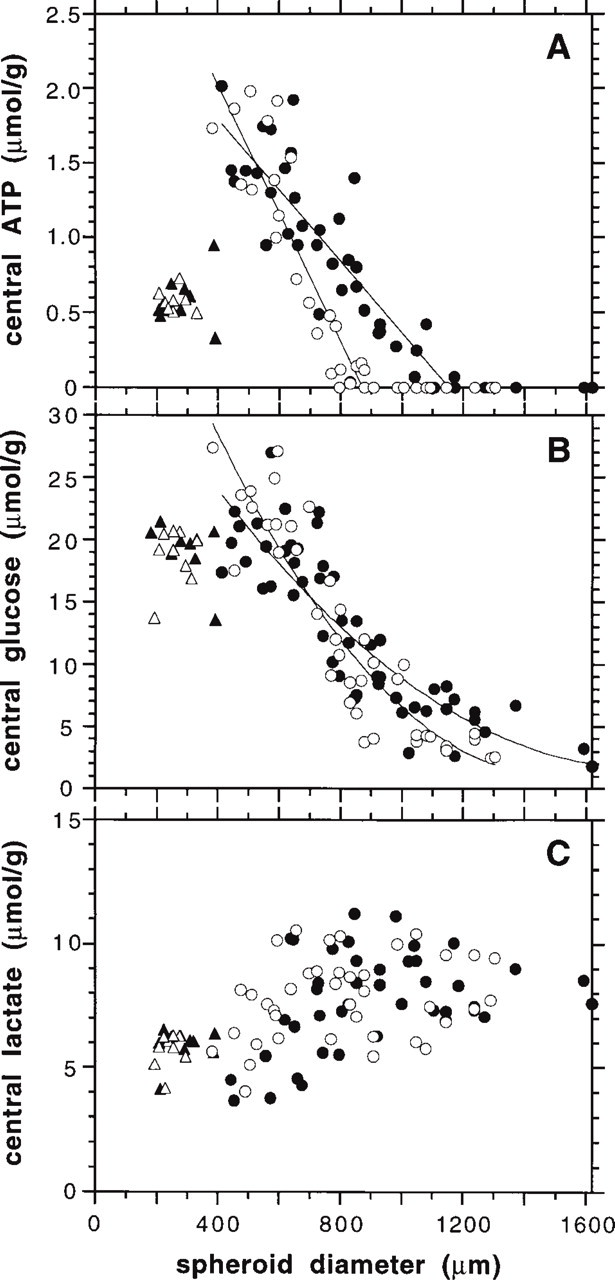
Metabolite concentrations measured with imaging bioluminescence in the center (innermost region of 50 × 50 μm) of spheroids from REFs transformed to different extents as a function of the spheroid diameter. (
The small Rat and M1 aggregates had central glucose concentrations of 20–25 μmol/g, similar to the ras-transfected descendants and almost as high as the glucose level in the culture medium (Figure 3B). Accordingly, there was hardly any glucose gradient within the aggregates.
In addition to similar glucose distribution patterns, determination of glucose consumption rates per viable spheroid volume indicated that Rat1-T1 and MR1 spheroids may differ in their glucose metabolism at sizes of <500 μm. As shown in Figure 6A, glucose uptake per viable volume was substantially higher in small MR1 spheroids with values of (10–12) × 10−8 mol/(s cm3) as opposed to Rat1-T1 spheroids with a diameter between 200 and 400 μm taking up approximately 6 × 10⁻⁸ mol/(s cm3). Spheroid type-specific variations in cell number per spheroid, cell volume, and the ratio of intra- to extracellular space do not account for this metabolic difference as documented earlier (Kunz-Schughart et al. 1996; and unpublished observations) Volume-related glucose uptake rates of Rat1-T1 and MR1 spheroids with a diameter of >400 μm did not differ significantly, being (3–4) × 10−8 mol/(s cm3).
For the immortalized Rat1 and M1 aggregates glucose uptake per volume unit ranged around 4 × 10⁻⁸ mol/(s cm3), which was significantly lower (p< 0.001) than that of the corresponding ras-transfected counterparts at similar sizes. With M1 aggregates, this difference is partly due to the low cell density.
Lactate Distribution and Release in Spheroids
Central lactate concentrations in Rat1-T1 and MR1 spheroids measured as a function of the spheroid size were not significantly different (p > 0.05). As shown in Figure 3C, lactate concentration in the center of these two spheroid types increased in a similar way with increasing spheroid diameter, reaching maximal values of 7–11 μmol/g in spheroids that were 700–900 μm in diameter. Consequently, high lactate levels coincided with the emergence of cell death in MR1 spheroids, whereas the development of necrosis in Rat1-T1 spheroids preceded maximal lactate accumulation. A representative bioluminescence image of lactate in a Rat1-T1 spheroid with a diameter of 920 μm is shown in Figure 5B (parallel section to Figures 2A and 5A).
Lactate concentration the small non-ras-transfected Rat1 and M1 aggregates was 5–6 μmol/g. This is slightly higher than the lactate level in the tumorigenic counterparts at the same spheroid size but is clearly lower than the value determined in the nonviable center of large Rat1-T1 and MR1 spheroids (Figure 3C).
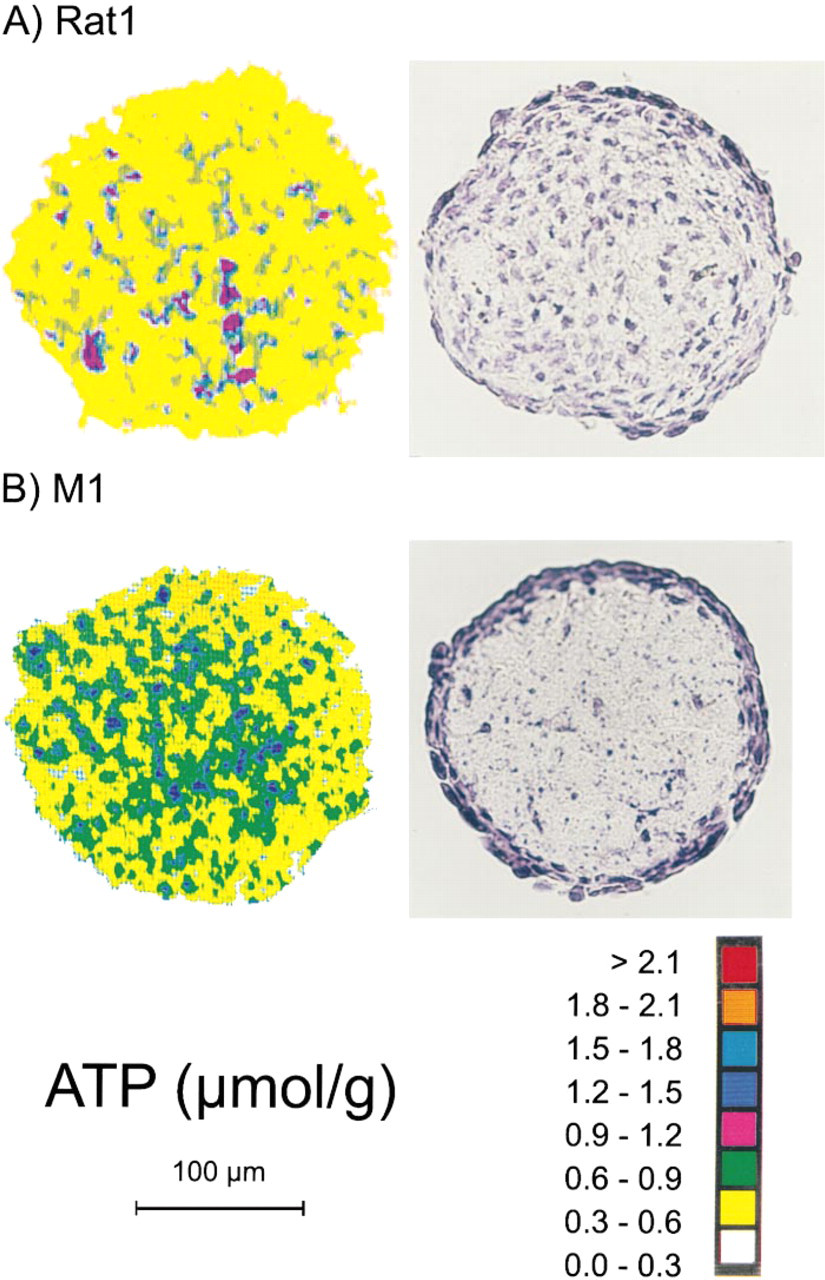
Images of regional ATP distributions and H&E-stained histology in median cryosections of spheroids from REFs transformed to different extents. (
Lactate release rates were in accordance with glucose consumption data showing that MR1 spheroids are characterized by a drastic decrease in lactate release per viable spheroid volume as a function of spheroid diameter, as detailed in Figure 6B. Lactate production was reduced from 16 × 10−8 mol/(s cm3) in MR1 aggregates with a diameter of 200 μm to (5–6) × 10−8 mol/(s cm3) in 1000-μm large spheroids. In contrast, lactate release was relatively constant during growth of Rat1-T1 spheroids, measuring some 8 × 10⁻⁸ mol/(s cm3). Lactate production of both Rat1 and M1 aggregates measured approximately (6–8) × 10−8 mol/(s cm3) and was not significantly different from that in the viable cell rim of large Rat1-T1 and MR1 spheroids (Figure 6B).
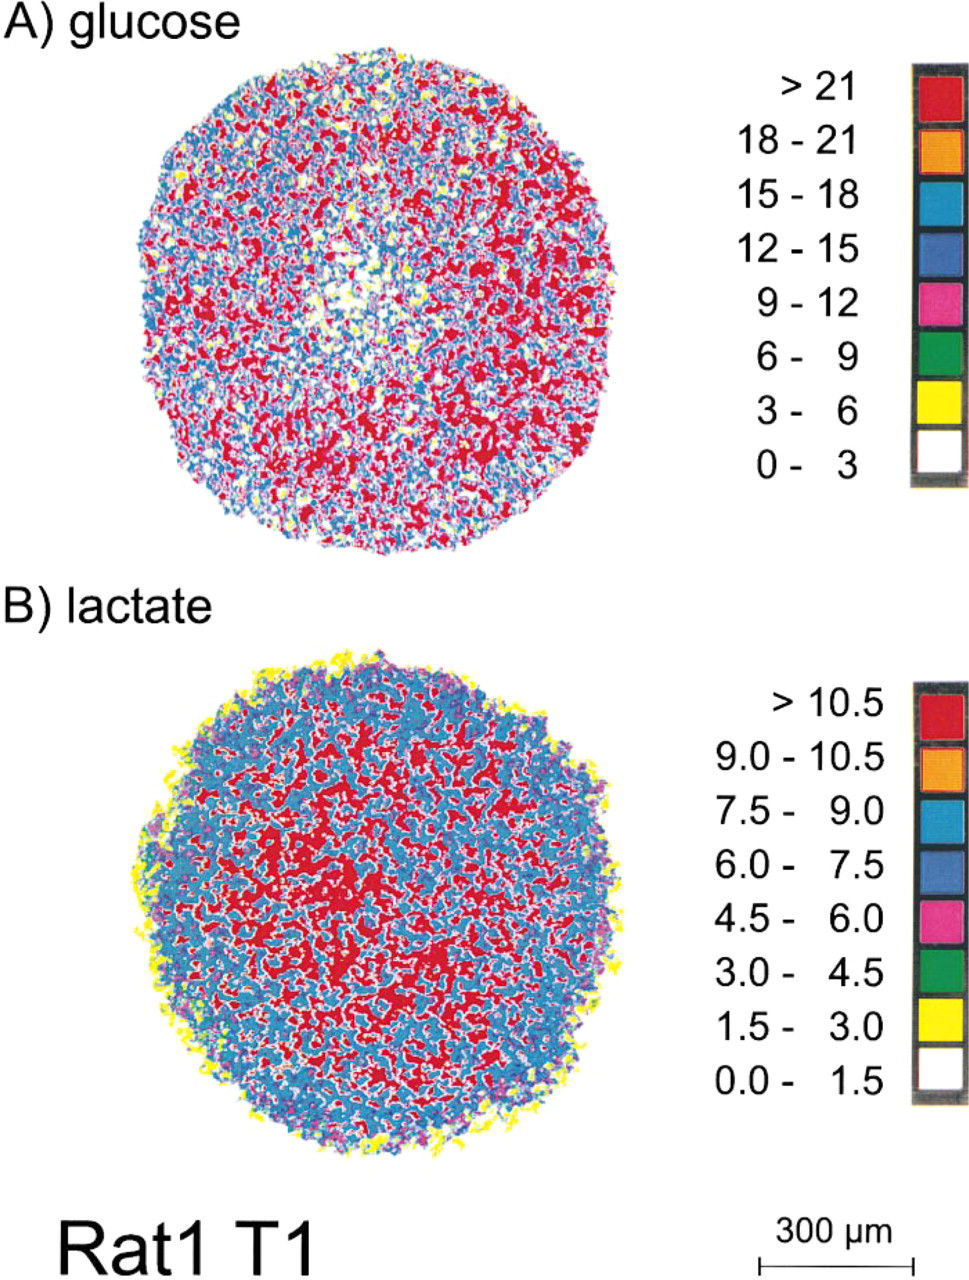
Images of regional glucose (
Apoptotic Cell Death in Spheroids
To determine if the phenomenon of programmed cell death accounts for differences in the metabolite concentrations, particularly in the ATP distribution, of Rat1-T1 and MR1 spheroids, central sections of these two spheroid types with various diameters were analyzed by TUNEL assay. Figure 7A shows a typical result for a Rat1-T1 spheroid (diameter 900 μm). The section was double stained for nuclei (Figure 7A, DAPI fluorescence) and for apoptotic cells (Figure 7B, TUNEL fluorescence). The following observations are to be emphasized. (a) No evidence could be found for enhanced apoptotic cell death in MR1 spheroids compared to Rat1-T1 aggregates. Single cell death via apoptosis occurred in the viable cell rim (arrows) of both spheroid types despite sufficient nutrient availability. We therefore conclude that modifications in the ATP distribution are not due to a different apoptotic behavior of the cells. (b) For both Rat1-T1 and MR1 spheroids, central staining accompanied central necrotic cell death. Here, the TUNEL assay did not allow discrimination of apoptotic and necrotic cells in the center.
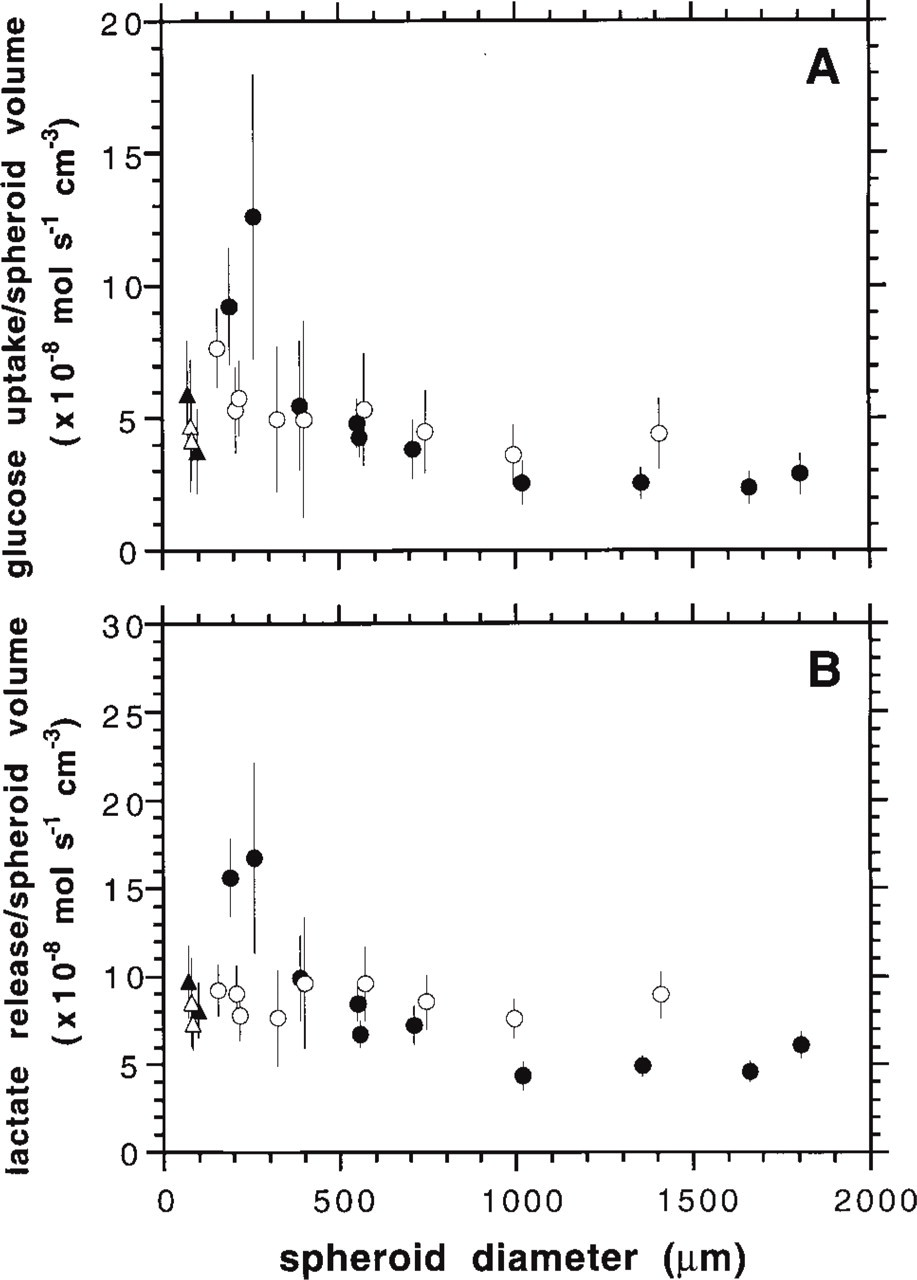
Glucose uptake (
Discussion
It has been controversially discussed in the literature that changes in tumor energy metabolism, as indicated by the cellular ATP level, may be correlated with oxygen and glucose supply and/or with cell cycle arrest and emergence of cell death in vivo and in vitro (Fu et al. 1990; Freyer et al. 1991; Vaupel et al. 1994; Kroeger et al. 1995; McCoy et al. 1995; Nordsmark et al. 1995; Vaupel 1996). Histographic mapping of ATP in tumors as well as in MCTS using imaging bioluminescence (Mueller-Klieser and Walenta 1993) revealed a coincidence of the onset of cell necrosis and decline in ATP concentration (Mueller-Klieser et al. 1991). It was shown by Freyer and co-workers (Freyer 1994; Freyer and Sutherland 1985; Freyer et al. 1984) that cell cycle arrest in spheroids accompanying volume growth retardation is associated with a reduction in cellular oxygen consumption rates in several cell lines. In addition, a decrease in mitochondrial activity of quiescent spheroid cells has been documented more recently, allowing the speculation that energy metabolism is reduced in these cells (Kunz-Schughart et al. 1997; Freyer 1998).
The tissue oxygen partial pressure (pO2) is an important parameter affecting and reflecting tumor metabolism. In a previous study, oxygen-sensitive microelectrodes were used to register pO2 gradients in the four spheroid types investigated in the present study (Kunz-Schughart et al. 1996). A reduction in pO2 from the periphery towards the spheroid center was recorded for Rat1-T1 and MR1 spheroids. This reduction is accompanied by a decrease in mitochondrial activity as a function of location in the aggregates determined by flow cytometry after spheroid dissociation (Kunz-Schughart et al. 1997). The pO2 in the spheroid center is mainly determined by the oxygen consumption and diffusion in the spheroid, and reflects the oxygen supply conditions of cells in deeper layers of the spheroids. In both Rat1-T1 and MR1 3D cultures, central pO2 values decline during spheroid volume growth, but the decrease is much more pronounced for Rat1-T1 spheroids, as indicated in Figure 8.
The transition of viable cells to a nonviable state, indicating the onset of cell death, emerges in the center of Rat1-T1 spheroids in the presence of ATP concentrations that can be measured in viable tumor and normal tissues (Walenta et al. 1990; Mueller-Klieser et al. 1991; Mueller-Klieser and Walenta 1993; Schwickert et al. 1995). The observation that cell quiescence and cell death can be determined before or parallel to a steep drop in ATP (Figure 8A) leads to the hypothesis that cell destruction in these spheroids is not directly related to the availability of chemical energy. This is further supported by the finding that the central concentrations of glucose and lactate at the onset of cell death are no different from those in small non-necrotic spheroids. In addition, the central lactate concentration appears to be too low to have a serious cytotoxic effect. Concomitantly, no reduction in glucose consumption or increase in lactate production was shown, i.e., the onset of necrosis was not accompanied by metabolic alterations in the viable spheroid regions. In contrast to these metabolites, a drop in central pO2 to 0 mmHg coincides with the emergence of central cell death (Figure 8A) and precedes the reduction in the ATP level. We conclude that the cells in the center of Rat1-T1 aggregates are capable of coping with their energy demand as long as oxygen is present. Only with the lack of oxygen do Rat1-T1 cells die and ATP subsequently begins to drop. Because the major part of the glucose is converted into lactate without oxygen consumption, cell death does not appear to be due to a breakdown of energy metabolism via inhibited respiration.
These data are in accordance with findings obtained in EMT6/Ro spheroids, a cell line originating from a mouse mammary sarcoma, showing rather high ATP concentrations at the emergence of central cell death (Walenta et al. 1990). Constant levels of high-energy phosphates in EMT6/Ro and 9L spheroids throughout growth were also shown by 31P-NMR spectroscopy (Freyer et al. 1990, 1991), even under reduced levels of oxygen and glucose. In conclusion, Rat1-T1 spheroids behaved similar to several other tumor spheroid types studied earlier in terms of oxygen distribution (e.g., Mueller-Klieser and Sutherland 1982, 1983; Freyer and Sutherland 1986; Groebe and Mueller-Klieser 1991; Acker and Carlsson 1992) and glucose availability (Freyer and Sutherland 1986; Goellner et al. 1991; Teutsch et al. 1995). Despite an unchanged metabolic milieu in the center of the spheroids, a decrease in proliferation occurs. The intrinsic genetic properties of the cells, together with the cell-cell and cell-matrix interactions in the tissue-like 3D environment, could induce cellular processes leading to cell-cycle arrest and even cell destruction in the presence of sufficient nutritive supply.
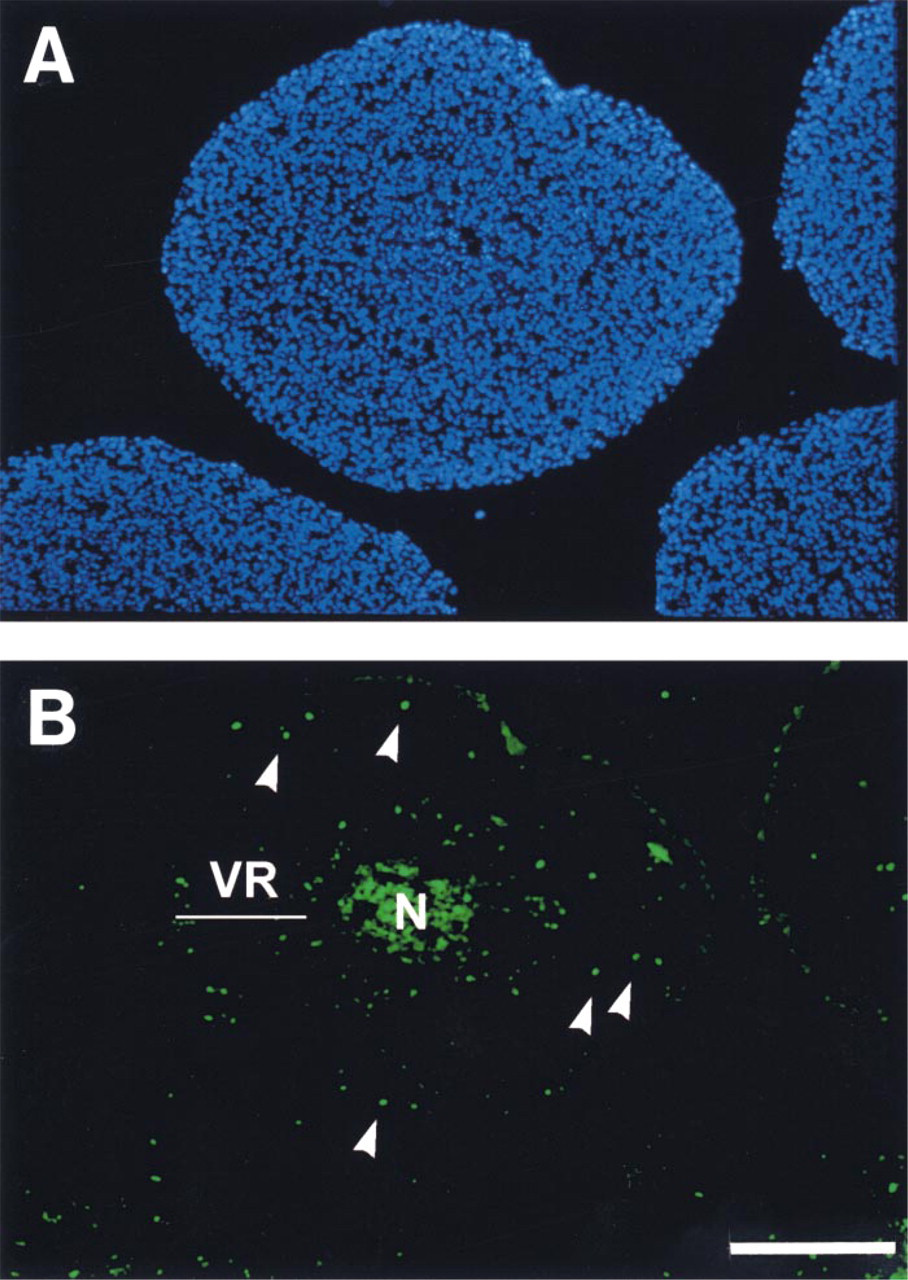
Immunohistochemical staining of (
In contrast to Rat1-T1 spheroids, myc/ras-co-transfected MR1 spheroids show a pronounced reduction in the ATP concentration. This decrease occurs not only in the viable regions close to the nonviable core but also in the spheroid center as a function of the spheroid size, and it precedes the emergence of a histomorphological nonviable region (Figure 8B). The decrease in ATP is paralleled by enhanced cell quiescence (see above), indicating that a 50% reduction in central ATP level in MR1 spheroids accompanies cell-cycle arrest, mainly in the G1/0-phase (Kunz-Schughart et al. 1997). Glucose consumption and lactate production of MR1 spheroids decreased significantly during growth, and the central pO2 reached values around zero at diameters of some 600 μm, whereas a visible necrosis developed at diameters of around 800 μm (Figure 8B). The corresponding increase in spheroid size of 200 μm was recorded over a period of roughly 2 days, indicating that central regions of these spheroids were chronically hypoxic or even anoxic during this time. Obviously, the cells in the inner region of these aggregates can resist hypoxia for around 48 hr. Therefore, the decrease in central glucose and ATP concentrations and the concomitant lactate accumulation documented in the present study imply that energy metabolism was significantly impaired after this time interval. Presumably, the reduced metabolism is the ultimate cause of cell death in the center MR1 spheroids.
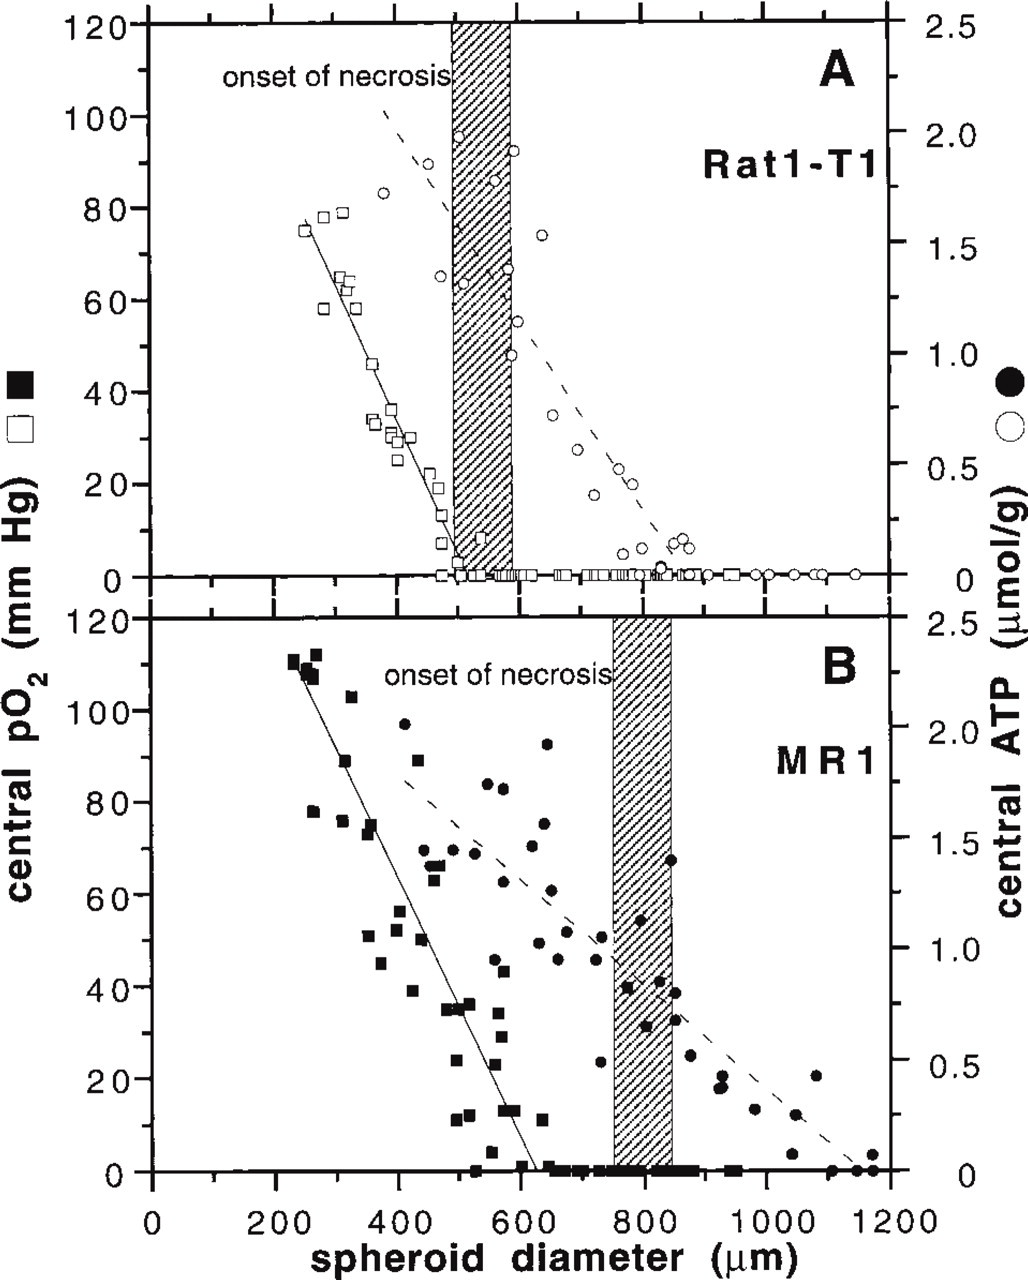
Central oxygen partial pressure (pO2) and ATP concentration in (
In summary, spheroids of the two tumorigenic cell lines showed a different metabolic milieu at the onset of central cell death, which is true despite identical growth conditions, i.e., identical nutritional supply throughout all experiments. Obviously, differences in the morphological structure, the proliferation and growth behavior, and the metabolism of the spheroids investigated are the result of relatively small differences in the transformation process, i.e., two different modes of immortalizing the precursor cell. The present results, together with previous data, suggest that myc-transfection compared to spontaneous immortalization in fully transformed cell lines (MR1 vs Rat1-T1) confers a higher proliferation rate and a substantial resistance to hypoxia by the tumor cells (Kunz-Schughart et al. 1997).
Giaccia and associates showed that the myc oncogene is involved in the balance between cell proliferation and cell death by apoptosis (Alarcon et al. 1996; Graeber et al. 1996). Overexpression of c-myc enhanced the rate of proliferation, but cells under hypoxic conditions could be forced to enter the apoptotic pathway. Because it has been well documented that the induction of apoptosis requires ATP and protein synthesis, intracellular ATP concentration can be decisive for cells whether they die through necrosis or apoptosis (Leist et al. 1997). Although the TUNEL assay did not allow discrimination of necrotic and apoptotic cells in the spheroid center, the fact that morphologically intact MR1 cells in the center of large spheroids are under hypoxic conditions for up to 48 hr and show a reduction in the ATP level before histomorphological cell death supports the hypothesis that these cells initially die by apoptosis. In contrast, no difference in the rate of apoptotic cell death was documented for Rat1-T1 and MR1 cells in the viable cell rims, i.e., in an oxygen-containing environment.
In Rat1 and M1 aggregates, relatively low ATP concentrations of around 0.6 μmol/g were registered, although central cell destruction has been detected solely in M1 spheroids. Because of the lower cell density in M1 spheroids, it is likely that the intracellular ATP concentration could be as high as in the ras-transfected counterparts. Because ATP concentration did not change as a function of location in M1 aggregates despite a mean viable cell rim of only 30 μm, we conclude that cell destruction is not complete with regard to function, i.e., that there are still some metabolic activities in the center of these 3D cultures. This hypothesis is supported by pO2 measurements showing that oxygen profiles decrease towards the center of M1 aggregates, which can only result from oxygen-consuming processes. However, central pO2 in M1 aggregates is relatively high, with values of 80–100 mmHg. There are two potential explanations for this behavior. (a) Some cells in the histologically destroyed area survive, accounting for a basic metabolic rate, or (b) cell destruction in M1 aggregates results from programmed cell death, which has been shown to be induced in fibroblasts by myc transfection (e.g. Aldridge et al. 1995; Helbing et al. 1998; Rupnow et al. 1998). Apoptosis is an energy-requiring process and is accompanied by the production of membrane-bound cellular fragments (e.g., Kass et al. 1996; Leist et al. 1997). These fragments could contain intact, functional mitochondria which, in turn, could account for some oxygen consumption in histomorphologically nonviable zones, i.e., we presume that such mitochondria could be metabolically active despite the fact that the cells are “dead.”
Aggregates of both non-ras-transfected cell lines showed sufficient glucose and oxygen supply. However, the metabolic rates, as indicated by the glucose consumption, lactate production, and the proliferative activity (TLI <10%; Kunz-Schughart et al. 1996) were relatively low compared to the tumorigenic counterparts. These data imply that not only cell cycle arrest but also low ATP concentrations (in the case of Rat1 aggregates) may occur in 3D culture despite sufficient oxygen and glucose supply and without accumulation of cell-destructive levels of lactate.
Because knowledge about the correlation between oncogene expression and metabolism is still sparse (Olah et al. 1990; Golshani 1992; Dang et al. 1997), the cell system used here represents an advantageous model for further studies on the interrelationship among oncogenes, tumorigenic conversion, metabolism, and cell death in a three-dimensional microenvironment.
Appendix
Methodological Aspects
The reliability of quantitative enzyme histochemical assays, such as imaging bioluminescence, is influenced by several factors, including section thickness, cell density, availability of the metabolite in the tissue section for the exogenous enzymes in the bioluminescence solution, and endogenous enzyme activities in the tissue interfering with the detection step (Van Noorden and Frederiks 1992; Geerts et al. 1997). The overall concentration values obtained by imaging bioluminescence were confirmed by independent measurements using standard enzymatic photometric methods or HPLC. For each metabolite, a statistically significant correlation of the concentrations obtained by the different methods was found (Walenta et al. 1990; Mueller-Klieser and Walenta 1993). Previous methodological studies showed a close linear correlation of the signal intensity and the section thickness, which indicates that there is no limited access of the detection enzymes to the metabolites. The lateral diffusion of the metabolites was reduced by adding PVP (see above) to the enzyme solutions (Van Noorden and Frederiks 1992).
The accurate calibration of the light intensities is based on a more or less constant cell density of the tissues. The cell densities of the spheroids were calculated using the viable volume and the corresponding cell number of the cell aggregates. The cell densities in Rat1, Rat1-T1, and MR1 spheroids are largely the same (5.2, 4.8, and 4.1 × 10⁸ cells/ml), whereas in M1 spheroids the cell density in the viable cell layer is approximately two to three times lower compared to the other types. As a consequence, ATP values will be underestimated in M1 spheroids, because ATP is located only intracellularly.
Footnotes
Acknowledgements
Supported by the Deutsche Forschungsgemeinschaft (grants Mu 576/2-4, Mu 576/4-1, Ku 917/1-1, and Ku 917/2-2).
We thank Dr A. Simm (Institute of Physiological Chemistry II, University of Wuerzburg, Germany) for providing oncogene-transfected rat embryo fibroblasts.