
Abstract
This report presents the high-resolution image acquisition and processing instrument for compound management applications (HIAPI-CM). The HIAPI-CM combines imaging spectroscopy and machine-vision analysis to perform rapid assessment of
Keywords
Introduction
With the evolution of reliable high-throughput screening (HTS) automation, 1 large libraries of drug-like compounds are screened for pharmacologic activity in pharmaceutical, biotechnology, and academic screening facilities throughout the world. Because the cost of a typical compound averages between $10 and $100/mg, 2 many HTS centers select microtiter plates (MTPs) as the preferred vehicle for compound storage and handling. Although compound library size varies 3 at different research facilities, the vast majority are solvated in dimethyl sulfoxide (DMSO). As DMSO-solvated liquids, compounds are easily formatted into high-density MTPs (e.g., 384-well, 1536-well), which are ideally suited for containing the minuscule amount (10–100 μL) of compound necessary for HTS studies. In many cases, a research facility may have several copies of its library, either stored directly on the HTS platform or in longer-term cold storage. 3,4
As HTS libraries are solvated in DMSO, they are subject to the introduction of artifacts (Fig. 1). Unfortunately, DMSO is hygroscopic and susceptible to water assimilation. Therefore, compounds stored as DMSO-solvated HTS libraries degrade over time through exposure, such as freeze-thaw cycles or storage in humid environments. 5 –8 As a consequence, artifact may be introduced to an HTS library, in the form of sample precipitation or compound hydrolysis. Additional artifacts may be introduced by typical activities in a compound management operation. For example, a liquid handler may fail to correctly aliquot a compound from a source MTP to a destination plate; this error may result in an empty or partially filled well in the destination plate. Alternatively, a particular compound sample may be over-sampled by a hit-picker, resulting in an empty well in the source MTP. A colored compound may also be considered as an artifact; for example, its absorbance spectrum may overlap with the fluorescence or luminescence generated by an HTS assay reagent. Lastly, archival errors in an outdated or poorly maintained laboratory information management system (LIMS) can also complicate HTS screening efforts from the generation of mismatched biological and chemical data.
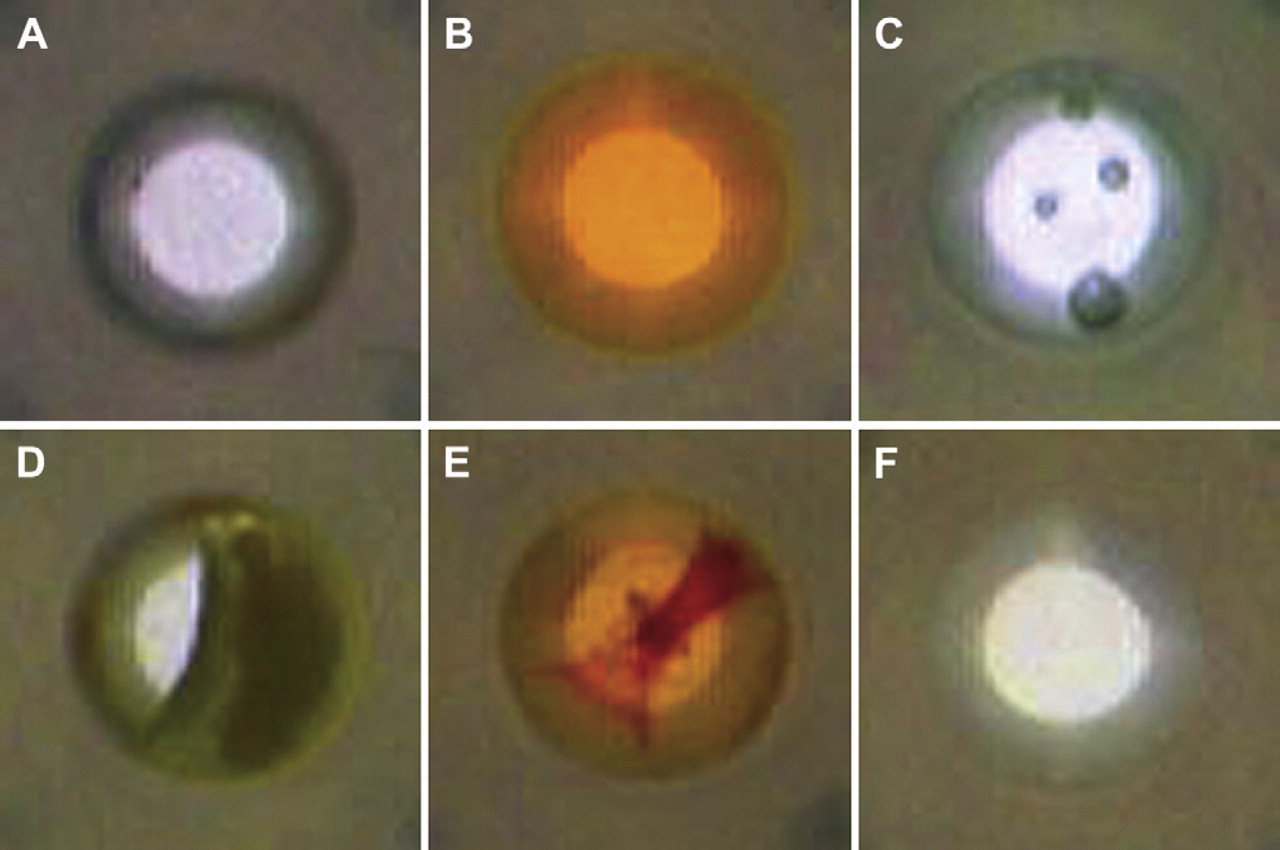
Common artifacts found in MTP-based HTS compound libraries. Artifacts observed in individual wells of a 384-well MTP are illustrated: (A) an empty well, (B) a well containing colored compound, (C) a well with bubbles, (D) a partially filled well, (E) and a well containing precipitate. For comparison, an image of a “normal” DMSO-filled well (F) is included. The HIAPI-CM detects and classifies all these artifacts in an automated fashion with high fidelity.
The challenges in quality assurance (QA) and quality control (QC) of compound libraries have led many facilities to use traditional analytical instruments for periodic “spot” inspections of an HTS library during its lifecycle. Unfortunately, these technologies are ill suited for screening the vast number of compounds contained in HTS libraries. At present, liquid chromatography—mass spectrometry (LC–MS) instrumentation is the gold standard that combines the physical separation capabilities of liquid chromatography (i.e., purity) with the mass analysis capabilities of MS (i.e., compound identification). In practice, LC–MS is limited to small batch validations, because it requires extensive analysis times, destructive sampling, and large consumable expenses. 9 Nephelometry is limited to precipitate detection and can be unreliable. 10,11 Acoustic auditing devices are used with some success to monitor solvate composition and volume in MTPs. 12 –15 However, this type of instrumentation cannot distinguish different well artifacts (i.e., precipitate/crystals from oil, bubbles, or color) and is limited to analysis of proprietary MTPs, requiring costly replating of large HTS libraries to realize its application. Moreover, the sample throughput of all these technologies is too slow to be capable of performing rapid, routine surveys of entire library collections. To date, the most popular method to diagnose well artifacts is through visual inspection. Obviously, this manual technique is fatiguing and subjective. In larger HTS libraries, visual inspection is virtually impossible. 5
In an effort to address this unmet need, we have developed a novel machine-vision-based technology referred to as the high-resolution image acquisition and processing instrument for compound management applications (HIAPI-CM). The HIAPI-CM provides an innovative solution to MTP inspection through the use of dual-image analysis. By incorporating visible (VIS) and infrared (IR) imaging spectroscopy, it can be used for rapid detection of common artifacts found in MTP-based HTS compound libraries. The instrument performs three simultaneous measurements in a noninvasive fashion, namely: (1) discrimination of empty and partially filled MTP wells, (2) detection of insoluble compound crystals/precipitates, and (3) identification of potential colorimetric interferents. It can display results through a user interface (UI), or compare its results to those in a LIMS for fully automated QA methods. In this article, a description of the HIAPI-CM, its software and performance in a pilot study is presented.
Instrument Overview
HIAPI-CM uses dual-image analyses, using VIS and IR images taken with a charge-coupled device (CCD) camera. Fabricated and integrated at our research facility, it consists of a color CCD camera (detector), automated MTP loader, telecentric imaging lens, plate barcode reader, and dual-mode illuminator. Instrument control and image analysis computers are located underneath the optical/mechanical tower within a mobile rack enclosure (Fig. 2). This unit is compact and portable, readily carted to serve multiple sites as needed.
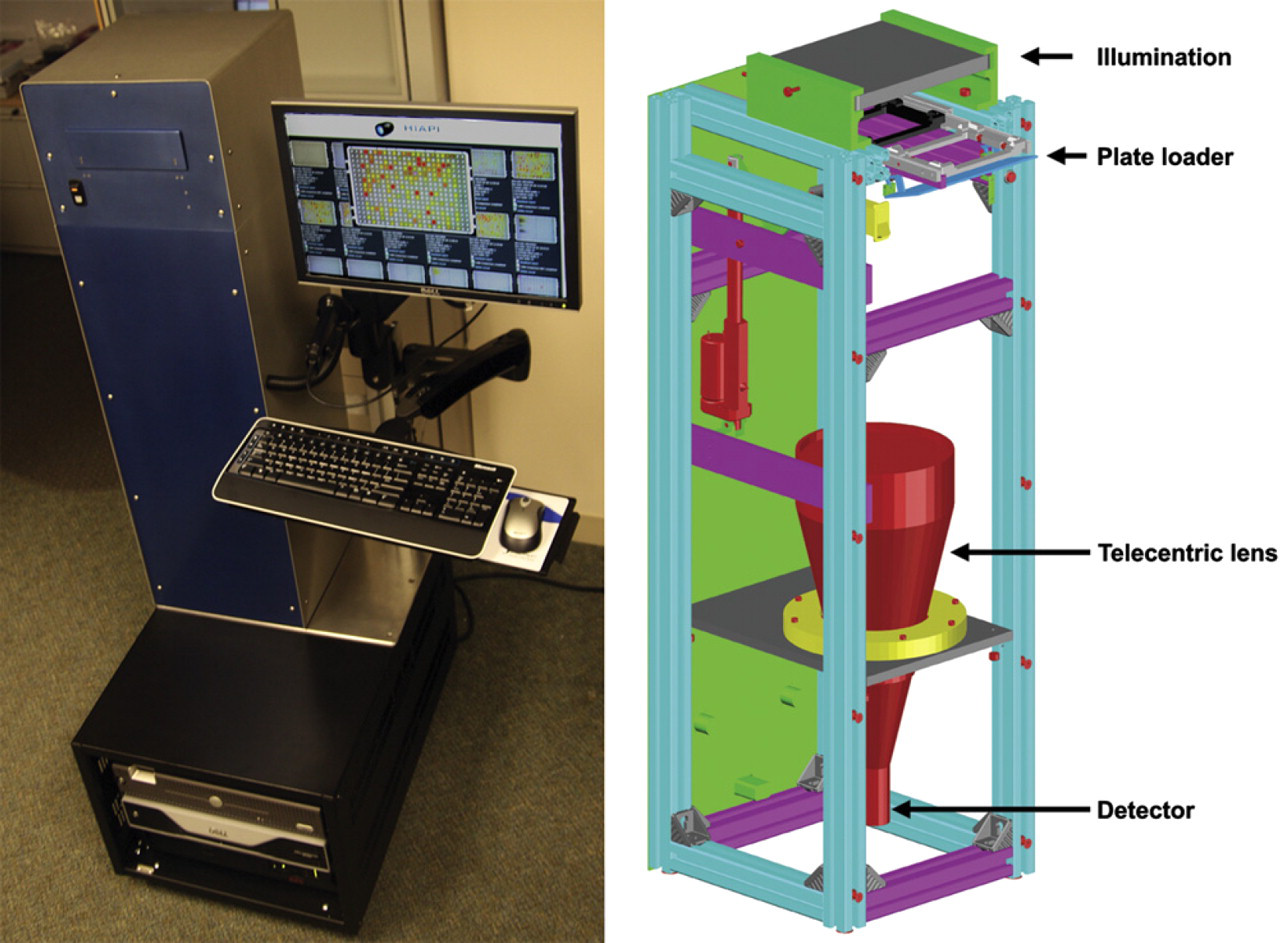
The HIAPI-CM. Shown on the left is the HIAPI-CM with a fully functioning plate loader, barcode reader, and servers in the mobile computer rack below. On the right, a CAD rendering of the prototype's interior with a light illumination configured for a “bottom plate read” mode is illustrated. A telecentric lens allows for a full plate imaging by the detector. Complete analysis is approximately a minute per plate.
A distinguishing feature of the HIAPI-CM is its use of a custom telecentric lens coupled to a high-resolution, progressive-scanning five-megapixel CCD camera. This optical arrangement is capable of imaging the entire MTP without a need for repositioning. With a depth of field of ∼12 mm, the lens produces negligible perspective and focal errors, and the instrument is able to resolve features to ∼60 μm with minimal vignetting. Consequently, the HIAPI-CM is capable of detecting artifacts missed by manual inspections.
A customized light source was designed, fabricated, and integrated on the HIAPI-CM to provide illumination using either VIS or IR light. As seen in Figure 3, IR imaging reveals hidden artifacts (i.e., precipitate/crystals) that may otherwise be masked by color. The illuminator requires no warm-up period for even illumination and instantaneously toggles between VIS and IR modes. This feature allows for multiple image analyses across the MTP field in ∼1 min, and is not limited to any appreciable extent by MTP format density (i.e., 96-, 384-, 1536-wells). Transmission mode illumination is used in the presented setup, with images taken from the bottom of the MTP.
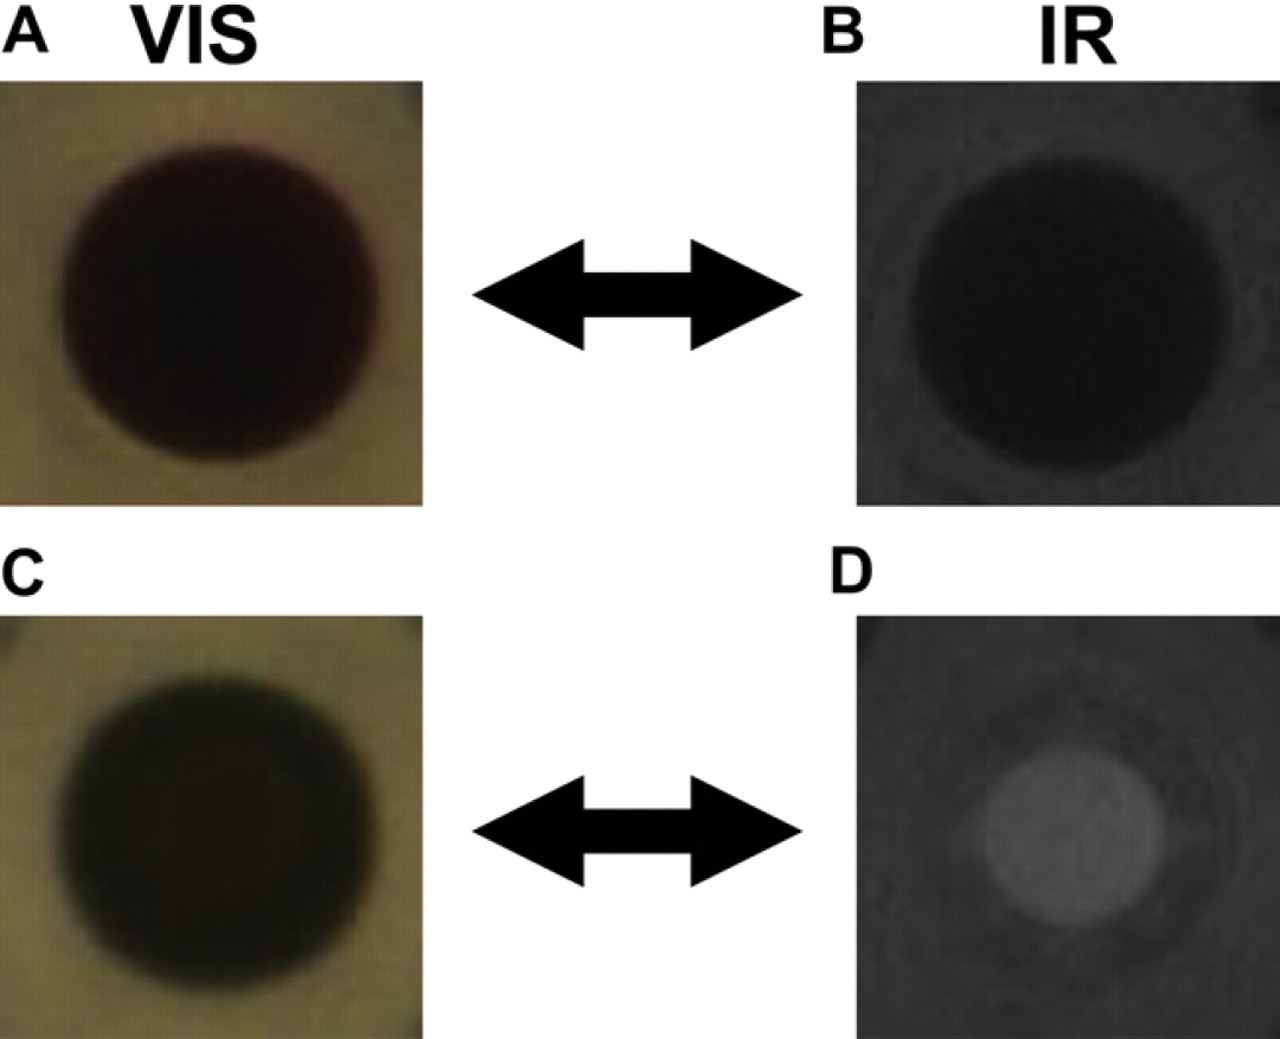
HIAPI-CM distinguishes colored compounds from precipitate. All images from 384-well MTPs. VIS-light images (A, C) of colored compounds can mask the presence of precipitate. However, the HIAPI-CM's IR images of these same wells clearly identifies the top well (images A and B) as containing insoluble precipitate, whereas the bottom well (images C and D) as containing solubilized compound.
Of equal importance to the HIAPI-CM hardware is its use of customized
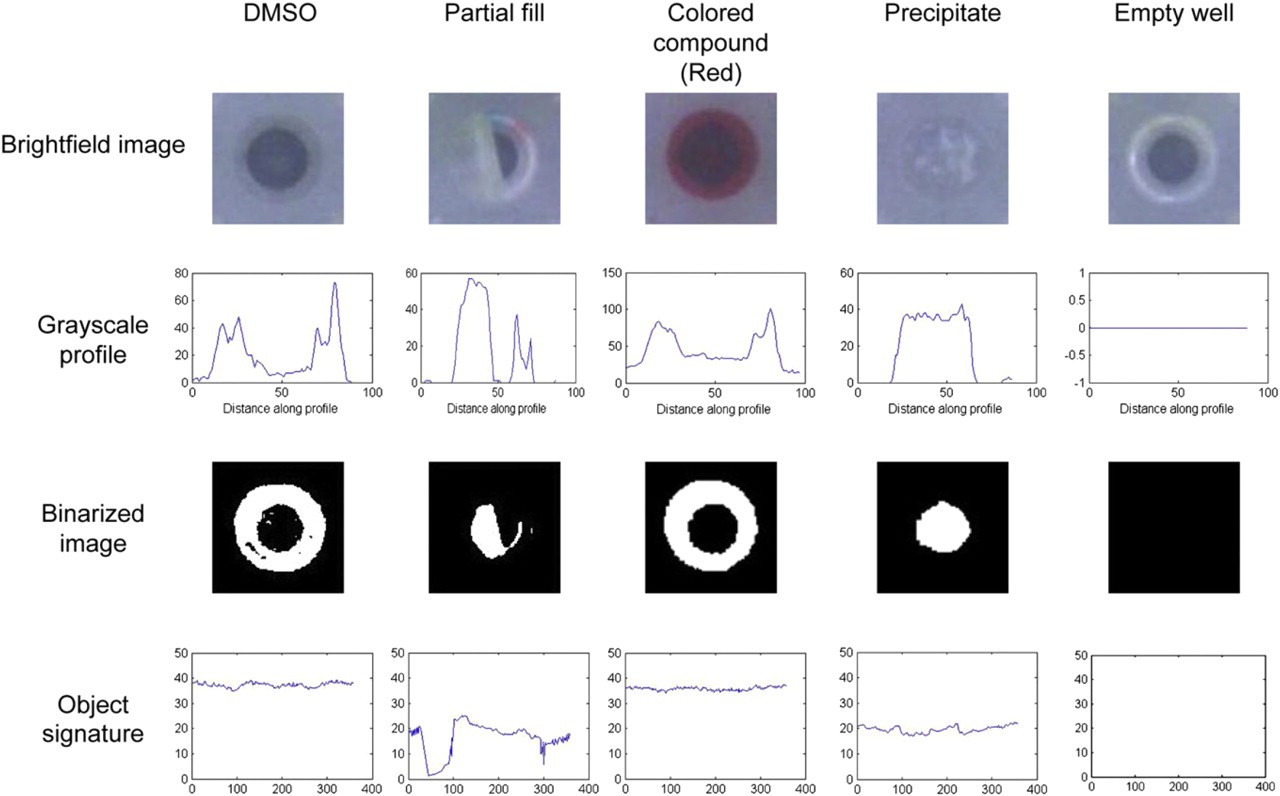
Machine-vision techniques resolve common artifacts found in HTS compound libraries. Examples of a “normal” (DMSO-filled) well and four different artifact types found in individual wells of a 384-well MTP are presented. From left to right, the wells are a DMSO-filled well, a well partially filled with DMSO, a well containing colored compound, a well with precipitated compound, and an empty well. All wells can be analyzed and categorized via the HIAPI-CM's machine-vision analysis technology.
UI Software
A UI and associated computer hardware facilitates the seamless deployment of the HIAPI-CM. Two computers are located on the HIAPI-CM platform (Fig. 2). The first is a “client” that controls the instrument and runs the image acquisition software, whereas the other hosts the Apache web and structured query language database (MySQL) applications, which are used for the storage and retrieval of archived images and metadata. As unprocessed camera raw images are acquired within ∼250 μm, most of the image analysis time (∼1 min) is expended for machine-vision processes and database storage.
Figure 5 presents actual MTP images from the customized HIAPI-CM software, as viewed through the UI. A 384-well polypropylene plate (Greiner, USA) containing DMSO-solvated compounds with various artifacts is shown in the unprocessed raw image. This raw image is juxtaposed to images where the HIAPI-CM has displayed the results of its analysis. As seen in the figure, classification of wells containing colored samples, precipitate, and different volumes of sample are easily viewed through the interactive UI software and easily identified by the user. The HIAPI-CM is also capable of comparing its analysis results to those archived in a LIMS database via an SQL query. Similar to the flagging of other artifacts, the UI software highlights wells that have conflicting status between the HIAPI-CM and LIMS databases. Alternatively, the user can elect an ad hoc analysis where no database comparison is performed. If the LIMS comparison is not chosen, any well that deviates from those properties of a “normal” well (i.e., a well filled with DMSO) will be classified and tagged by the HIAPI-CM.
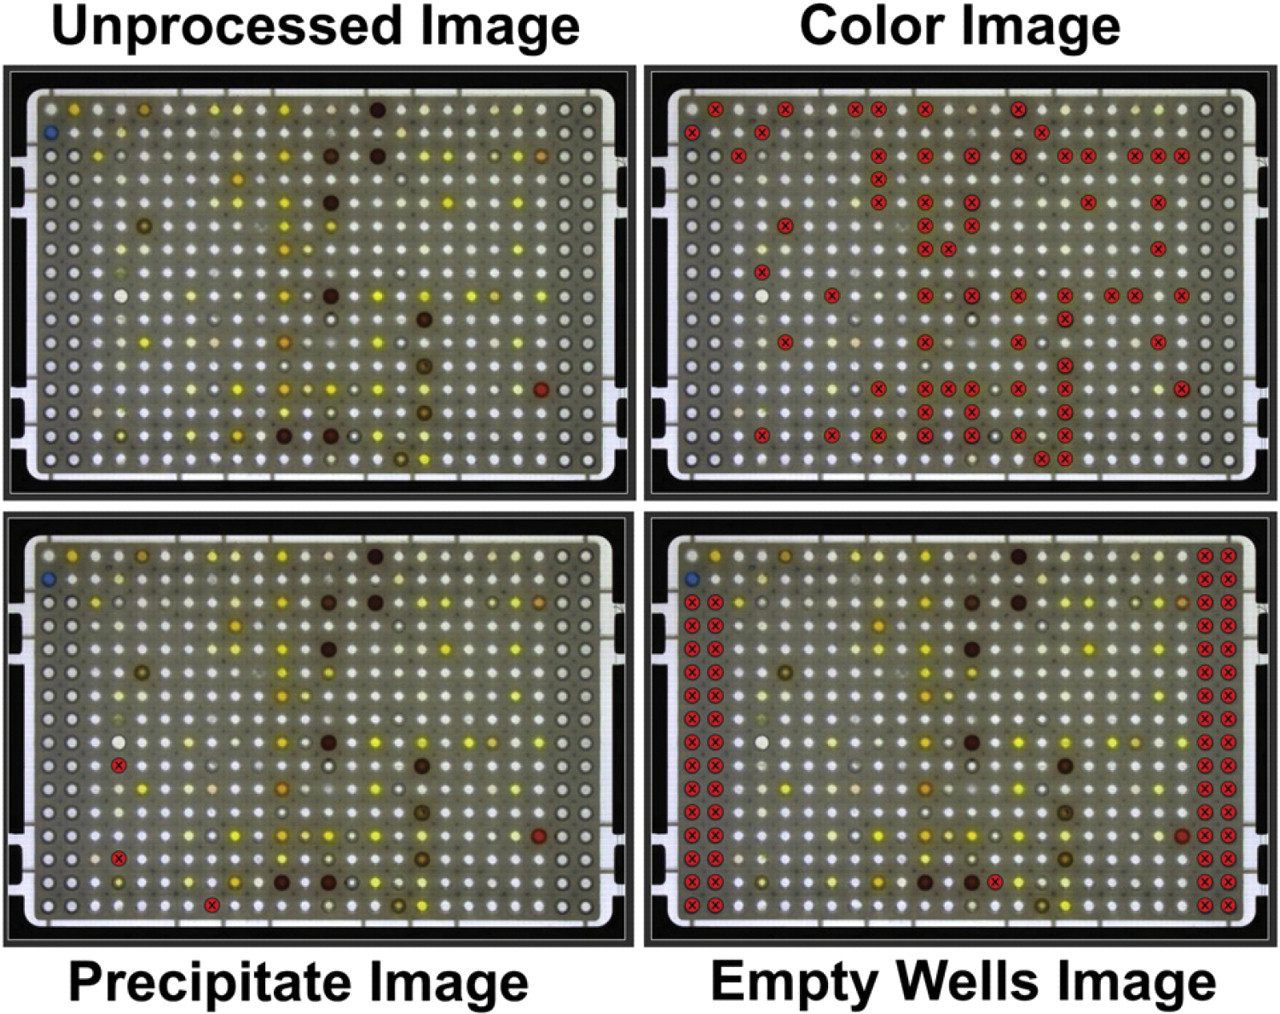
Results of HIAPI-CM analysis, as viewed through the UI. An unprocessed image (top left) is presented with other annotated images resulting from HIAPI-CM analysis. The UI displays a circle over wells, which HIAPI-CM has identified as problematic. An image of wells annotated as containing colored sample (top right), wells containing precipitate image (bottom left), and empty wells image (bottom right) provide a quick reference for users to locate artifacts within the MTP. The UI also allows the user to update the HIAPI-CM database.
Postanalysis, the UI software permits manual corrections, which facilitates software development and training efforts. However, the HIAPI-CM has been designed to run fully automated with a capability of exporting flat-text files that summarize results. The HIAPI-CM database archive also allows users to search and select images from any particular plate (retrievable by barcode or HIAPI-CM assay date) as might be necessary for long-term QC/QA inspection and intervention.
HIAPI-CM Pilot Study
To demonstrate “proof-of-concept,” a small inventory of 15 HTS compound library plates (384-well format) with known artifacts were analyzed using the HIAPI-CM. The HIAPI-CM results were compared with manual inspections (performed visually by eye). The HIAPI-CM took 15 min to complete its analysis, including plate loading and unloading; in contrast, the manual inspections took 75 min. The HIAPI-CM successfully detected many of the artifacts found through manual inspection with high fidelity (Table 1).
Results of manual (visual) and HIAPI-CM pilot study (
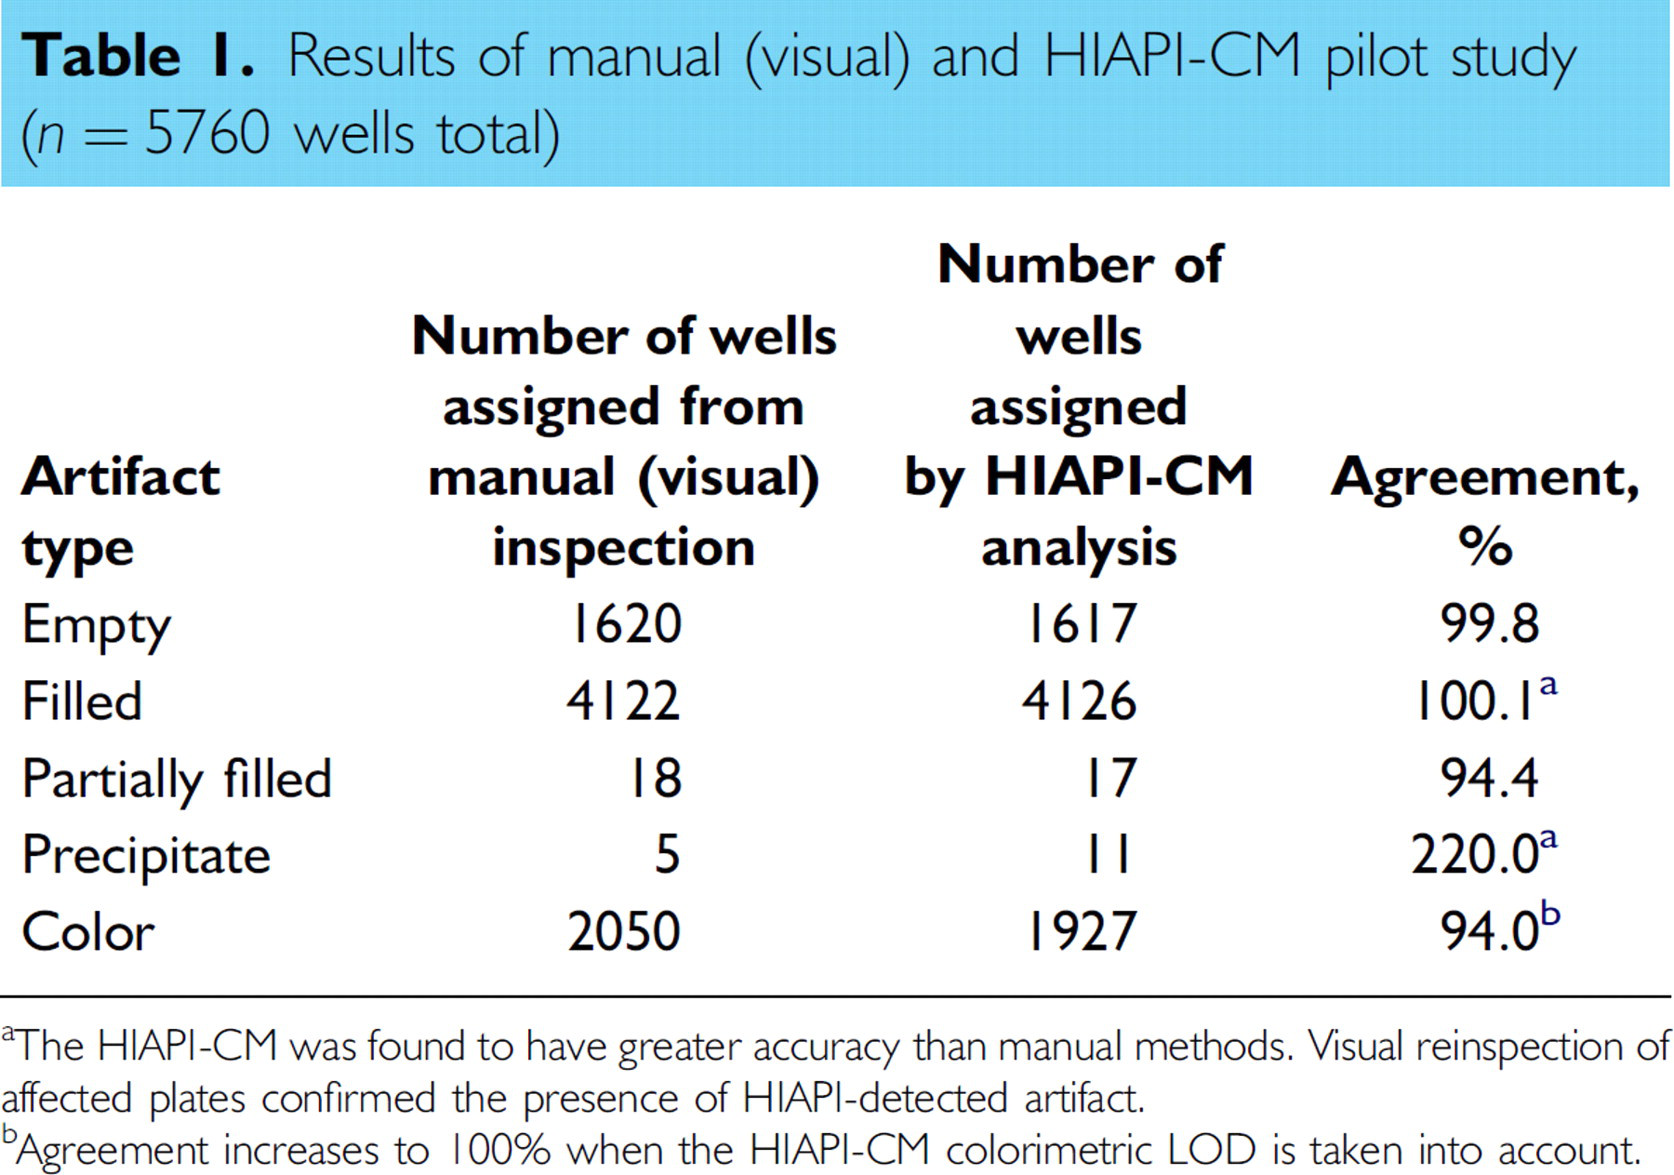
The HIAPI-CM was found to have greater accuracy than manual methods. Visual reinspection of affected plates confirmed the presence of HIAPI-detected artifact.
Agreement increases to 100% when the HIAPI-CM colorimetric LOD is taken into account.
Discussion of the HIAPI-CM's detection fidelity provides insight into different aspects of the HIAPI-CM software and hardware design. For example, the HIAPI-CM had excellent fidelity in classifying empty and full wells; automation of partially filled well classification exhibited slightly lower fidelity. The disagreement between manual and automated analysis can be attributed to the HIAPI-CM platform's software design. Specifically, when the HIAPI-CM software is unable to confidently classify an artifact, it defaults to a conservative assignment of well status. Although infrequent, the effects of this classification scheme are most apparent when the volume of sample in an interrogated well is on the boundary between the HIAPI-CM's predefined “empty” and “partially filled” assignment cutoffs. In the case of the MTPs used for this pilot study, a threshold volume of at least 2 μL was found to be necessary for 100% accuracy in the HIAPI-CM's partially filled well determination. Before executing the pilot study, the HIAPI-CM software was programmed to assign an “empty” status to any well whose volume was between 0 and 2 μL. This programming is reflected in the 94.4% agreement between manual and automated classification and to a lesser extent in the fidelity of other volumetric classification results. As the development of the HIAPI-CM continues, software-training efforts will include new solvents, samples, and types of labware, resulting in more robust classification and therefore more faithful artifact assignments.
As previouslydescribed and shownin Figure 3, HIAPI-CM is able to exploit IR illumination to detect precipitate features, which are otherwise in VIS to the human eye. Combined with the instrument's high-resolution camera and optics, this is largely responsible for the HIAPI-CM's detection accuracy of 220%; that is, the HIAPI-CM routinely identified precipitation artifacts that were missed via manual inspection. In these cases, the precipitation artifacts discovered by the HIAPI-CM were confirmed by manual reinspection of the discrepant wells. In most cases, efforts to manually inspect for precipitate were hampered by a number of challenges including precipitate being occluded by the color of the solvated sample, precipitate, which is a similar color to the labware and precipitate, which had not settled on the bottom of the plate.
HIAPI-CM's fidelity in color classification reveals its sensitivity as a colorimeter. Disagreement in automated versus manual color assignment was not a random error, but rather systematically associated with the presence of faint-colored compound samples. The HIAPI-CM performs color analysis in three steps: (1) color detection/resolution, (2) color intensity quantification, and (3) color classification. The ability of these three steps to assign correct values is primarily dependent on the concentration of the colored sample in the well. Wells containing samples with deep color, that is, with intensity above the HIAPI-CM's colorimetric limit of detection (LOD), are detected and classified without any issue. However, as a sample's concentration is reduced, its concentration approaches the HIAPI-CM's LOD. Once the LOD threshold is exceeded, the HIAPI-CM is unable to detect color and therefore the software does not initiate any further color processing. To better understand the HIAPI-CM's LOD, the instrument was calibrated using five different DMSO-soluble dyes with colors that span the VIS light spectrum (Table 2).
HIAPI-CM LOD values for different chromophores
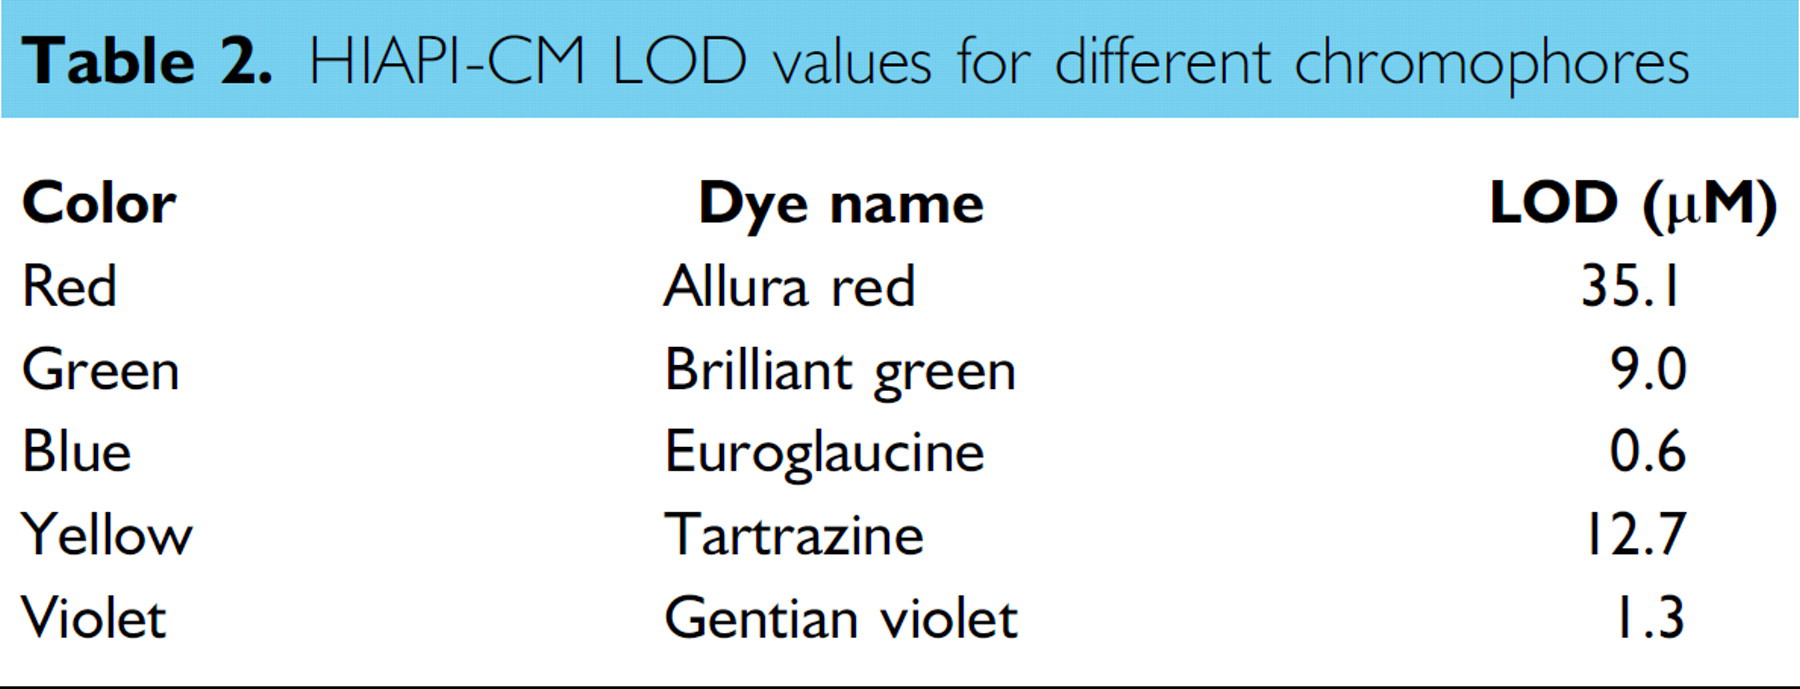
The values in Table 2 show that the HIAPI-CM's LOD varies with color of the dye, with a range of ∼100–101.6 μM. As expected, the fidelity of HIAPI-CM color detection above the LOD is 100%. Nevertheless, the 94.0% agreement between the manual and HIAPI-CM determinations is acceptable, given that faint-colored samples are less likely to interfere with common HTS-assay detection formats. It is also important to note that the HIAPI-CM is able to distinguish wells with more than one artifact, for example, wells containing colored precipitate (Fig. 3) or partially filled wells containing colored samples. Again, this type of sample does not present a classification problem as long as its color intensity is above the HIAPI-CM's corresponding LOD.
Conclusion
The HIAPI-CM platform represents an important paradigm shift in conventional HTS compound library management practices. A competitive comparison with current QA/QC instrumentation is presented in Table 3. In its current version, HIAPI-CM can rapidly identify and classify MTP wells containing colored compound samples, empty, filled, and partially filled wells and the presence of precipitate/crystals in MTP wells with high fidelity. HIAPI-CM's rapid, economical, and nondestructive analysis allows the monitoring of an entire HTS compound collection through its lifecycle, a practice not currently possible. Future enhancements of the HIAPI-CM include the implementation of
Capabilities of different analytical methods and instrumentation used for quality control of HTS compound libraries
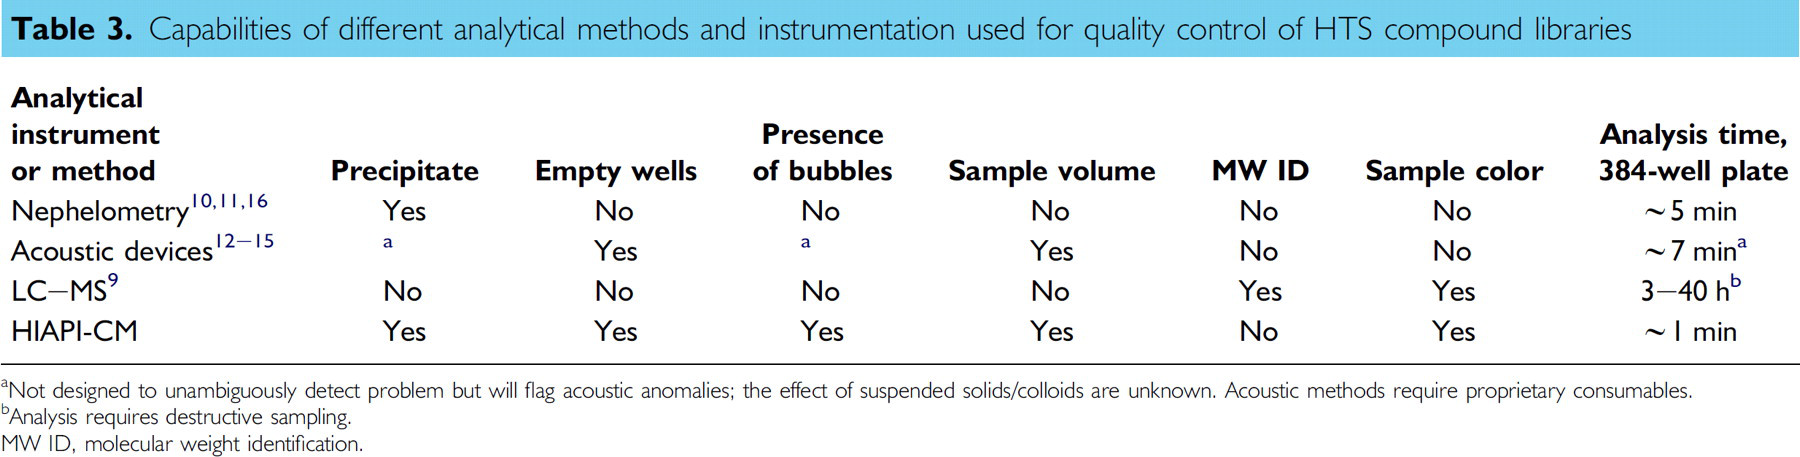
Not designed to unambiguously detect problem but will flag acoustic anomalies; the effect of suspended solids/colloids are unknown. Acoustic methods require proprietary consumables.
Analysis requires destructive sampling.
MW ID, molecular weight identification.
Acknowledgments
The work of PB, LS, RE, and PH was supported by the Scripps Florida Funding Corporation and by the National Institutes of Health Molecular Library Screening Center Network (MH084512).