
Abstract
An automatic calibration and angle-scanning prism-type total internal reflection fluorescence microscope (TIRFM) was modified to function in both TIRFM and pseudo-TIRFM modes. When the incident angle of the excitation laser beam was controlled to be larger than the critical angle, the instrument served as a variable-angle TIRFM. A homemade computer program automatically calibrates the laser illumination spot in the sample to overlap with the center of the microscope's field of view. Then, by measuring the fluorescence intensities at different incident angles, the z-positions of fluorescent nanospheres close to the cell basolateral membrane can be extracted. When the incident angle is reduced to be in the subcritical range, the instrument works as a pseudo-TIRFM. The whole cell body from bottom to top can be imaged in a vertical scan process. Furthermore, the illumination field depth in the pseudo-TIRFM can be controlled by changing the incident angle or the horizontal position of the laser spot.
Introduction
A large number of biological events take place inside a living cell at any moment to keep the cell functioning properly. To have a better understanding of these biological phenomena, researchers have taken great efforts in developing a variety of imaging tools, such as epi-fiuorescence, confocal fluorescence, and total internal reflection fluorescence (TIRFM) microscopies,1–3 for specific fluorescent labeling of proteins in both fixed and live cells. 4 Because of the native thin evanescent field, the background noise in TIRFM is much lower than that in epifluorescence microscopy.2,5 Additionally, unlike confocal fluorescence microscopy, TIRFM has better z-resolution and does not require a pinhole in the back focal plane of the objective to block the light leaking from out-of-focus planes. TIRFM has become an indispensable tool to study cellular organization and dynamic processes that occur near the interface of cell culture and glass substrate. 6
In our previous work, 7 an auto-calibration variable-angle prism-type TIRFM setup was introduced and demonstrated to have a better practical resolution in the axial direction than any other existing variable-angle TIRFM system. An optimized system layout and an automatic high-precision calibration procedure were implemented to find the incident angles with intervals smaller than 0.2° reliably and reproducibly within minutes. Furthermore, it becomes possible to scan the widest range of incident angles from the critical angle to large angles near 90°. A larger number of data points can be collected for a better practical resolution in the axial direction. The large angles that are unattainable in objective-type TIRFM are important in determining the absolute z-positions.
Because the evanescent field is no more than a few hundred nanometers thick, TIRFM is mostly used to study dynamic processes that occur near the basolateral membrane of mammalian cells. However, these dynamic processes often continue beyond the evanescent field. For example, using TIRFM alone is impossible to answer the question about how vesicles formed during endocytosis move away from the membrane toward cell nuclear or other organelles. Another example of TIRFM's limitation in imaging depth is its inability in studies of plant cells. 8 It is difficult for the evanescent wave to penetrate the plant cell wall, because the thickness of the cell wall is usually several hundred nanometers or more, and plant cells often do not lie flat on the substrate. To help solve these technical problems, variable-angle epi-fluorescence or pseudo-TIRFM 8 was designed to work at subcritical angles that are smaller than, yet still close to the critical angle. At a subcritical incident angle, the excitation laser beam is refracted to produce a slanted illumination path; thus, it is possible to extend the illumination depth several micrometers into the cell body.
In the present study, we demonstrate a new microscope system that combines the variable-angle TIRFM and variable-illumination-depth pseudo-TIRFM to image the whole cell from the basolateral membrane to the apical membrane. The illumination depth of the slanted refracted light just below the objective lens was regulated by varying the horizontal position of the laser spot at the interface of cell culture and glass substrate or by adjusting the incident angle.
Instrumentation
The apparatus used was similar to that described previously,
7
except for one modification: a piezo-actuated z-scanner (P-721; Physik Instrumente, Karlsruhe, Germany) was coupled with the microscope objective (Fig. 1A). The scanner offers the ability to change the vertical position of objective's front focal plane with very high precision. Additionally, when observing the cell structures in bright-field microscopy, the laser for TIRFM was turned off, and the illumination light source of the microscope was turned on.
Schematic experimental setup and the angle scan process for TIRFM. (A) Schematic experimental setup for automatic angle-scanning prism-type TIRFM. The two light paths are symmetrical at the two sides of the prism. (B) The rough angle scan process at a given incident angle. The red dots are fluorescent nanospheres distributed on the prism surface. (C) The flowchart to show how the homemade program carries out the angle scan process. (D) Experimental images of the fine-tune process. Top micrograph: the illumination laser spot was to the left of the field of view; middle micrograph: the illumination laser spot overlapped with the center of field of view; bottom micrograph: the illumination laser spot is to the right of the field of view. The right chart is the intensities of three chosen fluorescent nanospheres for the three left micrographs. The x-axis shows the three nanospheres, and the y-axis is the fluorescence intensity.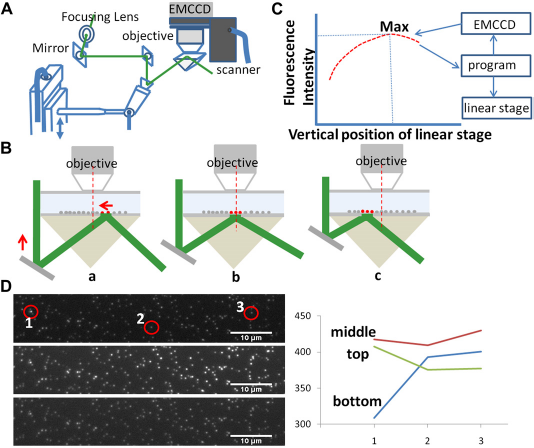
The field of view under the l00 × objective was around 130 × 130 μm2. If the illumination spot is too large, less energy can be used to excite the sample in field of view; if the spot is too small, the laser spot may not fully cover the field of view, and the Gaussian-shaped energy distribution could lead to an annoying uneven illumination in the field of view. It was found that when the diameter of the illumination laser spot was adjusted to be around 150 μm by controlling the relative distance between the focusing lens and the prism, the optimized laser energy distribution and sample illumination in the field of view was obtained.
A computer program (the user interface shown in Fig. 2) was developed in-house to automatically optimize the horizontal position of the laser spot at each incident angle. After the user enters an incident angle range, this computer program carries out the auto-calibration in two rounds: rough scan and fine tune. To maintain high precision, the motorized linear stage travels step by step in only one direction. The fluorescence images are recorded by the EMCCD camera (iXonEM + 897, Belfast, Ireland) at each step. During the rough scan, the vertical step size is set to be relatively large to reduce the time required for a full scan, and the vertical positions of the mirror of galvanometer at all incident angles are obtained from each local maximum of the integrated fluorescence intensities in a chosen area.
The user interface of the homemade auto-calibration auto-scanning program.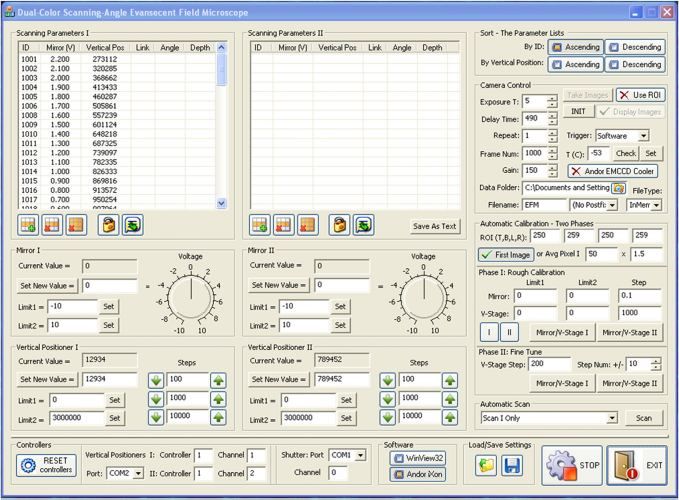
Figure 1 shows the details of the scan process. When the incident angle is set at a large value, the laser spot on the prism surface is to the right of microscope objective lens (Fig. 1B-a). Then the program moves the linear vertical stage upward. The higher the stage gets, the more to the left the laser spot on the prism surface moves. At the same time, the program uses the EMCCD to record fluorescence images and calculate intensities. The collected fluorescence intensity at a given incident angle depends on the horizontal position of the laser spot on the prism surface. The program keeps moving the linear stage up until the laser spot passes the center of the objective lens (Fig. 1B-b) and reaches a position slightly to the left of the objective lens (Fig. 1B-c). The recorded intensity-changing profile (Fig. 1C) is sent to the program as feedback to find the calibrated vertical position of the linear stage. All of the incident angles based on the user-defined range and interval are “roughly” calibrated in a continuous scan process.
During the round of fine tune, the program controls the linear vertical stage to move around the “roughly calibrated” positions again but with a smaller step size to obtain more precise vertical positions. The fluorescence intensity is at the highest level only when the center of the laser spot overlaps perfectly with the center of the objective front lens (Fig. 1D). Multiple rounds of fine tune can be carried out if desired. The angles and vertical positions are recorded and can be reloaded when starting new experiments.
Movie 1 (Appendix, available on the journal's Web site at www.elsevier.com) shows the increasing fluorescence intensities of the nanospheres immobilized on the prism surface when the incident angle was scanned from 82.6° to 67. 2° in TIRFM. The total number of angles scanned was 64; the exposure time for each angle was 50 ms, and it took ∼ 15 s to complete the whole scan process. During the scan process, it took a fraction of a second up to a few seconds for the linear vertical stage to travel to the right position for the next incident angle, which accounts for the extra 12 s in addition to the total exposure time for the whole scan process. To avoid photobleaching during the scan process, the homemade program was designed to open the shutter only when the EMCCD camera was required to collect fluorescence signals. In the future, by using a high-speed motorized stage, the time required to perform a full scan can be further reduced.
Sample Preparation
Preparation of Coverslips Coated with Metal Films
Thoroughly cleaned coverslips (22 × 22 mm, Zinc Titania glass, refractive index of 1.523 at sodium D line; Corning Inc., Corning, NY) were deposited with 5 nm of chromium followed by 30 nm of gold in an Airco Temscal BJD1800 E-beam evaporator (Berkeley, CA). Then, the coverslips were coated with poly-L-lysine (PLL) to form positively charged surfaces. Negatively charged 28-nm-diameter fluorescent nanospheres (Duke Scientific, Palo Alto, CA) were diluted to proper concentration in 18.2-MΩ water containing an oxygen scavenging system, composed of 0.5 mg/mL glucose oxidase (Sigma, St. Louis, MO), 40 μg/mL catalase (Sigma), 10% (w/v) glucose (Sigma), and 1% (v/v) β-mer-captoethanol (Fluka, Buch, Switzerland). The nanosphere solution was then loaded on a PLL-modified gold-coated coverslip and covered with another clean coverslip. The sample slide was placed on the prism surface. When imaging, a set of one 532-nm longpass filter and one 620/60-nm bandpass filter (Chroma, Rockingham, VT) was put between the EMCCD camera and the microscope to filter away the excitation background from the emission fluorescence.
Preparation of Cell Samples on Coverslips
A549 Human lung cancer cells (CCL-185; ATCC, Manassas, VA) were cultured in T-25 flasks with minimum essential medium containing 10% fetal bovine serum. When subculturing, the cells were seeded on PLL-coated coverslip and grew in 37 °C incubator with 5% CO2 atmosphere. After 24 h, the cells were incubated in cell culture medium containing 100-nm-diameter fluorescent nanospheres in the same 37 °C incubator. After that, the cells on coverslip were fixed with 3% formaldehyde and 0.1% glutaraldehyde in phosphate buffer at 37 °C for 15min. Then, the cells were immersed in phosphate buffer containing oxygen scavenging system, composed of 0.5 mg/mL glucose oxidase (Sigma), 40 μg/mL catalase (Sigma), 10% (w/v) glucose (Sigma), and 1% (v/v) β-mercaptoethanol (Fluka). The oxygen scavenging system helped to reduce photobleaching. Finally, the coverslip was put on the TIRFM prism surface for imaging. The same set of filters used earlier was put between the EMCCD camera and the microscope.
Precision and Reproducibility of Instrument
To demonstrate the system's precision and reproducibility, the new microscope was used to find the exact incident surface plasmon resonance angle that produced the most intense evanescent field for metal-enhanced TIRFM with a p-polarized (in the plane of incidence formed by the incident and reflected beams) incident laser beam as the illumination light (Fig. 3). Two independent runs of the same experiment were carried out. The incident angles at the peak positions for the two curves were nearly identical at 66.5°. The intensity differences between the two curves mainly resulted from the slight photobleaching of the fluorescent beads.
Surface plasmon resonance angle for gold film-enhanced TIRFM. (A) An illustration of the sample and imaging setup. (B) Two fluorescence intensity curves of the same nanosphere. The two curves were generated from two independent runs of the same experiment. The top curve is the first run.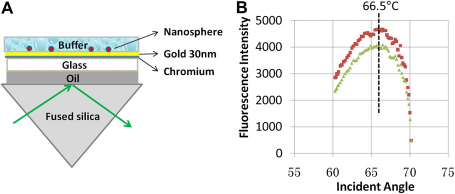
Cell Imaging
Determination of z-Positions of Fluorescent Nanospheres in Cell Basolateral Part with Variable-Angle Total Internal Reflection Fluorescence Microscope
The incident angle of the laser beam was first set to be greater than the critical angle, so that the instrument functioned as a TIRFM. The incident angle was varied to adjust the penetration depth of the evanescent wave, allowing the fluorescent nanospheres to show up layer by layer (Fig. 4). These fluorescent nanospheres were distributed in the cell ba-solateral part, which was within several hundred nanometers from the interface of cell culture and glass substrate.
Fluorescent nanospheres distributed close to the cell basolateral membrane were imaged by variable-angle TIRFM. (A) Schematic diagram showing the cell imaged within the evanescent field. The interface of cell culture and glass substrate is pointed out by the black arrow. (B) An A549 cell imaged in bright-field microscopy and TIRFM at an incident angle of 64.5°. The image areas are identical. (C) The TIRFM micrographs of the area defined by the red square in (B). The incident angles are shown at the top-left corner of these micrographs. It is obvious that the relative vertical positions of the two particles labeled as 1 and 2 have a relationship of z1 < z2. (D) Fluorescence decay curves of the two labeled nanospheres. The NLLS fitting curves are shown in red.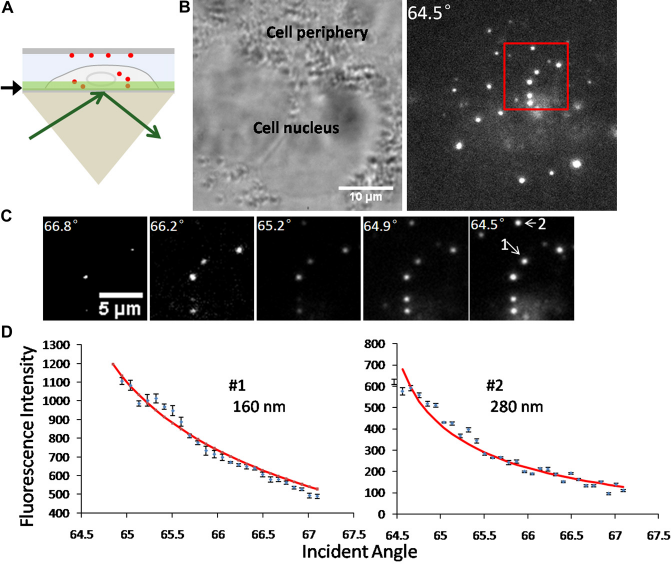
The absolute z-positions of these fluorescent particles can be extracted with the method of nonlinear least squares fitting, as described in our previous work.
7
Briefly, the fluorescence intensity profile of a chosen nanosphere varies as a function of the incident angle:

where F(θ) is the collected fluorescence intensity; θ is the incident angle; A is the instrument constant; z is the absolute vertical position of the chosen fluorescent nanosphere; d(θ) is the penetration depth, which is defined by the following equation:
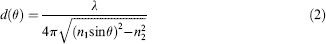
where λ is the wavelength of the incident light; n1 and n2 are the high and low refractive indices, respectively, of the two media at the interface. By fitting the fluorescence decay curves with Eq. (1), the absolute z-positions of the two particles are calculated to be z1 = 160 nm and z2 = 280 nm, respectively (Fig. 4D). The fitting result is consistent with the experimental observation: particle 1 appeared earlier than particle 2 when the incident angle was scanned from large value (66.8°) to small value (64.5°).
Imaging Fluorescent Nanospheres Distributed Deeper Inside the Cell with Variable-Illumination-Depth Pseudo—Total Internal Reflection Fluorescence Microscope
The instrument functions as a pseudo-TIRFM when the incident angle is within the subcritical angle range, that is, a few degrees smaller than the critical angle. The refracted light instead of the evanescent wave penetrates into the cell body, and the illumination field depth (the slanted illumination path above the cell culture and glass substrate interface) changes from several hundred nanometers to several micrometers. The narrow subcritical angle range maintains the illumination field close to the substrate, thus providing reasonable signal-to-noise ratios by keeping the background noise at a low level.
Unlike TIRFM, pseudo-TIRFM does not require the center of the laser spot at the cell—glass interface to overlap with the center of the objective lens. When the laser spot is moved away from the center of the objective lens, the refracted laser beam can effectively illuminate much deeper into the cell body. The micrographs in Figure 5 were taken at the incident angle of 63.5°, less than 1° smaller than the critical angle of 64.4°. The objective's focal plane was scanned from bottom to top through the whole cell body of about 5 μm thickness. When the focal plane was set to the cell—glass interface, the fluorescent nanospheres located within the evanescent field of TIRFM could still be detected in pseudo-TIRFM with good signal-to-noise ratios. Then, the objective's focal plane was moved away from the interface while the excitation conditions remained constant. More fluorescent nanospheres located deeper inside the cell became detectable layer by layer. Thus, fluorescent nanospheres at different depths inside the whole cell body were imaged.
Whole cell scanned in pseudo-TIRFM. (A) Schematic diagram of pseudo-TIRFM. The objective's focal plane was adjusted by the objective scanner. (B) Images of cell areas at different vertical depths. The cell was scanned from the basolateral membrane to the apical membrane with l-μm interval. The whole-cell thickness was around 5 μm.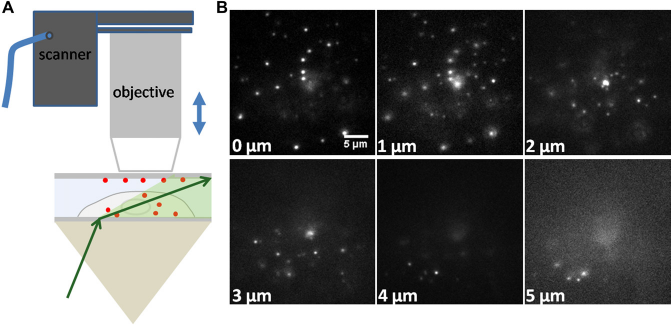
To selectively image fluorescent nanospheres within a certain depth inside the cell body, the depth of the illumination field just below the objective lens can be adjusted by changing either the incident angle in the subcritical angle range or the horizontal position of the excitation laser spot at the interface of cell culture and glass substrate. These procedures are demonstrated in Figure 6. Changing incident angle is the only way for objective-type pseudo-TIRFM to adjust the illumination depth, whereas this prism-type system provides one more option.
Illumination field depth controlled by changing the incident angle or the horizontal laser spot at the interface of cell culture and glass substrate. (A) Schematic diagram showing the illumination field at two incident angles. (B, C) The fluorescence images at two incident angles of 63.5° and 64.0°, respectively. The objective's focal plane was fixed at 2 μm away from the cell basolateral membrane. Agroup of fluorescent nanospheres was imaged at 63.5° but disappeared at 64.0° because of the shallower illumination field depth at a larger incident angle. (D) Schematic diagram showing the illumination field at the same incident angle but different horizontal positions of the laser spot. (E, F) The fluorescence images at the same incident angle of 62.6° buttwo different horizontal positions of the laser spot. The objective's focal plane was fixed at the top coverslip. The fluorescent nanospheres absorbed to the top coverslip were not imaged when the laser spot was close to the objective's field of view. They were imaged when the laser spot was moved further away from the objective's field of view.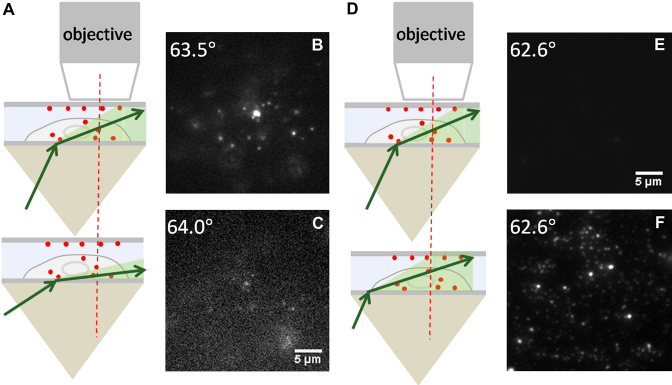
Conclusions
A new microscope that can function as either a variable-angle TIRFM or variable-illumination-depth pseudo-TIRFM was built. Fluorescent nanospheres close to the cell basolateral membrane are illuminated when the system functions as a variable-angle TIRFM. When the system functions as a pseudo-TIRFM, the whole cell, including the cell basolateral membrane, can be illuminated. Furthermore, by changing the incident angle or adjusting the horizontal position of the laser spot in the cell culture and glass substrate interface, fluorescent nanospheres with different vertical positions inside the whole cell body can be selectively imaged. This new automated microscope system provides a reliable, reproducible way to study biological events inside the cell.
Footnotes
Competing Interests Statement: The authors certify that all financial and material support for this research and work are clearly identified in the manuscript.
Acknowledgments
The Ames Laboratory is operated for the U.S. Department of Energy by Iowa State University under Contract No. DE-AC02-07CH11358. This work was supported by the Director of Science, Office of Basic Energy Sciences, Division of Chemical Sciences.