
Abstract
Microarrays used for measuring chromosomal aberrations in genomic DNA and for defining gene expression patterns have become almost routine. A microarray consists of an arrayed series of microscopic spots each containing either DNA or protein molecules known as feature reporters. Advances in microarray fabrication and in feature detection systems, such as high-resolution scanners and their associated software, lead to high-throughput screening of the genome or the transcriptome of a cell or a group of cells in only few days. Despite the potential of high-density microarrays, several problems about data interpretation are still to be solved. In addition, targeted microarrays are shown to be useful tools for rapid and accurate diagnosis of diseases. The aim of this review was to discuss the impact of microarrays on different application levels from the definition of disease biomarkers to pharmaceutical and clinical diagnostics.
Introduction
Microarrays are constructed of DNA, protein, or carbohydrate target molecules (known as reporter features) immobilized on a solid medium (generally glass slides) (Fig. 1). Whatever the immobilized molecule, all microarrays are based in the same principle: The affinity of a sample to the reporter molecule allowing the evaluation of molecule—molecule interactions such as DNA—DNA, DNA—protein, protein—protein, antigen—antibody interactions, among others. Such affinity leads to the evaluation and quantification of molecules in complex samples such as serum or tissue extracts.
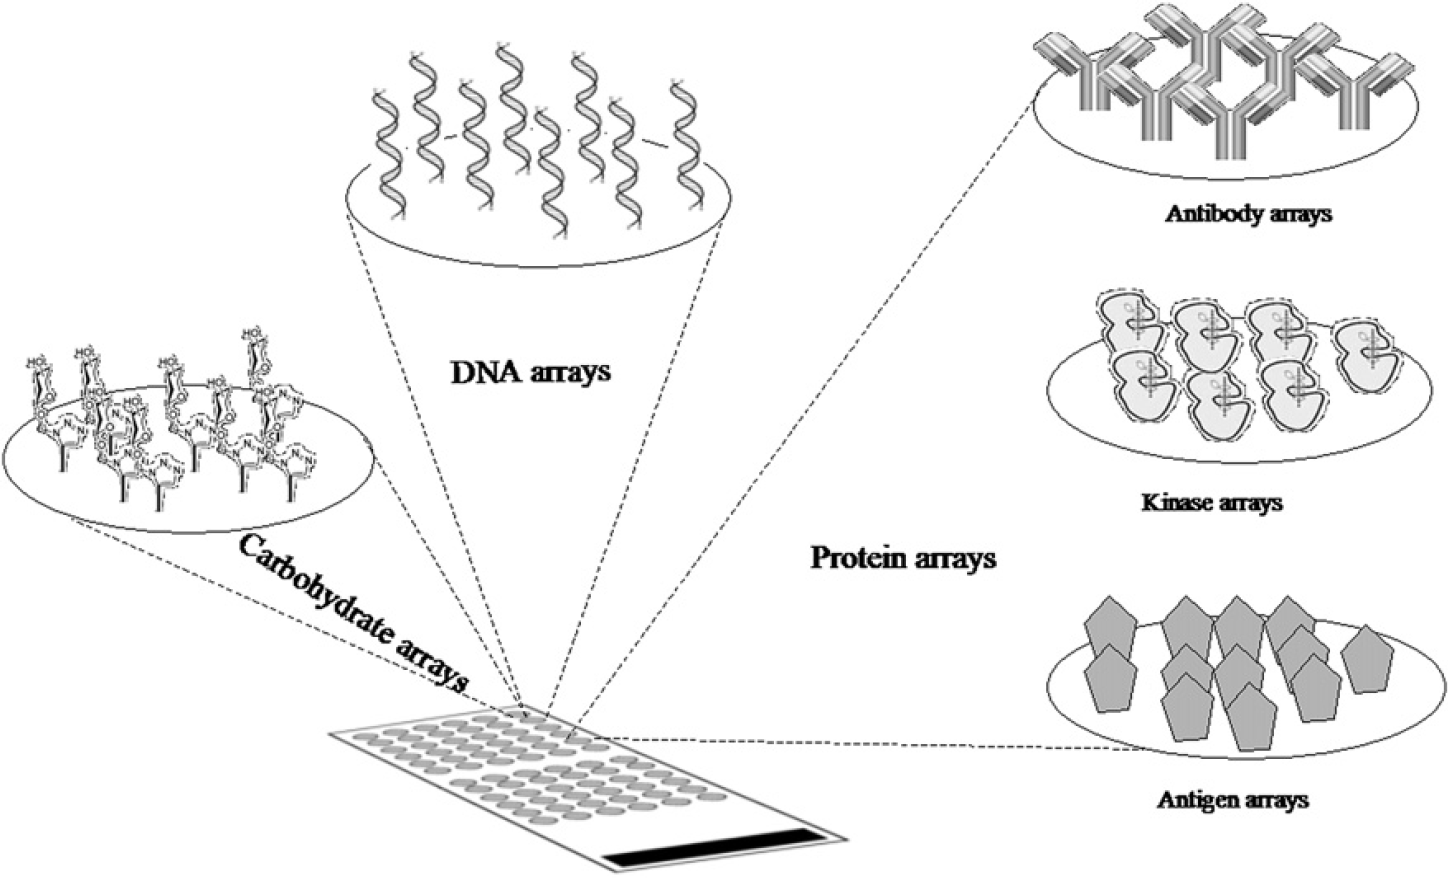
Microarrays are made of arrayed molecules (DNA, protein, carbohydrates, etc) immobilized on a solid medium. Microarrays permit evaluation of targeted molecules on complex samples such as tissues or serum. According to the immobilized molecules, microarrays can be classified as DNA microarrays, DNA-expression microarrays, protein microarrays, glycan microarrays, etc.
Basically, a microarray corresponds to the miniaturization of the southern and the dot blot technologies. In dot technologies, sample molecules are transferred to a solid medium (nitrocellulose or nylon membranes) and then labeled probe (DNA probe or antibody) is hybridized to the membrane to detect a determined sequence or protein in the sample. These methodologies allowed the detection of one molecule per sample. 1 Microarrays use the same detection basis as dot technologies, but on a much larger scale. In microarrays, thousands of molecules are arrayed on a solid medium (i.e., glass or plastic slides, nitrocellulose-embedded microbeads). Samples such as tissue or serum samples are labeled with a fluorescent tag molecule. The molecules immobilized in the microarray can then capture their “target” if it is present. The pattern of fluorescence is representative of the sample under test. This technology allows monitoring of thousands of molecules in a single experiment.
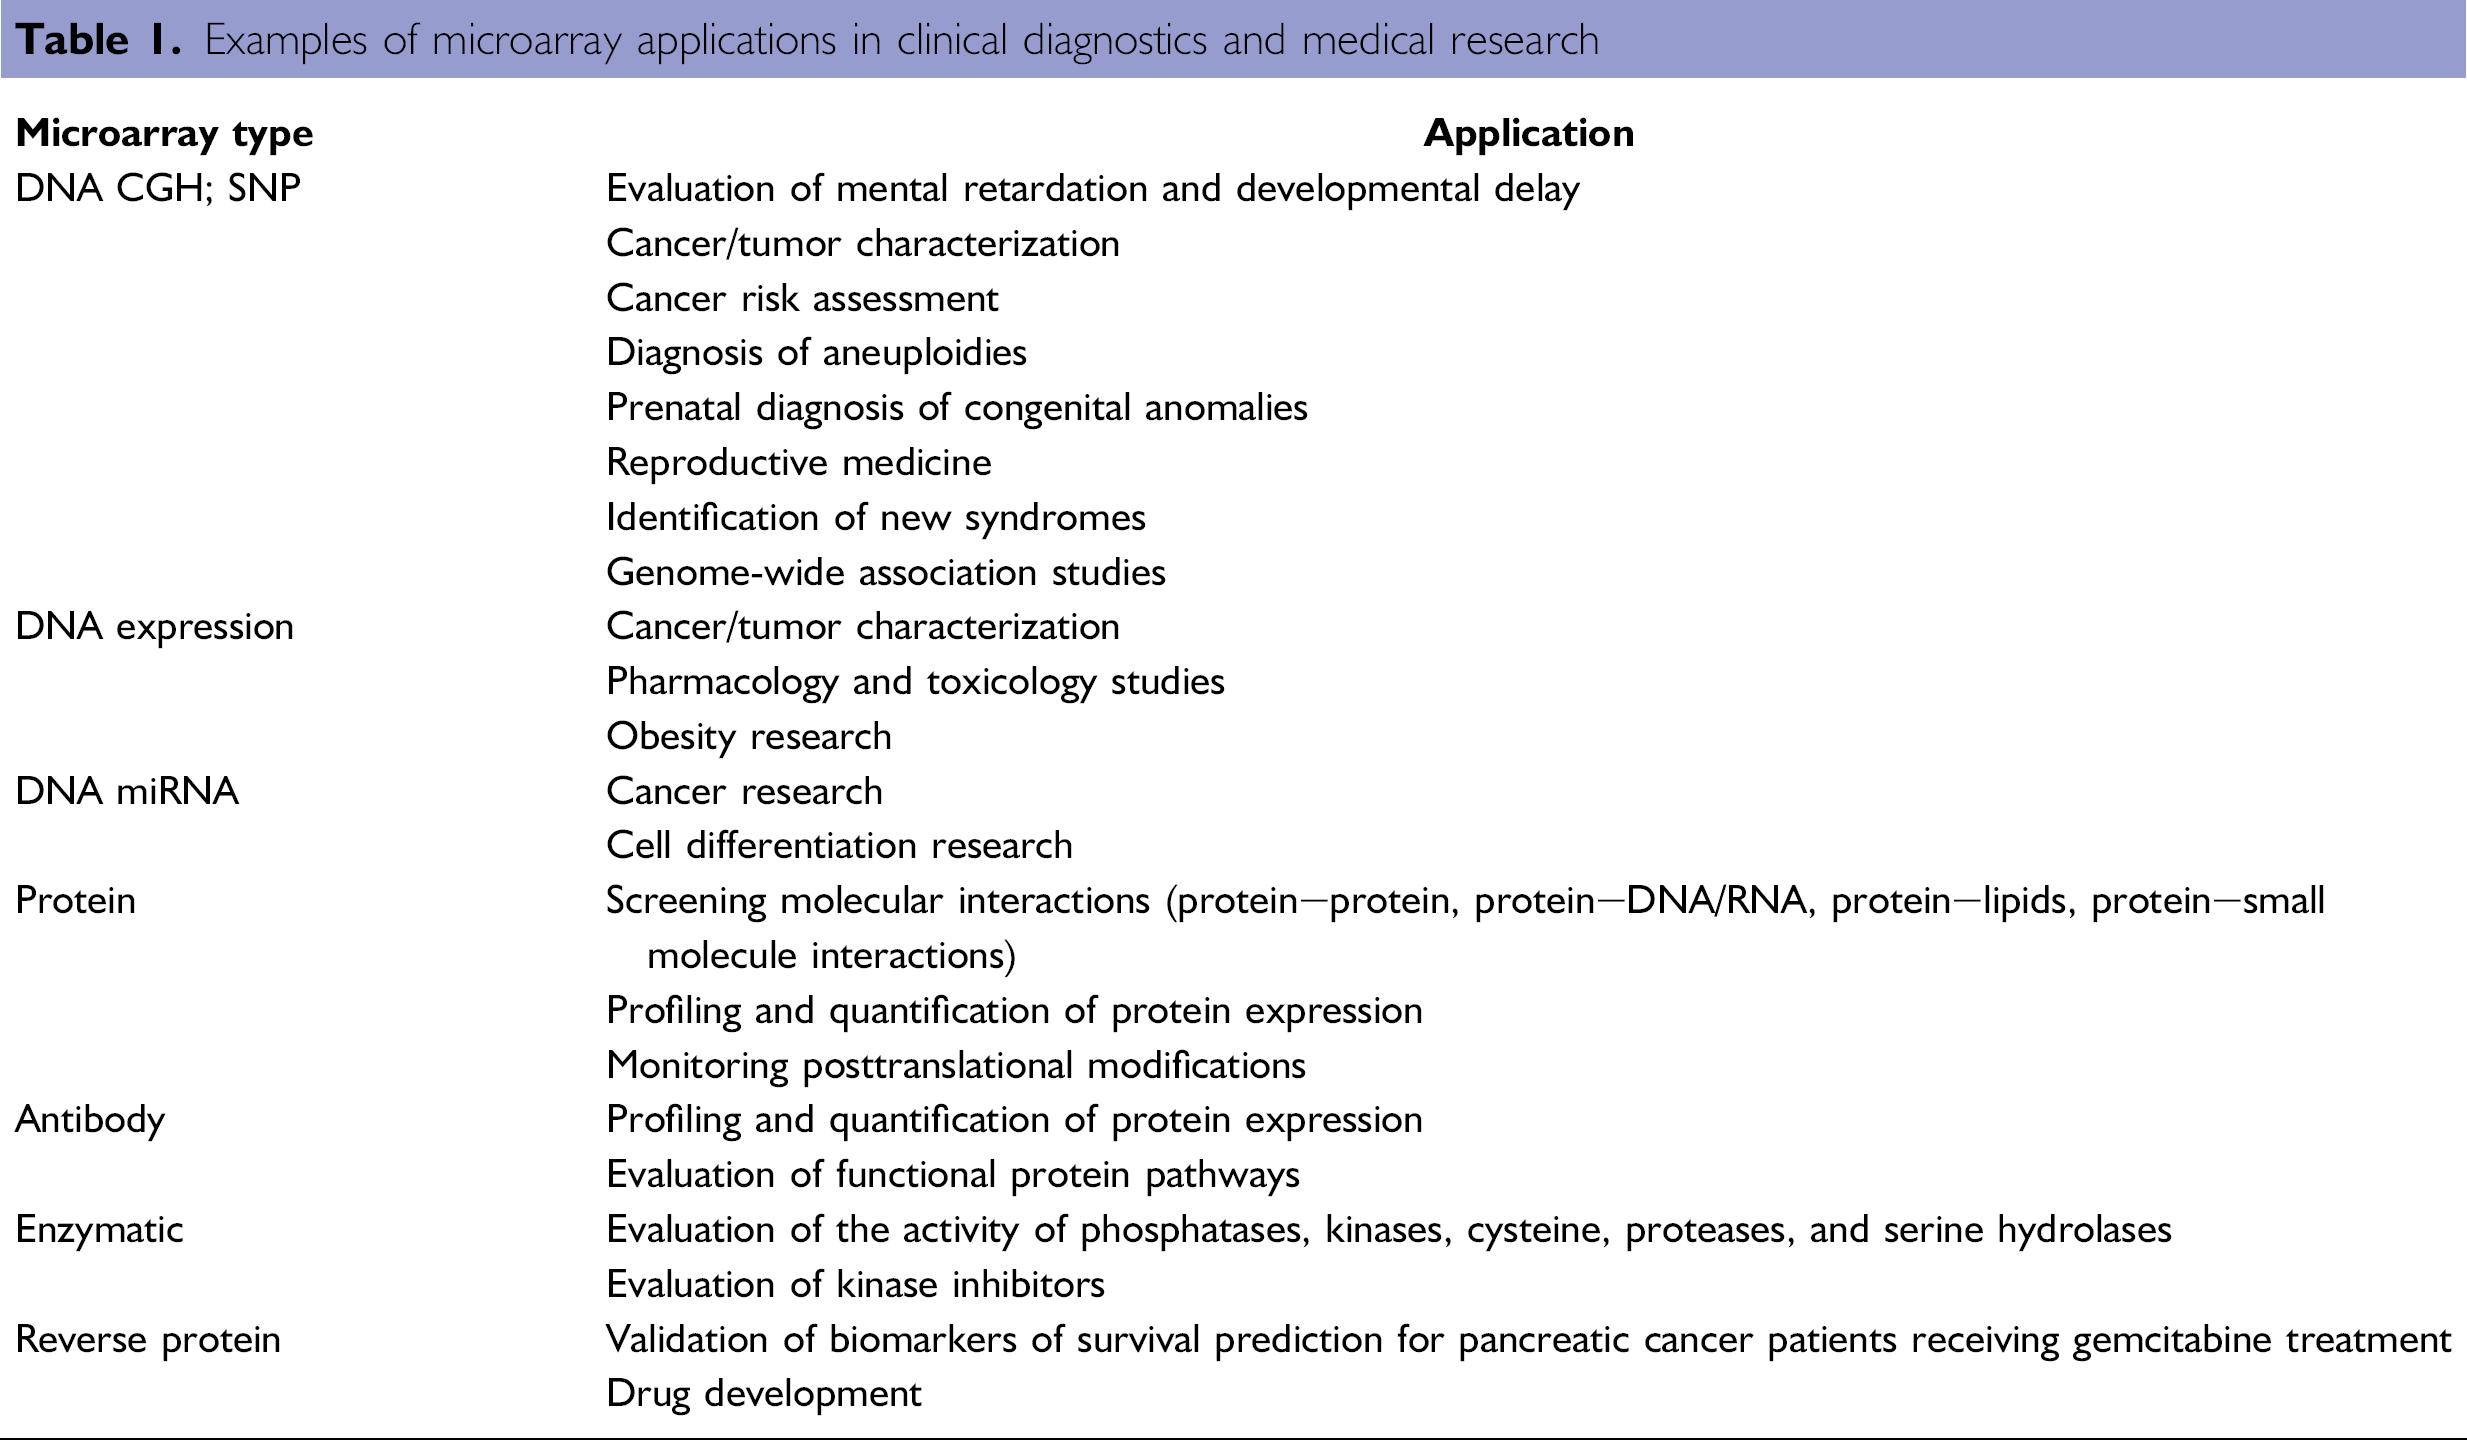
Microarray applications depend on the immobilized molecule present on the array (Table 1). Currently, the most used are DNA microarrays for the study of genomes or transcriptomes. Commercial DNA microarrays can have up to 2 million features (Nimblegen 2.1M CGH arrays) allowing the evaluation of genomes or transcriptomes in a single experiment. Genotyping arrays are used on genome-wide association studies (GWAS); in which single nucleotide polymorphism (SNP) markers are expected to allow identification of genes that underlie complex disorders such as cancer or obesity. 2 3 Protein microarray applications include expression profiling, serum-based diagnostics, protein—protein binding assays, and drug—target binding. In this article, current applications of microarrays are reviewed. For better understanding, a general explanation of microarray technology is given and then applications associated with the most-used microarrays are discussed.
Examples of microarray applications in clinical diagnostics and medical research
Elements of microarray analysis
The methodology explained below corresponds to a typical fluorescent microarray experiment. There are variations in array supports, the ways the samples are labeled, and the detection systems for which specific methodologies have been developed.
A classical microarray experiment can be separated into three steps (Fig. 2). The first step consists of sample labeling and microarray hybridization in which samples are labeled using fluorescent dyes (i.e., Cy3, Cy5, Alexa dyes) (Fig. 2A). Enzymatic labeling is used for DNA and antibody labeling. For gene expression microarrays, RNA dye incorporation can be done by either direct incorporation of labeled deoxyribonucle-otide triphosphates (dNTPs) during the reverse transcription reaction resulting in labeled cDNAs, 4 or by dye incorporation into antisense RNA during a T7 RNA polymerase-based in vitro transcription (IVT) reaction of cDNA. 5 Labeling using the IVT reaction allows for RNA amplification, which is very useful when having limited quantities of total RNA. Moreover, RNA amplification has been shown to better detect gene expression differences using one-color microarrays. 6 7 Once labeled, samples are hybridized to the microarray. After a suitable incubation time, to allow for binding between target samples and probes, the microarray is washed to remove any molecules that did not bind.
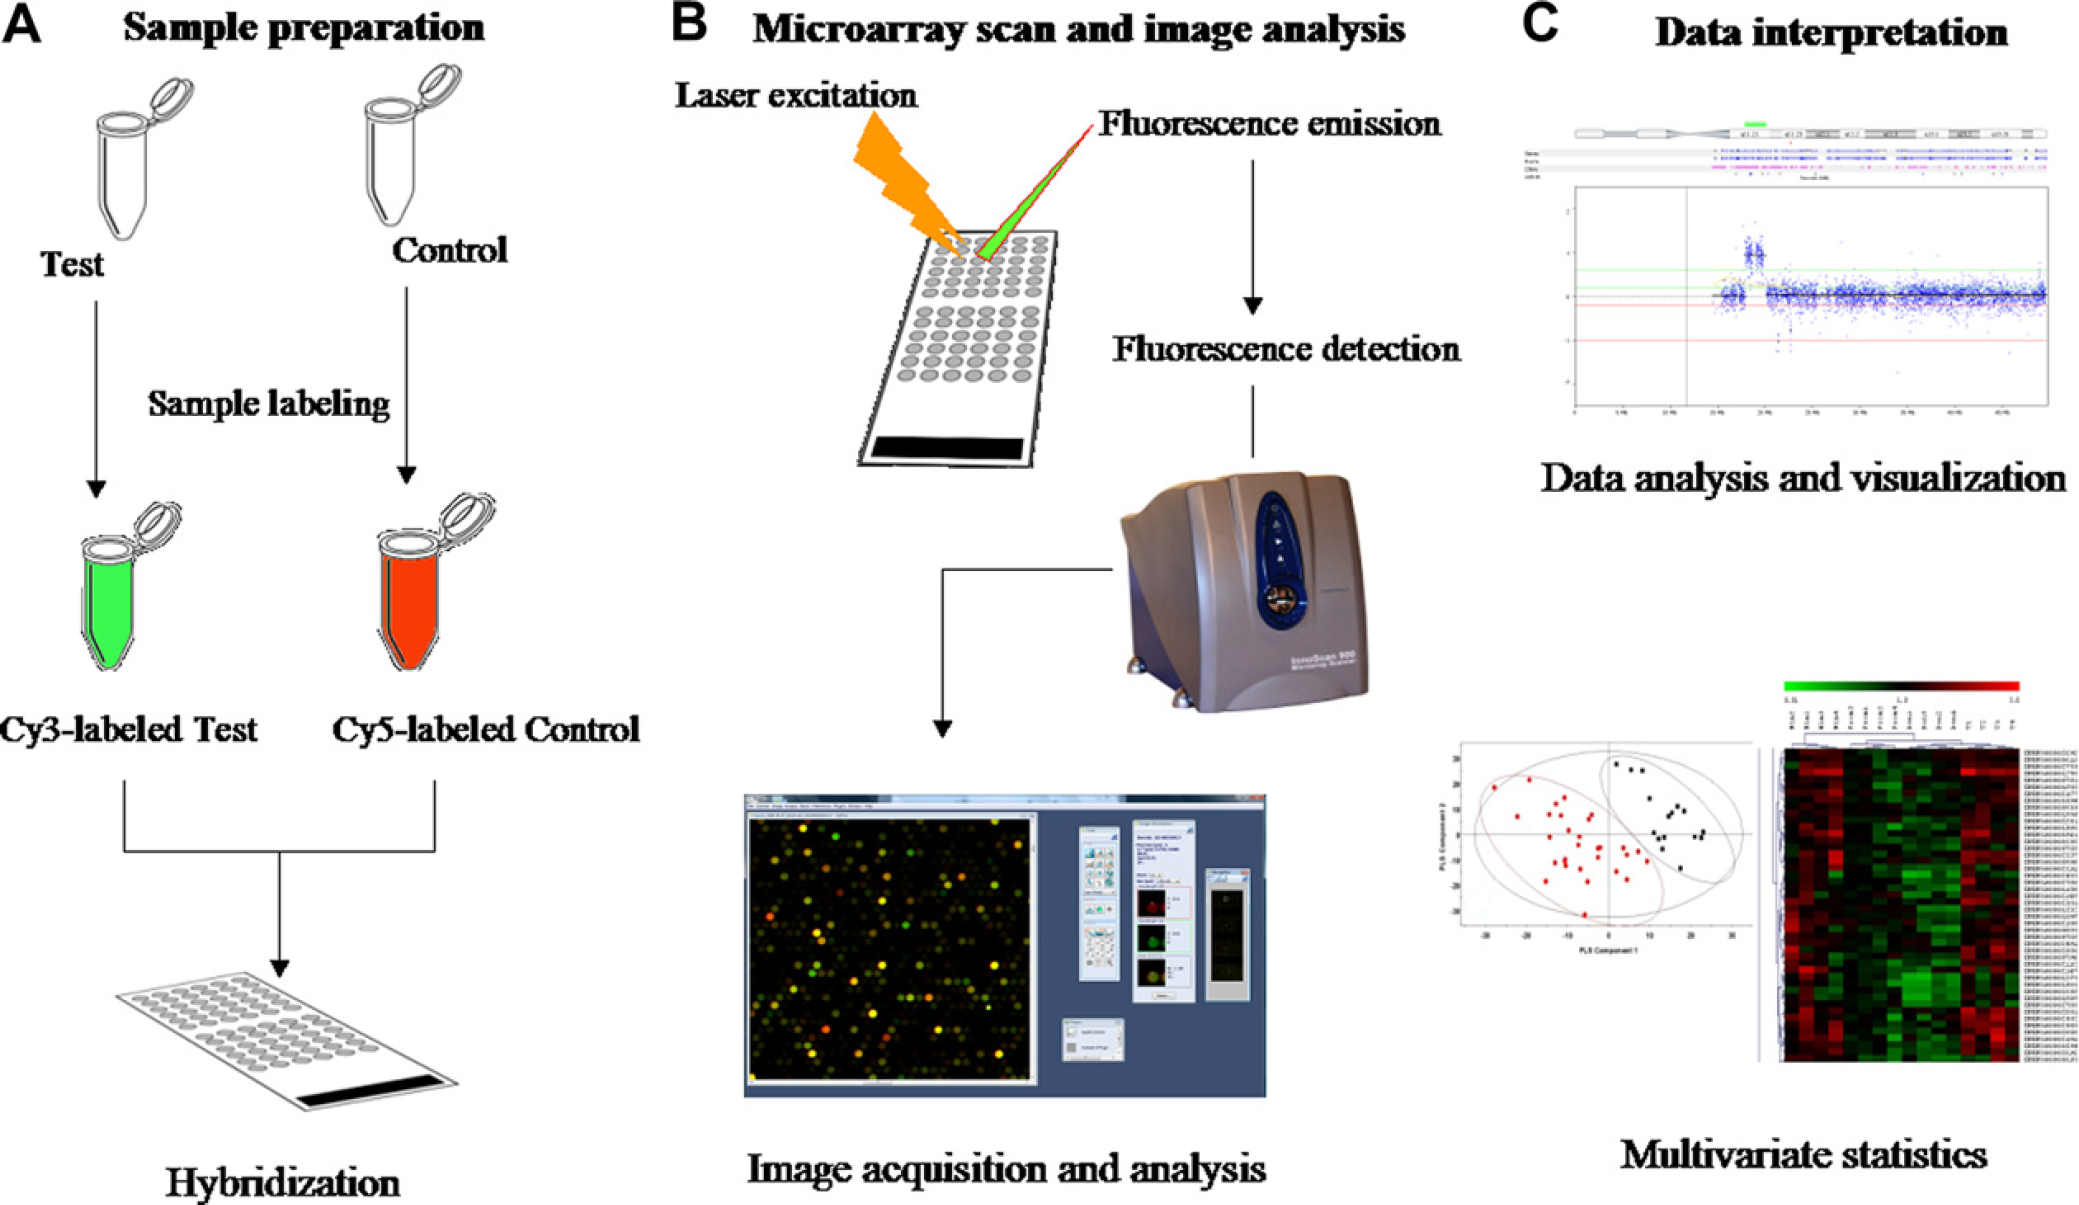
Two-color microarray experiment: A. Sample preparation consists in the extraction of the type of molecule to be labeled DNA, RNA, or proteins. Samples are labeled using fluorescent dyes (usually cyanine dyes). Fluorescent dyes allow for the comparison of test and control samples in the same microarray; for this, test sample is labeled with one fluorochrome (i.e., Cy3) and the control sample with another (i.e., Cy5). Once labeled, samples are mixed in equal quantities and hybridized to a slide containing the arrayed immobilized reporters. B. After hybridization and washing, slides are read using a laser scanner (photo: InnoScan900, INNOPSYS, Carbonne, France). The laser excites the fluorescent tag and the intensity of the signal generated is proportional to the number of target molecules that are bound to each point in the array. The scanner creates a digital image of the array, which can be stored and further analyzed. High-resolution scanners lead to better definition of features; using an appropriate software (photo: MAPIX, INNOPSYS, Carbonne, France), images are analyzed for feature intensity extraction. The microarray raw data consist of a table containing the intensity value at each of the color channels and the intensity ratio between channels for each of the features. C. The intensity ratio between both channels corresponds to the relative abundance of a targeted molecule (DNA, RNA, or protein) on a test sample with respect to a control. Data interpretation implicates dedicated statistical methods; both supervised and nonsupervised statistical methods adapted to microarray analyses and specialized software to visualize microarray results have been developed.
The second step in a microarray experiment is signal detection and analysis (Fig. 2B). After washing, the microarray is placed in a detection system consisting, in general, of a laser scanner. The laser excites the fluorescent tag and the intensity of the signal generated is proportional to the number of target molecules that are bound to each point in the array. The scanner creates a digital image of the array, which can be stored and further analyzed. Using appropriate image analysis software, it is possible to quantify fluorescence intensity for each spot in the microarray. The output of a microarray analysis is a table containing the fluorescence intensity values for each feature. Microarray data are then normalized to diminish experimental biases because of varying total amounts of hybridized molecules, different label incorporation rates, or other spurious variations. 7 Depending on microarray experimental design, different algorithms for data normalization have been proposed. The most commonly used are Lowess and quantile algorithms for two-and one-color microarray data, respectively. 7 8
Competitive hybridization (two-color) microarrays are used for comparing two different samples in the same micro-array. The samples are labeled with two different dyes with different emission wavelengths (i.e., Cy3 and Cy5 dyes with emission wavelengths of 570 and 670 nm, respectively). Using a laser scanner, it is possible to quantify the amount of a sample labeled with Cy3 with respect to another labeled with Cy5. This type of microarray is of interest for comparing test against control samples in a single experiment; however, intensity-dependent variation between dyes may introduce spurious variations to microarray data. Lowess normalization is used to remove such variation by merging two-color data while applying a smoothing adjustment. 7 9 Other dye-related variations have been reported, with Cy5 instability being the main cause. Cy5 dye is highly susceptible to atmospheric ozone levels 10 ; it also can be more strongly impacted by dye photobleaching effects than Cy3 dye. Photobleaching can occur when arrays are exposed directly to light or when they are scanned for image acquisition. Elevated ozone levels and photobleaching phenomenon lead to a disproportional loss of Cy5– with respect of Cy3-signal impacting microarray data quality. To assure data quality and confidence, the use of an ozone-free zone during the whole microarray experiment is recommended. 11 Alternatively, Cy5 stabilization chemicals have been developed and are now commercially available (Agilent Technologies).
In one-color microarrays, the intensity level of each feature indicates the relative level of hybridization with the labeled target. The comparison of two different samples requires the analysis of two parallel microarrays. Quantile normalization is used in this type of microarray for reducing variance between arrays, while keeping the proprieties of a Lowess normalization. 7 12 One evident advantage of one-color microarrays is the abolition of Cy5 instability-related problems described above. Also, by using one-color microarrays, the comparison of samples from different experiments should be more easily performed because direct comparison between samples is possible as long as the array normalization for the whole data set to be compared is done to diminish the effect of batched experiments.
The last and most complex step in a microarray experiment is data interpretation (Fig. 2C). Depending on the microarray application, different statistical methods for data management have been developed. For example, in a gene copy number analysis, the resulting ratio of fluorescence intensities is proportional to the ratio of copy numbers of DNA sequences in the test and control genomes (see aCGH section). Several software packages have been developed to visualize gene copy number gains and losses across the genome. 13 15 Multivariate statistical methods have been developed to analyze gene and protein expression profiles; both nonsupervised and supervised methods are used to explain differences in gene expression patterns in a sample with respect to a control. 16 17 Although nonsupervised methods aim at group discovery and data reduction, supervised methods are used for sample classification on the basis of external measurements made on samples for class predefinition (i.e., clinical data). 16
Array comparative genome hybridization
Array comparative genome hybridization (aCGH) is a high-resolution screening of genome segments to determine genome structural variations such as gene copy number variations (CNVs). In 1998, Pinkel et al. 18 reported for the first time the application of DNA microarray for the analysis of chromosomal aberrations in breast cancer. In aCGH arrays, generally performed in a two-color microarray design, the resulting ratio of fluorescence correlates to the ratio of CNV of DNA sequences in test and control genomes; where control genomes are made of control DNA samples. Nowadays, aCGH applications for clinical diagnostics have rapidly increased and are currently replacing classical cytogenetics methods. aCGH microarrays are composed of thousands of locus-specific genomic segments or probes as reporters. Genomic clones, such as bacterial artificial chromosomes (BACs), cDNAs, PCR products, and oligonucleotides are used as microarray platforms. The genomic resolution of the different aCGH platforms is determined by the spacing and the length of the DNA probes; BACs arrays are limited to around 50 kb, whereas oligonucleotide arrays can achieve 25mer resolution. The larger the genomic spacing, the lower the resolution of the array, and the greater the likelihood that CNVs may fall in the spaces and be missed. Although they have limited genomic resolution, BACs arrays are still used to detect large-size variations, and they were successfully used for defining DNA CNV regions in the human genome. 19 22
Commercial platforms have been developed for unbiased high-resolution genome-wide DNA copy number analysis using oligonucleotide arrays. However, their use for clinical diagnostics is controversial. High-resolution whole-genome screening seems to detect CNV without clear clinical significance, whereas low-resolution microarrays using targeted sequences known to be related to disease seem to be more suitable for diagnostic purposes because of easier data interpretation. 23 Nevertheless, unbiased whole-genome analysis coupled with extensive familial studies is a promising tool for diagnosis of known and de novo chromosomal abnormalities. This is especially true for genomic heterogeneous diseases in which the recurrence rate of deletions or duplications is very low such as in some cases of mental retardation. 24 26
The technique of aCGH has been successfully used in the evaluation and diagnosis of diseases known to be associated with DNA alterations, such as mental retardation, developmental delays, and cancer, 26 demonstrating their applications in clinical diagnostics; but more importantly, using aCGH approaches, novel submicroscopic chromosomal alterations not revealed by cytogenetic methods have been associated with mental retardation, 27 and novel genomic variants of cancer have been defined. 28
In balanced chromosomal rearrangements such as translocations and inversions, only the gene location is changed without changes on copy number, presenting a limitation for the technique of aCGH. However, patients carrying balanced translocations usually present cryptic deletions/duplications at the site of the translocation breakpoint. Using high-resolution CGH arrays, Li et al. described some CNVs at the site of a translocation breakpoint in a patient with growth deficiency. The authors explain how these CNVs are implicated in the patient phenotype, showing aCGH arrays can add important information for clinical diagnosis in patients with balanced chromosomal aberrations. 28 The technique of aCGH is not suitable for defining chromosomal translocation breakpoints; therefore, to define them, approaches such as array painting have been developed. In array painting, the DNA of aberrant chromosomes is first separated by flow cytometry, the sorted chromosomes are amplified, differentially labeled, and hybridized onto the DNA array. Spots with fluorescence signal correspond to those sequences present in the sorted chromosomes. If a spot in the array spans the sequence of the chromosome breakpoint, then both chromosome derivative sequences will hybridize generating intermediate ratio values. 29 30
Genotyping microarrays
Detection of DNA variations at the single nucleotide level is possible by using DNA microarrays. SNP-arrays are based on the hybridization efficiency to allele-specific DNA probes. SNP arrays for genome-wide genotyping are now commercially available (Affymetrix SNP Array 6.0; Illumina Human1M BeadChip). In GWAS, this type of microarray is used to evaluate the association of SNPs with complex diseases such as cancer, diabetes, and obesity. 2 3 GWAS compares the SNP patterns in two populations: people with the disease (cases) and similar people without disease (controls). Biostatistical and bioinformatic methodologies are applied to determine the frequency of each SNP across the two populations. If a SNP is present more frequently in the case group, then the SNP is considered to be associated with the disease. GWAS is a promising tool for personalized medicine, and SNP association could be also applied to drug efficiency studies as recently debated at the Fifth Statistical Analysis Workshop of the Pharmacogenetics Research Network. 31
Although GWAS aim at discovering SNP-disease associations, rapid diagnosis of diseases associated with known gene mutations is possible by using customized microarrays; companies such as Progenika Biopharma have developed customized microarrays for the rapid screening of known genetic diseases such as familial hypercholesterolemia. 32
Gene expression arrays
In 1995, Schena et al. reported the use of cDNA printed microarrays for the simultaneous detection of 45 arabidopsis genes using two-color RNA-labeled sample hybridization. 33 Currently, gene expression microarrays are used in almost all research areas. Advances in biotechnology and bioinformatics allow the fabrication of oligonucleotide DNA-expression microarrays comprising the whole human transcriptome (around 20,000-25,000 protein-coding genes and other noncoding RNAs). 34 35 The transcriptome of a cell defines the genes that are actively expressed in a given time. The definition of the transcriptome gives deeper insight into changes of gene expression as a function of a disease, a drug response, and or a developmental stage.
As part of the transcriptome MicroRNAs (miRNAs) have been reported to modulate mRNA stability and control gene expression. 36 The miRNAs are small (∼22 nucleotides) non-coding RNAs that have been implicated in both physiological and pathological processes. By modulating gene expression, miRNAs can control cell cycle, apoptosis, and differentiation. 36 38 Total RNA from biological samples such as blood, cell cultures, or tissues can be used for miRNA arrays. However, because of miRNA molecules small sizes RNA isolation requires specialized protocols to prevent substantial loss of material. Commercial specialized miRNA isolation kits have been designed for isolation of small RNA molecules (i.e., Ambion miRVANA or Qiagen miRNA easy kits). Furthermore, small RNA molecules can be enriched from total RNA samples by acrylamide electrophoresis gel fraction method to separate RNA of less of 40 nucleotides. 39 After isolation, total RNA or enriched miRNA samples are directly labeled by enzymatic ligation, and hybridized to miRNA arrays composed of oligonucleotides for each individual miRNA. 40 miRNA profiling using microarrays has been successfully used to differentiate normal from cancerous pancreas biopsies. 41 Furthermore, miRNA profiles have been used as prognostic tools for chronic lymphocytic leukemia and colon cancer. 42 43
Because of the large amount and the complexity of data generated from transcriptomic microarrays, they have been used mostly for research purposes. However, efforts in bioinformatics and statistical methods for data interpretation are underway, promising the application of gene expression microarrays to disease diagnosis in the near future. 44 45 For example, using gene expression microarrays coupled to dedicated statistical methods, scientists have not only defined the changes of gene expression profiles under a defined situation (i.e., disease, drug, or pathogen stimulus), but also they are now able to define new disease risk entities mainly in cancer. 46 48 Furthermore, Mutch et al. were able to predict weight responses of obese subjects to hypocaloric diets by analyzing their adipose tissue transcriptome before the beginning of the weight loss program. 49 These reports show the power of gene expression microarrays in disease prognosis and impact the future of medicine by using microarray technologies as key tools for personalized medicine.
Protein arrays
Even when gene expression profiles give a first view of cell behavior; transcriptional profiling does not necessarily correlate with the pattern of protein profiling. The human genome contains around 20,000-25,000 genes that can be translated into 1 million different proteins. 35 50 Proteins are “the players” in cellular activity; therefore, functional protein profiling will more directly address clinical and pharmaceutical issues. Traditional protein profiling was done using separation methods such as two-dimensional gel electrophoresis (2D-GE) coupled with mass spectrometry approaches. 51 However, 2D-GE is a laborious and time-consuming methodology in which reproducibility is difficult to achieve. 52 Furthermore, as part of this methodology, proteins have to be denatured which does not allow for protein-activity testing. Protein microarrays arise then as promising tools for elucidating the functional proteome by arraying intact proteins on glass slides coated with appropriate chemical treatments. 53
Three different types of protein microarrays currently exist; analytical protein microarrays, functional microarrays, and reverse phase microarrays. 54 In general, analytical protein microarrays are constructed by arraying antibodies or nonfolded antigens on the glass slide, which is then probed with a protein solution. This technique is based on the sandwich ELISA methodology and is used to measure protein expression levels in a solution or sample. Functional protein microarrays are made of full-length functional proteins or protein domains attached to a functionalized matrix usually made of a layer of a polymer (polyacrylamide, agarose, or gelatine) that confers a porous structure. They are used for studying protein interactions with other proteins, macromolecules, or small molecules such as ligand—receptor interactions, and for testing for protein activity as in the case of kinase arrays. Reverse phase protein microarrays (RPA) correspond to the miniaturization of dot blotting. In RPA, samples such as cell lysates or plasma are spotted onto a glass slide using a robotic protein microarrayer, and then the arrayed samples are tested by using antibodies against the protein of interest. RPA is a useful tool for the evaluation of protein expression levels in hundreds of different samples in a single experiment. 55
Detection of molecule—protein interactions can be done by either label-based or label-free methods. Labeled methods using fluorescence dyes can be analyzed using the same instrumentation as in DNA microarrays. Direct protein labeling by either covalent conjugation of N-hydroxysuccinimide ester-linked fluorescent dyes to primary amines of the protein N-terminus or by thiol-reactive dyes to cysteine residues can be used to label purified proteins and complex mixtures such as serum samples. 56 57 Antibody arrays can be detected using the sandwich ELISA detection method, which increased specificity to target detection by the use of a second antibody. 58 For proteins expressed at low levels, signal amplification methods such as tyramide signal amplification (TSA) can be used. 59 The TSA method uses horseradish peroxidase (HRP) to catalyze the disposition fluorophore-labeled tyramide at the vicinity of antibody binding, which increases signal. 60 Protein arrays are first processed with a suitable primary antibody. A biotinylated secondary antibody is then incubated on the arrays. After washing, the arrays are incubated with Streptavidin—HRP. In the presence of hydrogen peroxide, HRP oxidizes the phenol of tyramide-fluorophore conjugates to produce highly reactive free radical intermediates that covalently bind to the tyrosine residues of nearby protein molecules on the slide. TSA increases detection sensitivity and can detect femtogram amounts of protein. 60 61
The main challenge of protein microarrays is the complexity of the proteome. Most of the protein functions are still unknown, and the generation of thousands of antibodies with enough specificity for protein profiling is impossible. However, proteins acting on the main cellular functions are already known, and targeted protein arrays have been successfully used for pharmaceutical purposes. Protein profiling of 60 human cancer cell lines was done by RPA using 54 antibodies. 62 Using these profiles, Ma et al. were able to predict the response of these cell lines to 118 anticancer agents. 63 Similarly, signaling networks based on protein phosphorylation have been analyzed by RPA using antibodies that specifically recognize the phosphorylated form of proteins. 64
Antigen microarrays might be useful for antibody quantification after vaccination, or for early detection of diseases driving an immune response such as some types of cancer. 63 65 Protein kinase activity can also be elucidated by functional protein microarrays; recently, Li et al. reported the development of microarray-based assays for the rapid screening of protein kinase inhibitors. 66
Concluding remarks
One of the aims of high-throughput approaches is to get a global visualization of molecular mechanisms of cell behaviors under different environments, which would be essential for personalized medicine. There is no doubt about the impact of microarray technology in medical research. From the exploration of disease mechanisms with new biomarker discoveries to the evaluation of new drug targets, microarrays emerge as low-cost, rapid, and effective tools to address clinical and pharmaceutical issues. However, to achieve this objective, microarray data quality must be assured.
Critical steps in microarray data, such as image acquisition and analysis, should be highly controlled to assure data quality. Kadanga et al. demonstrated that image analysis and data normalization significantly impact microarray results. 67 High-resolution images assure a better spot definition, facilitating the processes of gridding (assigning coordinates to each of the spots) and segmentation (the classification of pixels either as part of the spot or as background), two major steps in the analysis of microarray images. 9
Data interpretation is another step that could influence the cross-laboratory cross-platform concordance. International work groups have been created to standardize microarray information. These groups have defined the minimum information about a microarray experiment that is needed to enable the interpretation of the results of the experiment unambiguously, and potentially to reproduce the experiment. 68 However, the final data interpretation still depends on microarray density and on researchers or clinicians. Although high-resolution microarrays have great potential for improving our understanding of biological processes, their interpretation is not easy and dedicated statistical methods are necessary. Observations found by these kinds of microarrays should be functionally validated and correlated with other clinical parameters to be established as biomarkers of disease. In contrast, targeted microarrays, mainly for genetic testing, have been validated as useful tools for rapid and efficient disease screening.
In conclusion, microarrays have enormous potential for medical research. Today, aCGH is revolutionizing cytogenetics by providing clinicians with a powerful diagnostic tool, which is easy to use. Although gene expression and protein arrays are currently used for research purposes, advances in biostatistics and bioinformatics promise their use for the definition of disease biomarkers using integrative approaches that define pathways or a group of genes or proteins related to a disease.
Competing Interests Statement: The author certifies that she has no relevant financial interests in this manuscript.