
Abstract
Three dimensional (3D) microarrays utilizing hydrogel matrixes are becoming increasingly attractive as a desired format for bio-analysis. These materials offer significant advantages as a scaffolding for capture agents over more conventional two dimensional (2D) printed formats in both captures per site and the ability to provide an environment more closely resembling that of a free solution. Biocept has developed a flexible three dimensional polyethylene glycol (PEG) polymer based platform suitable for a variety of biological assays. This novel approach is simple, biocompatible and provides a high degree of reproducibility and very low variability in the final array.
INTRODUCTION
Polyacrylamide gel based 3D microarrays have been demonstrated to have a variety of biological applications. 1 Biocept utilizes a novel PEG hydrogel for constructing three-dimensional microarrays for the high throughput analysis of biomolecules such as DNA and proteins. Unlike the acrylamide-bisacrylamide base gel, which depends on either radical or photopolymerization, 2 Biocept's hydrogel technology is based upon convenient isocyanate chemistry. Thus the possible damaging effect of radicals or UV on biomolecules is eliminated. A polyisocyanate modified polyethylene glycol (PEG) monomer is the key to providing for polymerization of the hydrogel; conjugation to biomolecules and covalent surface attachment. By controlling the pH, temperature, and monomer concentration, the extent of cross-linking can be controlled to govern the porosity of the biocompatible hydrogel. In the case of DNA, an oligonucleotide modified with a primary amine serves as the point of attachment.
Several experiments have demonstrated the open architecture of the hydrogel. Experiments have shown that the hydrogel is accessible to fragmented DNA, proteins and antibodies. The pore size of the gel is at least as big as an average immunoglobin molecule, the largest protein tested so far, which has an estimated radius of 5 to 7 nm. 3 These qualities result in a single step that both mixes the bio-molecules and hydrogel for printing and initiates polymerization.
Our printing process and material yields spots with diameters between 300 and 400mm with thickness between 30 and 50mm, depending on the formulation and printing conditions. Volume estimates range between 1.9 and 5.7nL, using a slightly rounded cylinder as the model. Differences in size and volume depend on the formulation and printing method, which is tailored for the type of biomolecule. The three dimensional format and unique hydrogel chemistry provide microarrays with very high sensitivity, dynamic range and precision.
Biocept's hydrogel format allows a number of DNA-based applications while preserving a near-native conformation of the DNA. Biocept has focused on the development of DNA-based microarrays for the study of gene expression in different species. In particular, a mouse gene expression array has been used to validate our technology for DNA microarrays printed onto amine derivatized glass slides and provides the baseline consistency of manufacturing data. The hydrogel allows us to immobilize proteins in active conformations. Our tests have shown that large proteins can diffuse into printed gel spots and perform normal biological functions, thereby opening many possibilities for carrying out biochemical reactions in microarray format. Further tests of protein-DNA and enzymatic reactions have yielded promising results.
During the development of our hydrogel platform, we investigated a number of potential off-the-shelf solutions for creating our microarrays. We found that our proprietary hydrogel chemistry had needs that could not be met by these systems. Therefore, we created a custom integrated robotic system for the spotting of our microarrays. With this custom system which uses readily available industrial robotics with vision and full climate control of the printing process, we have addressed the issues of robust production of our arrays. We describe below an overview of the robotic spotting system, the ways in which we use machine vision, and present the measures of consistency of spotting. We then discuss the types of arrays we have tested (DNA and protein), and present some of our findings.
THE PRINTING SYSTEM
Biocept's hydrogel platform is highly reproducible due, in part, to our attention to the platform's manufacturing needs. These needs include: different climatic zones optimized for storage, spotting and polymerization; speed of printing determined by the hydrogel polymerization; a desire for the real-time QC (quality control) of every microarray; and minimizing the cost of manufacture. Using these as specifications for judging potential off-the-shelf spotting solutions, we were left without an identifiable system readily available in the marketplace. Fully custom automated systems also failed to meet both our timeline and our goal of minimizing manufacturing costs.
We were able to find a compromise approach that allowed us to customize the spotting algorithm and environment without having to build a robotic system from scratch, thus allowing us to get the system operational within timelines and budgets. This compromise centered on using an industrial robot with integrated machine vision, a graphical programming environment, Microsoft™ (Richmond, WA) Windows® compatibility and a proven reputation for robust operation and reliability. We found such a robot in the Adept (San Jose, CA) Cobra® 600 SCARA (Selectively Compliant Arm for Robotic Assembly) arm and controller. The robot was readily available, had the positional accuracy and repeatability that met our specifications, had a mature programming environment, and allowed us to concentrate our efforts on the custom needs of our spotting system.
Manufacturing needs also demanded the development of separate temperature and climate control systems for the storage of biomolecules, the spotting and the optimal polymerization of the hydrogel, otherwise known as “curing”. Purchasing an available robot allowed us to use its specifications as an input into our design of these various environments and how the climates in each would be controlled.
The various environments do vary greatly from each other. We found that the hydrogel spots most consistently at a low of 65% RH (Relative Humidity) for one formulation and a high of 80% RH for another. The curing environment also changes in both temperature and RH from a colder 80% RH to a warmer 95% RH depending on the desired formulation. These changes in spotting environment and formulation do not greatly affect the time available for printing the gel in liquid form. This is controlled by storing the pre-mixed hydrogel and biomolecules in 384 well format just above 0°C, yielding approximately 25 to 30 minutes for printing before the gel becomes too viscous. Likewise the curing time is not greatly changed by the condition changes. We use a two hour post spotting curing time for best consistency for all formulations.
Another advantage of the Adept robot is its controller, which comes standard with dozens of input/output ports allowing easy control of any other actuators and monitoring sensors in our system. Adept's software links into standard Windows compatible communication protocols have allowed us to design an easy to use Visual Basic® (Microsoft) based set-up tool and will allow us to link the spotting system with an overall database that combines the functions of LIMS, MRP (Manufacturing Requirements Planning) and microarray design. As part of our attention to manufacturing needs, this entire system is run inside a class 10,000 (M5.5) modular clean-room.
MACHINE VISION AND REAL-TIME QC
Another advantage of Biocept's hydrogel platform is the ability to observe the 3D spots under certain lighting conditions using visible light, as shown in Figure 1. We have purchased the Adept robot with the available integrated machine vision. This system can simultaneously process images from up to 16 cameras and look for shapes, count objects or compare images to expected templates. This data can then be stored for later reference or used to update robot positioning or logic based on the results. By adjusting lighting conditions, these capabilities allow us to do a real-time QC check of every microarray without specialized optics. Various vision tools allow us to count the number of spots and their locations in the array. Our short-term goal is to combine this machine vision information with a barcode reader and bar-coded slides to fully track the spotting process. Long-term, we plan to capture this information into our LIMS/MRP database for statistical quality control methods.
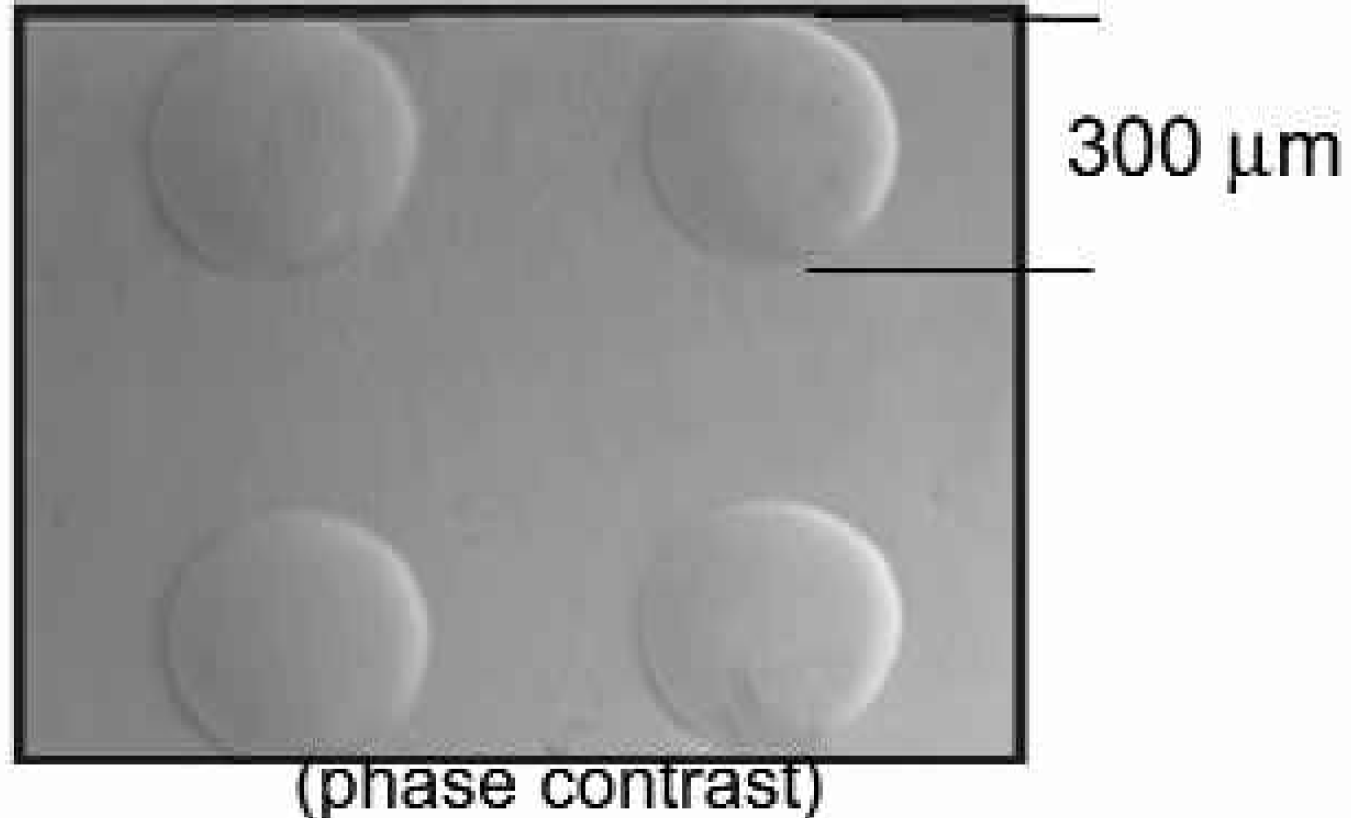
Phase Contrast Image of a 3D Hydrogel Microarray Sub-Grid. Four hydrogel spots representing a portion of a larger printed array were visualized by phase contrast illumination using a Leider inverted microscope (magnification 100X).
MEASURES OF THE CONSISTENCY OF SPOTTING
Part of the challenge of developing a new microarray platform is the determination of reliable metrics for the spotting process. We have picked such normal metrics as radius and area (size), intensity of Cy3 (a fluorescent dye) loaded spots and positional consistency. Not all software packages provide these measures, therefore, a custom image analysis application for that provided us with these quality control measures was developed. As stated above, the spot sizes vary between 300 and 400mm in diameter based on formulation and printing conditions. For the specific formulation and conditions, our QC tests have found 4% CV for the radii, not only within a print run, but from print-run to print-run as well. Spot volume consistency is measured indirectly by spotting straight Cy 3 dye with a linker in the gel and scanning the intensities with our ScanArray Lite (Packard Biochip, Billerica, MA). Volume also varies by formulation and conditions from 1.9 to 5.7nL, as mentioned above. For a specific desired formulation and method we have measured 10–12% CVs, also measured from print-run to print-run.
PRIOR TO PRINTING
Another of the advantages of our hydrogel chemistry is that all preparatory liquid handling, formatting and mixing can be accomplished using standard pipetting tools. We have standardized on the 384 well format for input into our printing systems. This format allows us the flexibility of readily achievable tolerance requirements in the design of our printing system and a wide choice of off-the-shelf automated liquid handling solutions. All biomolecules are dispensed and formatted for mixing with the hydrogel using a Packard Instruments MultiPROBE II HT liquid handling robot (Meriden, CT). Final mixing is done on a two arm Biomek FX liquid handling robot (Beckman Coulter, Fullerton, CA) with two 96 channel, disposable tip heads. This final mixing step both loads the hydrogel with the biomolecules to be printed and initiates the polymerization process.
APPLICATIONS DNA MICROARRAYS
The unique, three-dimensional nature of the hydrogel format allows a number of applications while preserving a near-native conformation of biomolecules. One of these applications is focused on the development of a DNA-based microarray for the study of gene expression across species. Probes homologous to the open reading frames of the genes of interest are spotted within the hydrogel and printed in a low density format. Fluorescently labeled copy DNA (cDNA), synthesized from messenger RNA, is then hybridized to the probes. After repeated rounds of washing under appropriate conditions to remove non-specifically bound or non-hybridized cDNA, the arrays are laser scanned. A fluorescent signal indicates binding of labeled cDNA to the printed probe and confirmation of expression of the gene to which that probe corresponds.
We have shown the utility of this technology in identifying differentially expressed genes among various biological tissues in addition to a dose-response with increasing target concentration. Figure 2 shows dose-related expression of a mouse gene on a sub grid of a Biocept DNA microarray. Increased fluorescence is observed as increased intensity of the spot with increasing hybridized target concentration. Figure 3 shows consistency of the hydrogel spots from five independent DNA microarrays with each probe printed in triplicate. Overall, the average of the coefficients of variation within this data set is 3.7%.
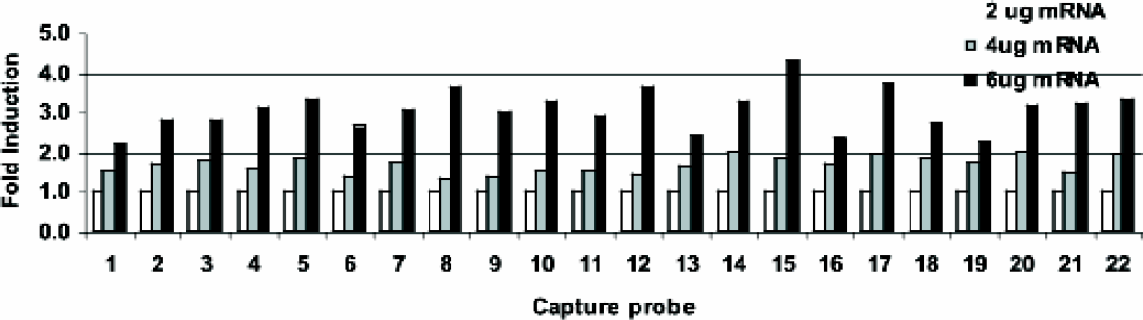
Dose Response of Mouse Heart mRNA. Two, four and six micrograms of mouse heart mRNA were reverse transcribed using Cy3 labeled random primers. The labeled cDNA was hybridized to Biocept mouse DNA microarrays printed onto glass slides. Slides were laser scanned (GSI ScanArray 4000) and analyzed using ArrayPro 4.0 software.
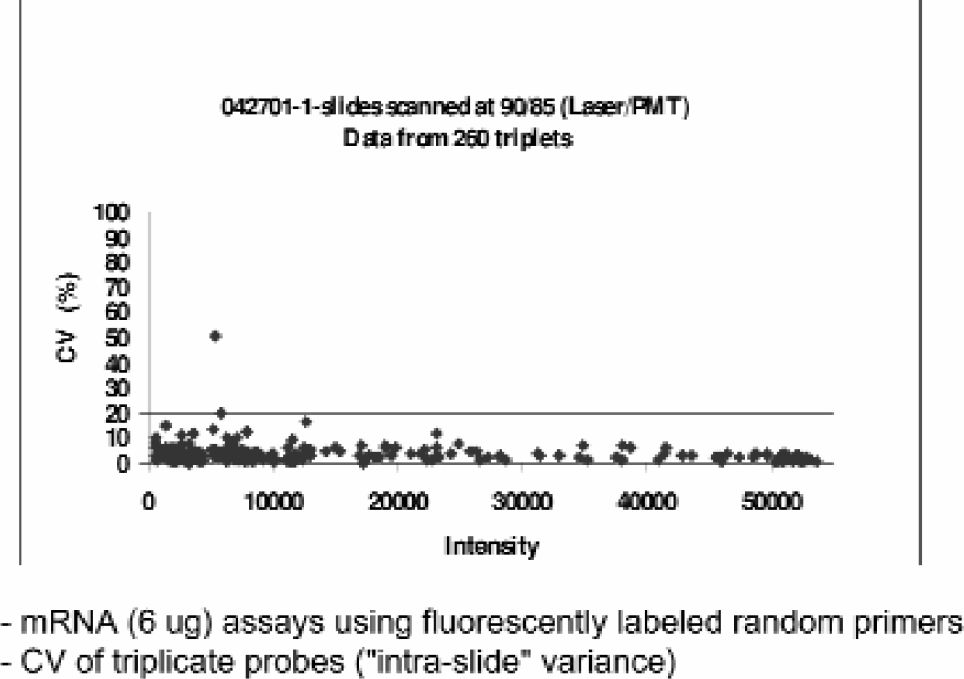
Pooled CV Plot from Biocept Mouse DNA Microarrays. Data represents 260 triplicate probes obtained from five independent, Biocept mouse microarrays. Individual CV values were calculated by dividing the standard deviation of each triplicate by the mean value of the triplicate then multiplying by 100 for each point.
The optimized formulation of the hydrogel for this application shows no apparent footprint shrinkage during curing or dehydration. Dehydration causes the spots to collapse some percentage in height. Figure 1 shows four dehydrated spots. Internal tests have confirmed that upon re-hydration during experimentation spots recover to very close to their original height.
This novel, hydrogel-based DNA microarray technology has a number of potential applications as a diagnostic tool. Among these uses are as a tool for identifying target genes for gene-targeted therapies or as a tool for furthering our understanding of genes involved in cell signaling pathways.
PROTEIN MICROARRAYS
Biocept's proprietary hydrogel formulation provides a flexible and biocompatible platform to immobilize proteins in active conformations. This leads to many new and exciting opportunities for microarray based applications.
1. Protein diffusion and molecular recognition
The porous nature of hydrogel allows diffusion of macromolecules while maintaining their bioactivity. Shown in Figure 4 is the diffusion of Alexa Fluor594 (excitation wavelength = 590 nm, emission wavelength = 610 nm) labeled anti-fluorescein (FITC, excitation wavelength = 495 nm, emission wavelength = 535 nm) antibody into a hydrogel containing bound FITC labeled protein. In the absence of FITC antibody, the fluorescence of FITC embedded in the hydrogel can be readily detected. Incubation of anti-FITC antibody leads to diffusion of the antibody into the gel spot and the interaction of the antibody with its cognate antigen (FITC) results in the fluorescence quench of FITC, thus the loss of FITC fluorescence. The presence of the anti-FITC antibody in the gel spot is further confirmed by the red fluorescence emitted by Alexa Fluor594 when excited at 590 nm.

Diffusion of Antibody and Specific Antigen-Antibody Interaction in 3D Hydrogel. (A) Schematic diagram of FITC and anti-FITC antibody interaction that results in FITC fluorescence quenching. (B) FITC and anti-FITC antibody visualized in 3D hydrogel spots imaged using a custom CCD-camera based assembly employing excitation and emission filters suitable for either FITC or Alexa Fluor594 dyes. Incubation of Alexa Fluor 594 labeled antibody with the FITC spot quenches FITC fluorescence (left side of Panel B at four hours). The quenched spot shows strong fluorescence from the labeled antibody (right side of Panel B at four hours)
We conclude that large proteins such as antibodies can diffuse into printed gel spots and perform normal biological functions, e.g., binding. This not only provides a method to detect the presence of various antigens associated with the gel spots, but also opens many possibilities for carrying out biochemical reactions in microarray format.
2. Protein-DNA interaction
In addition to antigen-antibody interaction, we have also investigated sequence specific protein-DNA interaction in printed hydrogel spots. Bacterial $lD repressor binding sequence OR2OR1 and its mutant carrying a single base mutation at the binding site (Figures 5A & 5B) are printed and hybridized to their corresponding complementary sequences. Binding of the Cy3 labeled $lD repressor to its native operon sequence results in the gain of fluorescent signal in the corresponding spots. The absence of a strong fluorescence in the mutant spots indicates that the interaction is sequence specific (Figure 5C). Comparison of the SYBR Gold (a double stranded DNA stain) stained fluorescence of the printed slides with the Cy3 fluorescence from $lD repressor confirms that it is the sequence specific $lD repressor-l operon interaction rather than non-specific protein binding to unevenly printed DNA that give rises to the Cy3 signal associated with the wild type OR2OR1 sequence.
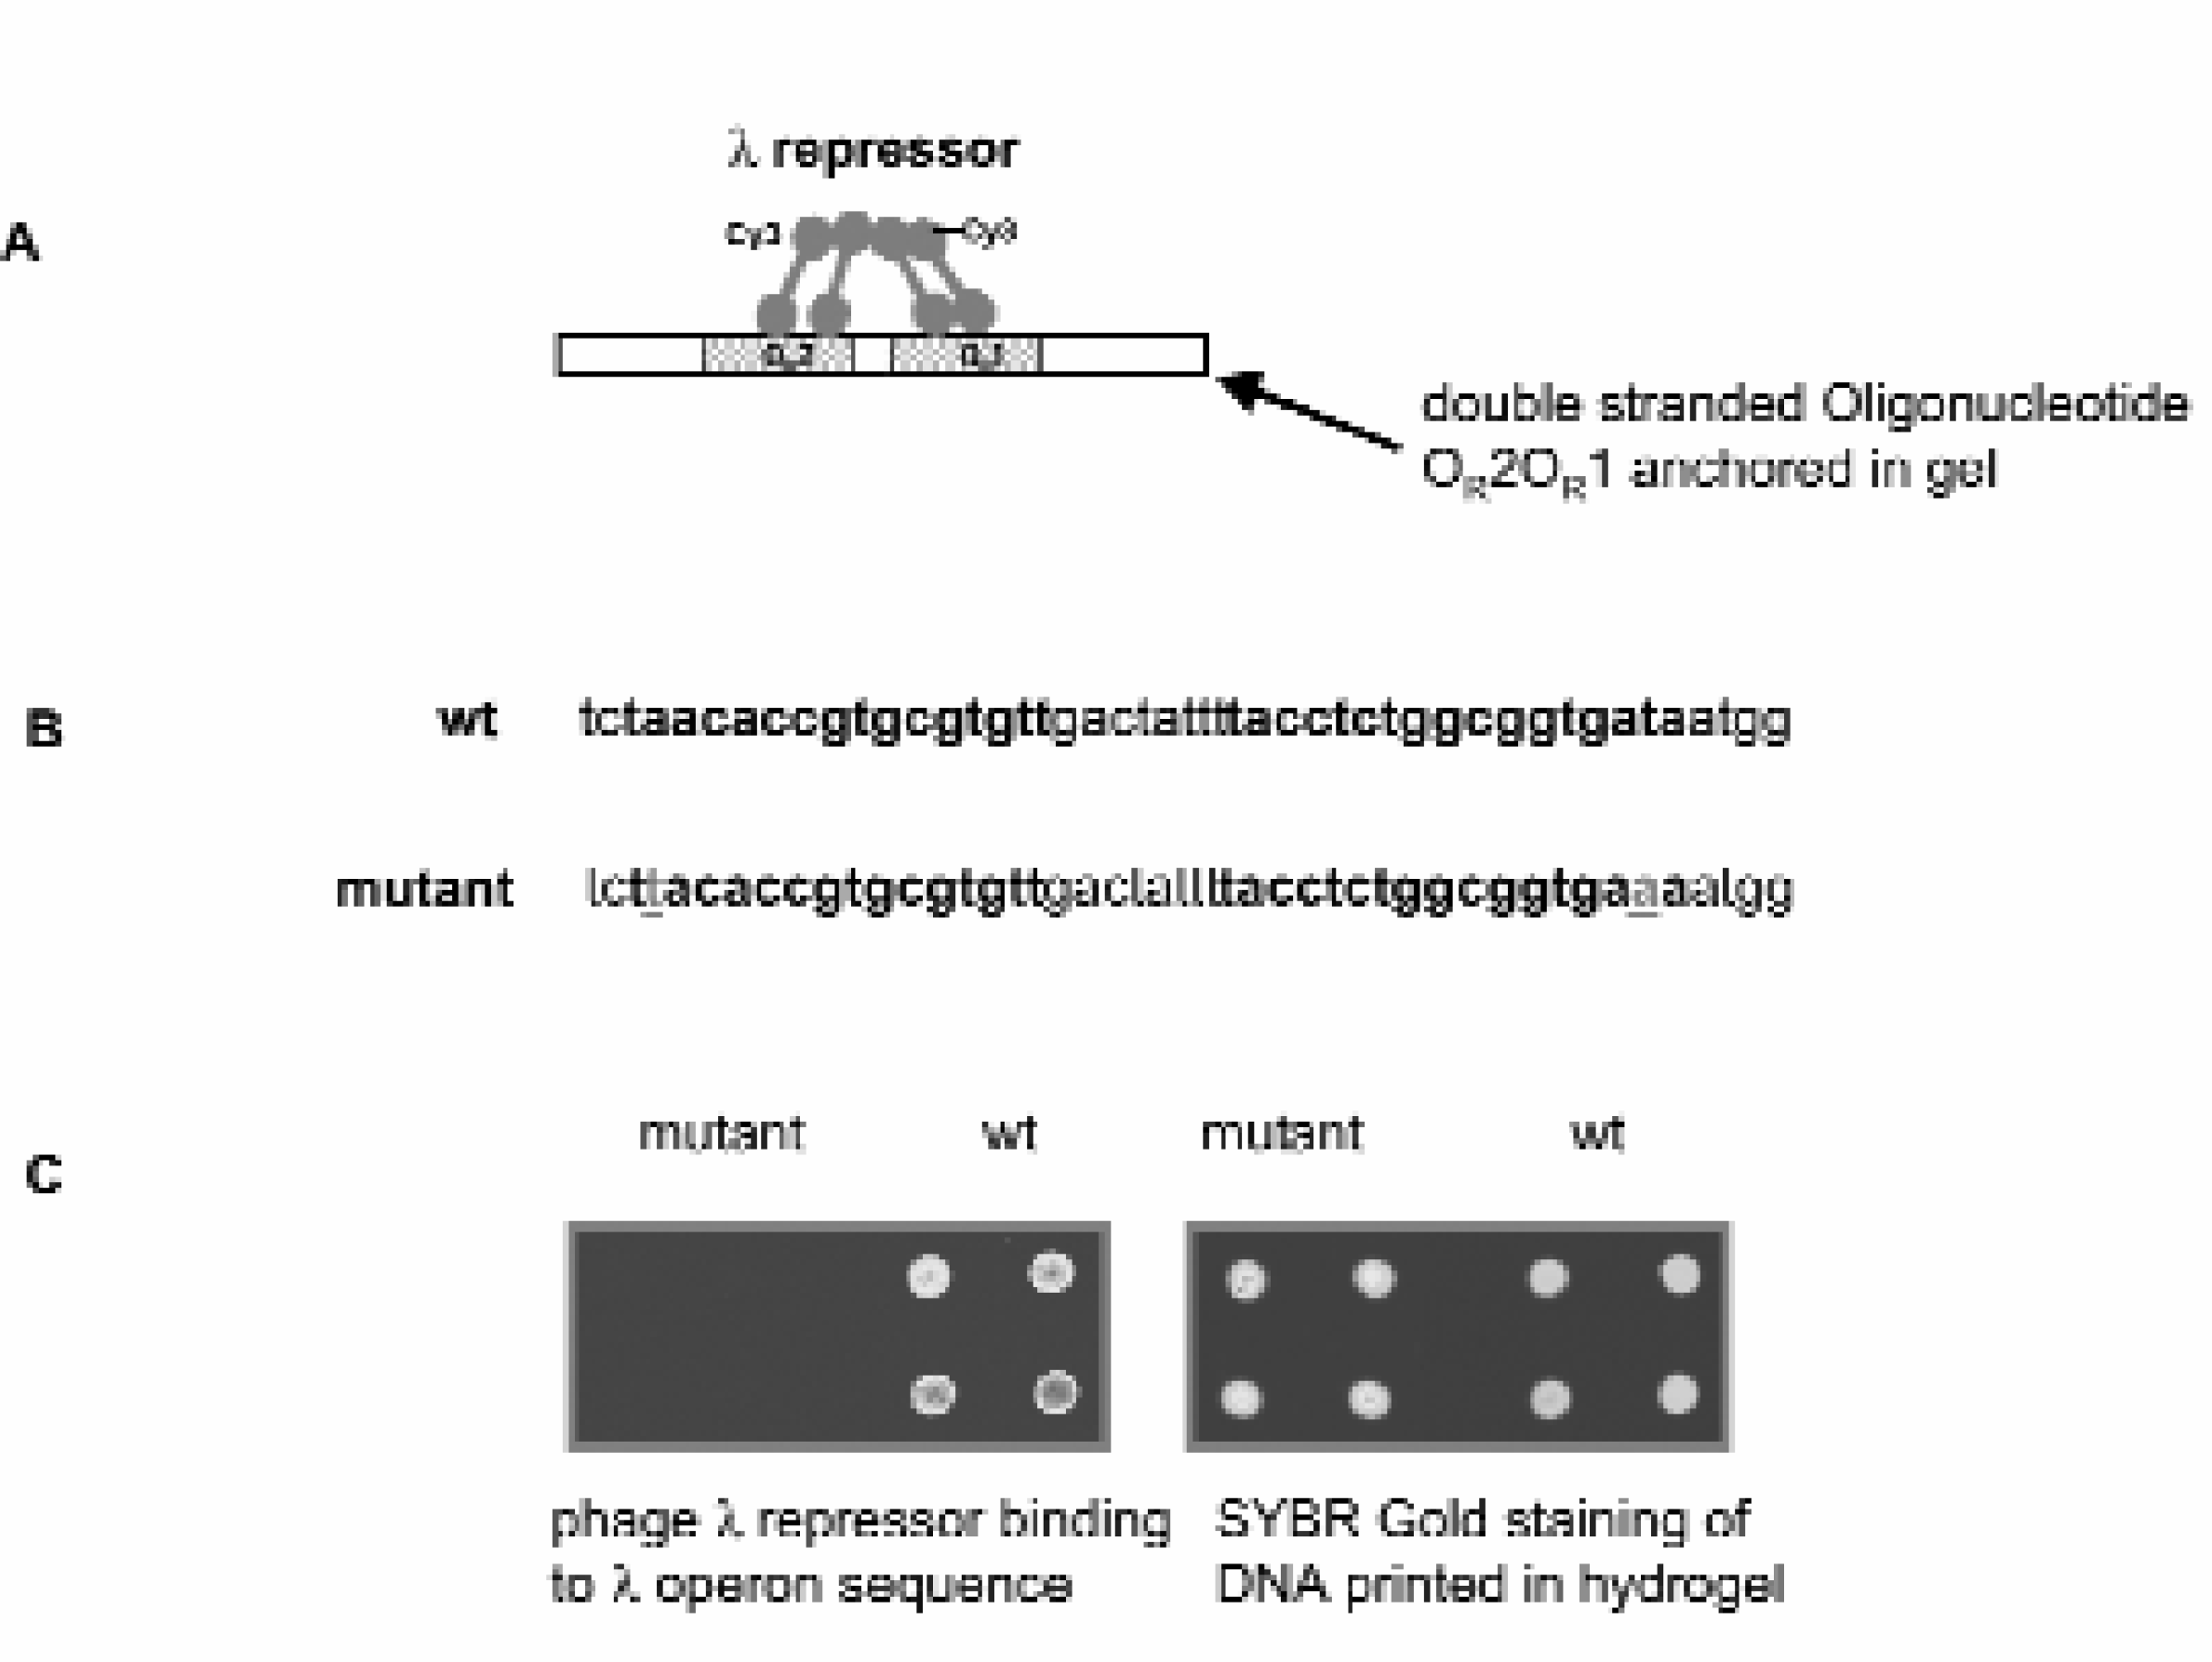
Sequence Specific Protein-DNA Recognition in 3D Hydrogel. (A) Schematic diagram of cooperative binding of $lD repressor to $lD operon sequence OR2OR1. (B) Sequences of wild type $lD OR2OR1 and its single point mutant at the $lD repressor binding sites. Sequences in bold fond are the $lD repressor binding sites, underlined bases are the point mutations. (C) Incubation of Cy3 labeled $lD repressor with printed slides only introduces Cy3 fluorescence to wild type sequence but not to mutant sequence. SYBR Gold staining of the printed slide shows that those spots containing the wild type sequence do not have higher DNA content than those with the mutant sequence.
We anticipate that double stranded DNA microarrays designed in various formats will have broad applications in studying protein-DNA interactions, including inhibitors/activators of sequence specific transcription factors, agonists or antagonists or transcription regulatory proteins, or synergy among transcription regulators. We also anticipate that double stranded DNA microarrays will be very effective substitutes for many tedious protein-DNA interaction assays currently used in the field, such as gel mobility shift assays, filter binding assays, etc.
3. Enzymatic Reactions
We have further extended the sequence specific protein-DNA interaction study to protein-DNA interactions associated with enzymatic activity. Oligonucleotide sequences containing restriction endonuclease enzyme BsrI or MspI sites are spotted on glass slides and hybridized to their Cy3 labeled complementary sequences. Digestion of these sequences by their corresponding enzymes releases the 5' end of the Cy3 labeled duplex, thus resulting in a loss of fluorescent signal (Figures 6B & 6D). As is evident in Figures 6A & 6C, upon incubation with the corresponding restriction enzymes, the fluorescent signal from both sequences are reduced to 29 or 47% of the control level. This indicates that our 3D gel array system is compatible with the enzymatic activities tested. We are in the process of expanding this application to other solid phase based enzymatic assays and to a higher density array format.
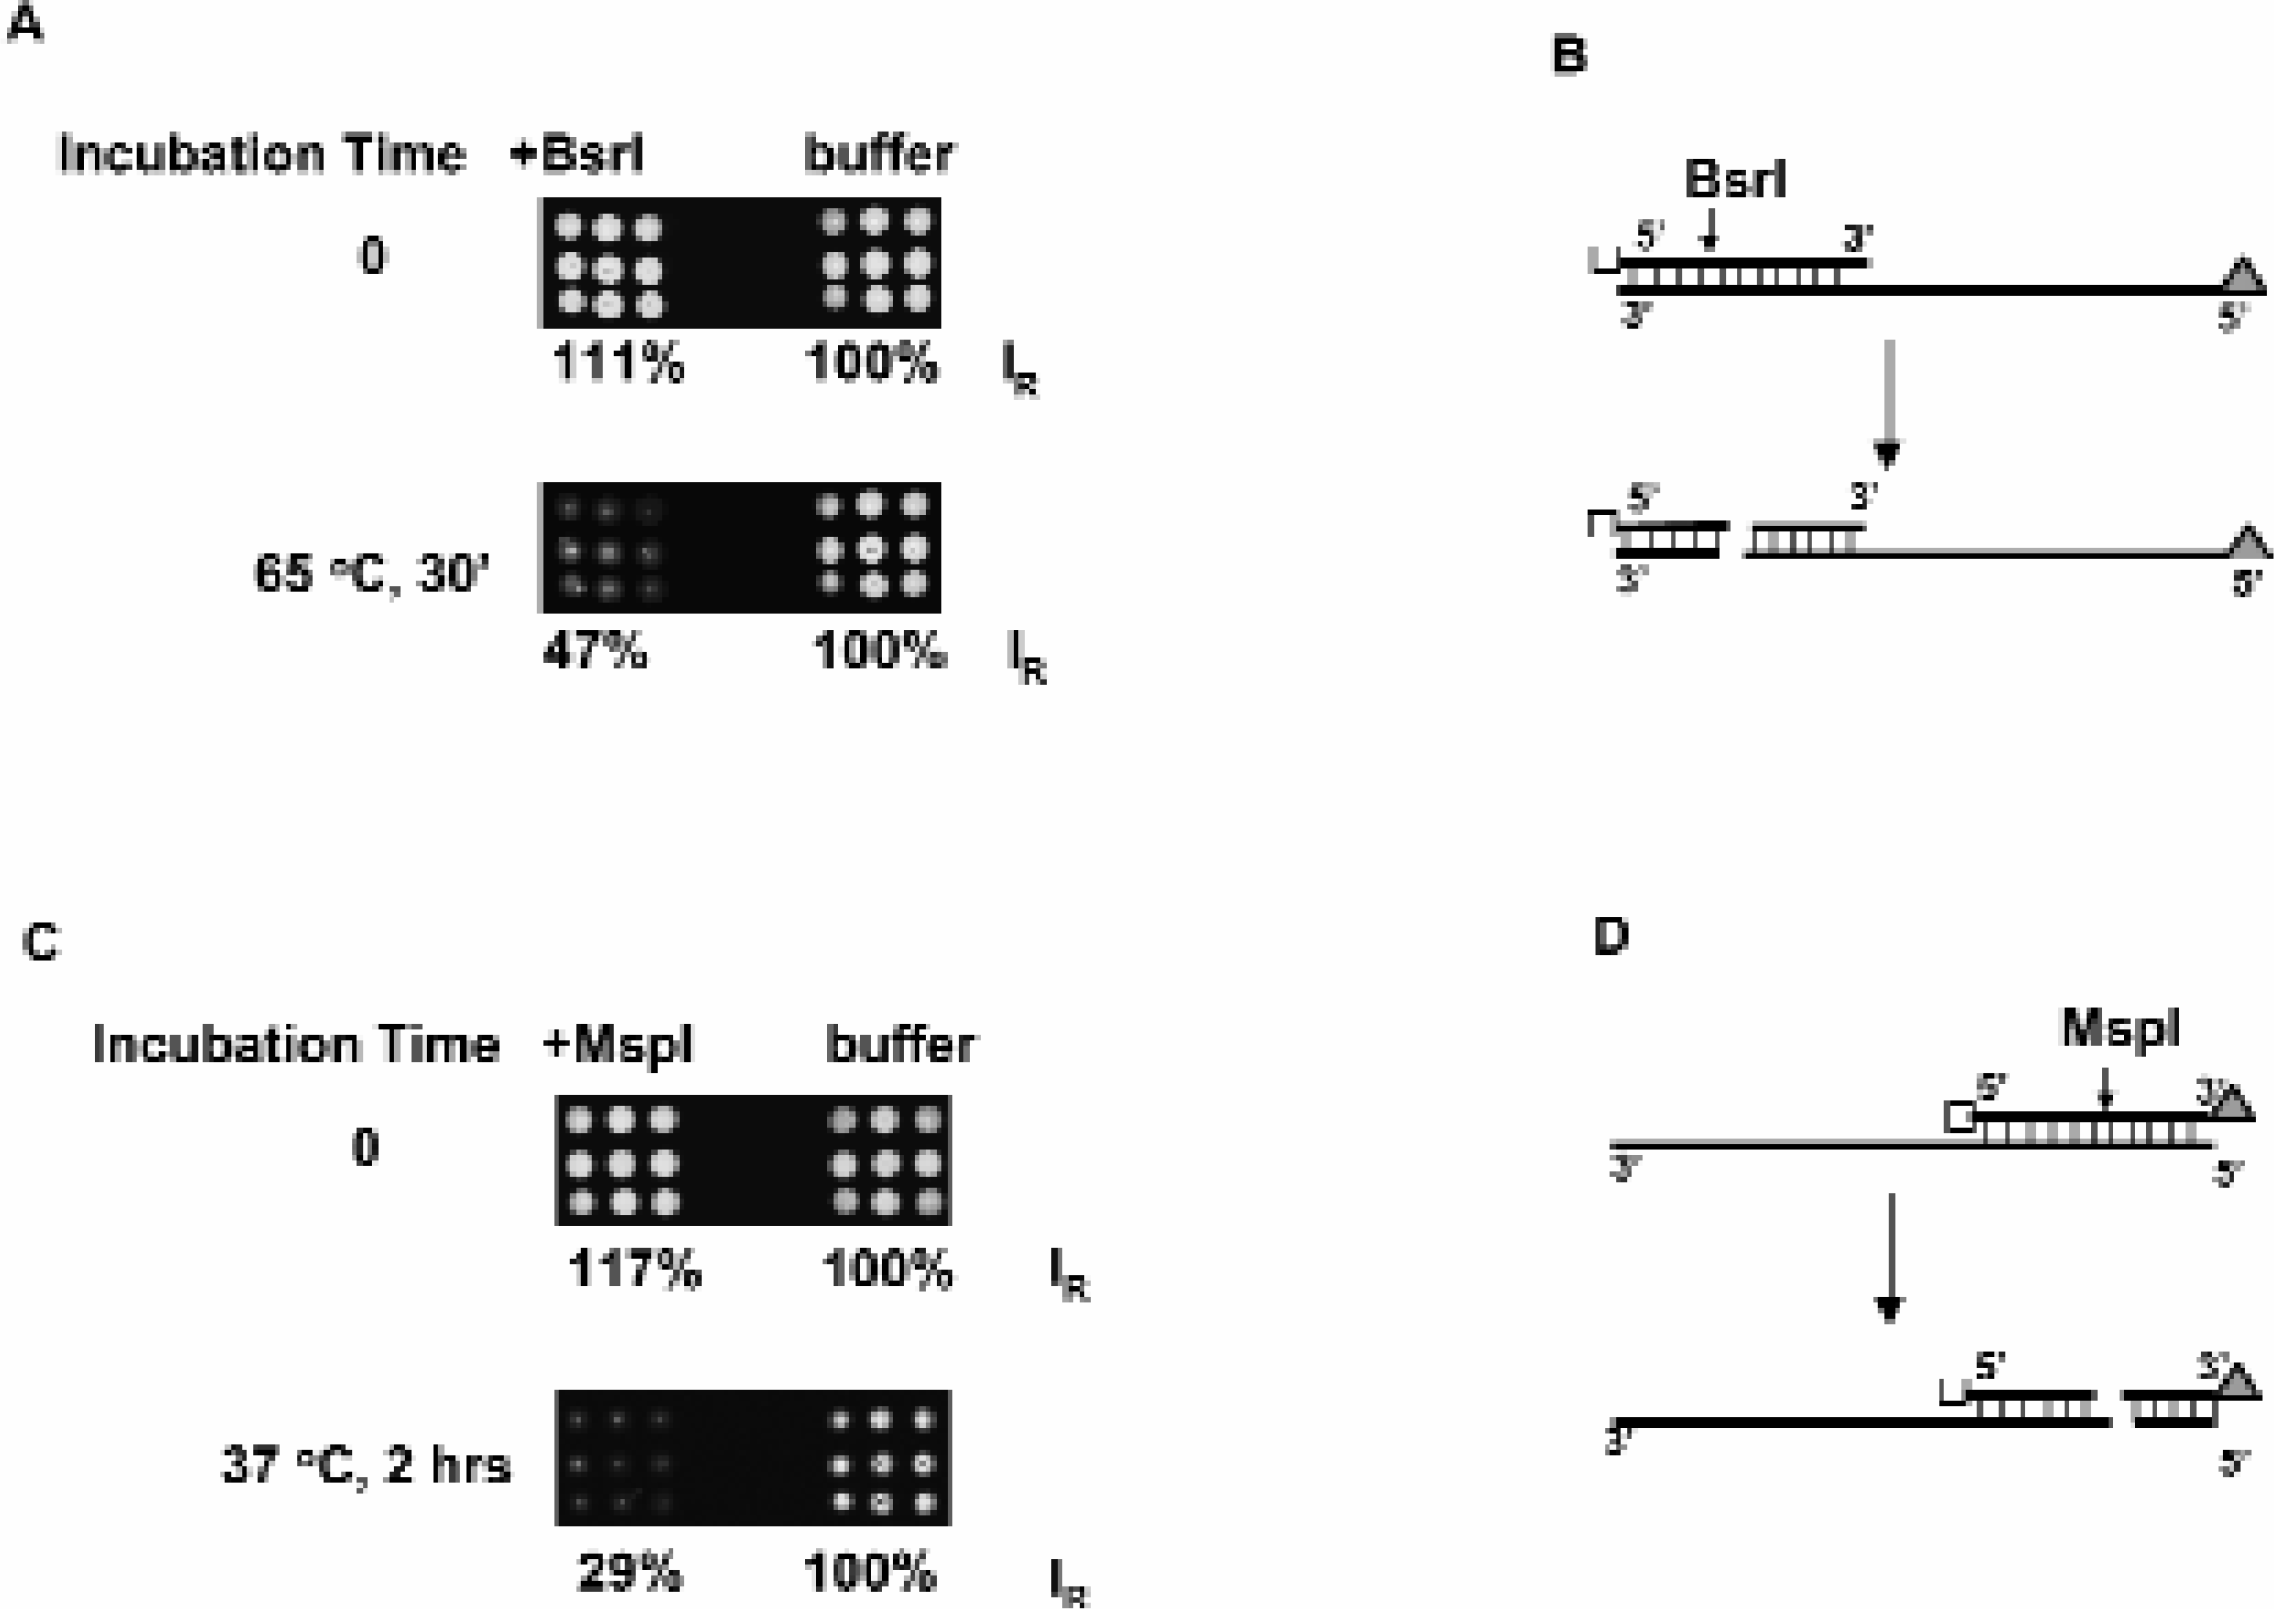
Hydrogel Compatibility with Enzymatic Activity. Panels (A), (C) Shown is the loss of Cy3 fluorescence associated with the double stranded DNA in hydrogel gel upon restriction enzyme digestion. Panels (B), (D) Schematic diagram of restriction endonuclease BsrI and MspI cutting sites and the resulting fragments. IR: relative fluorescence intensity. Empty square: anchoring site for the DNA. Triangle tag: Cy3 label.
CONCLUSIONS
Our studies show that polyethylene glycol based 3D hydrogel microarrays have many advantages with regards to the quality of the data obtained as well as with the 3D hydrogel's flexibility, and the broad spectrum of applications possible. These results are achieved using a mix of off-the-shelf automation in a custom integrated system with multi-zone environmental control.